Article

An Integrated Approach for Studying the Hydrology of the Ljubljansko Polje Aquifer in Slovenia and Its Simulation

1
Department of Geography, Ludwig-Maximilians-Universität-München, Luisenstraße, 37, 80333 Munich, Germany
2
Jožef Stefan International Postgraduate School, Jamova cesta 39, 1000 Ljubljana, Slovenia
3
Department of Geotechnology, Mining and Environment, University of Ljubljana, Aškerčeva cesta 12, 1000 Ljubljana, Slovenia
4
Department of Environmental Sciences, Jožef Stefan Institute, Jamova cesta 39, 1000 Ljubljana, Slovenia
*
Author to whom correspondence should be addressed.
Water 2019, 11(9), 1753; https://doi.org/10.3390/w11091753
Submission received: 22 July 2019 / Revised: 14 August 2019 / Accepted: 17 August 2019 / Published: 22 August 2019
(This article belongs to the Special Issue Groundwater-Surface Water Interactions)

Abstract

:
Groundwater and surface water are strongly connected. Therefore, understanding their interactions is important when studying the water balance of a complex aquatic system. This paper aims to present an integrated approach to study such processes, including a better understanding of the hydrological system behavior in the Ljubljansko polje (Slovenia). The study is based on multivariate statistical analyses of data collected over a long period, including the isotopic composition of groundwater, river water, and precipitation. The hydrology in the study domain was also simulated using a comprehensive modelling framework. Since boundary conditions are essential for simulating groundwater flow in a sensitive aquifer, a modelling system of rivers and channels (MIKE 11) and water flow and balance simulation model (WaSiM) were used to model river dynamics and the percolation of local precipitation, respectively. The results were then used as boundary conditions imposed on a transient state groundwater flow model performed in finite element subsurface flow simulation system (FEFLOW 6.2). Both the locations of recharge areas in the study domain and the calculated fluxes between the Sava River and the aquifer are graphically presented. The study revealed that a combination of the MIKE 11-FEFLOW-WaSiM tools offers a good solution for performing parallel simulations of groundwater and surface water dynamics.

1. Introduction

The European Union (EU) has attempted to add to the limited knowledge of the dynamic processes that connect surface water and groundwater [1]. The European Water Framework Directive and the related River Basin Management Plans for the period 2015–2021 and beyond, require, if needed, remedial measures to ensure a good groundwater chemical and quantitative status and prevent the deterioration of the status of all surface water and groundwater bodies. To achieve these aims, the EU encourages significant research activities aimed at improving our understanding of the complex water cycle, including the following: groundwater interactions at sensitive interfaces, identifying percolation areas and other sources of groundwater recharge, and the vulnerability of groundwater to different contaminants.
This paper presents a novel approach for simulating groundwater behavior at the reach-scale using multi-tools, in a system where surface-groundwater interactions are significant. For this purpose, FEFLOW was directly coupled with MIKE 11, and an indirect communication link between FEFLOW and WaSiM was established. Typically, the direct coupling means that models affect each other, but this is not the case for indirectly coupled models. Combining several tools is challenging because the behavior of a complex system cannot be expressed as the sum of its components or subsystems [2]. Unlike FEFLOW has been coupled with MIKE 11 many times [3,4], coupling FEFLOW to WaSiM is rarely reported in the literature [5], and, according to the authors’ knowledge, this is the first study to include all three models.
An overview of other available modeling tools in hydrology is provided by Gunduz and Aral [6] as well as Barthel and Banzhaf [7]. Both publications report the limitations of existing modeling approaches, due to their diverse applications, complexity level, and local, regional, or even global geological, hydrological, and climatic characteristics in 2-dimensional or 3-dimensional space over different periods.
Krause and Bronstert [8] coupled WaSiM with MODFLOW to simulate groundwater-surface water interactions in North-eastern Germany. MODFLOW, which is often used in groundwater-focused studies [7], was also coupled with other models such as SWAT [9], LISFLOOD [10], and HEC-RAS [11]. Two examples of groundwater-focused modeling approaches that use FEFLOW were applied in the Zayandeh Rud catchment in Iran and in Covey Hill in Canada, where FEFLOW was coupled with SWAT and the Hydrological Evaluation of Landfill Performance (HELP), respectively [12,13]. Groundwater recharge through rainfall in Slovenia and the Far-North region of Cameroon was simulated with GROWA [14,15]. Lastly, the MODHMS surface water flow package (HydroGeoLogic, Inc., Reston, VA, USA) for MODFLOW, was used to model surface water-groundwater interactions [6].
Processes that occur at the interface between surface water and groundwater can dominate a system’s evolution [2]. For this reason, fluxes between groundwater and surface water bodies, which are difficult to measure, have been the subject of local-scale and regional-scale studies [16,17,18,19]. This study is different because it deals exclusively with the connections between the river water level, percolation from local precipitation, and groundwater in an alluvial aquifer with an intergranular porosity. The Ljubljansko polje, located within the Sava River Basin (SRB), is ideal for testing such an approach since it is highly sensitive to changes in its two main groundwater sources: the Sava River water and local precipitation [20,21]. Understanding the hydrology of the Ljubljansko polje aquifer system is also important for local inhabitants because it represents the main source of drinking water.

2. Materials and Methods

2.1. The Ljubljansko Polje

The Ljubljansko polje is a ~71 km2 basin located between latitudes 46.12° N, 46.08° N, and longitudes 14.43° E and 14.64° E in Central Slovenia (Figure 1). Its elevation ranges from 259.5 to 327.5 m and is separated from its adjacent geographic units (the Kamniško-Bistriško polje, the Kranjsko Sorško polje, and the Ljubljansko barje), by hills up to 450 m in height. The Sava River is the main river that flows in the basin together with its three main tributaries: the Ljubljanica, the Kamniška Bistrica, and the Gameljščica rivers.
The basin is filled with alluvial sediments with an intergranular porosity–Pleistocene and Holocene gravel, which may also contain silt and sand, with conglomerate lenses. Layers of clay or clay with gravel-stone are located only at specific locations, mainly in the southwestern part of the basin [22]. The sediments extend from a depth of 100 m in the central part of the basin to the surface (Šentjakob, Črnuče, Tacen and surrounding hills), where the impermeable bedrock outcrops.
Local precipitation, leaching water from the Sava River, and the lateral underground inflows from neighboring groundwater bodies are the main sources of groundwater in the Ljubljansko polje aquifer [20,23,24]. The Ljubljansko polje is a small depression surrounded by impermeable bedrock outcrops, and it can be assumed that underground interactions of the system with neighboring groundwater bodies do not exist along its lateral boundary. Exceptions are narrow sections where bedrock sinks deeper under the surface, which enables underground interactions of the aquifer with the neighboring groundwater bodies. Although the underground interaction between the Ljubljansko polje and the Ljubljansko Barje is evident from the carbonate characteristics of the groundwater (Ca/Mg molar ratio), it has not been quantified [23].
A significant loss of groundwater occurs through water extraction, and, in addition to the Pivovarna Laško Union d.o.o. brewery, which extracts the groundwater, there are four pumping stations located at Kleče, Jarški prod, Hrastje, and Šentvid (Figure 2). Multivariate statistical methods were used as a basis for the conceptual model [20] to compare geochemical data with long-term datasets (precipitation levels, river discharge, hydraulic head, and groundwater pumping rate). The present hydrological model determines the upper boundary conditions of the two main groundwater sources: percolation and river water leaching, which differentiates it from the existing hydrological models that have been developed for the Ljubljansko polje [25,26].

2.2. Database

Hydraulic Head. Daily and monthly hydraulic head values from 52 and 25 piezometers, respectively, were provided by Javno podjetje VODOVOD KANALIZACIJA SNAGA (VOKA; URL: http://www.vo-ka.si). The observed hydraulic head was from 260.47 m to 299.08 m a.s.l. Only those piezometers with daily data and minimal gaps of available data were used in the simulation (Figure S1 in the supplementary material shows data availability). Locations of the piezometers are shown in Figure 2.
Groundwater Pumping. Daily rates of groundwater abstractions from the 32 wells for all four pumping stations were obtained from VOKA (Figure 2). Kleče is the main pumping station and produced five times more groundwater (53.0 L s−1) than the other pumping stations during the study period (2010–2011).
River Discharge. Discharges observed in the Sava, and the Ljubljanica Rivers were used to simulate the spatially-explicit percolation (WaSiM model), while only the Sava River discharge was used in the transient state groundwater flow model (MIKE 11 and FEFLOW). The Ljubljanica River represented 20% to 30% of the Sava River discharge in 2010 and 2011 when the recorded discharge in the Sava River was 1021.66 m3 s−1 but was not included in the groundwater flow model (GW flow model) because of its negligible effect on the aquifer due to the presence of a clogging layer [24]. The Sava River water level is the required input data for the steady-state groundwater model, and the data was obtained from Slovenian Environmental Agency (ARSO; URL: http://www.arso.gov.si) [27].
Underground Recharge/Discharge. The amounts of subsurface groundwater recharge/discharge were estimated during the calibration process of the steady-state GW flow model in FEFLOW.
Mean Residence Time (MRT). An estimation of MRT was made using the 3H/3He method for water samples collected on the 01.06.2010 at Kleče 8, Kleče 11, Kleče 12, Hrastje 3, Hrastje 8, Jarški prod 1, and Jarški prod 3 [20] (Table 3). It was not possible to estimate the MRT for Kleče due to the presence of “old” water. For this reason, the MRTs for Hrastje, and Jarški prod were used to calibrate the steady-state GW flow model.
Meteorological Data. Daily temperature (°C), precipitation (mm), global radiation (Wh m−2), humidity (–), and wind speed (m s−1) were obtained from ARSO for the period between 2003 to 2015 [28]. The inverse distance weighting (IDW) interpolation method was used for the horizontal interpolation of the meteorological data [29].
A significant flood event affected many urban areas in Slovenia in September 2010, including the southern part of the city Ljubljana, which belongs to the Ljubljansko Barje. An extremely high Sava River discharge, with a return period estimated at 10 years was also observed in Medno and Šentjakob [30]. The only year with a recorded higher precipitation than 2010 (1784 mm) was 1965 (1848 mm). In contrast, the lowest amount of precipitation (998 mm) was recorded in 2011 [31].
Soil Map. A precise soil texture map was provided by the TIS/ICPVO-Infrastructural Center for Pedology and Environmental Protection, Biotechnical Faculty, University of Ljubljana, Ljubljana 1999–2016 (URL: http://www.bf.uni-lj.si). Unfortunately, the soil texture type could not be defined in the built-up areas, which represents 39.60% of the study domain (artificial area in Table 1). Literature data for central Europe were used for model parameterization of the soil texture classes (Table 1) [32,33,34].
Land Use Map. Land use data for the Slovenian part of the Sava River basin was taken from the CORINE Land Cover database (CLC2006) [35]. The original data have a spatial resolution of 25 m, which were downscaled to a resolution of 50 m for the Ljubljansko polje. Table 2 gives the land use classes for the Ljubljansko polje and is a combination of 2-level and 3-level in the CLC’s 3-level hierarchical classification system.
Digital Elevation Model (DEM). The DEM at a spatial resolution of 5 m (YXZ format) was obtained from the Surveying and Mapping Authority of the Republic of Slovenia (URL: http://www.gu.gov.si/en/). The DEM was downscaled to a resolution of 50 m for the WaSiM model. LiDAR (light detection and ranging) data for the floodplain of the Sava River in the Ljubljansko polje were obtained from Savske elektrarne Ljubljana d.o.o. (URL: http://www.sel.si).
The River Channel Cross-sections. The Sava River channel cross-sections were measured in 2007, 2010, and 2013. Sixty-three cross-sections were used in the MIKE 11 and FEFLOW models (Figure 2). The data (KOO format) was obtained from the Municipality of Ljubljana (URL: https://www.ljubljana.si).
A Counter Map of the Bedrock in the Ljubljansko Polje was obtained from VOKA, which had been prepared by local hydrologists. However, the map was updated and extended with information obtained from the latest drilling reports (115 in total), which were provided by VOKA and the Pivovarna Laško Union d.o.o. (URL: www.pivovarnalaskounion.si).

2.3. Data Quality Control

Any uncertainty in the hydro-chronological data, which appears due to a combination of measurement error, systematic error, natural variation, and inherent randomness [36], have been removed from the database by using the following methods.
  • Before applying multivariate statistical analysis, the database was reduced in size using linear correlation. The 47 piezometers, where the hydraulic heads were measured (2003–2015), were divided into five groups. Each group included piezometers with high correlation coefficients, R2 ≥ 0.95, due to similar patterns of hydraulic heads. These groups also have specific locations in the Ljubljansko polje (Figure 2). Only one piezometer from each group, with minimal data gaps in their sets, were selected as being representative and used for data analyses.
    Due to the high correlation (R2 > 0.99) between the Sava River discharges observed at the three gauging stations, located at short distances from one another (~6.5 km), only discharges measured in Šentjakob were analyzed. The analysis also includes the Ljubljanica River discharge. Precipitation, which was recorded at the meteorological station in Ljubljana (Bežigrad, Figure 2), does not correlate with the discharges of the Sava and the Ljubljanica Rivers due to the remoteness of their springs where different climate conditions prevail.
  • Those piezometers, in which significantly different elevations of hydraulic heads from the majority of the piezometers were recorded, were excluded from the database (Figure S2).

2.4. System Responsiveness

Groundwater responsiveness to the Sava River discharge (river events) or local precipitation (precipitation events) was estimated using the moving window method. The method was used to cross-correlate the hydraulic heads, local precipitation levels, and river discharge. In this method, a defined time “window” (30 days) is moved over the daily data-set obtained for 2003–2015, where the distance moved is equal to the width of the “window.” All data located within the “window” are statistically summarized [37].

2.5. Modeling Tools

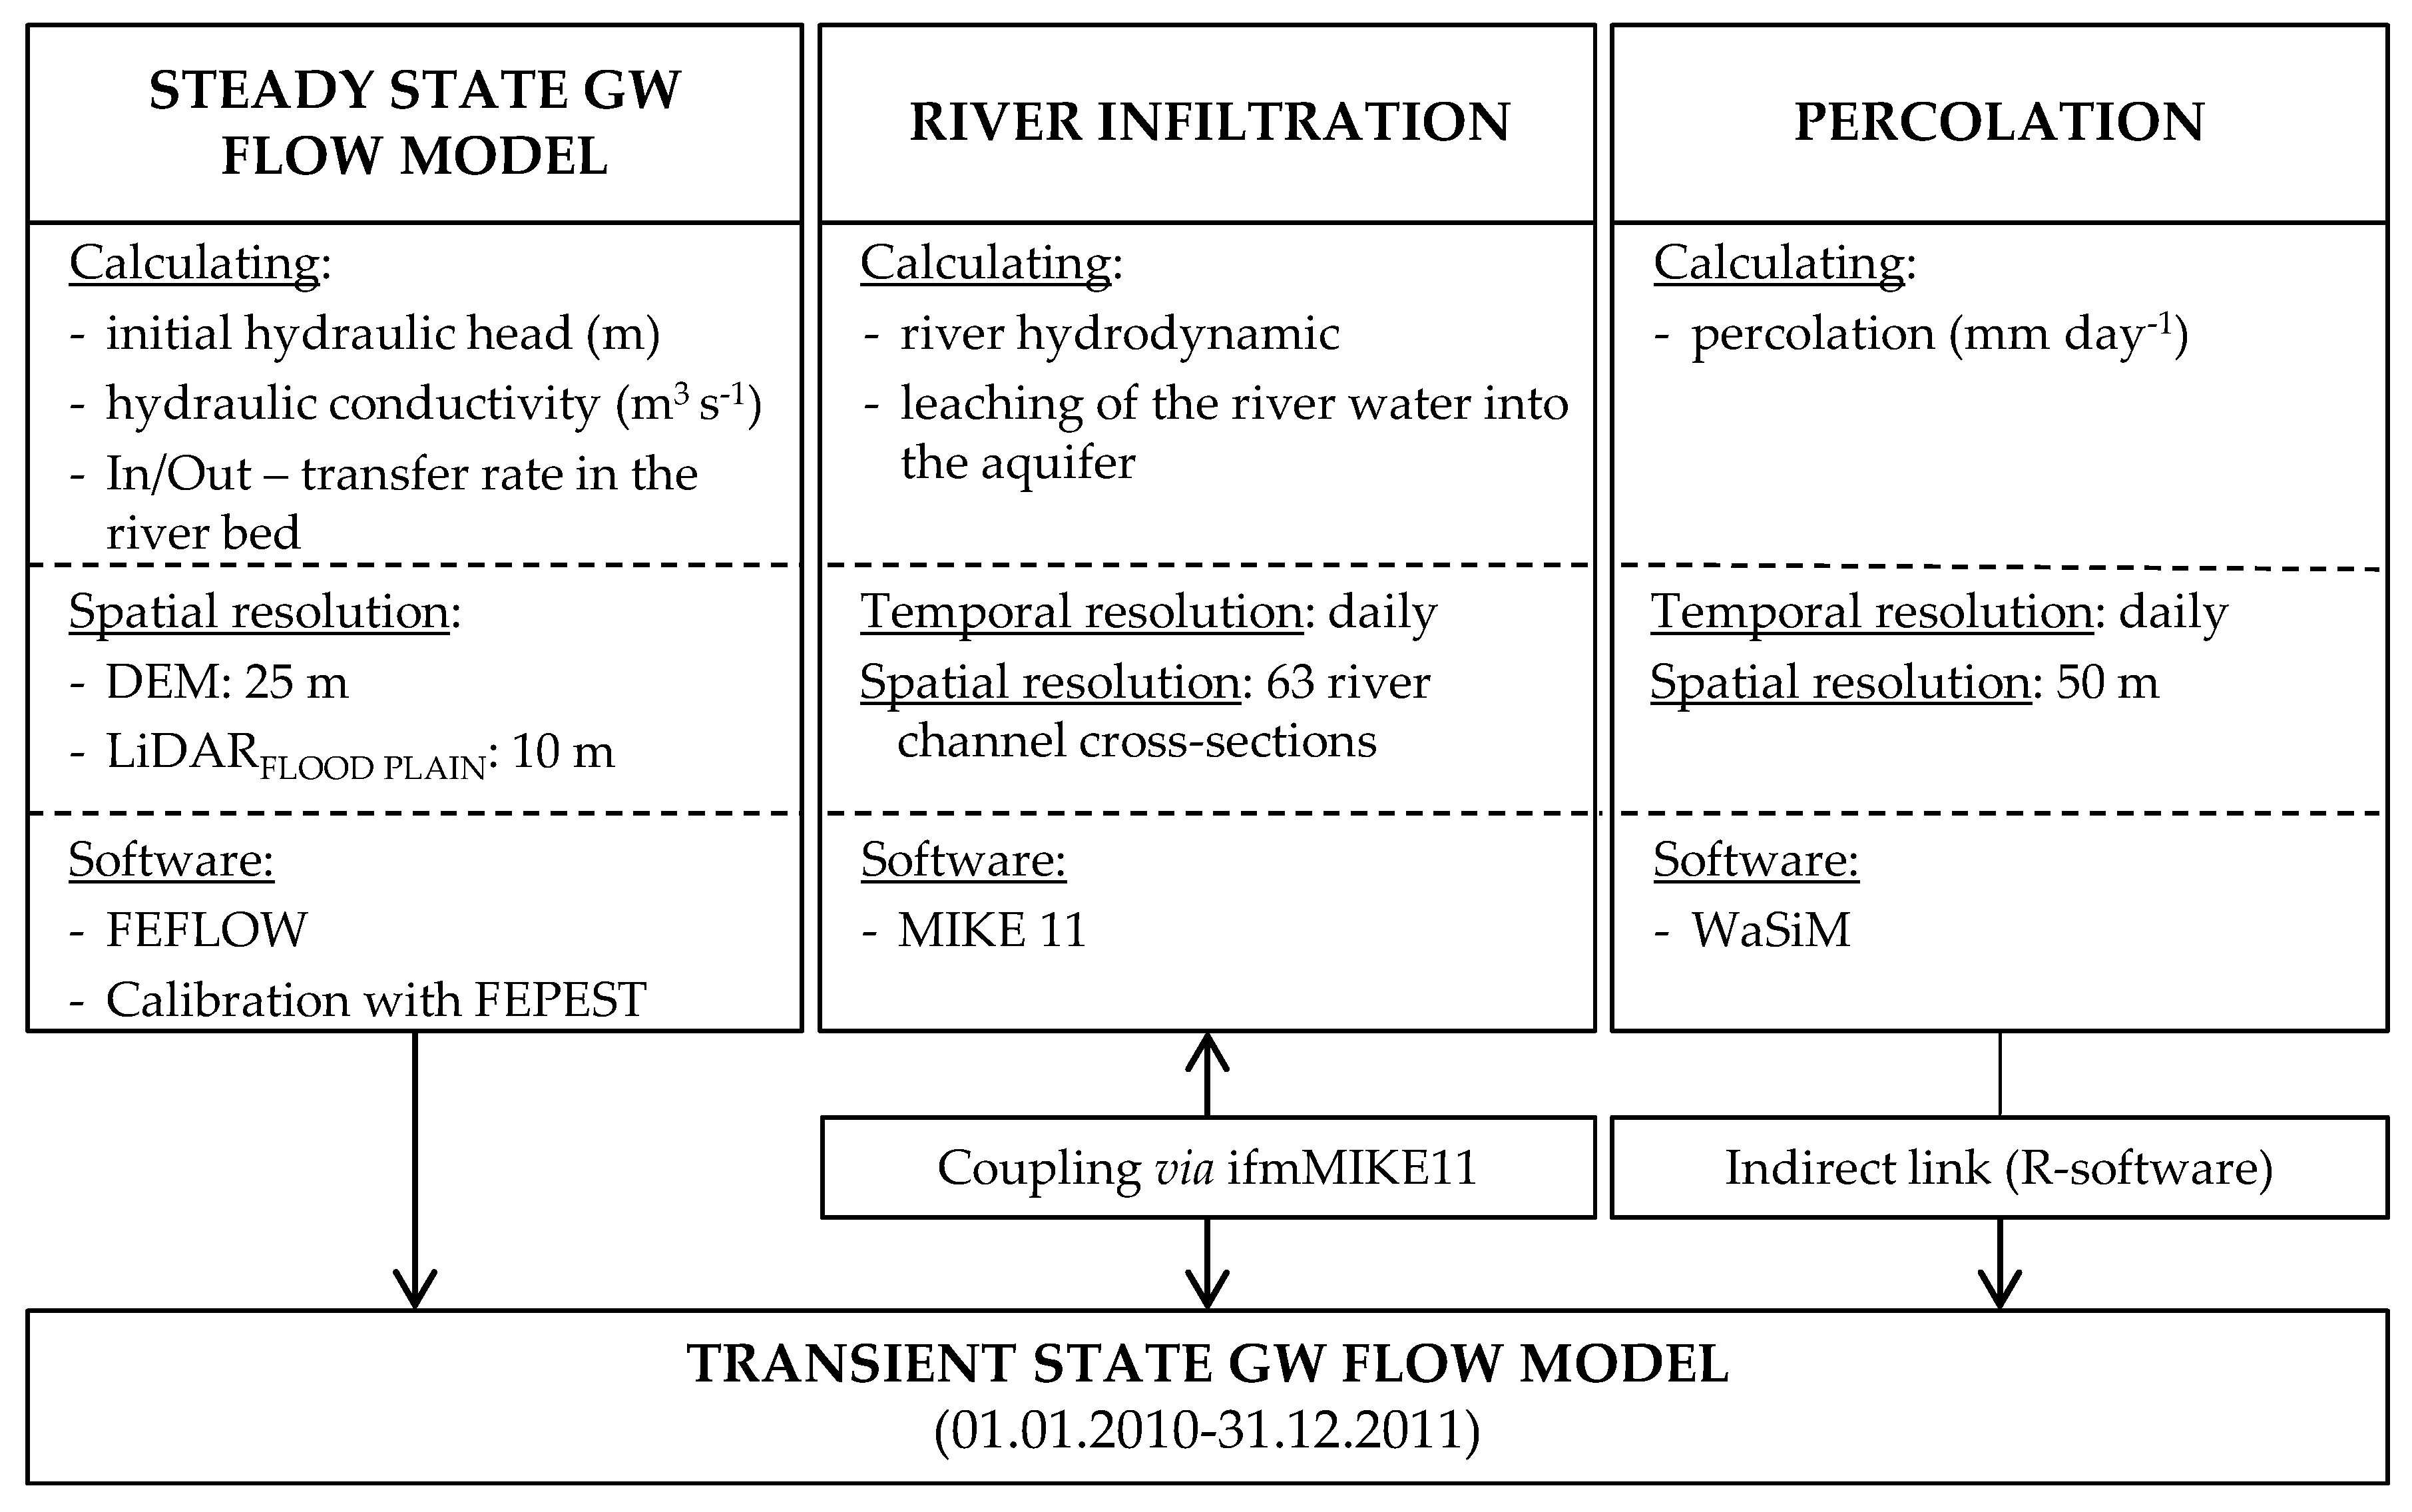
Figure 3 shows the tools used in this study. Detailed descriptions of their setups, calibrations, and validations are provided in this chapter.

2.5.1. WaSiM

Percolation of local precipitation was simulated using the physically-based fully distributed hydrological model–Water Flow and Balance Simulation Model (WaSiM; URL: http://www.wasim.ch/en/). Depending on the general availability of data and the hydrological problem to be solved, several algorithms designed for simulating specific processes on various temporal and spatial scales are available. In addition, WaSiM uses the ASCII format, which allows easier and more optimal data exchange with other software packages [29].

2.5.1.1. Setting Up the WaSiM Model

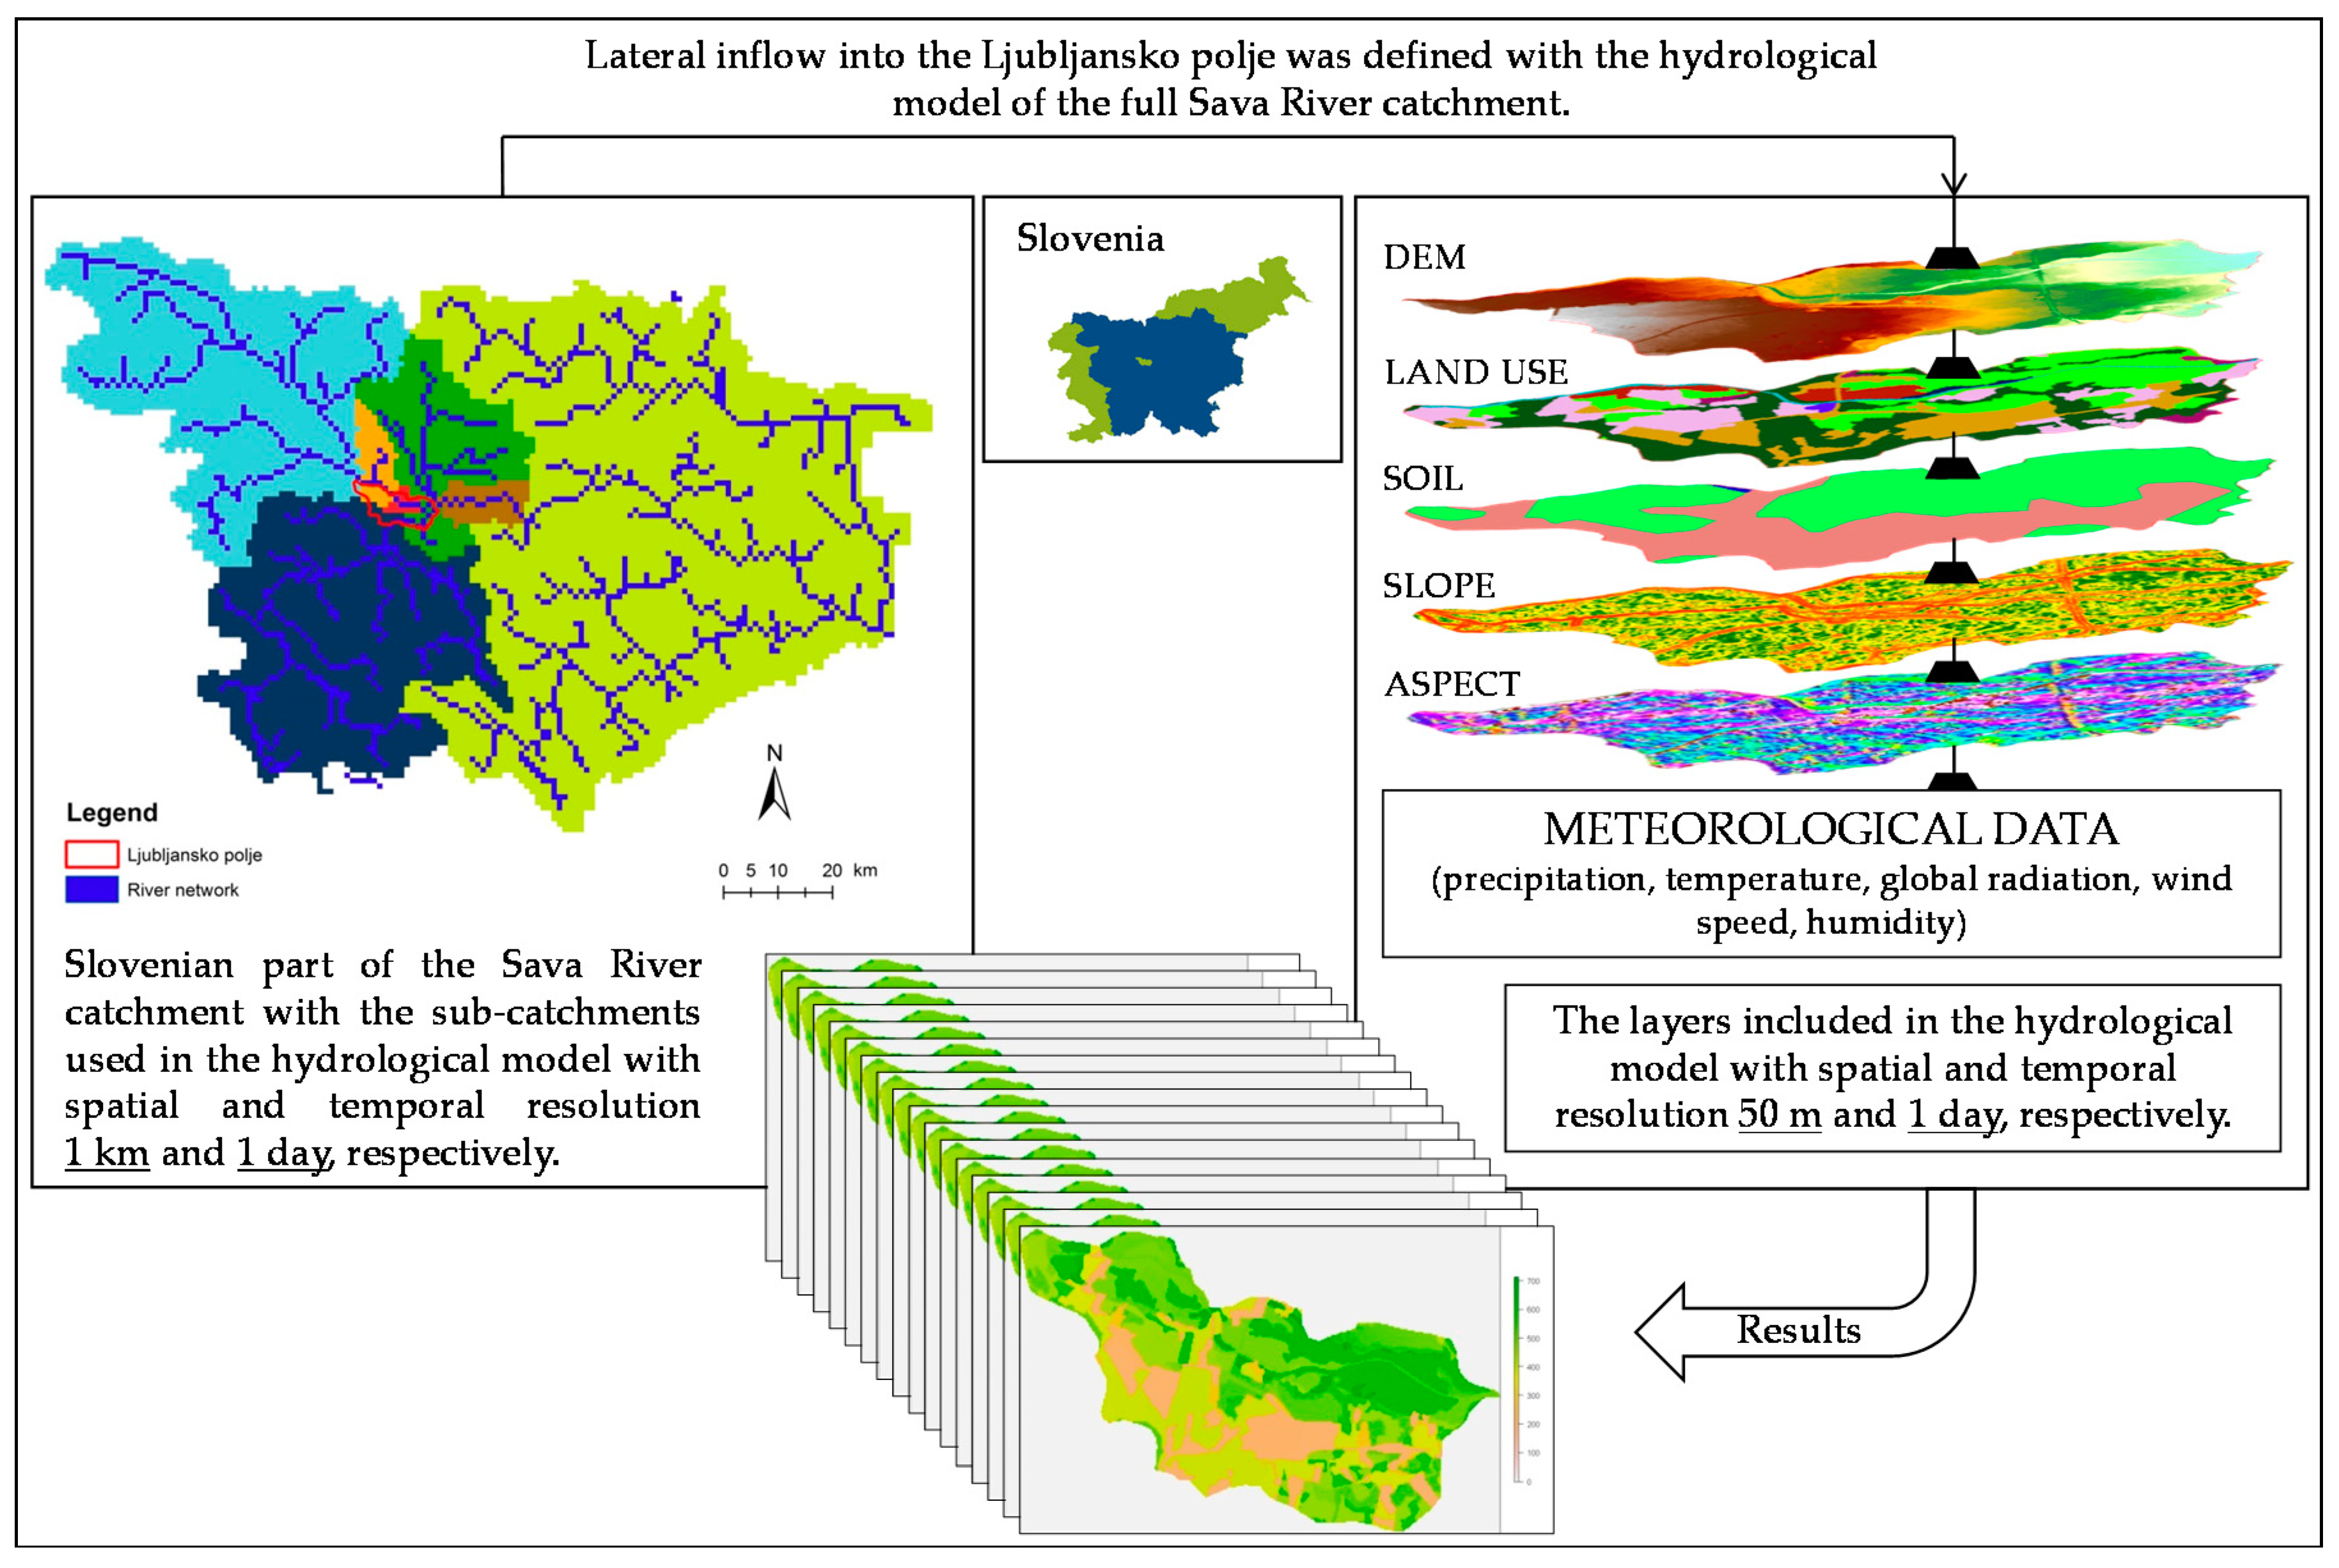
Input grids in WaSiM include topology, land use, soil features, aspect, and slope with a spatial resolution of 50 m. Climate conditions are defined by the station-based daily time sets of temperature (°C), precipitation (mm), global radiation (Wh m−2), humidity (−), and wind speed (m s−1) recorded in 2005 to 2015. The following parameters describe soil hydraulic properties for the four soil horizons in each soil texture class (Table 1): saturated hydraulic conductivity, saturated hydraulic conductivity recession with depth, saturated water content, residual water content, van Genuchten Parameter Alpha, van Genuchten Parameter n, Mualem Parameter in van-Genuchtens, number of numerical layers, and numerical layer thickness [29]. Land use classes (Table 2) for 12 Julian days over a year are parameterized by the following: albedo, leaf surface resistance, leaf area index, roughness length, vegetation-covered fraction, root depth, altitude correction, interception surface resistance, and soil surface resistance [29].
The hydrological model of the Slovenian part of the Sava River Basin (SRB), with a daily temporal resolution and a spatial resolution of 1 km, was developed, while only the Ljubljansko polje was later downscaled to a spatial resolution of 50 m. Results of the SRB model were applied as input data in the Ljubljansko polje model via the routing module, which is one of the modules in the WaSiM control file. The framework of the WaSiM model is shown in Figure 4. The SRB model calculates the lateral inflow of the surface water in the Ljubljansko polje from the upstream area of the SRB.

2.5.1.2. Calibration and Validation of the WaSiM Model

The trial-and-error method was used to calibrate the WaSiM model, which implies a manual parameter assessment through several calibrations run in order to determine realistic lower and upper limits of the adjustable parameters [38]. The parameters used for the calibration are given in Table 3. The reference evapotranspiration value was calculated using the Penman-Monteith method and is the amount of water that has evaporated from the referential plant and soil (Table 3). The reference surface is a hypothetical grass crop, in which the grass completely covers the soil, with a height of 0.12 m having a resistance of 70 s m−1 and an albedo of 0.23 [39].
Precipitation Events. Precipitation events that cause hydraulic head oscillations were used for the calibration of the WaSiM model within the domain of the Ljubljansko polje. These events were extracted from the full database in four steps by (1) calculating the two-day moving average for the hydraulic head, precipitation, river discharge, and groundwater abstraction, (2) extracting days when hydraulic heads, precipitation, and the river discharge were higher than the previous day, (3) extracting days with increased hydraulic heads and precipitation and decreased river discharge (↑hydraulic head│↑precipitation│↓the river discharge), and (4) plotting the extracted days versus hydraulic heads/precipitation/the river recharge/groundwater abstraction.
Due to a lack of available data, model validation was performed only for the year 2009 at an hourly time step using a grid size of 50 m. The warming up period for the model was three years.

2.5.2. MIKE 11

MIKE 11 from the MIKE Powered by the Danish Hydraulic Institute (DHI) is an implicit finite difference model that is capable of dealing with kinematic, diffusive, and dynamic Saint Venant equations. It was chosen because it can solve one-dimensional unsteady flow problems [41]. Additionally, MIKE 11 handles the effect of riverbed morphology on the river water level and groundwater exchange, which is thought to be significant [42,43,44,45].

Setting Up of the MIKE 11 Model

MIKE 11 requires four input files, namely Network, Cross-section, Boundary, and Hydrodynamic (HD) Parameters. The river network and reference cross-sections are defined in the Network file. The Sava River channel in the study domain is 17.8 km long. The channel’s cross-sections and their Manning’s n coefficients are defined in the Cross-Section file. By comparing the natural situation, figures presented by Jarrett [46] and, with the help of local studies [47], the Manning’s n coefficients were estimated to be between 0.027 and 0.030 in the steady domain. The Manning’s n coefficient was later corrected for each cross-section for the whole calibration process of the transient state GW flow model.
Upstream and downstream of the model domain, the Inflow and Q-h boundary types, were defined, respectively. Daily discharges observed in Medno between 2010–2011 were used as the input data for the Inflow boundary type, while the auto calculation of the Q-h Table tool was used for the Q-h boundary type. The calculation is based on the Manning formula, with a river slope of 0.02 and a Manning’s n parameter of 0.0285. In the HD Parameters file, the following parameters were defined: initial water level in the Sava River (observed at two gauging stations), groundwater leakage, and bed resistance. The Manning formula was chosen as the resistance formula, which uses 0.0324 as a global resistance number. The local groundwater leakage coefficients (0.0–1.0 × 10⁻⁶ s−1) were defined for each cross-section for the calibration of the GW flow model.

2.5.3. FEFLOW

FEFLOW also belongs to the MIKE Powered by the DHI software family (URL: https://www.mikepoweredbydhi.com). It is an advanced finite element subsurface flow and transport modelling system, which supports several different file formats, but not WaSiM output-raster files [48]. Therefore, an indirect communication link between WaSiM and FEFLOW was established using open-source R-software (URL: https://www.r-project.org). Daily percolation data from a *.dat file was assigned to the in/outflow on the top/bottom parameter using the “assign material data to time stages” option.
FEFLOW was coupled to MIKE 11 via the FEFLOW Interface Manager (ifmMIKE11), owned by the MIKE Powered by the DHI. The ifmMIKE11 plug-in enables the user to define not only the surface water level at a single boundary node but also the water exchange area represented by the node and the nodal transfer rate [41,49].
However, the river water level, discharge, and leaching of the Sava River water into the aquifer, and groundwater into the river were simulated using coupled MIKE 11 with FEFLOW. The numerical stability of the stand-alone MIKE 11 model was tested initially because a numerically unstable model cannot be used with FEFLOW.

2.5.3.1. Development of the Physical Framework

A 2D unstructured triangle mesh with 110,249 elements was generated within the model domain. The mesh was refined around the central river line, the pumping wells, and the domain border. Direct estimation of the nodal distance method was used to calculate the relative distance between the pumping wells and their adjacent nodes [48]. The elements’ volume ranged from 0.98 to 31,241.7 m3, the maximal interior angle of the triangles was no smaller than 60°, and the Delaunay criterion violation is zero for all elements.
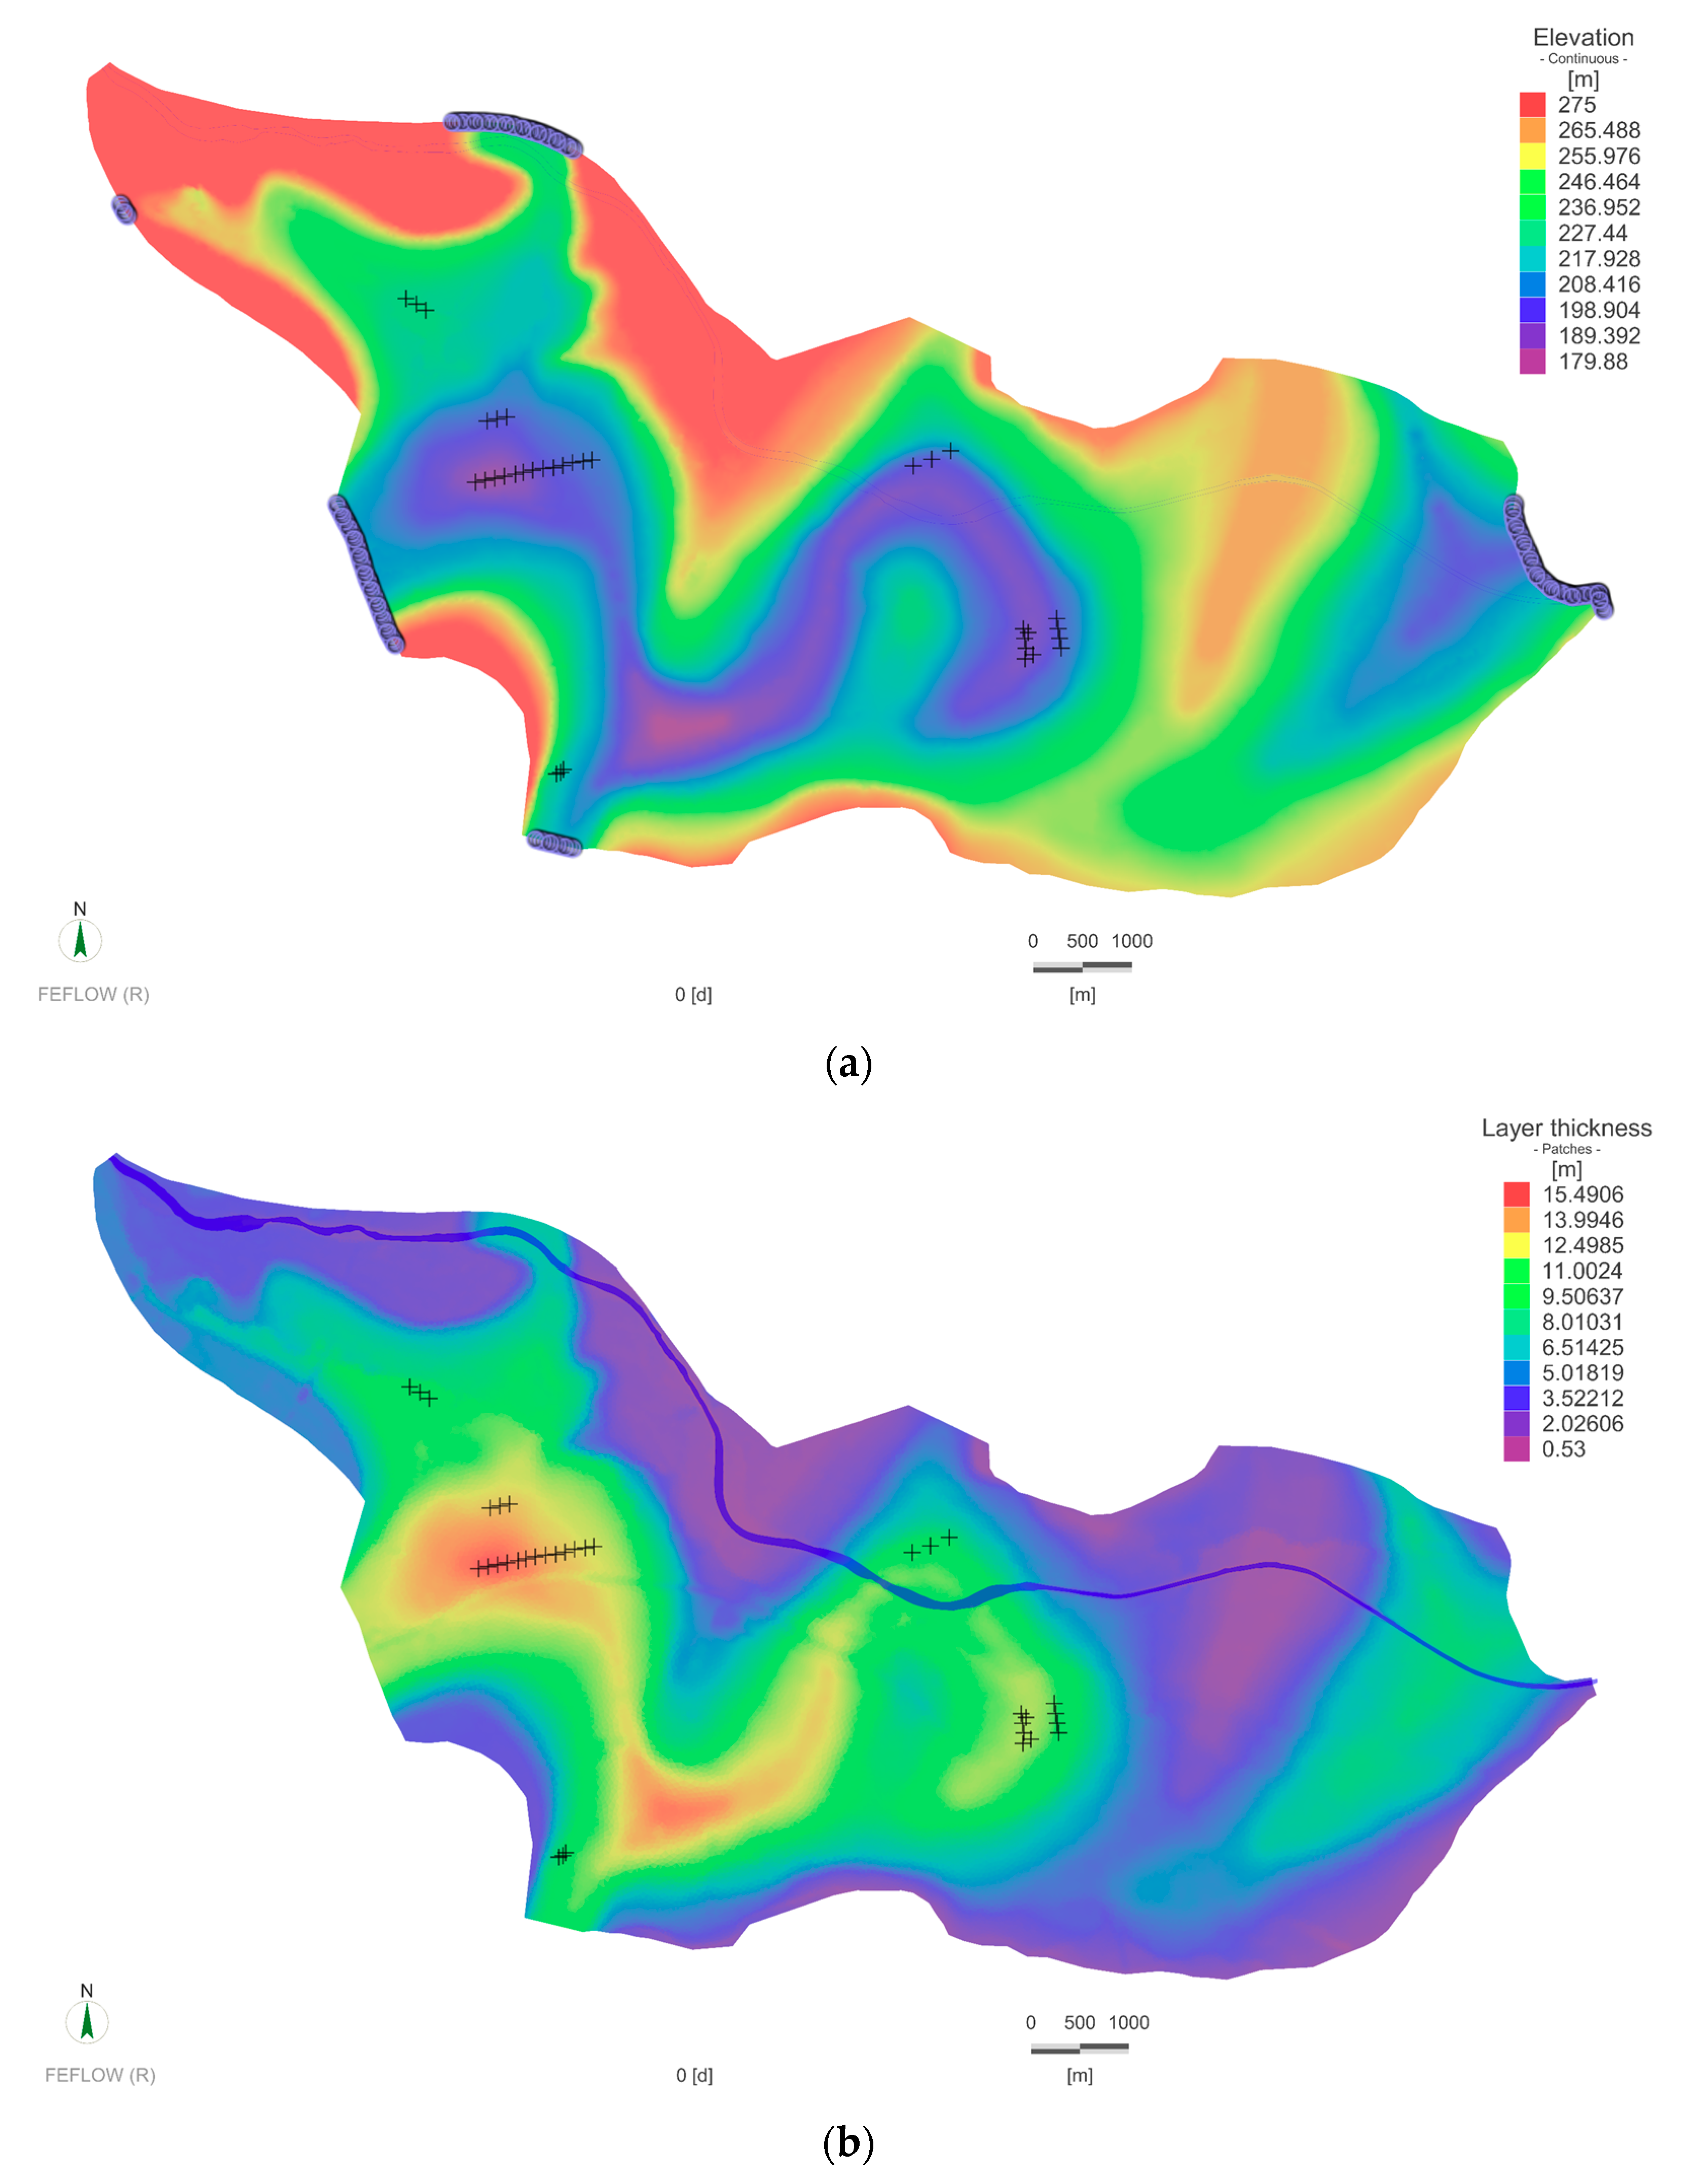
The 3D GW flow model is defined as being only a one-layer aquifer. An implementation of a multi-layer aquifer (described in Table S1) was not credible, due to limited data availability for the hydrogeological parameterization of all five potential layers. Nevertheless, to guarantee numerical stability, the vertical resolution of the model was refined by subdividing the layer into eight sub-layers. For the same reason, the layers were moved slightly lower from the river bed in the areas where an outcrop of bedrock appears. After making mesh corrections, these specific areas are located at an elevation of 275 m (Figure 5a, red areas). In this way, the continuity criterion was fulfilled [50]. The layer thickness varies from 0.5 m to 15.5 m (Figure 5b).
An interpolation of the model topography is based on the DEM at 25 m resolution (Figure 6a), while the interpolation of the Sava River floodplain or low terrace topography is based on more precise LiDAR data at a resolution of 10 m. The Sava’s bed geometry was generated using the Sava River channel cross-sections data-sets. The distances between the cross-sections are approximately 20 m to 900 m along the flow path. Interpolation of the river bathymetry with the river channel cross-sections is essential because a high or low node elevation in a riverbed can produce unwanted or uncontrolled stream water-groundwater exchanges. The lithological composition of the aquifer, its thickness, and extension into the vertical direction downward to the bedrock was based on drilling reports and a bedrock counter map. The Ljubljanica River and outcrops of the bedrock were used as the main criteria for defining the lateral boundary of the model domain.
The kriging method was used for the interpolation of the surface and bedrock, while the Sava River channel was interpolated using the 1D linear interpolation method. The kriging method is still the most accurate geostatistical interpolation method in FEFLOW since it takes into account both the distance and the degree of variation between known data points when estimating values in unknown areas [51]. It is important because the surface is interpolated from a grid based on a mesh of varying density. Every 10 neighboring points were used in the interpolation.

2.5.3.2. Setting Up the Steady-State and Transient State Groundwater Flow Models

The steady-state groundwater flow represents the underlying conditions in the Ljubljansko polje aquifer from 2010 to 2011. Its initial material properties (except in/outflow at the top/bottom) were estimated from consultants’ reports. The initial values were later adjusted in the calibration process using a manual and an automatic trial-and-error method. Results of the steady-state GW flow model were then used for initializing the material parameters and boundary conditions (BC) in the transient state GW flow model.
Daily observed hydraulic heads, pumping ratios, and the Sava River water level were imported into FEFLOW through a time-series editor. The hydraulic heads are connected to the observation points in FEFLOW, pumping ratios to the Multilayer Well BC, and the Sava River water level to the Fluid Transfer BC. The latter is also coupled to MIKE 11 via the ifmMIKE11 plug-in. Percolation was assigned through the material property in/outflow on the top/bottom. The Hydraulic Head BC was defined along the outer model domain boundary sections where the bedrock goes deep under the surface (Figure 5a). In this case, interactions between the aquifer and neighboring water bodies are present. The outer boundaries along the bedrock outcrops and the base of the aquifer (the bedrock) are considered as non-flow boundaries.
Estimating the Hydraulic Head BC was demanding due to the limited understanding of hydrogeological processes between the Ljubljansko polje and neighboring groundwater bodies. To reduce the uncertainty of the model, the model’s reactions to various hydraulic heads in the Hydraulic Head BC, from high to low values, were tested many times with the steady-state GW flow model. Many assumptions that were made in the parametrization and the design of the eastern part of the steady domain—where data availability is limited (hydraulic head, bedrock)—lead to a high outflow around the Kamniška Bistrica River and excluding the Hydraulic Head BC in Črnuče in the calibrated model.
Groundwater flows in the steady and transient state models are simulated using the standard (saturated) groundwater flow equation—Darcy’s law, which can handle unconfined phreatic conditions in an aquifer [48]. Therefore, the top slice was defined as phreatic (fixed slice topping of an unconfined layer) and the bottom slice was defined as fixed, while the sub-slices depend on the top and bottom slices of the model. When the groundwater rises above the surface, the aquifer is treated as confined. The unconstrained head at the top of the model domain and the constrained boundary at the bottom of the model domain were selected as the head limits for the unconfined conditions. Residual water depth for the unconfined layers was estimated at 0.1 m.

2.5.3.3. Calibration and Validation of the FEFLOW Models

The material properties in the setup of the steady and transient state GW flow models (except percolation, an example of the percolation raster is in Figure 6b) were estimated during the calibration procedure, and include hydraulic conductivity for Kxx = Kyy and Kzz, In and Out Transfer rates, and the specific yield. According to the authors’ knowledge, the hydraulic conductivity of the alluvial sediments in the full modeling domain was not measured, which makes its estimation challenging.
The calibration and validation of the models were performed in the following five steps.
Step 1: The steady-state GW flow model was calibrated using manual and automatic trial-and-error history matching of the hydraulic heads in FEFLOW and FePEST, respectively. FePEST is a graphical user interface that links a software package for parameter estimation and uncertainty analysis of models (PEST) with FEFLOW [52].
Step 2: A simulation of the groundwater MRT was activated in FEFLOW. The initial MRT for the full aquifer is 4.99 years, which was calculated in FEFLOW, based on the 3H/3He results [20]. If the results after this step were unsatisfying, steps one and two were repeated.
The second step is a good indicator of the model’s instability, either due to an inappropriate mesh discretization or parameterization. Nevertheless, the groundwater MRT has been widely used for evaluating and improving GW flow models in the past [53,54,55,56].
Step 3: The steady-state model was validated using mean hydraulic head elevations, the mean water levels of the Sava River, the mean percolation, and the mean volume of water extracted between 2013–2014.
Step 4: The steady-state GW flow model was upgraded to a transient state GW flow model, which was coupled to MIKE 11 via the ifmMIKE11 plug-in. The model was calibrated using daily hydraulic head records (1 April 2010–30 April 2010) in combination with manual and automatic trial-and-error history matching of the hydraulic heads and the Sava River discharge.
Step 5: Validation of the transient state model was performed for the period 1 January 2010–31 December 2011. Unfortunately, the initial results were unsatisfactory, and, as a result, several corrections to the model parameterization were made.
In FePEST (a graphical user interface for running FEFLOW models with Parameter Estimation code–PEST), a “pilot points” method was used for automatic trial-and-error history matching of the hydraulic heads and the MRT, and the kriging method for spatial interpolation of values from pilot points to the model domain [57]. Pilot points were located manually and had a higher density where a higher heterogeneous hydraulic conductivity was expected.

3. Results

3.1. WaSiM Model

Table S2 gives the obtained linear correlations for the observed and simulated real evapotranspiration and hydraulic heads. Soil moisture calculated by WaSiM and soil moisture observed by Pintar et al. [40] in the lysimeter in Kleče shows a good correlation (R2 = 0.87) (Figure 7). Furthermore, a high Nash-Sutcliffe model efficiency (NSE = 0.87) between real evapotranspiration calculated using WaSiM and the referential evapotranspiration give adequate modeled values for the actual evapotranspiration in the Ljubljansko polje.
The calibrated parameter set produced results that are in good agreement between the observed and the calculated real evapotranspiration and the hydraulic head for the validation period. The R2 values for the real evapotranspiration and the well P-102 were 0.47 and 0.87 (Table S3), respectively. The lowest correlation (R2 = 0.53) was obtained between the actual and calculated hydraulic heads in well P-013.

3.2. Groundwater Flow Model (FEFLOW-WaSiM-ifmMIKE11)

3.2.1. The Steady-State Groundwater Flow Model

Simulated Kx and Ky in the steady-state model vary between 9.21 × 10⁻⁷ and 0.12 m s−1, and Kz between 8.65 × 10⁻⁶ and 0.10 m s−1. In and Out Transfer Rates in the Sava River bed vary between 5.0 × 10⁻³ and 2.9 day−1. The FEFLOW model was stable when the hydraulic heads presented in Table 4 were used.

3.2.2. The Transient State Groundwater Flow Model

Hydraulic conductivity ranged from 6.57 × 10⁻³ to 3.89 × 10⁻² m s−1 and from 3.24 × 10⁻³ to 4.57 × 10⁻³ m s−1 for Kx = Ky and Kz, respectively. The In and Out Transfer rates were ≤30.44 day−1. All of these four parameters have values higher than that calculated from the calibration of the steady−state model. The simulated specific yield (Drain−/fillable porosity) ranged from 1.09 × 10⁻² to 1.25 × 10⁻². The groundwater leakage was estimated at 8.00 × 10⁻⁵, while the Manning’s n coefficient was between 3.24 × 10⁻² and 3.70 × 10⁻². Simulated leaching of the Sava River water into the aquifer (outflow) and the groundwater in the Sava River (inflow) can be as high as 20 m3 s−1 or 0.26 m3 s−1, respectively.
Tables in the supplementary material provide water balances for the Ljubljansko polje: (1) which were estimated in the past and were later summarized by Andjelov et al. [58] (see Table S4), (2) after calibration and validation of the steady−state model (Table S5), and (3) after validation of the transient models (Table S6).

4. Discussion

4.1. An Interpretation of Observed Data and an Estimation of the System Responsiveness

Results of a cross-correlation analysis (Figure 8) show a discrepancy in the time delay of groundwater responsiveness to the Sava River discharge dynamics (cross-corr. coef. 0.85–0.25). Posavec et al. [59] have observed a similar range of cross-correlation coefficients between groundwater and the Sava River. Nevertheless, diverse responsiveness of groundwater on local precipitation events at different locations may also be observed, despite the low cross-correlation coefficients (0.12 and 0.25). In general, the groundwater responsiveness responds more rapidly to river events than to precipitation events, due to the higher horizontal than vertical hydraulic conductivity. Post and von Asmuth [60] write that, besides the storage and transmissivity of an aquifer, the volume of an observation well, its screen length, the local permeability of the strata adjacent to the well, and atmospheric pressure also affect the groundwater responsiveness time. Group 2 responds to both of the primary groundwater sources within 24 h (Figure 8), while group 1 responds a month later. Additionally, the hydraulic head pattern in group 2 (Figure S3), which is located adjacent to the Sava River bed stands out from the other groups and has the strongest correlation with the Sava River discharge. Alternatively, the hydraulic head in group 3 correlates most strongly with local precipitation. The estimated time lag between groundwater and the Sava River in Zagreb, Croatia is in the same range as in this study [59].
The distance between piezometers and the Sava River channel is the main factor in determining groundwater responsiveness. However, the Sava River is not the dominant groundwater source at a certain point. These observations agree with the study provided by Vrzel et al. [20], which is based on stable isotopes. Furthermore, response time is not equal to the groundwater MRT but is related exclusively to pressure changes. These results also show that running the transient state GW flow model at daily time steps is the most reasonable.

4.2. The WaSiM Model

A lower correlation between the observed and calculated hydraulic heads was expected because of the known hidden precipitation event signals that result from diverse groundwater responsiveness over the steady domain (Figure 8) and the presence of a second groundwater source known as the Sava River [20]. For instance, the influence of the Sava River water on the hydraulic head in the well P-013 and the longer MRT of the groundwater at Kleče [20] explains the lowest correlation (R2 = 0.53) between the observed and calculated hydraulic heads in this well (Table S3). Built-up areas and locally presented layers with low hydraulic conductivity obstruct percolation in the aquifer. Additionally, the impact of groundwater abstraction on the hydraulic head was not taken into account in the WaSiM model. Nevertheless, R2 = 0.90 for the well P-102 in the year 2013 (Table S2).

4.3. The Steady-State Groundwater Flow Model

The results in Table S5 show that simulated and estimated (Table S4) water balances are in the same range. A discrepancy between the observed and simulated underground recharge is likely related to the rough estimations of these fluxes in the limited number of published studies and the model. Despite the challenges in quantifying the fluxes of groundwater between aquifers as supported by Asmael et al. (2015) [61], this process deserves more attention in groundwater modeling, since Bouaziz et al. [62] revealed that inter-catchment groundwater flow processes affect water balance at a regional scale. Simulated groundwater leaching into the Sava River and simulated percolation are smaller than literature values (Tables S4 and S5), while underground recharge is not reported in the literature.
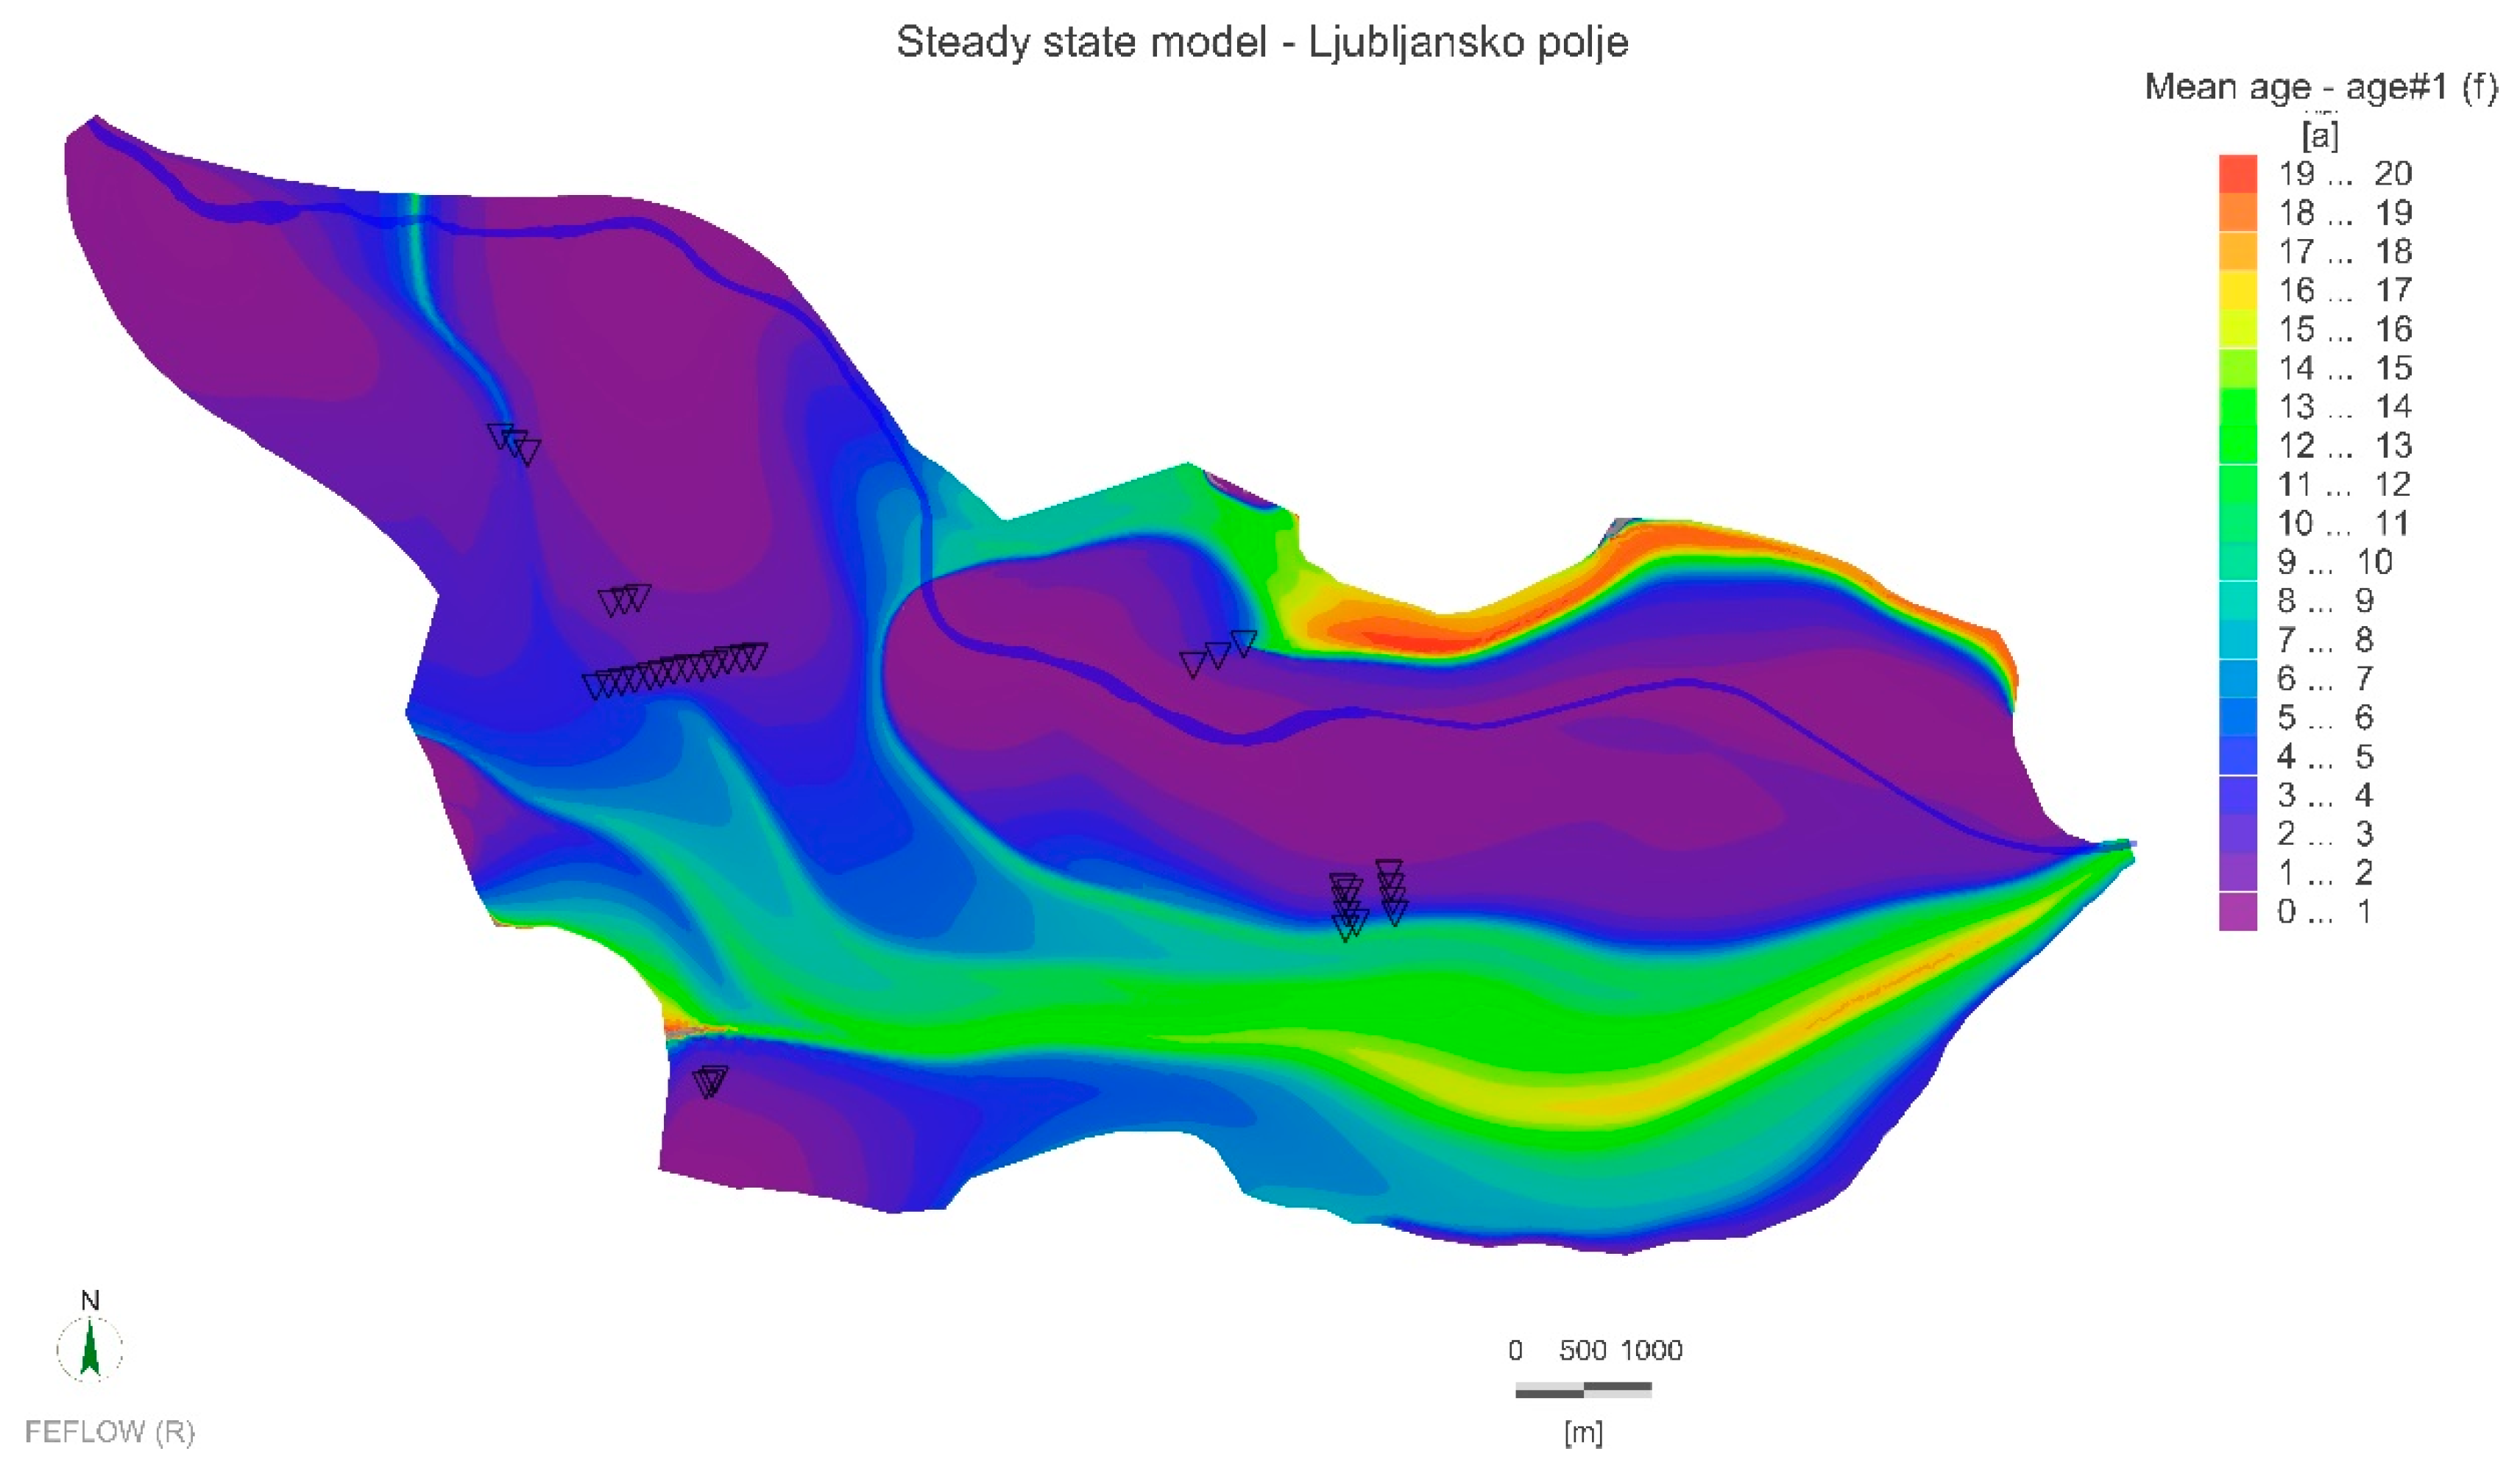
To ensure that the steady-state model provides a representative result, a comparison of the travel time of particles in the groundwater between sources and wells was completed as well as comparisons between the Sava River water fractions in groundwater mixtures (estimated by Vrzel et al. [20]) and the estimated system responsiveness (Figure 8). In Figure S4, shorter path lines of particles between the Sava River and Hrastje than those between the Sava River and Kleče can be seen and is the reason for the quick responsiveness of the system to the Sava River water in Hrastje than in Kleče, even though the fraction of the Sava River water is higher in Kleče than in Hrastje. Short paths of particles in Jarški prod explain why the Sava River water dominates in this area and why it has the shortest MRT [20] (Table 3).
The simulated MRT (Figure 9) reveals recharge areas of the aquifer (purple areas in Figure 9), which should receive the most attention for sustainable groundwater management [55]. The MRT, estimated using the 3H/3He data, is 8.4 years [20] (Table 3), while simulations show an even longer MRT at specific locations. Nevertheless, the old water (Figure 9: reddish areas) in the northern part of the basin and around Rožnik hill may not be accurate due to the influence of the model domain border–the boundary effect. Figure 9 explains that the five oscillation patterns of the hydraulic heads (Figure S3) and the diverse aquifer responsiveness over the steady domain (Figure 8) are related to the different recharge areas and groundwater flow directions. Additionally, calculated hydrological conductivity in the Ljubljansko polje agree with literature data and describe the poorly permeable layers in the area with lower simulated hydraulic conductivity [22].

4.4. The Transient State Groundwater Flow Model

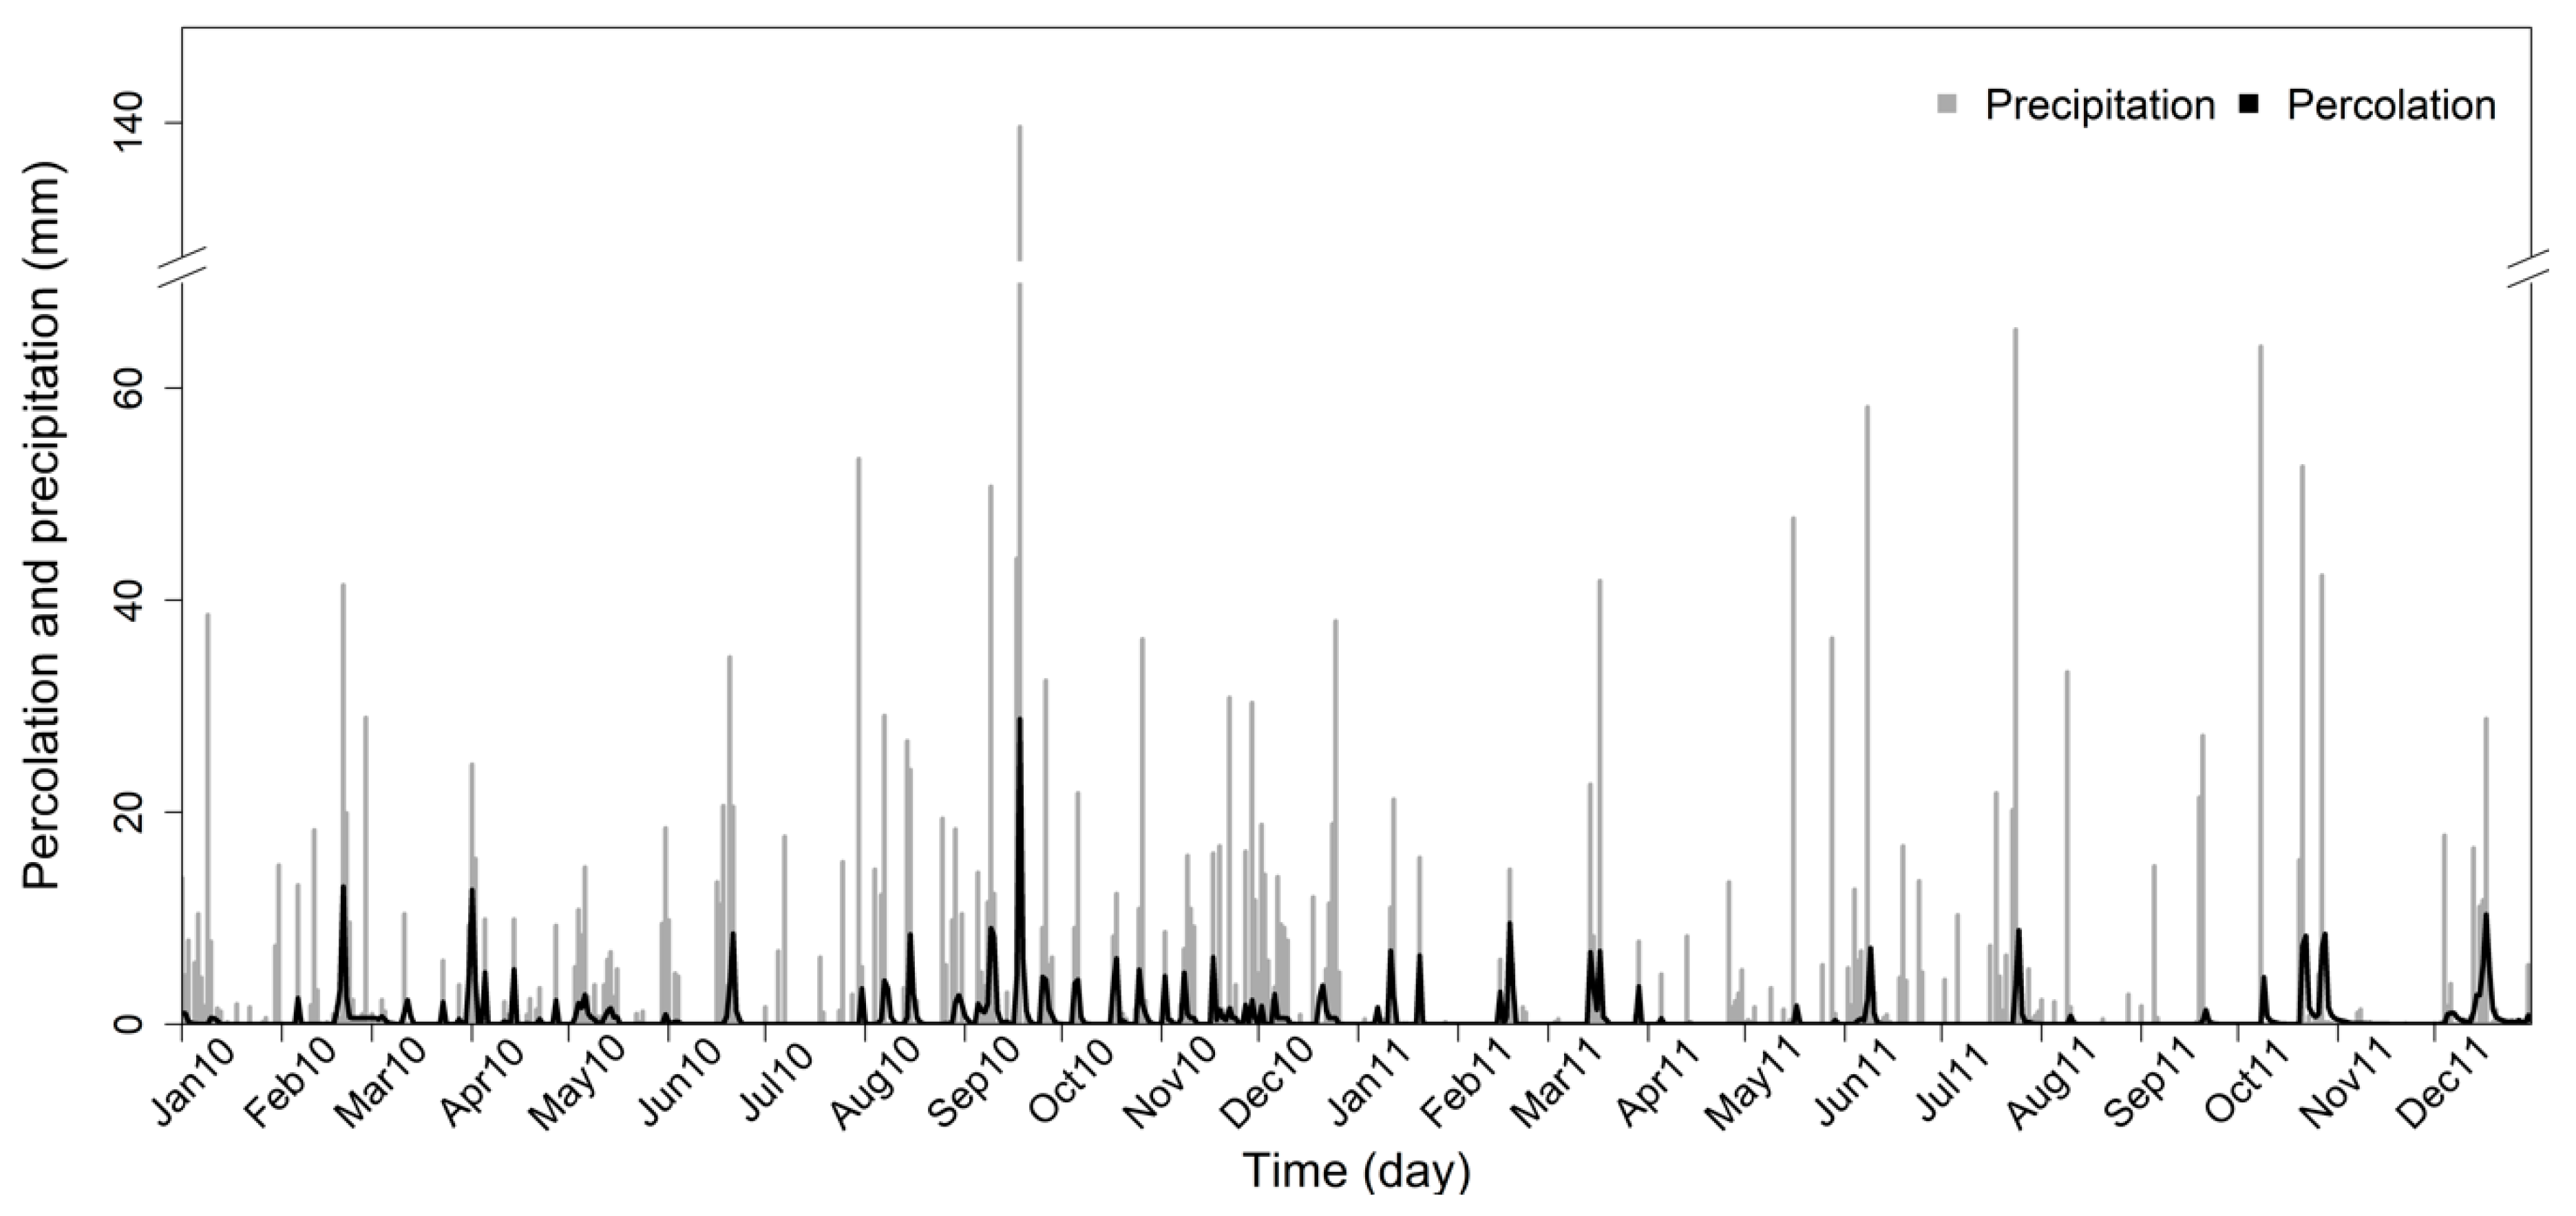
A water balance for the transient state model (Table S6) was estimated for the 2 November 2010 high water level and the 1 July 2010 low water level in the Sava River. In general, water exchange rates are higher in the transient state model than in the steady-state model (Table S5), as well as in the water balance calculated from the literature (Table S4). Similarly, Ackerman et al. [63] observed higher exchange rates in the transient than in the steady-state model in the eastern Snake River Plain aquifer, USA. The simulated leaching of the Sava River water in the aquifer was higher when the Sava River water level was lower (1 July 2010). This observation may be explained by the higher pressure in the aquifer on the 2 November 2010, due to extremely wet conditions in September 2010 (Figure 10).
A comparison between the observed and simulated hydraulic heads after validation of the transient state model is shown in Figure 11. Their time series also match their maximal values, and only subtle deviations that are not critical were observed. These deviations are likely due to the use of only one model layer since multiple model layers can more realistically simulate the pressure in the aquifer, which is a fact confirmed by Zhou and Herath [64]. In order to be able to parameterize geological layers in more detail, geostatistical analyses [65] can be applied (besides obtaining new in-situ measurements). Realistic oscillations of the hydraulic head in the piezometers located near the Sava River (P-017) and a good agreement between the observed and simulated discharges and water levels in the Sava River (Figure S5) confirm that groundwater flow boundary conditions are well defined.
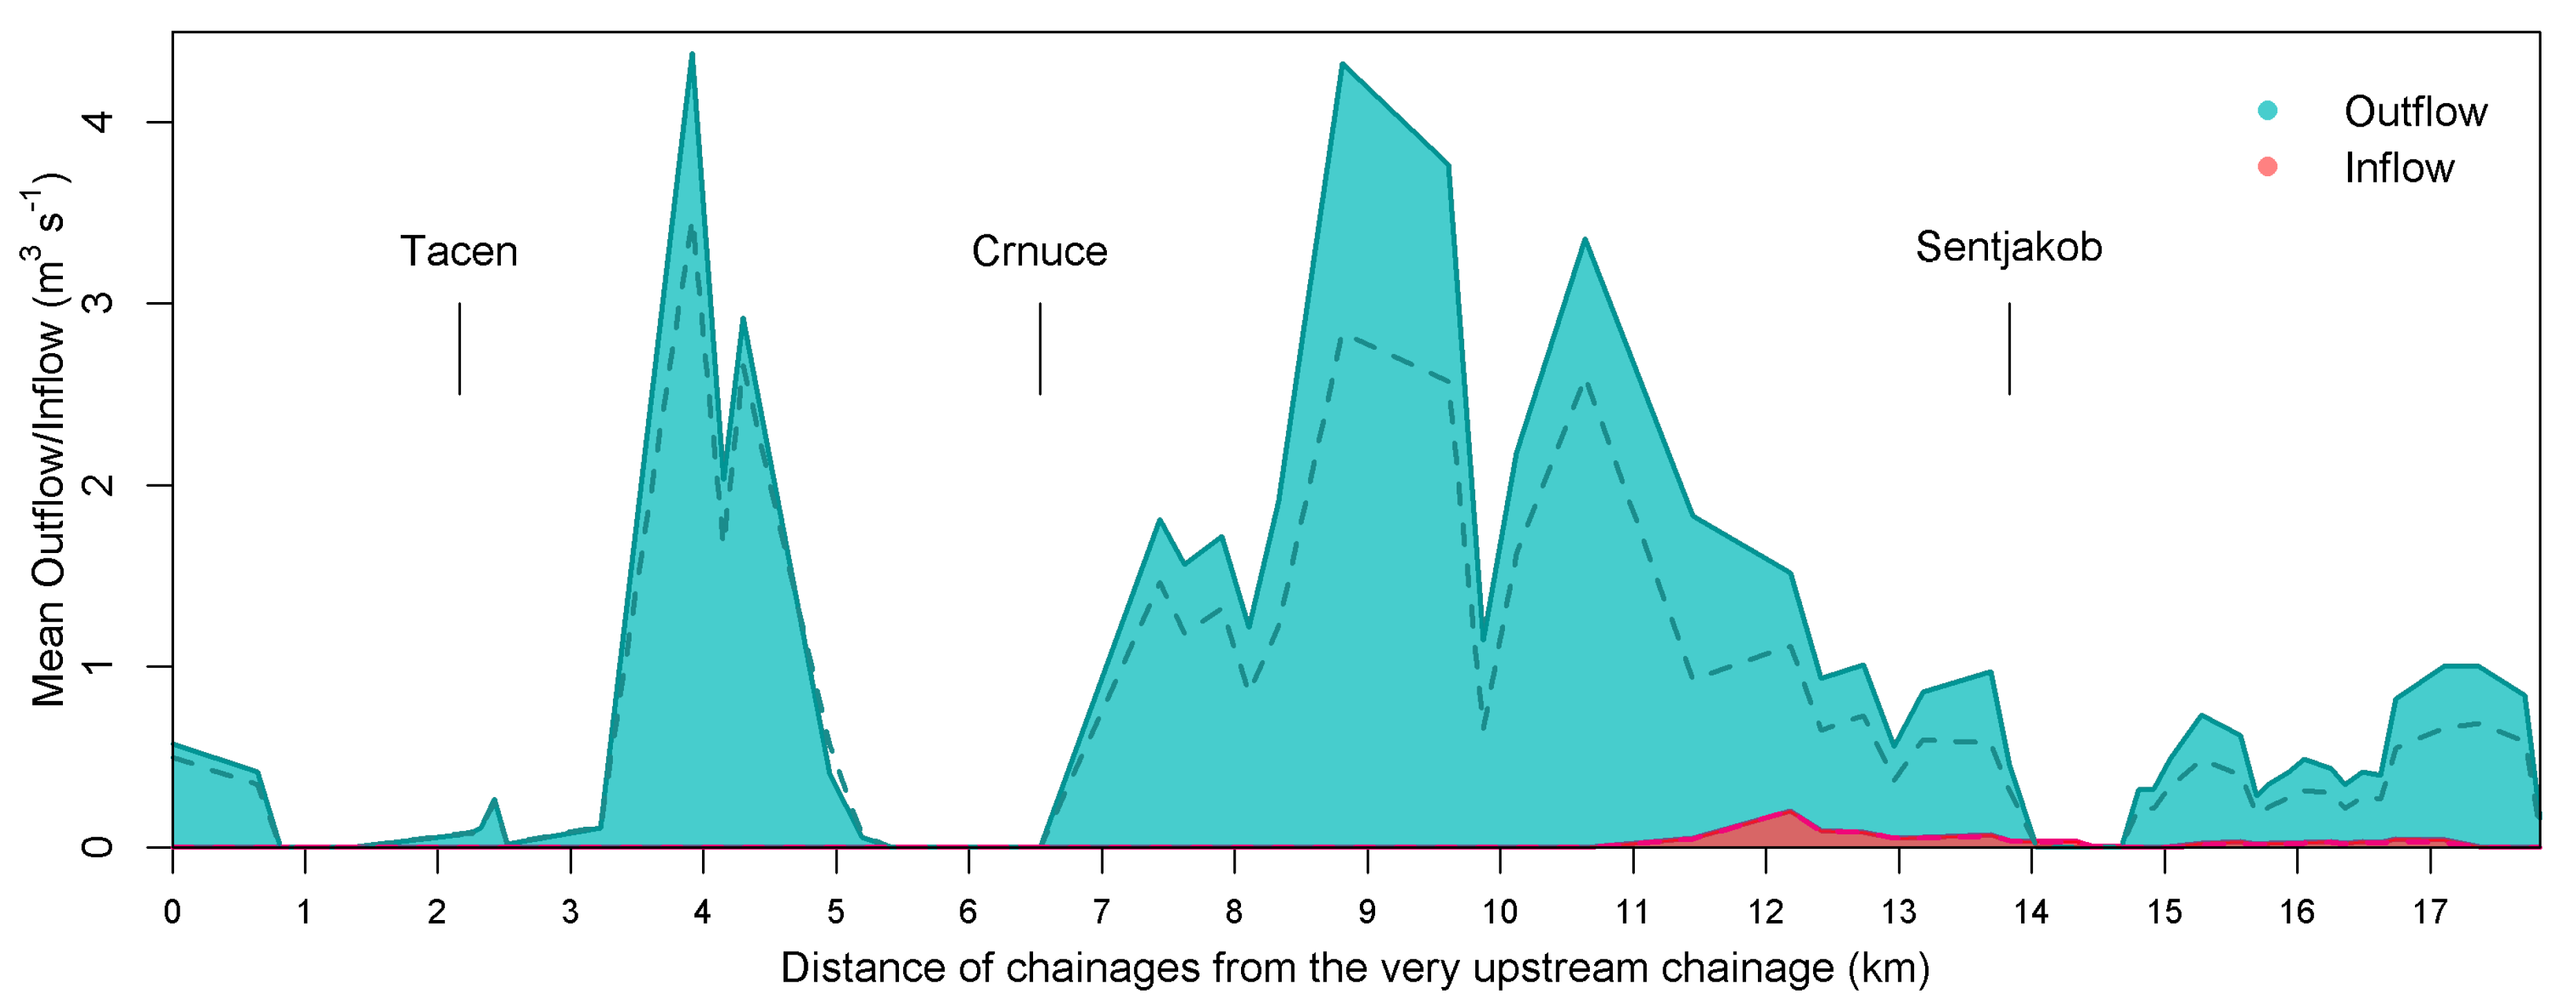
The simulated Sava River discharge was slightly lower than that observed, while their oscillation patterns match closely (Figure S5). The lower level of recharge downstream along the Sava River is another indicator of the leaching of the Sava River water into the aquifer (outflow). The outflow and inflow (a flux from the aquifer into the Sava River) have the opposite effect on the Sava River discharge. When the Sava River discharge increases, the outflow also increases, but the inflow decreases. Exact locations of the river water-groundwater interactions are presented in Figure 12 and Figure S6. In the literature, it is reported that groundwater drains into the Sava River only downstream of Šentjakob. However, model simulations indicate that this process already occurs upstream from Šentjakob (Figure 12).
Groundwater flow under different conditions, including high (2 November 2010) and low (1 July 2010) discharge in the Sava River, is shown in Figure S6. It should be noted that the data from 2 November 2010 is not representative of normal wet conditions. The system was still under the recovery phase after recent extremely wet conditions. However, a connection between the travelling time of particles in the groundwater between their sources and piezometers and the estimated system responsiveness can be observed (Figure S4).
The travel time of the particles differs from the MRT estimated using the 3H/3He method and the simulated MRT (Figure 9). The reason is the different mathematical background of both tools. The calculation of particle travel time does not take into account the mixing of water from different sources, unlike in the simulation of the MRT. The logic behind the particle travel time calculation is similar to a piston flow by assuming that a parcel of water moves as a discrete volume along a flow path [66]. The results also show how Trnovo represents an important underground inflow of groundwater from the Ljubljansko Barje into the system.
Deviations also occur between groundwater flow paths in the steady and transient state models. For instance, Roje is the main recharge area for Hrastje in the transient state model, while Tomačevo is the main recharge area in the steady-state model. Figure 9 shows the mixing of groundwater around Hrastje from different recharge areas, which depends on hydrological conditions. The interpretation of the recharge area for groundwater in Hrastje might be ambiguous. However, the long MRT [20] (Table 3) and the small estimated Sava River water fractions in Hrastje [20] (Figure 6) suggest that the main recharge area for groundwater in Hrastje is in the North-Western part of the Ljubljansko polje.
According to Table 5, the observed and simulated values are most similar when the system contains more water. The highest discrepancy between the observed and simulated hydraulic heads is in the area around group 4 (Figure 11). One reason for this might be a lack of information about the depth of the bedrock. The dynamic bedrock elevation in this area was predicted based on limited information. A second reason might be an underestimation of the underground recharge in Trnovo.

5. Conclusions

An integrated approach using geochemical and multivariate statistical methods were used to study surface-groundwater interactions in the Ljubljansko polje aquifer system. The study involved collecting and processing a large amount of historical data and defining the isotopic composition of the groundwater. The main success of the work was the unravelling of information about groundwater behavior hidden in the data obtained from different sources and combining this into a hydrological model.
The paper presents the conceptualization of the study domain using chronological data and hydrological modeling. The chronological data of the hydraulic heads observed in many piezometers show five oscillation patterns that form five groups. The cross-correlation analyses revealed varying responsiveness of these five groups to the two main groundwater sources: the Sava River and local precipitation. Furthermore, the simulated mean residence time can explain the different patterns observed in the different recharge areas, and it identifies those areas that should receive special attention regarding groundwater protection.
Cross-correlation analyses reveal the importance of understanding the system in time, since the response to an increase in the high-water level of the Sava River or local precipitation can be fast, i.e., within 24 h. For this reason, a transient state model was developed to provide a reliable simulation of the complex interactions between groundwater and surface water that dominates the system’s evolution (as is shown in the conceptual model) by combining multiple models. The groundwater flow was simulated using FEFLOW and MIKE 11, which were coupled using the ifmMIKE11 plug-in, for the simulation of the Sava River discharge, and fluxes between the river and groundwater water. Percolation was simulated in WaSiM. For this reason, an indirect communication link was established between FEFLOW and WaSiM.
Solving hydrological issues related to sensitive hydrological systems can be time-consuming and complicated. However, the results of studies like this one provide valuable and unique information. It is even possible to quantify important components in the water balance of the basin under different conditions. This study also provided a complete picture of the full water cycle in the Ljubljansko polje. The GW flow model has great potential for many other applications such as (1) testing the impact of changing land use on the water cycle, including groundwater-surface water interactions, (2) projecting future hydrological conditions, and (3) as a model for simulating water tracers (e.g., isotopes) and pollutants (e.g., nutrients, pharmaceuticals, and toxic metals). The study results can also aid in the decision-making process regarding sustainable groundwater management in the Ljubljansko polje aquifer system, which is the main source of drinking water for the growing population of Ljubljana.

Supplementary Materials

The following are available online at https://www.mdpi.com/2073-4441/11/9/1753/s1. Figure S1: Distribution of observed hydraulic heads over time, Figure S2: Box plot of hydraulic heads observed in 50 piezometers over the period 2010–2011, Figure S3: Hydraulic head patterns of all five groups observed over the period 2010–2011, Figure S4: Travel time, backwards streamlines seeds (y), hydraulic head (m), and bedrock elevations (m), Figure S5: The upper two plots show outflows/inflows (m3 s−1) for random Sava River cross-sections simulated in MIKE 11 with ifmMIKE11 plug-in in FEFLOW Observed (full lines) and simulated (dash lines) discharges and water levels in the Sava River over the validated period 1 January 2010–31 December 2011, Figure S6: Groundwater flow under different conditions in the Sava River: (a) high discharge (left: upper legend) for 6 May 2010, (b) low discharge (right: lower legend) for 1 July 2010, Table S1: Lithological composition of the suggested model layers (ML) [67], Table S2: Linear correlations (R2) between observed and calculated real evapotranspiration and trend of the hydraulic head after the calibration (period: January 2010–December 2014), Table S3: Correlations (R2) between observed and calculated real evapotranspiration and trend of the hydraulic head after the validation (period: January 2009–December 2009), Table S4: Estimated components of a groundwater budget in the Ljubljansko polje (m3 s−1) [58], Table S5: Water balance after calibration and validation of the steady-state GW flow model for data observed over the period 2010–2011 and 2013–2014, respectively, Water balance after calibration for 2010–2011 data and included simulation of MRT (after step 2), Table S6: Water balance for a validated transient state model (after the step five) for two days 2 November 2010 (high water level in the Sava River) and 1 July 2010 (low water level in the Sava River).

Author Contributions

Conceptualization, J.V., N.O., and R.L. Methodology, J.V., N.O., and R.L. Software, J.V. Validation, J.V. Formal analysis, J.V. Investigation, J.V. Data curation, J.V. Writing—original draft preparation, J.V. Writing-review & editing, J.V., N.O., and R.L. Visualization, J.V. Supervision, N.O., R.L., and G.V.

Funding

The EU 7th Research Project–GLOBAQUA (Managing the effects of multiple stressors on aquatic ecosystem under water scarcity), grant number 603629-ENV-2013-6.2.1, funded this research. The research was partially conducted within the doctoral study of Janja Vrzel financed by the European Social Fund (KROP 2012) no. C2130-12-000070. The research activities were also performed within the national program P1-0143 and project L1-9191–Illicit drugs, alcohol and tobacco: wastewater based epidemiology, treatment efficiency, and vulnerability assessment of water catchments funded by the Slovenian Research Agency (ARRS).

Acknowledgments

The authors would like to thank all those institutes and companies who shared their data including the following: Environmental Agency of Slovenia, Holding Slovenske Elektrarne d.o.o., Institute for Water of the Republic of Slovenia (IzVRS), Javno Podjetje Vodovod-Kanalizacija Ljubljana (VOKA), Pivovarna Lašo Union d.o.o., TIS/ICPVO–Infrastructural Centre for Pedology and Environmental Protection, Biotechnical Faculty, University of Ljubljana, The City Municipality of Ljubljana, and The Surveying and Mapping Authority of the Republic of Slovenia. The authors would also like to thank MIKE Powered by DHI for the use of their software FEFLOW and the plug-in ifmMIKE11.

Conflicts of Interest

The authors declare no conflict of interest. The funders had no role in the design of the study, in the collection, analyses, or interpretation of the data, in the writing of the manuscript, or in the decision to publish the results.

References

  1. Fleckenstein, J.H.; Krause, S.; Hannah, D.M.; Boano, F. Groundwater-surface water interactions: New methods and models to improve understanding of processes and dynamics. Adv. Water Resour. 2010, 33, 1291–1295. [Google Scholar] [CrossRef]
  2. National Academic of Science, Engineering, and Medicine. From Maps to Models: Augmenting the Nation’s Geospatial Intelligence Capabilities; The National Academies Press: Washington, DC, USA, 2016; p. 121. [Google Scholar]
  3. Gyopari, M.C.; McAlister, D. Wairarapa Valley Groundwater Resource Investigation: Upper Valley Catchment Hydrogeology and Modelling; Technical Publication GW/EMI-T-10/74; Greater Wellington: Wellington, New Zealand, 2010; p. 108. [Google Scholar]
  4. Monninkhoff, B.L.; Li, Z. Coupling FEFLOW and MIKE11 to optimise the flooding system of the Lower Havel polders in Germany. Int. J. Water 2009, 5, 163–180. [Google Scholar] [CrossRef]
  5. Natkhin, M. Modellgestützte Analyse der Einflüsse von Veränderungen der Waldwirtschaft und des Klimas auf den Wasserhaushalt Grundwasserabhängiger Landschaftselemente. Master’s Thesis, University of Potsdam, Potsdam, Germany, 2010. (In German). [Google Scholar]
  6. Gunduz, O.; Aral, M. Surface Water—Groundwater Interactions: Integrated Modeling of a Coupled System. In Handbook of Applied Hydrology; Singh, V.P., Ed.; McGraw-Hill Inc.: New York, NY, USA, 2016; pp. 54.1–54.14. [Google Scholar]
  7. Barthel, R.; Banzhaf, S. Groundwater and Surface Water Interaction at the Regional-Scale—A Review with Focus on Regional Integrated Models. Water Resour. Manag. 2016, 30, 1–32. [Google Scholar] [CrossRef]
  8. Krause, S.; Bronstert, A. The impact of groundwater–surface water interactions on the water balance of a mesoscale lowland river catchment in northeastern Germany. Hydrol. Process. 2007, 21, 169–184. [Google Scholar] [CrossRef]
  9. Wei, X.; Bailey, R.T.; Records, R.M.; Wible, T.C.; Arabi, M. Comprehensive simulation of nitrate transport in coupled surface-subsurface hydrologic systems using the linked SWAT-MODFLOW-RT3D model. Environ. Model. Softw. 2018. [Google Scholar] [CrossRef]
  10. Trichakis, I.; Burek, P.; De Roo, A.; Pistocchi, A. Towards a Pan-European Integrated Groundwater and Surface Water Model: Development and Applications. Environ. Process. 2017, 17, 81–93. [Google Scholar] [CrossRef]
  11. Rodriguez, L.B.; Cello, P.A.; Vionnet, C.A.; Goodrich, D. Fully conservative coupling of HEC-RAS with MODFLOW to simulate stream–aquifer interactions in a drainage basin. J. Hydrol. 2008, 353, 129–142. [Google Scholar] [CrossRef]
  12. Inter 3 Institute for Resource Management GmbH. Integrated Water Resources Management Zayandeh Rud: German-Iranian Research and Development Cooperation for a Better Future. Available online: https://www.inter3.de/fileadmin/user_upload/Downloads/Flyer_usw/download_IWRM-en.pdf (accessed on 16 August 2017).
  13. Guay, C.; Nastev, M.; Paniconi, C.; Sulis, M. Comparison of Two Modeling Approaches for Groundwater–Surface Water Interactions. Hydrol. Process. 2013, 27, 2258–2270. [Google Scholar] [CrossRef]
  14. Cheo, A.E.; Voigt, H.-J.; Wendland, F. Modeling groundwater recharge through rainfall in the Far-North region of Cameroon. Groundw. Sustain. Dev. 2017, 5, 118–130. [Google Scholar] [CrossRef]
  15. Andjelov, M.; Mikulič, Z.; Tetzlaff, B.; Wendland, F.; Uhan, J. Groundwater Recharge in Slovenia—Results of a Bilateral German-Slovenian Research Project; Forschungszentrum Jülich GmbH Zentralbibliothek: Jülich, Germany, 2016; Volume 339. [Google Scholar]
  16. Epting, J.; Huggenberger, P.; Radny, D.; Hammes, F.; Hollender, J.; Page, R.M.; Weber, S.; Bänninger, D.; Auckenthaler, A. Spatiotemporal scales of river-groundwater interaction—The role of local interaction processes and regional groundwater regimes. Sci. Total Environ. 2018, 618, 1224–1243. [Google Scholar] [CrossRef]
  17. Feinstein, D. Since “Groundwater and Surface Water–A Single Resource”: Some U.S. Geological Survey advances in modeling groundwater/surface-water interactions. Acque Sotter. Ital. J. Groundw. 2012, 1, 9–24. [Google Scholar] [CrossRef]
  18. Brunner, P.; Simmons, C.T.; Cook, P.G. Spatial and Temporal Aspects of the Transition from Connection to Disconnection between Rivers, Lakes and Groundwater. J. Hydrol. 2009, 376, 159–169. [Google Scholar] [CrossRef]
  19. Fleckenstein, J.H.; Niswonger, R.G.; Fogg, G.E. River-Aquifer Interactions, Geologic Heterogeneity, and Low-Flow Management. Ground Water 2006, 44, 837–852. [Google Scholar] [CrossRef] [PubMed]
  20. Vrzel, J.; Solomon, D.K.; Blažeka, Ž.; Ogrinc, N. The study of the interactions between groundwater and Sava River water in the Ljubljansko polje aquifer system (Slovenia). J. Hydrol. 2018, 556, 384–396. [Google Scholar] [CrossRef]
  21. Urbanc, J.; Jamnik, B. Isotope investigations of groundwater from Ljubljansko polje (Slovenia). Geologia 1998, 41, 355–364. [Google Scholar] [CrossRef]
  22. Šram, D.; Brenčič, M.; Lapanje, A.; Janža, M. Perched Aquifers Spatial Model: A Case Study for Ljubljansko Polje (Central Slovenia). Geologija 2012, 55, 107–116. [Google Scholar] [CrossRef]
  23. Cerar, S.; Urbanc, J. Carbonate Chemistry and Isotope Characteristics of Groundwater of Ljubljansko Polje and Ljubljansko Barje Aquifers in Slovenia. Sci. World J. 2013, 2013, 1–11. [Google Scholar] [CrossRef] [PubMed]
  24. Auersperger, P.; Čenčur Curk, B.; Jamnik, B.; Janža, M.; Kus, J.; Prestor, J.; Urbanc, J. Dinamika Podzemne Vode. In Podtalnica Ljubljanskega Polja; Rejec Brancelj, I., Smrekar, A., Kladnik, D., Eds.; Založba ZRC: Ljubljana, Slovenia, 2005; pp. 39–61. (In Slovene) [Google Scholar]
  25. All Work Package Leaders & the whole CC-WaterS Project Consortium. Climate Change and Impacts on Water Supply “CC-WaterS”. Available online: http://www.ccwaters.eu/downloads/CC-WaterS_Project_Monography_final.pdf (accessed on 16 August 2017).
  26. Janža, M.; Meglič, P.; Šram, D. Numerical Hydrological Modelling; Final Report P-II-30d/b-5/1-d; Geological Survey of Slovenia: Ljubljana, Slovenia, 2011; p. 66. [Google Scholar]
  27. Slovenian Environment Agency. Dostop Do Podatkov o Vodah v Sloveniji (in Slovene). Available online: http://vode.arso.gov.si (accessed on 12 August 2017).
  28. Slovenian Environment Agency, METEO. Available online: http://meteo.arso.gov.si (accessed on 12 August 2017). (In Slovene)
  29. Schulla, J. Model Description WaSiM (Water Balance Simulation Model); Technical Report; Hydrology Software Consulting J. Schulla: Zurich, Switzerland, 2015; p. 332. [Google Scholar]
  30. Strojan, I.; Kobold, M.; Polajnar, J.; Šupek, M.; Pogačnik, N.; Jeromelj, M.; Petan, S.; Lalič, B.; Trček, R. Poplave v Dneh od 17. do 21. Septembra 2010. Miš. Vod. Dan: Zbor. Ref. 2010, 21, 1–11. (In Slovene) [Google Scholar]
  31. Cegnar, T. Climate in Slovenia in 2011. Ujma 2012, 26, 20–32. (In Slovene) [Google Scholar]
  32. Wessolek, G.; Kaupenjohann, M.; Renger, M. Bodenphysikalische Kennwerte Und Berechnungsverfahren Für Die Praxis; Facklam, M., Ed.; Technische Universitaet Berlin: Berlin, Germany, 2009. (In Germany) [Google Scholar]
  33. Renger, M.; Bohne, K.; Facklam, M.; Harrach, T.; Riek, W.; Schäfer, W.; Wessolek, G.; Zacharias, S. Ergebnisse und Vorschläge der DBG-Arbeitsgruppe ”Kennwerte des Bodengefüges“ zur Schätzung Bodenphysikalischer Kennwerte (in German); Deutsche Bodenkundliche Gesellschaft: Goettingen, Germany, 2008; p. 51. [Google Scholar]
  34. Soil Moisture Classification. Available online: http://www.terragis.bees.unsw.edu.au/terraGIS_soil/sp_water-soil_moisture_classification.html (accessed on 3 May 2017).
  35. CORINE Land Cover Database of the Year 2006. Available online: https://www.eea.europa.eu/data-and-maps/data/clc-2006-raster-4#tab-european-data (accessed on 5 December 2016).
  36. Pignotti, G.; Rathjens, H.; Cibin, R.; Chaubey, I.; Crawford, M. Comparative Analysis of HRU and Grid-Based SWAT Models. Water 2017, 9, 272. [Google Scholar] [CrossRef]
  37. Moving Windows. Available online: http://www.gitta.info/ContiSpatVar/en/html/SpatDependen_learningObject2.xhtml (accessed on 27 December 2017).
  38. Refsgaard, J.C.; Storm, B. Construction, Calibration and Validation of Hydrological Models. In Distributed Hydrological Modelling; Abbott, M.B., Refsgaard, J.C., Eds.; Springer: Dordrecht, The Netherlands, 1990; Volume 22, pp. 41–54. [Google Scholar]
  39. Povprečne Mesečne Vrednosti Evapotranspiracije v Obdobju 1971–2000 (in Slovene). Available online: http://meteo.arso.gov.si/met/sl/agromet/period/etp/ (accessed on 30 September 2018).
  40. Pintar, M.; Korpar, P.; Zupanc, V. Meritve na Lizimetrski Postaji v Klečah: Poročilo za Leto 2012; University of Ljubljana: Ljubljana, Slovenia, 2013. (In Slovene) [Google Scholar]
  41. Monninkhoff, B. IfmMIKE11 2.1: User Manual; DHI-WASY GmbH: Berlin, Germany, 2014; p. 132. [Google Scholar]
  42. Diem, S.; Renard, P.; Schirmer, M. Assessing the effect of different river water level interpolation schemes on modeled groundwater residence times. J. Hydrol. 2014, 510, 393–402. [Google Scholar] [CrossRef] [Green Version]
  43. Cardenas, M.B. Stream-aquifer interactions and hyporheic exchange in gaining and losing sinuous streams. Water Resour. Res. 2009, 45, 1–13. [Google Scholar] [CrossRef]
  44. Cardenas, M.B.; Wilson, J.L.; Zlotnik, V.A. Impact of heterogeneity, bed forms, and stream curvature on subchannel hyporheic exchange. Water Resour. Res. 2004, 40, 1–13. [Google Scholar] [CrossRef]
  45. Woessner, W.W. Stream and Fluvial Plain Ground Water Interactions: Rescaling Hydrogeologic Thought. Ground Water 2000, 38, 423–429. [Google Scholar] [CrossRef]
  46. Jarrett, R.D. Determination of Roughness Coefficients for Streams in Colorado; Water-Resources Investigations 85–4004; U.S. Geological Survey: Lakewood, CO, USA, 1985; p. 54.
  47. Steinman, F.; Banovec, P.; Gosar, L.; Rak, G.; Pogačnik, N.; Koželj, D.; Petkovšek, G.; Pipan, G.; Artač, M.; Šterk, M.; et al. Interactive Visualization of Floodplain Areas for Disaster Response Support; Final Report; Administration of the RS for Civil Protection and Disaster Relief, Ministry of Defence, Republic of Slovenia: Ljubljana, Slovenia, 2008; p. 258. (In Slovene)
  48. Diersch, H.J.G. FEFLOW Finite Element Modeling of Flow, Mass and Heat Transport in Porous and Fractured Media; Springer: Berlin/Heidelberg, Germany, 2014. [Google Scholar]
  49. Monninkhoff, L.; Hartnack, J. Improvements in the Coupling Interface between FEFLOW and MIKE11. 2009, pp. 1–12. Available online: https://pdfs.semanticscholar.org/aac7/a7ee00b41562869481555d7db99f2587c668.pdf?_ga=2.130108879.1923207088.1566342415-1995382604.1562081892 (accessed on 16 August 2017).
  50. Kaiser, B.O.; Scheck-Wenderoth, M.; Cacace, M.; Lewerenz, B. Characterization of main heat transport processes in the Northeast German Basin: Constraints from 3-D numerical models. Geochem. Geophys. Geosystems 2011, 12, 1–17. [Google Scholar] [CrossRef]
  51. Interpolation Methods. Available online: http://www.gisresources.com/types-interpolation-methods_3/ (accessed on 6 July 2017).
  52. FePEST in FEFLOW 7.0, User Guide. Available online: https://www.mikepoweredbydhi.com/download/product-documentation (accessed on 16 August 2017).
  53. Toews, M.; Daughney, C.J.; Cornaton, F.J.; Morgenstern, U.; Evison, R.D.; Jackson, B.M.; Petrus, K.; Mzila, D. Numerical simulation of transient groundwater age distributions assisting land and water management in the Middle Wairarapa Valley, New Zealand. Water Resour. Res. 2016, 52, 9430–9451. [Google Scholar] [CrossRef]
  54. Gusyev, M.A.; Toews, M.; Morgenstern, U.; Stewart, M.; White, P.; Daughney, C.; Hadfield, J. Calibration of a transient transport model to tritium data in streams and simulation of groundwater ages in the western Lake Taupo catchment, New Zealand. Hydrol. Earth Syst. Sci. 2013, 17, 1217–1227. [Google Scholar] [CrossRef] [Green Version]
  55. Sanford, W. Calibration of Models Using Groundwater Age. Hydrogeol. J. 2011, 19, 13–16. [Google Scholar] [CrossRef]
  56. Sheets, R.A.; Bair, E.S.; Rowe, G.L. Use of 3 H/3 He Ages to evaluate and improve groundwater flow models in a complex buried-valley aquifer. Water Resour. Res. 1998, 34, 1077–1089. [Google Scholar] [CrossRef]
  57. Doherty, J. Ground Water Model Calibration Using Pilot Points and Regularization. Ground Water 2003, 41, 170–177. [Google Scholar] [CrossRef]
  58. Andjelov, M.; Bat, M.; Frantar, P.; Mikulič, Z.; Savić, V.; Uhan, J. Pregled Elementov Vodne Bilance. In Podtalnica Ljubljanskega Polja; Rejec Brancelj, I., Smrekar, A., Kladnik, D., Eds.; Založba ZRC: Ljubljana, Slovenia, 2005; pp. 27–38. (In Slovene) [Google Scholar]
  59. Posavec, K.; Vukojević, P.; Ratkaj, M.; Bedeniković, T. Cross-Correlation Modelling of Surface Water—Groundwater Interaction Using the Excel Spreadsheet Application. Rud. Geološko Naft. Zb. 2017, 32, 25–32. [Google Scholar] [CrossRef]
  60. Post, V.E.A.; Von Asmuth, J.R.; Asmuth, J.R. Review: Hydraulic head measurements—New technologies, classic pitfalls. Hydrogeol. J. 2013, 21, 737–750. [Google Scholar] [CrossRef]
  61. Asmael, N.; Dupuy, A.; Huneau, F.; Hamid, S.; Le Coustumer, P. Groundwater Modeling as an Alternative Approach to Limited Data in the Northeastern Part of Mt. Hermon (Syria), to Develop a Preliminary Water Budget. Water 2015, 7, 3978–3996. [Google Scholar] [CrossRef] [Green Version]
  62. Bouaziz, L.; Weerts, A.; Schellekens, J.; Sprokkereef, E.; Stam, J.; Savenije, H.; Hrachowitz, M. Redressing the balance: Quantifying net intercatchment groundwater flows. Hydrol. Earth Syst. Sci. 2018, 22, 6415–6434. [Google Scholar] [CrossRef]
  63. Ackerman, D.J.; Rousseau, J.P.; Rattray, G.W.; Fisher, J.C. Steady-state and transient models of groundwater flow and advective transport, Eastern Snake River Plain aquifer, Idaho National Laboratory and vicinity, Idaho. Sci. Investig. Rep. 2010. [Google Scholar] [CrossRef]
  64. Zhou, Y.; Herath, H. Evaluation of alternative conceptual models for groundwater modelling. Geosci. Front. 2017, 8, 437–443. [Google Scholar] [CrossRef] [Green Version]
  65. Guastaldi, E.; Carloni, A.; Pappalardo, G.; Nevini, J. Geostatistical Methods for Lithological Aquifer Characterization and Groundwater Flow Modeling of the Catania Plain Quaternary Aquifer (Italy). J. Water Resour. Prot. 2014, 6, 272–296. [Google Scholar] [CrossRef] [Green Version]
  66. Anderson, M.P.; Woessner, W.W.; Hunt, R.J. Applied Groundwater Modeling Simulation of Flow and Advective Transporte, 2nd ed.; Elsevier Inc.: London, UK, 2015. [Google Scholar]
  67. Vrzel, J.; Ogrinc, N.; Vižintin, G. Data Preparation for Groundwater Modelling—Ljubljansko Polje Aquifer System. RMZ M&G 2015, 62, 167–173. [Google Scholar]
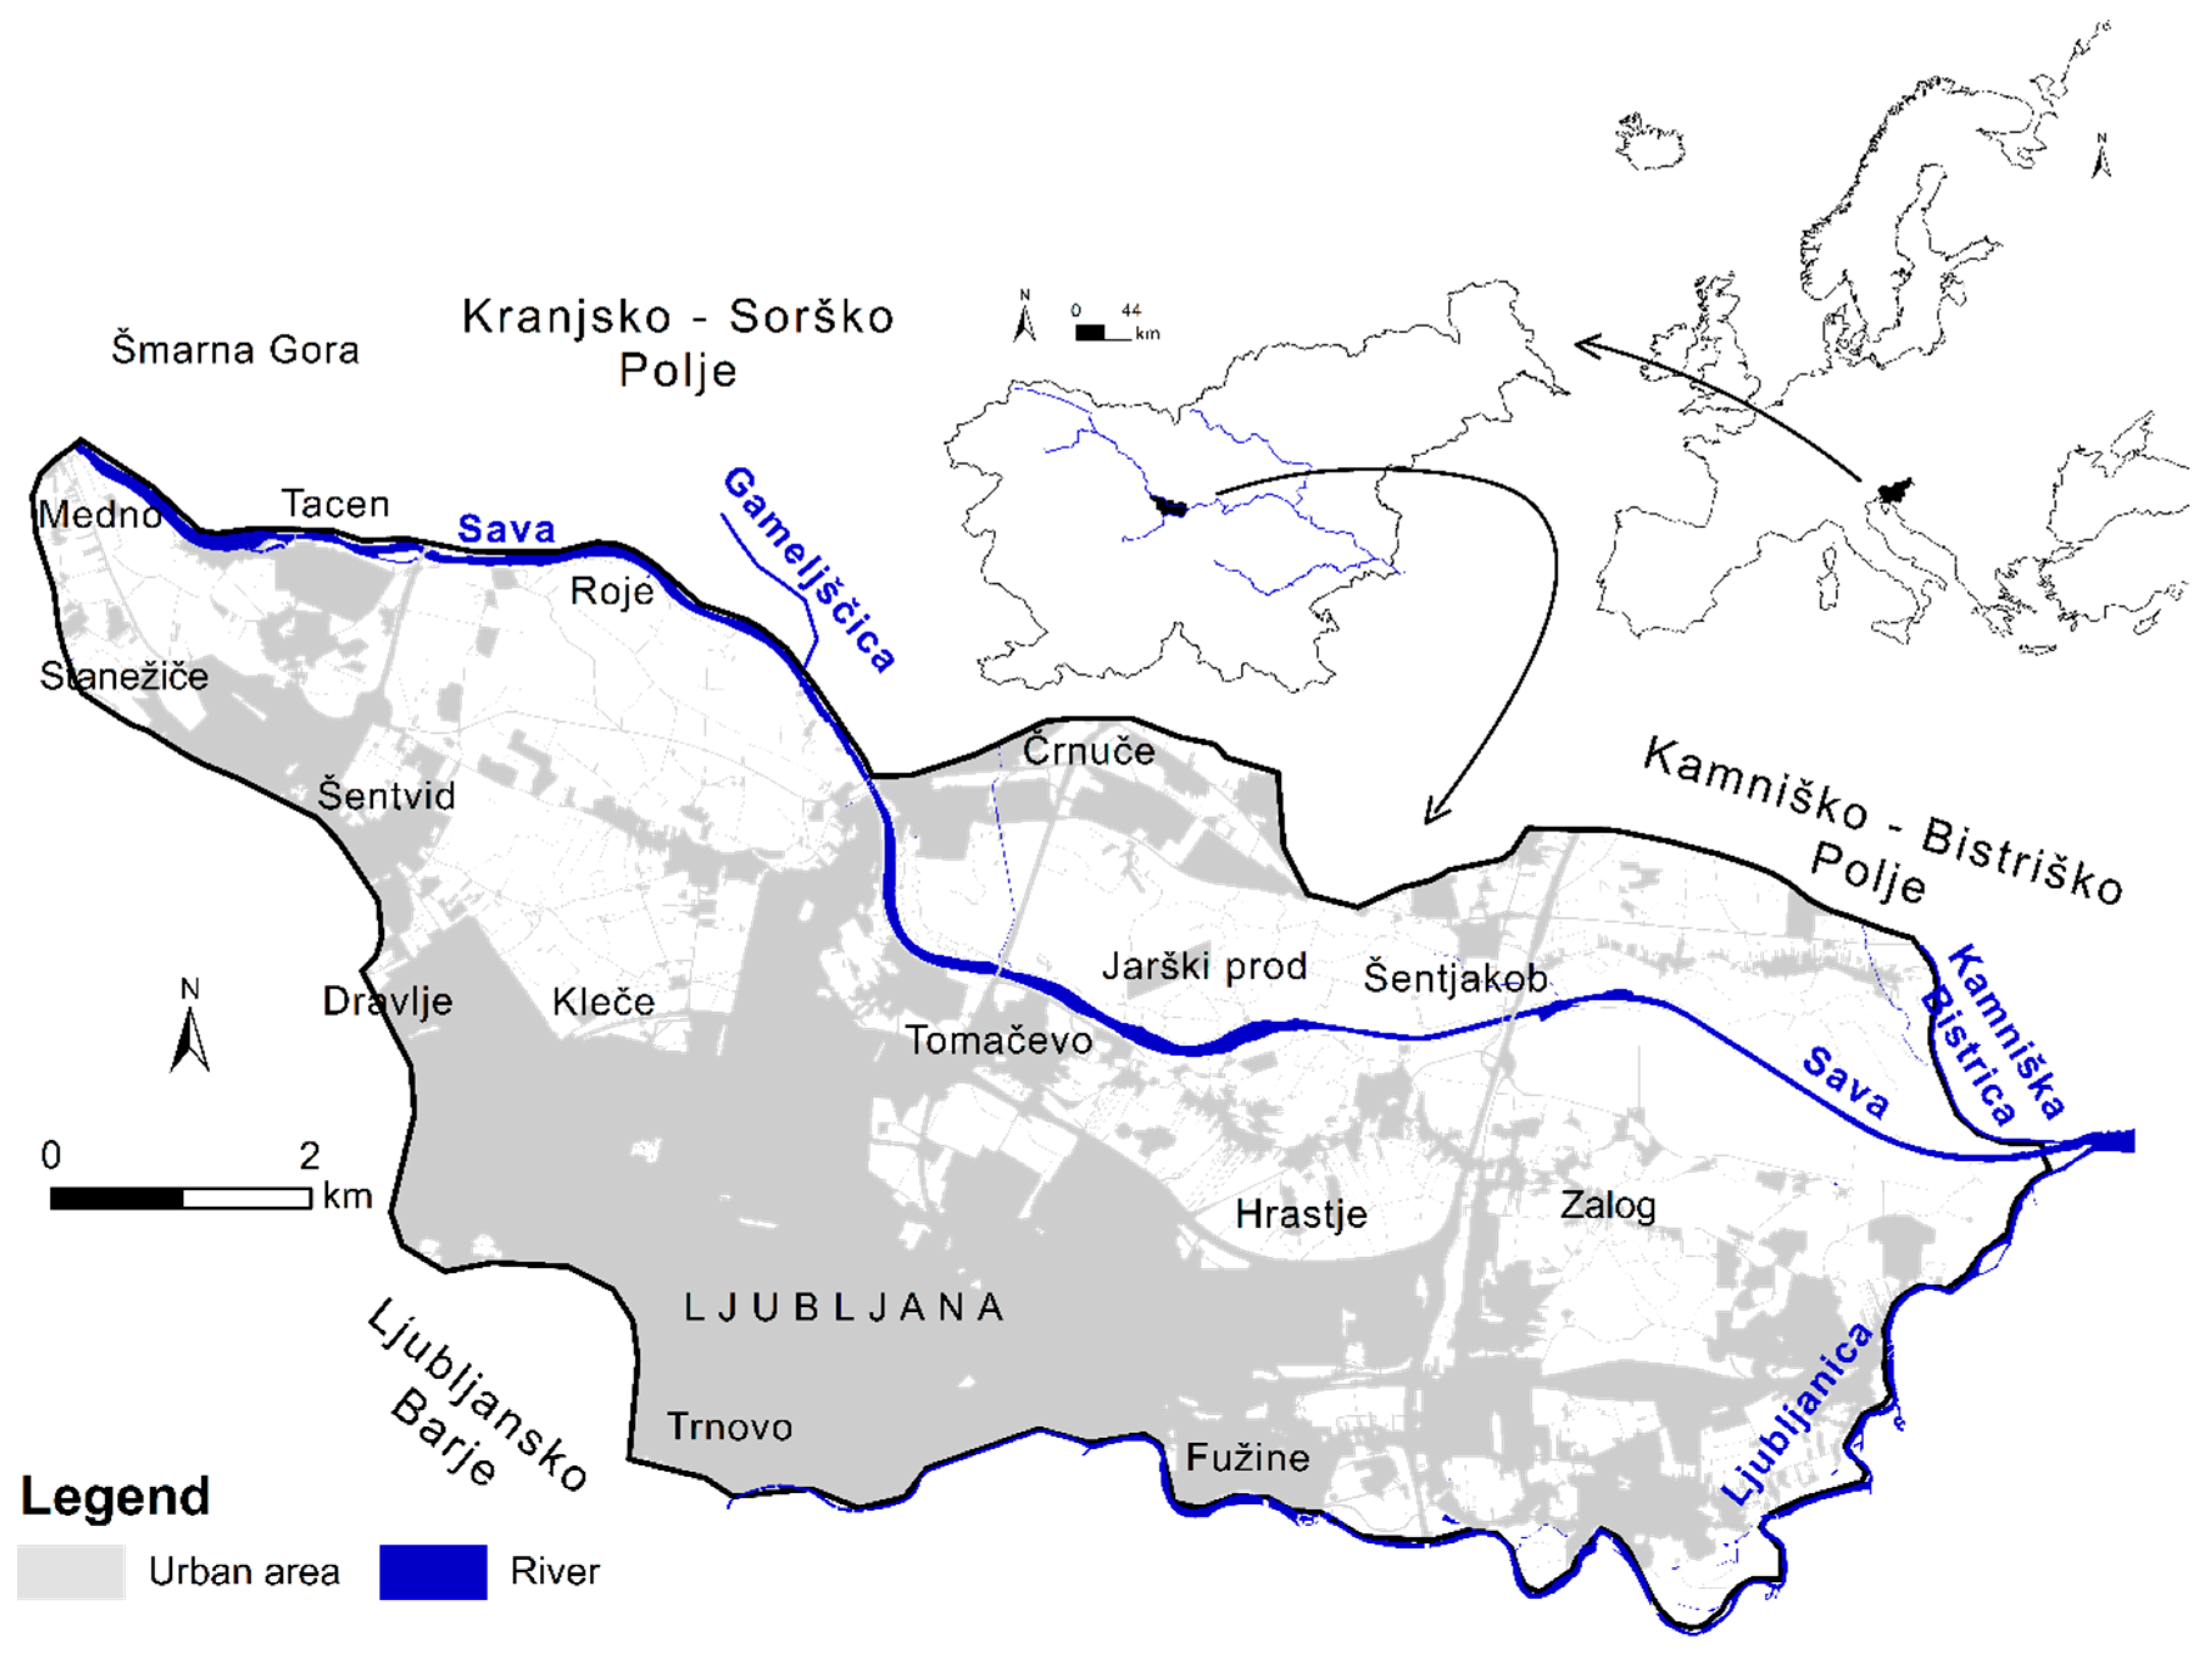
Figure 1. Map of the case study area–the Ljubljansko polje.
Water 11 01753 g001
Figure 2. Locations of pumping stations and wells with mean pumping rates in L s−1 for 2010–2011. Locations of piezometers (five groups), three meteorological stations, and three gauging stations on the Sava River and one on the Ljubljanica River. The Sava River cross-sections used in MIKE 11.
Water 11 01753 g002
Figure 3. The hydrological modeling framework.
Water 11 01753 g003
Figure 4. A framework of the modeling procedure with WaSiM.
Water 11 01753 g004
Figure 5. (a) Hydraulic head boundary condition (BC) and elevation of bedrock, and the (b) thickness of a sub-layer. Black crosses show locations of the Multilayer Well BC.
Water 11 01753 g005
Figure 6. (a) Topography of the study domain, and (b) inflow/outflow on top/bottom BCs. The In/outflow on top/bottom BCs represents the mean percolation for the period 2010–2011 or the steady-state GW flow model. Black crosses show locations of the multilayer well BC.
Water 11 01753 g006
Figure 7. Comparison of the calculated and measured soil moisture [40].
Water 11 01753 g007
Figure 8. Cross-correlogram between the hydraulic heads and local precipitation levels (dash line)/Sava River discharge (full line) in different time lag data of the hydraulic head. Locations of groups are shown in Figure 2.
Water 11 01753 g008
Figure 9. Simulated mean residence time. Black triangles show positions of pumping wells. The steady-state model gives a clear picture of groundwater flow recharge areas and BC. However, for understanding the system in time and under diverse climatic conditions, a transient state GW flow model is required.
Water 11 01753 g009
Figure 10. Daily precipitation observed in Bežigrad (mm) and percolation simulated in WaSiM (mm) for the full model domain–the Ljubljansko polje.
Water 11 01753 g010
Figure 11. Observed and simulated hydraulic heads for the groups presented in Figure 2. Hydraulic heads were simulated in FEFLOW for the period 1 January 2010–31 December 2011.
Water 11 01753 g011
Figure 12. The Sava River water-groundwater interactions areas, and mean seepage of river water into the aquifer (inflow) and vice versa (outflow) during 2010 (full line) and 2011 (dash line).
Water 11 01753 g012
Table 1. Soil texture classes for the Ljubljansko polje (TIS/ICPVO).
CodeSoil Texture TypeDescriptionPercentage (%)
1Artificial areaData cannot be defined39.60
2CoarseSand/Loamy/Sand/Sandy loam30.05
3Coarse–MediumSand/Loamy sand/Sandy loam/Sandy clay loam/Clay loam/Loam/Silt loam27.51
4MediumSandy clay loam/Clay loam/Loam/Silt loam2.77
5Medium–Fine–FineSandy clay loam/Clay loam/Loam/Silt loam/Silt/Silty clay loam/Silty clay/Sandy clay/Clay0.06
6Very fineSilt/Silty clay loam/Silty clay/Sandy clay/Clay0.01
Table 2. Land use classes for the Ljubljansko polje (CLC2006).
CodeLand Use TypePercentage (%)
1Heterogeneous agricultural areas15.72
2Arable land22.70
3Meadow0.31
4Mixed forest4.74
5Urban30.44
6Transitional woodland0.92
7Industrial area19.30
8Pastures2.92
9Water2.97
Table 3. Parameters used for the calibration (C) and validation (V) of the WaSiM model during different periods.
UseModuleParameterPeriodDescription
CEvapotranspirationReal ET (mm (dt)−1)1 January 2010–31 December 2014Calculated real ET was compared with the referential ET in Bežigrad (46°3′56″ N, 14°30′45″ E, altitude 299 m), which were calculated by ARSO (Source: http://meteo.arso.gov.si).
V1 January 2008–31 December 2009
CUnsaturated ZoneSoil moisture within the root zone (%)1 January 2012–31 December 2012Calculated soil moisture was compared with the observed soil moisture data in Kleče (46°5′11″ N, 14°29′56″ E, altitude 308 m) during the period January 2012–August 2012 [40].
CUnsaturated ZoneHydraulic head below the surface (m)1 January 2010–31 December 2014Trends of calculated percolation were compared with trends of the observed hydraulic head.
V1 January 2009–31 December 2009
Table 4. Hydraulic head BC set up parameters. Hydraulic head BC in Črnuče was later excluded.
LocationHydraulic Head BC Water 11 01753 i001
TrnovoP-102 + 0.48 m
DravljeP-038 + (−2.00–2.20 m)
RojeP-097 + (2.00–2.20 m)
StanežičeP−098 + 0.66 m
OutflowP-017 + (−3.69–0.51 m)
Table 5. Statistics of the calibrated models after steps one, two, and five. Statistics for the calibrated transient state model (after step five) are presented for two days 2 November 2010 and 1 July 2010, when the Sava River recharge was high and low, respectively.
Step 1
(Steady-State GW Flow Model)
Step 2
(Steady-State GW Flow Model + MRT)
Step 5
2 November 2010
(306 day)
Step 5
1 July 2010
(182 day)
Ē0.1250.2600.4450.943
RMS0.1690.3430.5631.062
σ0.1730.3510.5751.085