Hydro-Meteorological Trends in the Upper Omo-Ghibe River Basin, Ethiopia
Abstract
:1. Introduction
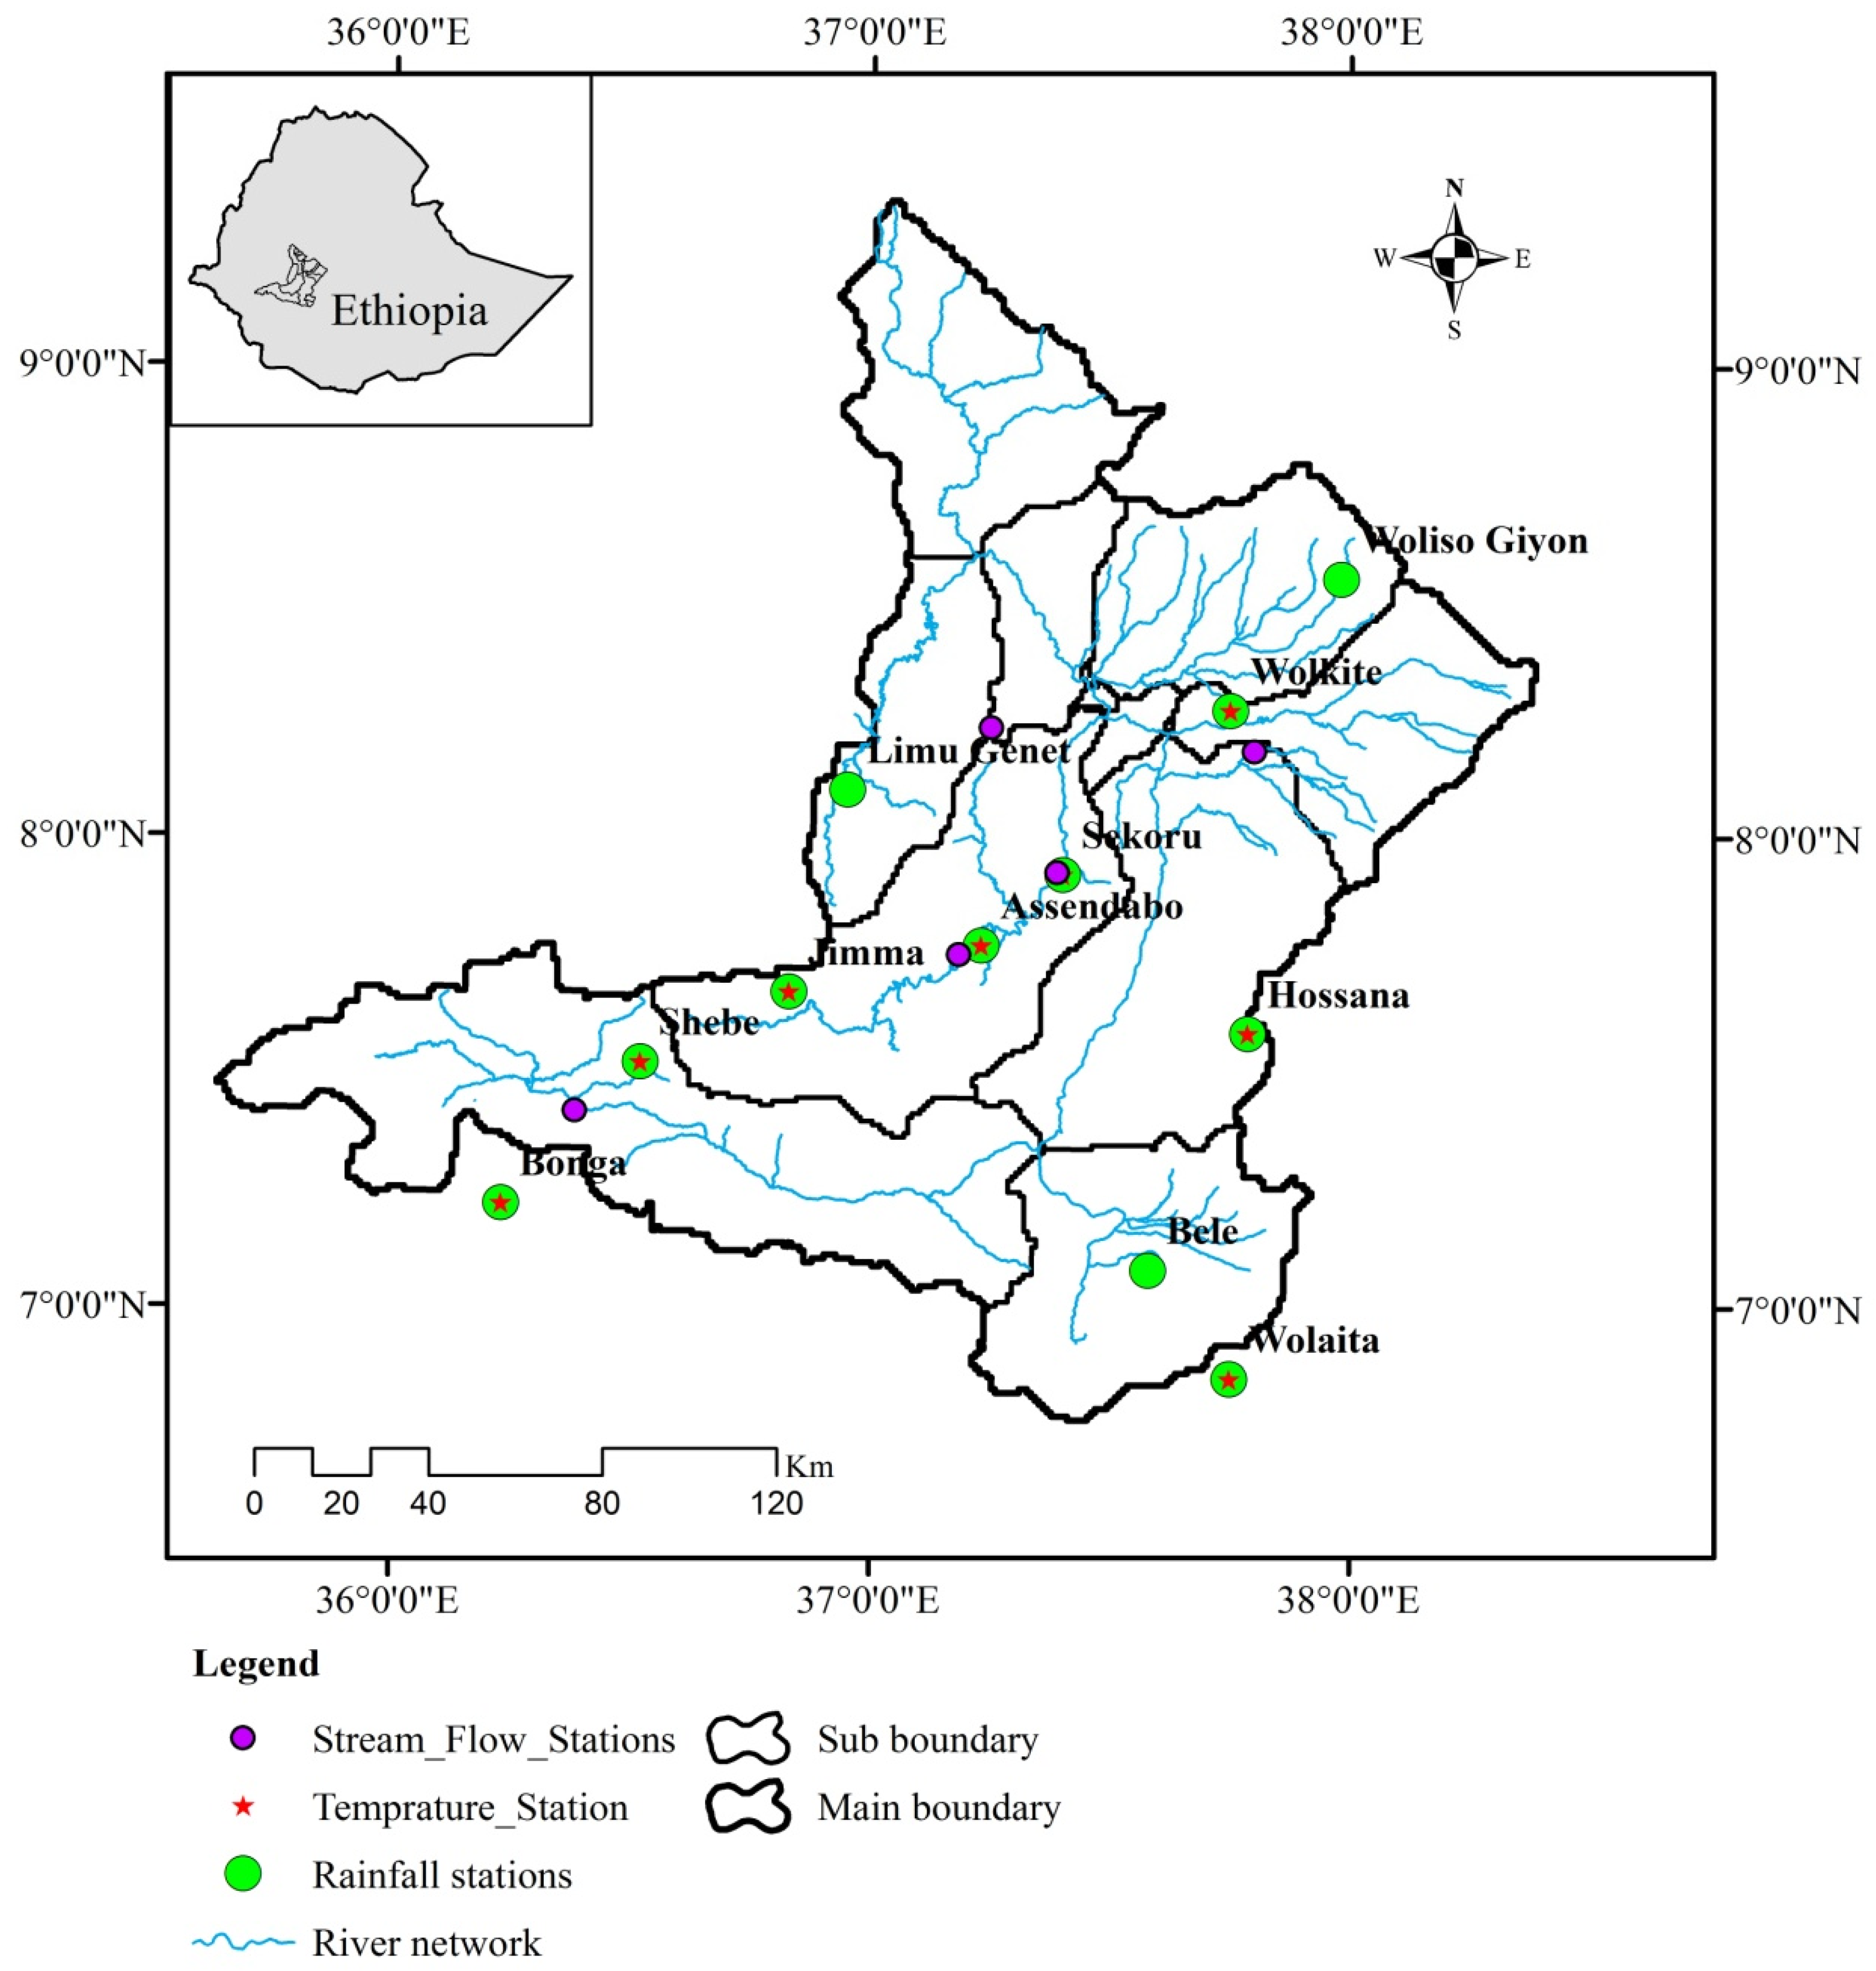
2. Study Area and Data Sources
2.1. Study Area
2.2. Data Sources
3. Methodology
Detection of Change Points with Pettit Test
4. Results
4.1. Temperature
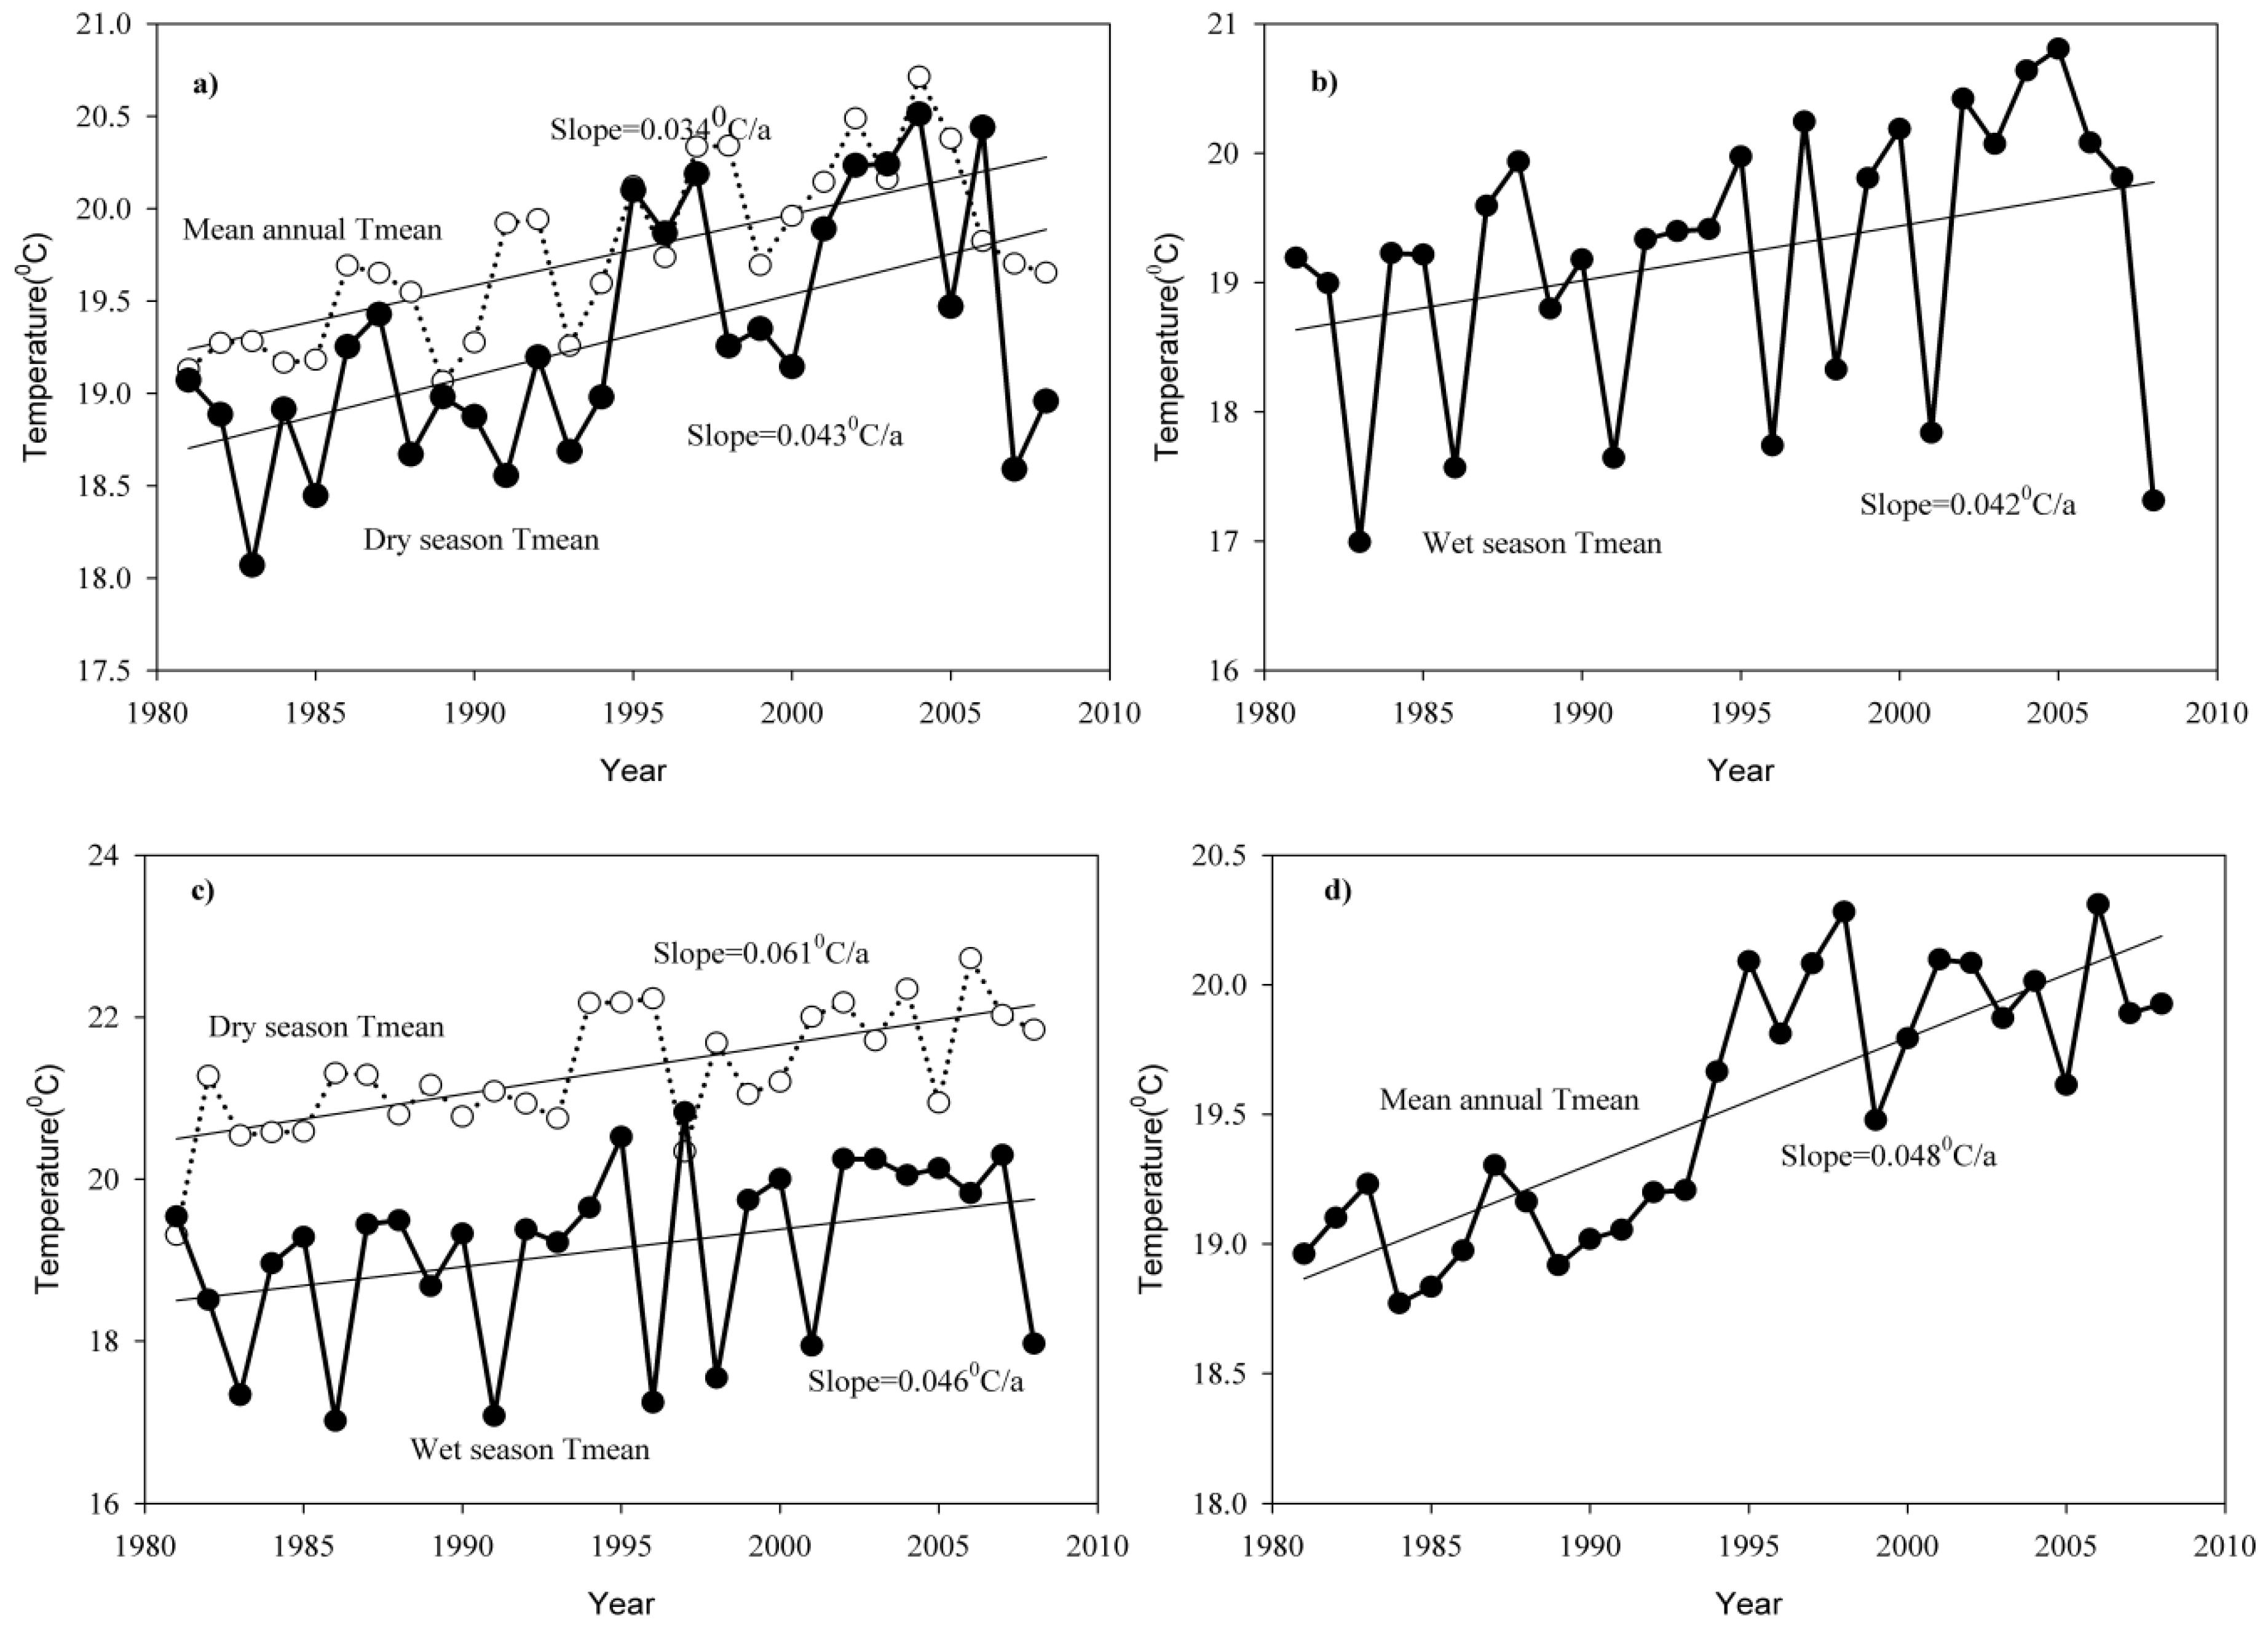
4.1.1. Temperature Trend Analysis
4.1.2. Detection of Change Points for Temperature Time Series
4.2. Rainfall
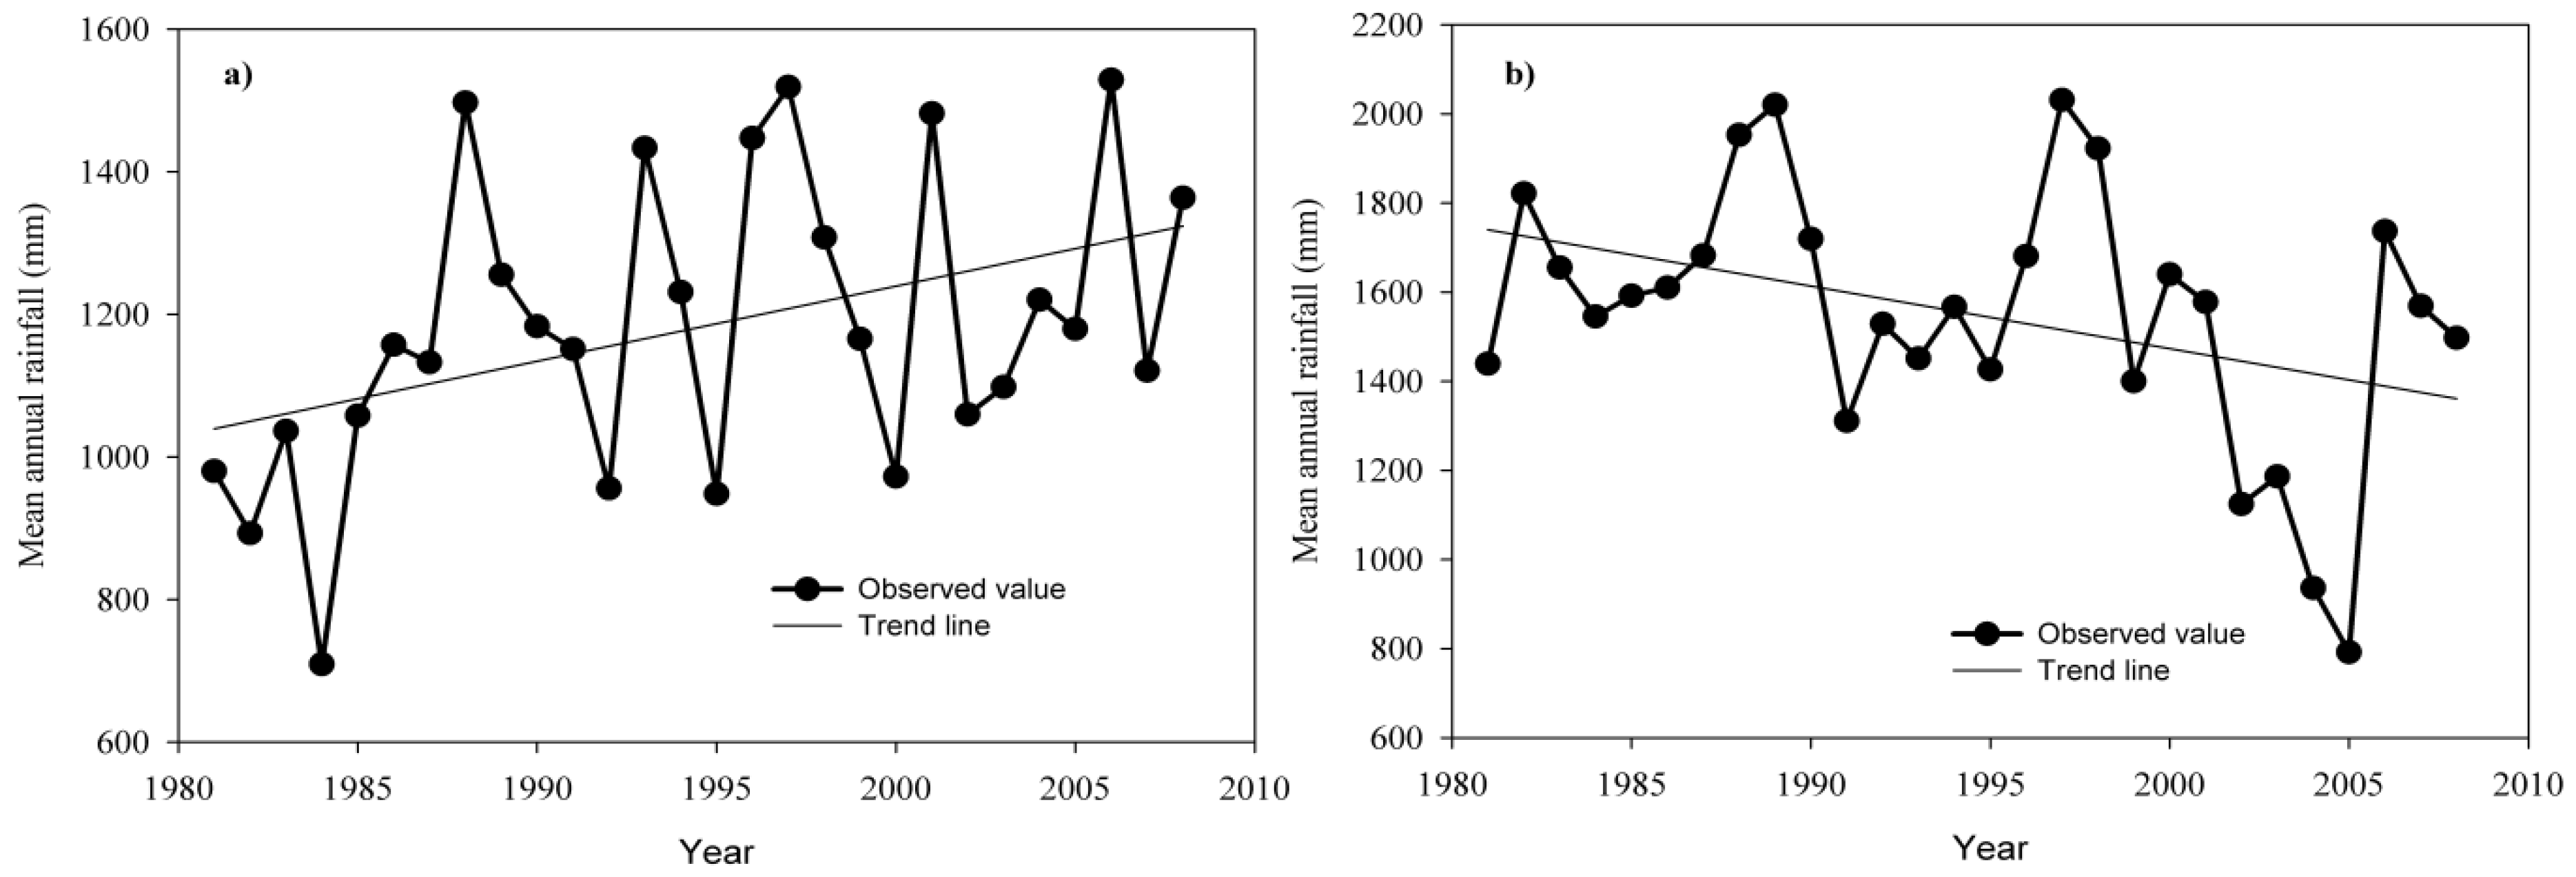
4.2.1. Annual Rainfall Trend
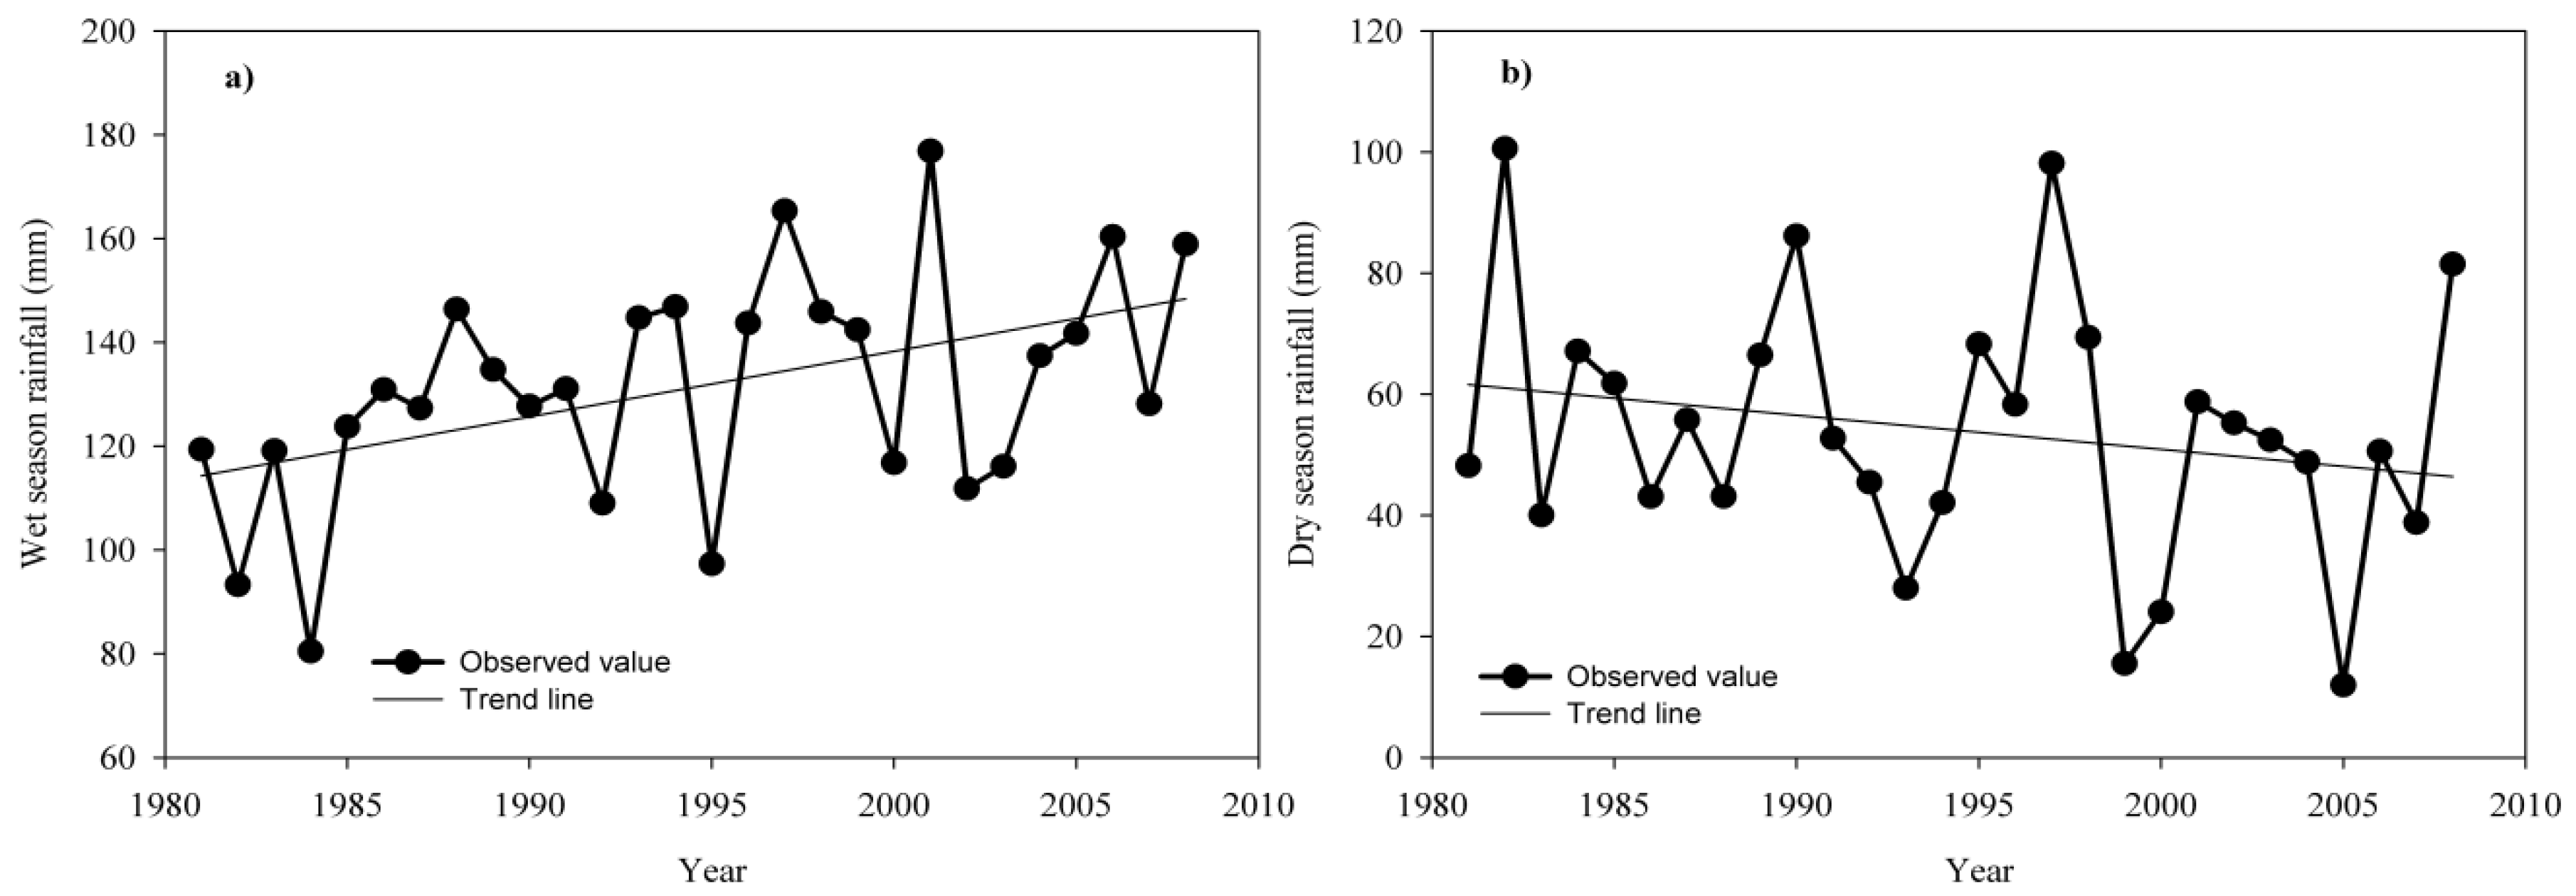
4.2.2. Seasonal Rainfall Trend
4.2.3. Monthly Rainfall Trends
4.2.4. Detection of Change Points for Annual Rainfall
4.2.5. Detection Change Points of Seasonal Rainfall
4.2.6. Detection Change Points of Monthly Rainfall
4.3. Streamflow
Detection of Change Points in Streamflow Time Series
4.4. Discussion
5. Conclusions
Author Contributions
Funding
Acknowledgments
Conflicts of Interest
References
- Alley, R.B. Wally Was Right: Predictive ability of the North Atlantic “Conveyor Belt” hypothesis for abrupt climate change. Annu. Rev. Earth Planet. Sci. 2007, 35, 241–272. [Google Scholar] [CrossRef]
- Miller, W.P.; Piechota, T.C. Regional analysis of trend and step changes observed in hydroclimatic variables around the Colorado River Basin. J. Hydrometeorol. 2008, 9, 1020–1034. [Google Scholar] [CrossRef]
- Abdul Aziz, O.I.; Burn, D.H. Trends and variability in the hydrological regime of the MackenziRiverBasin. J.Hydrol. 2006, 319, 282–294. [Google Scholar] [CrossRef]
- Rahman, M.A.; Yunsheng, L.; Sultana, N. Analysis and prediction of rainfall trends over Bangladesh using Mann–Kendall, Spearman’s rho tests and ARIMA model. Meteorol. Atmos. Phys. 2017, 129, 409–424. [Google Scholar] [CrossRef]
- Javari, M. Trend analysis of monthly rainfall over Atrak River Basin, Iran trend analysis of monthly rainfall over Atrak River. Int. J. Appl. Environ. Sci. 2017, 12, 1411–1448. [Google Scholar]
- Elsharkawy, S.G.; Elmallah, E.S. Spatiotemporal investigation of long-term seasonal temperature variability in Libya. Atmos. Res. 2015, 178–179, 535–549. [Google Scholar] [CrossRef]
- Tekleab, S.; Mohamed, Y.; Uhlenbrook, S. Hydro-climatic trends in the Abay/Upper Blue Nile basin, Ethiopia. Phys. Chem. Earth 2013, 61–62, 32–42. [Google Scholar] [CrossRef]
- Tesemma, Z.K.; Mohamed, Y.A.; Steenhuis, T.S. Trends in rainfall and runoff in the Blue Nile Basin: 1964-2003. Hydrol. Process 2010, 24, 3747–3758. [Google Scholar] [CrossRef] [Green Version]
- Conway, D. The climate and hydrology of the Upper Blue Nile River. Ethiop. J. Sci. 2000, 23, 139–161. [Google Scholar]
- Bewket, W.; Conway, D. A note on the temporal and spatial variability of rainfall in the drought-prone Amhara region of Ethiopia. Int. J. Climatol. 2007, 27, 1467–1477. [Google Scholar] [CrossRef]
- Cheung, W.H.; Senay, G.B.; Singh, A. Trends and spatial distribution of annual and seasonal rainfall in Ethiopia. Int. J. Climatol. 2008, 28, 1723–1734. [Google Scholar] [CrossRef]
- Jury, M.R.; Funk, C. Climatic trends over Ethiopia: Regional signals and drivers. Int. J. Climatol. 2013, 33, 1924–1935. [Google Scholar] [CrossRef]
- Seleshi, Y.; Zanke, U. Recent changes in rainfall and rainy days in Ethiopia. Int. J. Climatol. 2004, 24, 973–983. [Google Scholar] [CrossRef]
- Seleshi, Y.; Camberlin, P. Recent changes in dry spell and extreme rainfall events in Ethiopia. Theor. Appl. Climatol. 2006, 83, 181–191. [Google Scholar] [CrossRef]
- Kebede, G.; Bewket, W. Variations in rainfall and extrem event Indices in the western part of Ethiopia. J. Sci. 2009, 32, 129–140. [Google Scholar]
- Funk, C.; Rowland, J.; Eilerts, G.; Kebebe, E.; Biru, N.; White, L.; Galu, G. A Climate Trend Analysis of Ethiopia; U.S. Geological Survey Fact Sheet 2012–3053; United States Geological Survey: Reston, VA, USA, 2012.
- World Bank. Ethiopia: Managing Water Resources to Maximize Sustainable Growth: A World Bank Water Resources Assistance Strategy for Ethiopia; World Bank: Washington, DC, USA, 2006. [Google Scholar]
- NMSA (National Meteorological Service Agency). Climatic and Agro-Climatic Resources of Ethiopia; NMSA Meteorological Research Report Series; NMSA: Addis Ababa, Ethiopia, 1996; Volume 1, p. 137.
- Adnew, M.; Woldeamlak, D. Variability and trends in rainfall amount and extreme event indices in the Omo-Ghibe River Basin, Ethiopia. Reg. Environ. Change 2013. [Google Scholar] [CrossRef]
- MoWR (Ministry of Water Resources). Omo-Gibe River Basin Integrated Development Master Plan Study: Final Report; Volume I Executive Summary; MoWR: Addis Ababa, Ethiopia, 1996.
- Mann, H.B. Non parametric test against trend. Econometrica 1945, 13, 245–259. [Google Scholar] [CrossRef]
- Pettitt, A.N. A non-parametric approach to the change-point problem. Appl. Stat. 1979, 28, 126–135. [Google Scholar] [CrossRef]
- De Luis, M.; Raventos, J.; Gonazalez-Hidalgob, J.; Sanchez, J.R.; Cortina, J. Spatial anlysis of rainfall trends in the region of Valencia (East Spain). Int. J. Climatol. 2000, 1469, 1451–1469. [Google Scholar] [CrossRef]
- Hamed, K.H. Trend detection in hydrologic data: The Mann–Kendall trend test under the scaling hypothesis. J. Hydrol. 2008, 349, 350–363. [Google Scholar] [CrossRef]
- Shahid, S. Rainfall variability and the trends of wet and dry periods in Bangladesh. Int. J. Climatol. 2009, 30, 2299–2313. [Google Scholar] [CrossRef]
- Yue, S.; Pilon, P. A comparison of the power of the t test, Mann-Kendall and bootstrap tests for trend detection. Hydrol. Sci. J. 2004, 49, 21–38. [Google Scholar] [CrossRef]
- Hess, A.; Iyer, H.; Malm, W. Linear trend analysis: A comparison of methods. Atmos. Environ. 2001, 35, 5211–5222. [Google Scholar] [CrossRef]
- Helsel, D.R.; Hirsch, R.M. Studies in Environmental Science. In Statistical Methods in Water Resources; Elsevier: Amsterdam, The Netherlands, 1992; p. 546. [Google Scholar]
- Yue, S.; Pilon, P.; Phinney, B.; Cavadias, G. The influence of autocorrelation on the ability to detect trend in hydrological series. Hydrol. Process 2002, 16, 1807–1829. [Google Scholar] [CrossRef]
- Love, D.; Uhlenbrook, S.; Twomlow, S.; Van Der Zaag, P. Changing rainfall and discharge patterns in the northern Limpopo Basin, Zimbabwe. Water SA 2010, 36, 335–350. [Google Scholar]
- Mu, X.; Zhang, L.; McVicar, T.R.; Chille, B.; Gau, P. Analysis of the impact of conservation measures on stream flow regime in catchments of the Loess Plateau, China. Hydrol. Process 2007, 21, 2124–2134. [Google Scholar] [CrossRef]
- Korecha, D. Characterizing the Predictability of Seasonal Climate in Ethiopia., Norway. PhD. Thesis, University of Bergen, Bergen, Norway, 2013. [Google Scholar]
- NMSA. Climate Change National Adaptation Programme of Action (NAPA) of Ethiopia; The Federal Democratic Republic of Ethiopia (FDRE), Ministry of Water Resources: Addis Ababa, Ethiopia, 2007.
- Abdo, K.S.; Fiseha, B.M.; Rientjes, T.H.M.; Gieske, A.S.M.; Haile, A.T. Assessment of climate change impacts on the hydrology of Gilgel Abay catchment in Lake Tana basin, Ethiopia. Hydrol. Process 2009, 23, 3661–3669. [Google Scholar] [CrossRef]
- Elshamy, M.E.; Seierstad, I.A.; Sorteberg, A. Impacts of climate change on Blue Nile flows using bias-corrected GCM scenarios. Hydrol. Earth Syst. Sci. 2009, 13, 551–565. [Google Scholar] [CrossRef] [Green Version]
- EPCC. Ethiopian Panel on Climate Change first Assessment Report, Agriculture and Food Security (Working Group II); Ethiopian Academy of Sciences: Addis Ababa, Ethiopia, 2015. [Google Scholar]
- Demissie, A.; Saathoff, F.; Seleshi, Y. Trends of hydro-meteorological data and impact of climate change on the streamflow of Gilgel Gibe 1 River Basin-Ethiopia. Int. J. Curr. Res. 2013, 5, 2988–2993. [Google Scholar]
- Viste, E.; Korecha, D.; Sorteberg, A. Recent drought and precipitation tendencies in Ethiopia. Theor. Appl. Climatol. 2013, 112, 535–551. [Google Scholar] [CrossRef]
- Degefu, M.A.; Bewket, W. Variability, trends, and teleconnections of stream flows with large-scale climate signals in the Omo-Ghibe River Basin, Ethiopia. Environ. Monit. Assess 2017, 189, 142. [Google Scholar] [CrossRef] [PubMed]

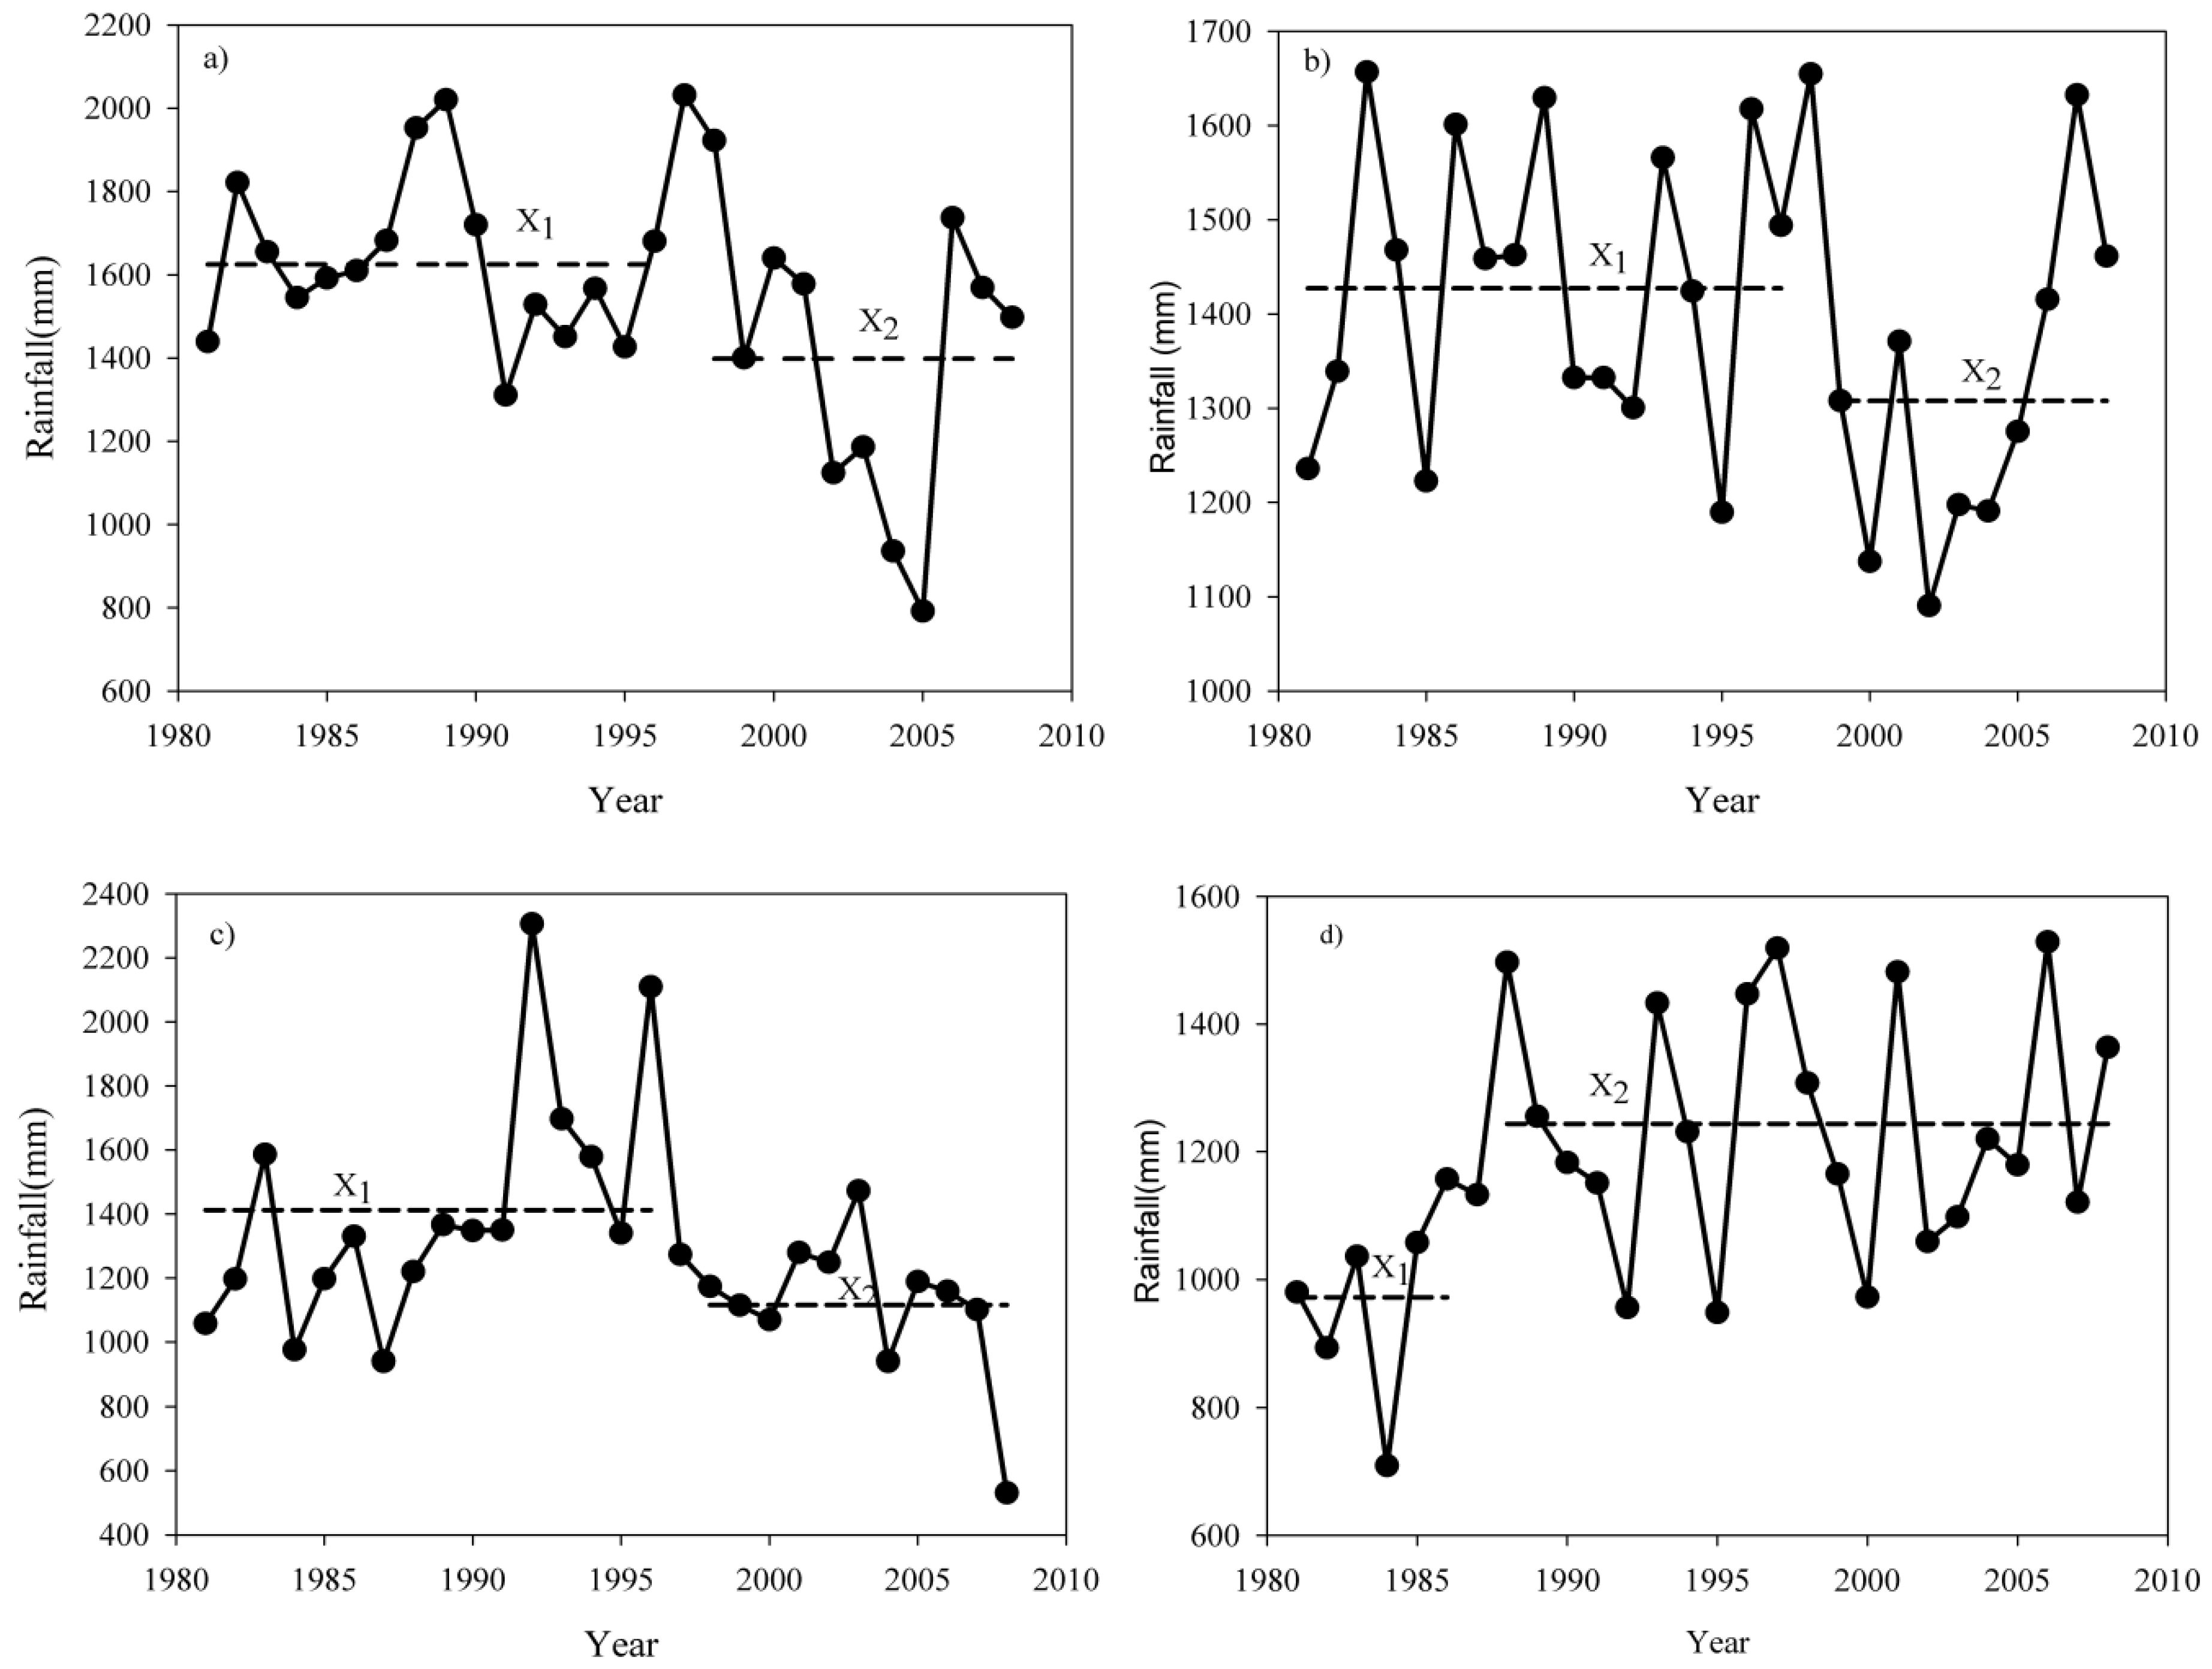
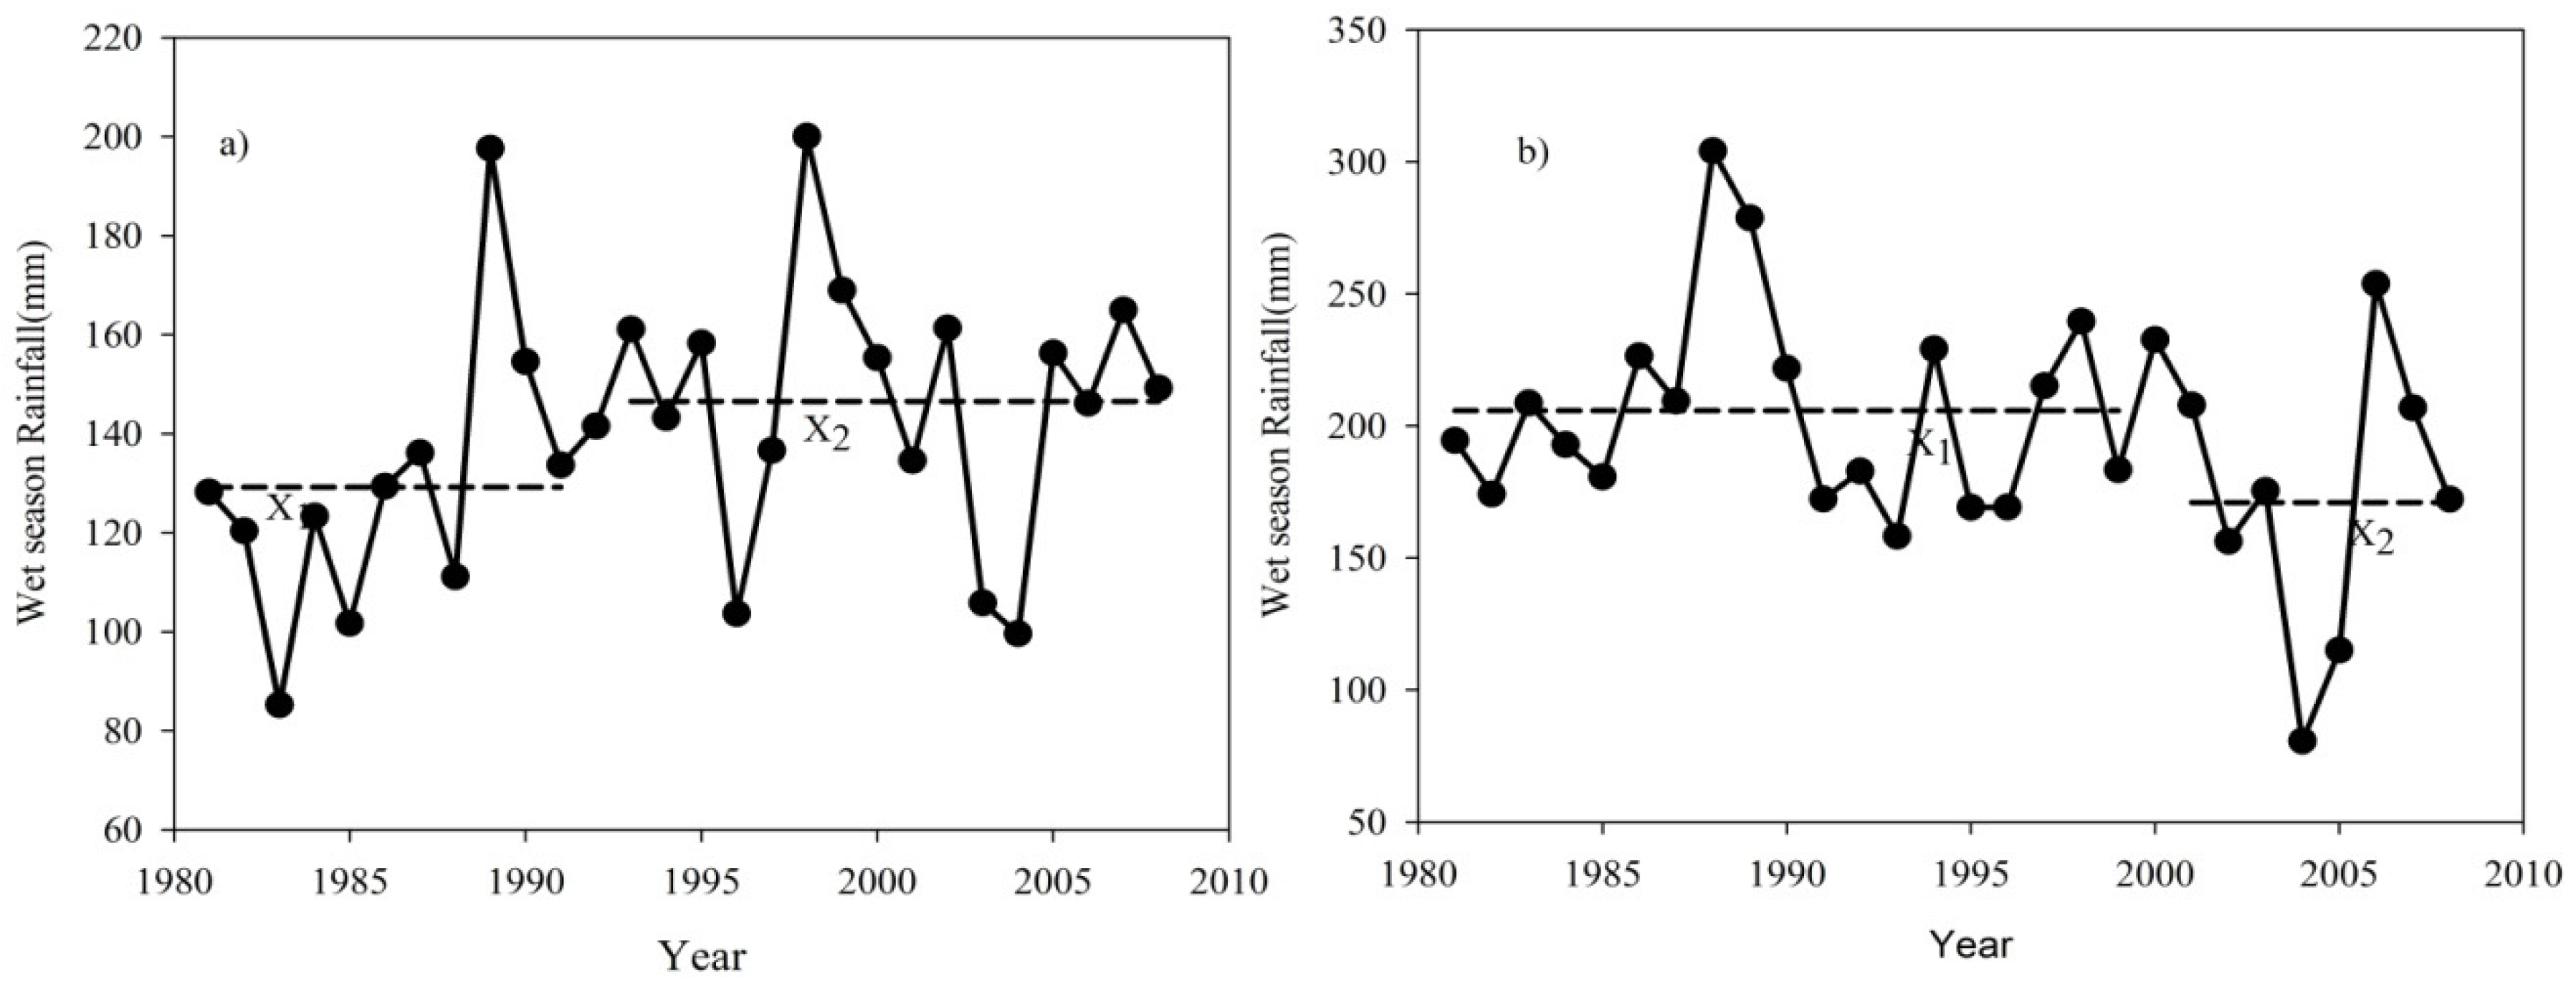
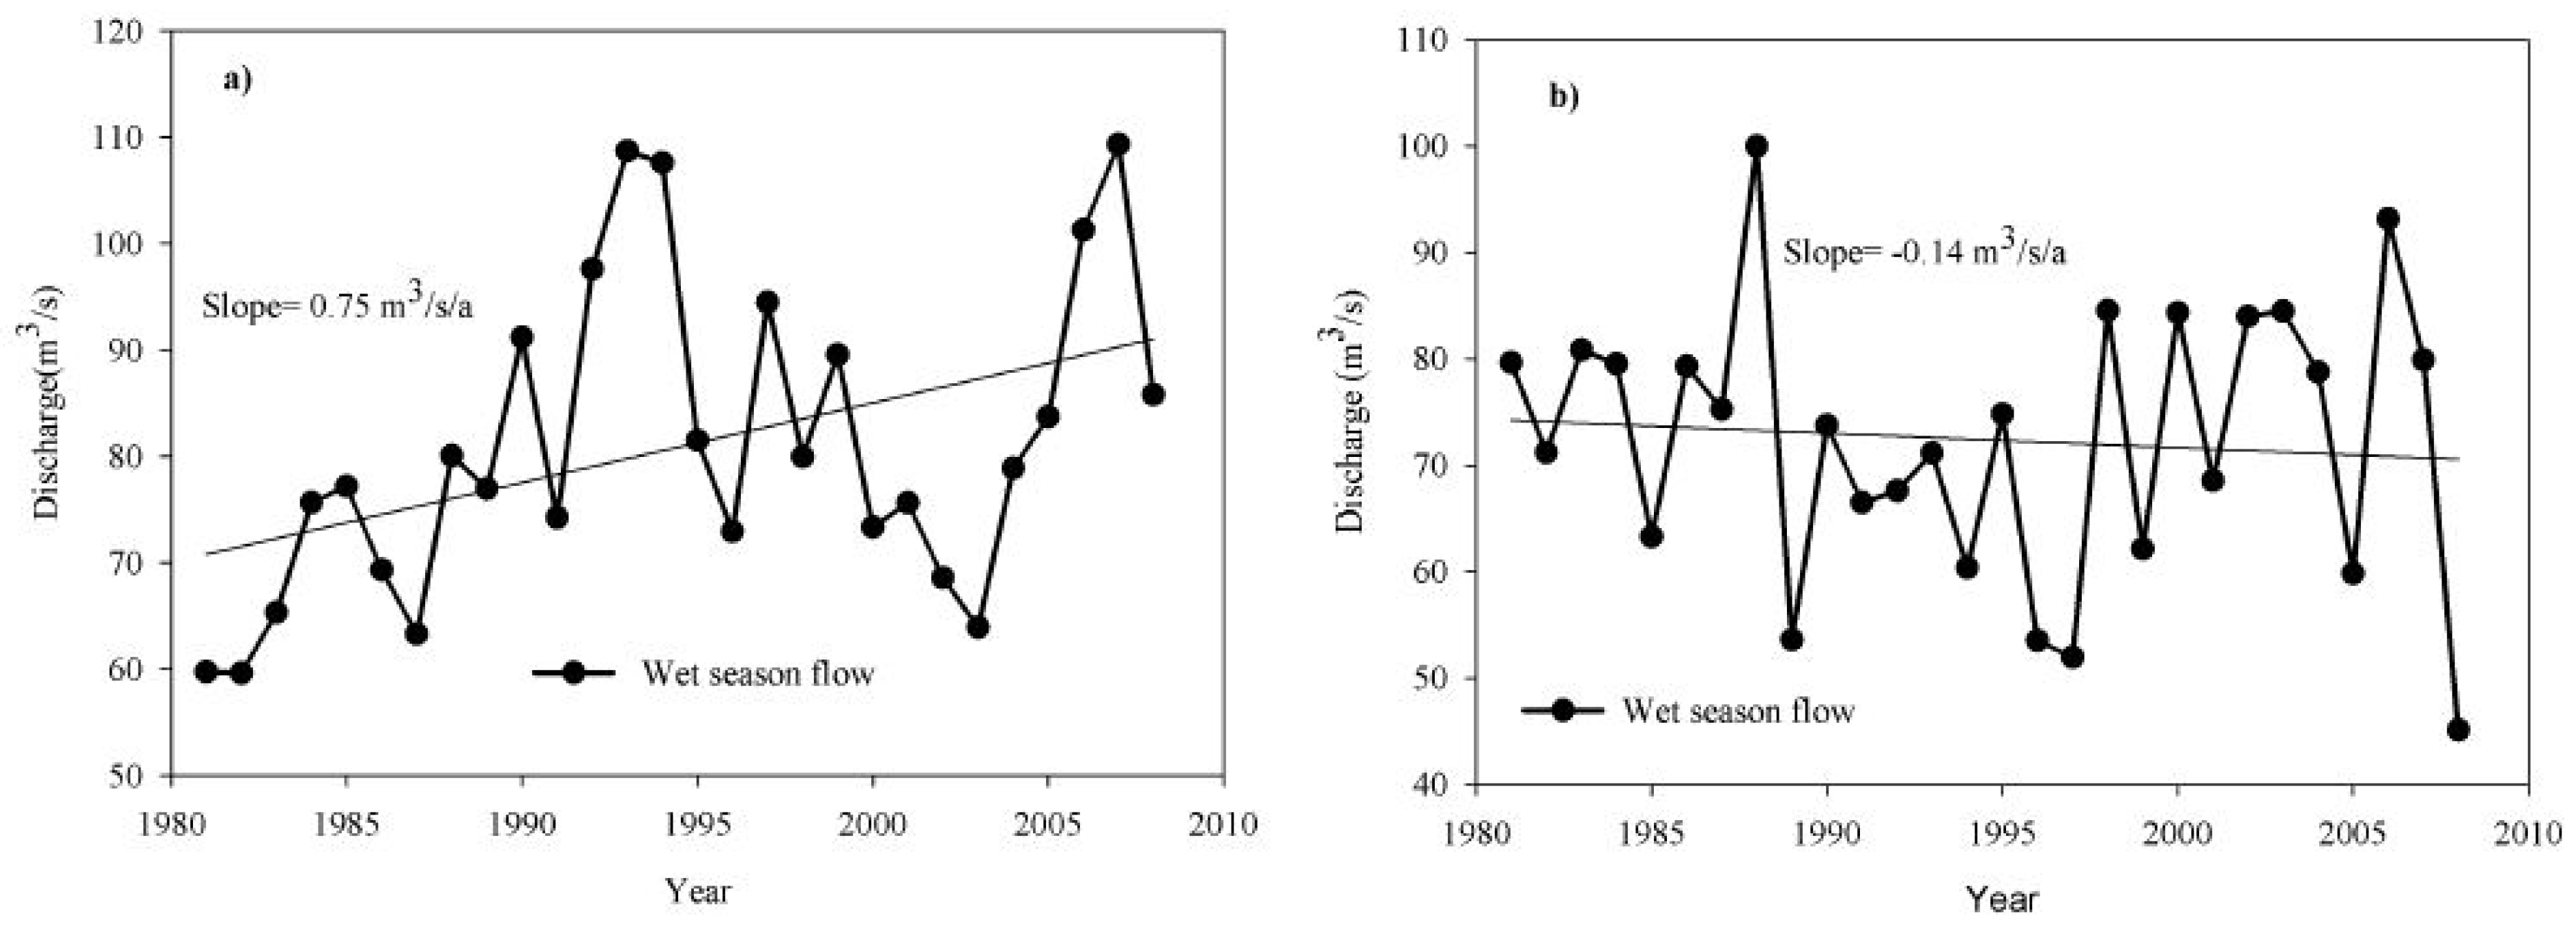

| Stations | Mean Annual | Wet Season | Dry Season |
|---|---|---|---|
| Assendabo | 1995(+), 0.00 | 1987(+), 0.01 | 1992(+), 0.00 |
| 1987(−), 0.09 | 1982(−), 0.11 | 1988(−), 0.15 | |
| 1995(+), 0.00 | 1997(+), 0.05 | 1995(+), 0.00 | |
| Bonga | 1985(+), 0.25 | 2000(+), 0.12 | 1987(+), 0.04 |
| 1996(−), 0.21 | 1996(−), 0.16 | 1997(−), 0.40 | |
| 1985(+), 0.11 | 1985(+), 0.30 | 1985(+), 0.07 | |
| Hossana | 1999(−), 0.41 | 1986(+), 0.42 | 1996(−), 0.16 |
| 1988(−), 0.11 | 1986(−), 0.03 | 1991(−), 0.05 | |
| 1988(−), 0.70 | 1996(−), 0.67 | 1995(−), 0.54 | |
| Jimma | 1994(+), 0.00 | 1993(+), 0.03 | 1989(+), 0.02 |
| 1994(+), 0.00 | 1997(+), 0.04 | 1998(+), 0.00 | |
| 1994(+), 0.00 | 1992(+), 0.05 | 1994(+), 0.00 | |
| Sekoru | 1993(−), 0.16 | 1993(−), 0.22 | 1987(+), 0.15 |
| 1988(−), 0.16 | 1986(−), 0.53 | 1988(−), 0.25 | |
| 1993(−), 0.28 | 1996(−), 0.53 | 2002(+), 0.44 | |
| Shebe | 1993(−), 0.06 | 1990(−), 0.61 | 1991(−), 0.32 |
| 2001(−), 0.07 | 2001(−), 0.41 | 2001(−), 0.08 | |
| 1999(−), 0.08 | 1993(-), 0.41 | 1993(−), 0.03 | |
| Wolkite | 2002(+), 0.00 | 2002(+), 0.01 | 2000(+), 0.00 |
| 1999(+), 0.02 | 1997(+), 0.03 | 1999(+), 0.01 | |
| 1996(+), 0.00 | 2002(+), 0.01 | 1994(+), 0.00 | |
| Wolita | 1991(+), 0.03 | 1999(+), 0.01 | 1999(+), 0.05 |
| 1987(+), 0.02 | 2002(+), 0.23 | 1994(+), 0.14 | |
| 1995(+), 0.07 | 2002(−), 0.40 | 1987(+), 0.03 |
| Meteorological Station | Mean Annual Rainfall (mm/year) | CV (%) for Rainfall Data | CV (%) for Temp. Data | Mean Annual Temp. (°C) | Elevation (m.a.s.l) | % Rainfall Record | Missing Aver. Temp. Record |
|---|---|---|---|---|---|---|---|
| Assendabo | 1181 | 17.38 | 2.49 | 19.70 | 2400 | 0.28 | 1.6 |
| Bele | 1730 | 29.38 | _ | _ | 1200 | 3.81 | _ |
| Bonga | 1631 | 12.84 | 3.78 | 19.34 | 1650 | 3.65 | 3.06 |
| Hossana | 1146 | 22.71 | 5.70 | 17.08 | 1200 | 4.01 | 2.86 |
| Jimma | 1520 | 13.19 | 2.48 | 19.52 | 1725 | 0.01 | 0.02 |
| Limugenet | 1759 | 15.53 | _ | _ | 1690 | 9.86 | _ |
| Sekoru | 1390 | 12.17 | 4.50 | 19.61 | 2100 | 5.08 | 6.03 |
| Shebe | 1550 | 18.65 | 4.18 | 19.12 | 1635 | 8.03 | 8.12 |
| Wolita | 1251 | 28.35 | 2.02 | 19.08 | 1300 | 1.86 | 5.04 |
| Woliso | 1241 | 12.09 | _ | _ | 2000 | 7.05 | _ |
| Wolkite | 1277 | 27.30 | 5.47 | 20.31 | 1550 | 8.06 | 6.12 |
| Stations | Mean Annual (mm) | CV % | Mann-Kendall “Z” Statistics and “p” Value in (Brackets) | ||
|---|---|---|---|---|---|
| Annual | Wet Season | Dry Season | |||
| Assendabo | 1181 | 17.38 | 2.21 (0.01) | 2.29 (0.01) | 0.67 (0.25) |
| Bele | 1730 | 29.38 | 1.21 (0.03) | 1.76 (0.04) | 0.16 (0.44) |
| Bonga | 1631 | 12.84 | −0.79 (0.48) | 1.03 (0.20) | −1.42 (0.92) |
| Hossana | 1146 | 22.71 | 0.87 (0.19) | 1.70 (0.04) | 0.00 (0.50) |
| Jimma | 1520 | 13.19 | 1.03 (0.20) | 1.22 (0.11) | −0.67 (0.75) |
| Limugenet | 1759 | 15.53 | −0.54 (0.74) | −0.14 (0.52) | −0.16 (0.56) |
| Sekoru | 1390 | 12.17 | −1.97 (0.03) | −1.34 (0.71) | −0.22 (0.59) |
| Shebe | 1550 | 18.65 | −1.98 (0.04) | −1.34 (0.90) | −1.99 (0.04) |
| Wolita | 1251 | 28.35 | 1.26 (0.10) | 1.38 (0.08) | 1.21 (0.29) |
| Woliso | 1241 | 12.09 | −0.51 (0.70) | −0.67 (0.75) | 0.55 (0.29) |
| Wolkite | 1277 | 27.30 | −1.11 (0.87) | −1.15 (0.87) | −0.40 (0.65) |
| River Name | Catchment Area (km2) | Mean Annual Stream Flow (m3/s) | CV (%) | Stream Location | Period of Records | % Age of Missing Value |
|---|---|---|---|---|---|---|
| Gilgel Gibe | 2966 | 39.49 | 27.17 | Assendabo | 1981–2008 | - |
| Bidru Awana | 41 | 0.43 | 42 | Sekoru | 1981–2008 | - |
| Gojeb | 3577 | 54.34 | 19.02 | Shebe | 1981–2008 | 0.5 |
| Wabi | 1866 | 34.79 | 37.28 | Wolkite | 1981–2008 | 0.36 |
| Great Gibe | 15,690 | 195.53 | 34.03 | Abelti | 1981–2008 | 0.48 |
| Stream Flow Variables | Stations | ||||
|---|---|---|---|---|---|
| Assendabo | Sekoru | Shebe | Wolkite | Abelti | |
| Mean annual | +1.74 (0.04) | −0.83 (0.81) | −0.20 (0.58) | −0.22 (0.59) | +0.83 (0.20) |
| Wet season | +2.29 (0.01) | −0.63 (0.74) | −0.43 (0.67) | −0.12 (0.55) | +1.19 (0.12) |
| Dry season | +0.63 (0.26) | −0.12 (0.45) | −1.70 (0.04) | −0.77 (0.78) | +1.11 (0.13) |
| January | +2.92 (0.00) | +1.09 (0.14) | +1.86 (0.03) | +0.63 (0.26) | +2.88 (0.00) |
| February | +3.08 (0.00) | +0.26 (0.60) | −2.29 (0.01) | −2.73 (0.00) | +3.04 (0.00) |
| March | +1.90 (0.03) | −0.12 (0.55) | −2.57 (0.01) | +0.32 (0.38) | +3.00 (0.00) |
| April | +2.17 (0.01) | +0.91 (0.18) | +1.13 (0.02) | +0.34 (0.37) | +2.73 (0.00) |
| May | +2.29 (0.01) | −0.51 (0.70) | +0.63 (0.26) | +0.26 ((0.40) | +2.96 (0.00) |
| June | +0.87 (0.19) | −1.01 (0.84) | +0.32 (0.38) | −0.43 (0.67) | +2.37 (0.01) |
| July | +1.58 (0.06) | −0.65 (0.74) | −1.22 (0.89) | +0.20 (0.42) | +1.50 (0.07) |
| August | +1.54 (0.94) | −1.28 (0.10) | −1.82 (0.03) | −0.04 (0.48) | +0.28 (0.61) |
| September | +0.63 (0.26) | −1.13 (0.87) | −1.15 (0.87) | −0.97 (0.83) | +0.63 (0.26) |
| October | +0.36 (0.36) | −0.08 (0.53) | +0.12 (0.45) | +0.16 (0.44) | +0.40 (0.35) |
| November | +0.99 (0.16) | −1.32 (0.91) | +0.00 (0.50) | +1.09 (0.14) | +0.85 (0.20) |
| December | +2.05 (0.98) | −0.43 (0.33) | −2.37 (0.01) | +0.18 (0.57) | +1.50 (0.93) |
© 2019 by the authors. Licensee MDPI, Basel, Switzerland. This article is an open access article distributed under the terms and conditions of the Creative Commons Attribution (CC BY) license (http://creativecommons.org/licenses/by/4.0/).
Share and Cite
Jaweso, D.; Abate, B.; Bauwe, A.; Lennartz, B. Hydro-Meteorological Trends in the Upper Omo-Ghibe River Basin, Ethiopia. Water 2019, 11, 1951. https://doi.org/10.3390/w11091951
Jaweso D, Abate B, Bauwe A, Lennartz B. Hydro-Meteorological Trends in the Upper Omo-Ghibe River Basin, Ethiopia. Water. 2019; 11(9):1951. https://doi.org/10.3390/w11091951
Chicago/Turabian StyleJaweso, Dessalegn, Brook Abate, Andreas Bauwe, and Bernd Lennartz. 2019. "Hydro-Meteorological Trends in the Upper Omo-Ghibe River Basin, Ethiopia" Water 11, no. 9: 1951. https://doi.org/10.3390/w11091951
APA StyleJaweso, D., Abate, B., Bauwe, A., & Lennartz, B. (2019). Hydro-Meteorological Trends in the Upper Omo-Ghibe River Basin, Ethiopia. Water, 11(9), 1951. https://doi.org/10.3390/w11091951


