Article

Hydro-Meteorological Trends in the Upper Omo-Ghibe River Basin, Ethiopia

1
Institute of Technology, Hawassa University, Hawassa 05, Ethiopia
2
Faculty of Agricultural and Environmental Sciences, University of Rostock, 18059 Rostock, Germany
3
College of Architecture and Civil Engineering, Addis Ababa Science and Technology University, Addis Ababa 16417, Ethiopia
*
Author to whom correspondence should be addressed.
Water 2019, 11(9), 1951; https://doi.org/10.3390/w11091951
Submission received: 29 July 2019 / Revised: 11 September 2019 / Accepted: 13 September 2019 / Published: 19 September 2019
(This article belongs to the Special Issue Hydroclimatic Variability at Local, Regional, and Global Scales)

Abstract

:
This study aimed to assess trends of hydro-meteorological variables in the Upper Omo-Ghibe river basin, Ethiopia. Data records from eleven rainfall, eight air temperature, and five streamflow stations between 1981 to 2008 were investigated. The trends and change points were evaluated for different periods of time depending on data availability. Mann-Kendall and Pettit tests were used to identify trends and change points at a 5% significance level. The tests were applied to mean annual, monthly and seasonal time scales. Rainfall exhibited statistically decreasing trends at a mean annual time scale, while seasonal rainfall depicted heterogeneous results in both directions. For the majority of the stations, air temperature showed statistically significant increasing trends. The magnitude of change in temperature for mean annual, wet and dry season has increased about 0.48, 0.46, and 0.61 °C per decade for Jimma station. The Pettit test revealed that the late 1980s and 1990s were the change points. There is generally a decreasing trend in streamflow. The decline in annual rainfall and rise in temperature affected the streamflow negatively. Overall, the results indicate that trend sand change point times varied considerably across the stations and catchments. The identified significant trends can help to support planning decisions for water management.

1. Introduction

Climate change may lead to alterations in the dynamics of hydro-climatic variables. These changes can have tremendous effects for food, energy and water supply in particular in developing countries. The release of the Intergovernmental Panel on Climate Change (IPCC) Fourth Assessment Report [1] has brought the issue of climate change and climate trends to the forefront of scientific and political communities. Investigations of regional and global climatic changes and variability and their impacts on the society have designed and operated based on the historical pattern of water availability, quality and demand assuming constant climatic behavior.
There are many studies analyzing the trends and the variability of hydroclimatic variables in different parts of the world. For example, [2] studied regional analysis of trend and step changes observed in hydroclimatic variables around the Colorado River Basin. Their results indicated that temperature increased persistent throughout the year across the Colorado River Basin whereas rainfall only notably increased in a few climate divisions during February and remained relatively unchanged. Similarly Abdul Aziz and Burn [3] studied trends and variability of the hydrological regime in the Mackenzie River Basin in northern Canada over different time periods. Their results indicated increasing discharge during winter and an increasing trend for temperature in winter and spring. Though, rainfall data exhibit a less well-defined trend. Recently, Rahman et al. [4] in Bangladesh and Javari [5] in Iran analyzed rainfall patterns by using the Mann-Kendall trend test. Rahman et al. [4] found that except in a few places, the annual rainfall did not show any significant trend, whereas the monthly rainfall showed a mixed pattern of decreasing or increasing trends, particularly from February to September. The finding of Javari [5] showed that the winter and spring rainfall decreased from the western to the eastern part of the country significantly.
On temperature changes, a study in Libya by Elsharkawy and Elmallah [6] identified desert region temperature that revealed a warming trend in all seasons and winter became the hottest compared to the coastal areas. Tekleab et al. [7] investigated long-term trends of rainfall, temperature, and streamflow in the Abay/Upper Blue Nile basin, Ethiopia and pointed out that trends and change points times varied considerably across the region. Similarly, Tesemma et al. [8] studied trends of rainfall in the same region and did not find any statistically significant trends. However, annual streamflow increased significantly at the 0.05 significance level at Bahir Dar outflow from Lake Tana and Kessie and also during the main rainy season (June–September), significant increasing trends were observed at all three stations.
A number of studies have been conducted on rainfall and runoff trends in Ethiopia. For example, Conway [9] analyzed trends on annual and seasonal rainfall within the Blue Nile basin and reported a decreasing trend for the annual rainfall for the period of 1960 to the mid-1980s. Another study by Bewket and Conway [10] showed a spatial and temporal variation of rainfall trends in northwestern Ethiopia and the results indicated an increasing trend over western Ethiopia. However, other researchers did not find any significant temporal trends regarding rainfall amounts in the central and north-central highlands, but declining trends in the eastern, southern and southwestern parts of Ethiopia [11,12,13].
There are also some studies on the variability and trends of extreme rainfall events in different parts of Ethiopia. The study by Seleshi and Camberlin [14] analyzed trends of rainy days and identified statistically significant declining trends for the wet day intensity and maximum consecutive five-day rain over eastern, southern and southwestern parts during Kiremt (main rainy season) and the Belg (small rainy season) but no significant changes for other parts of the country. The study by Kebede and Bewket [15], conducted in the southwestern part of Ethiopia, which is the wettest part of the country, identified generally a decreasing trend in annual rainfall. Similarly, Funk et al. [16] indicated the presence of a weak rising rainfall trend in the arid lowlands of southern and southeastern Ethiopia and declining trends over the southwestern highlands and Sudan border.
Unmitigated hydro-meteorological variability increases poverty rates by about 25 percent and costs the economy about 38 percent of its growth potential [17]. So giving more attention to climate variability and change should be a prerequisite to sustained growth and development. Thus, the impacts of climate change and variability on water availability in the future should be a major concern for managers and policymakers particularly in relation to surface water which is highly dependent on rainfall. In this regard, no significant research has been done particularly in the study area even though the river generates electricity by a cascade of power plants and large irrigation activities.
Thus, the objective of this study was to identify the presence of long-term hydroclimatic changes, analyzing hydroclimate variability and detecting whether there exist any significant trends in the upper Omo-Ghibe basin (Gibe III catchment), Ethiopia. In addition, the study aimed to identify the change point times for climatic and hydrologic variables at a sub-catchment level that were largely unexplored in previous studies.

2. Study Area and Data Sources

2.1. Study Area

The study area is the upper Omo-Ghibe River Basin (Gibe III catchment) located in the south-western highlands of Ethiopia. According to [18], the area receives rainfall for about nine to ten months per year. The basin is located between 6°25′ N and 9°24′ N latitude and between 35°36′ E and 38°34′ E longitude (Figure 1).
The basin is characterized by diverse topographic features with elevations ranging from 746 m asl in the southern part to 3522 m asl in the northern highlands. The rainfall in the basin has a mono-modal pattern. The mean annual rainfall during the study period was 1425 mm and 92% of the annual rainfall occurred during the wet season (March–October), while the dry season (November–February) receives only 8% of the annual rainfall [19]. The mean annual temperature is 19.2 °C. The area is drained by some of the major rivers of the country, such as the Omo, Gilgel Gibe, Gojeb, and their numerous tributaries. These have created the dissected terrain. Nearly half of the country’s remaining natural forests are found in this region [20].

2.2. Data Sources

Daily rainfall data for eleven stations and daily air temperature data for ten stations of the study basin from 1981 to 2008 were provided by the Ethiopian National Meteorological Agency (NMA). After analyzing temperature data with regard to record length and missing data, eight of the ten stations were chosen for further analysis. The daily streamflow data for eight stations in the upper Omo-Ghibe River Basin were collected from the hydrology department, Ministry of Water, Irrigation, and Electricity. However, only five streamflow stations were considered for analysis based on the availability and quality of the data. All data were scanned for outliers and data gaps. A correction was carried out by cross-checking records from neighboring stations. The selection of study catchments and stations was based on the availability of data. Only time series with <10% missing data for daily streamflow and monthly weather data have been used.

3. Methodology

Daily data were aggregated to monthly data for each dataset. These data were used to detect long-term trends in temperature, rainfall, and streamflow. In this study, the Mann-Kendall test was used to evaluate the existence of monotonic trends in rainfall, temperature, and streamflow time series in the upper Omo-Ghibe River Basin. Pettit tests were employed to detect the step change in the time series [21,22].
The Mann-Kendall test is a rank-based nonparametric test, which has been widely used to analyze trends in rainfall, streamflow and water quality [23,24,25]. It is applicable for non-normally distributed data, which are often encountered in hydrology or climatology [26]. The method is usually less affected by the presence of outliers and missing values [27]. The assumption is based on the null hypothesis meaning the data series is serially independent and identically distributed with no trend and as an alternative hypothesis, a trend exists in the data series. All trend results in this study have been evaluated at the 0.05 significance level to ensure an effective exploration of the trend characteristics in the study area. The null hypothesis of no trend is rejected, when |Z| > 1.96 in Equation (4).
The rank of data values within the time series are compared and the Mann-Kendall test statistic S is computed by using Equation (1).
S = k = 1 n 1 j = k + 1 n sgn ( x j x k )
where xj and xk are the annual data values in years j and k, j > k respectively and n is the number of observations.
sgn ( x j x k ) = { 1      i f     x j x k > 0 0      i f     x j x k = 0 1      i f     x j x k < 0 }
The variance of (S) for independent and identically distributed random variables with no tied data computed using Equation (3) and
V A R ( S ) = n ( n 1 ) ( 2 n + 5 ) 18
S is a normal distribution with a mean of zero and variance of one. The Z score is computed using Equation (4).
Z = { S 1 V A R ( S ) i f    S > 0 0 i f    S = 0 S + 1 V A R i f    S < 0 }
The Z score value was used to evaluate the presence of a statistically significant trend. A positive value of Z indicates an upward trend and a negative value indicates a downward trend. The Mann-Kendall test should be applied to serially independent and uncorrelated data [28]. It is necessary to consider the correlation structure of the data. The correlation structure consists of the serial, or autocorrelation of the data series and the cross-correlation between hydrological variables at different locations. To correct the data for serial correlation, the procedure of trend-free pre-whitening (TFPW) involves estimating a monotonic trend for the series, while removing this trend prior to the pre-whitening the series and finally adding the monotonic trend calculating in the first step to the pre-whitening data series, which is described in Yue et al. [29], was used. The steps used in TFPW starts with detrending the original series by removing the linear trend in the data.
The magnitude of change was analyzed by estimating slope, thus β is estimated using Equation (5) and the detrending series computed using Equation (6).
β = M e d i a n [ x j x k j k ]
For all k < j. (j = 2, …, n and k = 1, …, n−1)
Y t = X t β t
where Yt is detrended series, Xt is the original data series value at time t and β is the slope.
The second step is accomplished checking the presence of auto-correlation with lag-1 in the De-trended series using Equation (7).
r 1 = 1 n 1 t 1 n 1 ( Y t Y ¯ t ) ( Y t + 1 Y ¯ t ) 1 n t 1 n ( Y t Y ¯ t ) 2
where r1 is the lag-1 autocorrelation coefficient, n is the number of years in the de-trended series, Yt is the trended series, and the over-bar indicates the mean of the trended series. The lag-1 autocorrelation coefficient at 0.05 significance level was evaluated to remove the auto-regressive part in the de-trended series [7]. If the lag-1 autocorrelation coefficient is significant, then the auto-correlation part is removed from the series using Equation (8) and if it is not significant, the Mann-Kendal test can be applied to the original Xt data series
Y 1 = Y t r 1 Y t 1
where Y1 is a series without an auto-regressive part. Finally, the linear trend is added to the new series using Equation (9) and Mann-Kendal test can be applied to this new series.
Y 2 = X t + β t
where Y2 is a new series without auto-regressive and linear trend in the original data series.

Detection of Change Points with Pettit Test

To detect the date of a change point within the time series data, the Pettit test was used [22]. The Pettit test is a nonparametric, rank-based and distribution-free test. It is a statistical method to detect abrupt changes in time series. This test has been widely used to detect time change points in climatic and hydrological data [30,31].
It considers a sequence of random variables x1, x2, …, xT, with a change point at τ (xt for t = 1, 2, …, τ ), and a common distribution function F1(x) and xt for t = τ + 1, …, T have a common distribution function F2(x), and F1(x) ≠ F2(x).
The null hypothesis H0: No change or τ = T is tested against the alternative hypothesis Ha: Change or 1 ≤ τ < T using the non-parametric statistic KT = Max|Ut,T|, 1 ≤ τ ≤ T.
U t T = i = 1 t j = t + 1 T sgn ( x i x j )
sgn ( x j x k ) = { 1      i f     x j x k > 0 0      i f     x j x k = 0 1      i f     x j x k < 0 }
The significance level associated with KT is computed using Equation (12).
P 2 × e x p [ 6 k 2 T 3 + T 2 ]
P is the probability of the presence of a change point. A p value of less than 0.05 was defined as a significant upward and downward change in the time series considering a 5% significant level. In this study, a spreadsheet model has been set up to detect the change points in the data series.

4. Results

4.1. Temperature

4.1.1. Temperature Trend Analysis

The Mann-Kendall test analysis of temperature indicated statistically significant increasing trends for minimum, maximum and mean temperatures at the majority of the stations during the study period. This holds true both for mean annual and seasonal data. The spatial map also indicated that the higher the Z score signified that the stronger positive temperature change shown in Figure 2. This positive trend was manifested for the minimum and mean temperature.
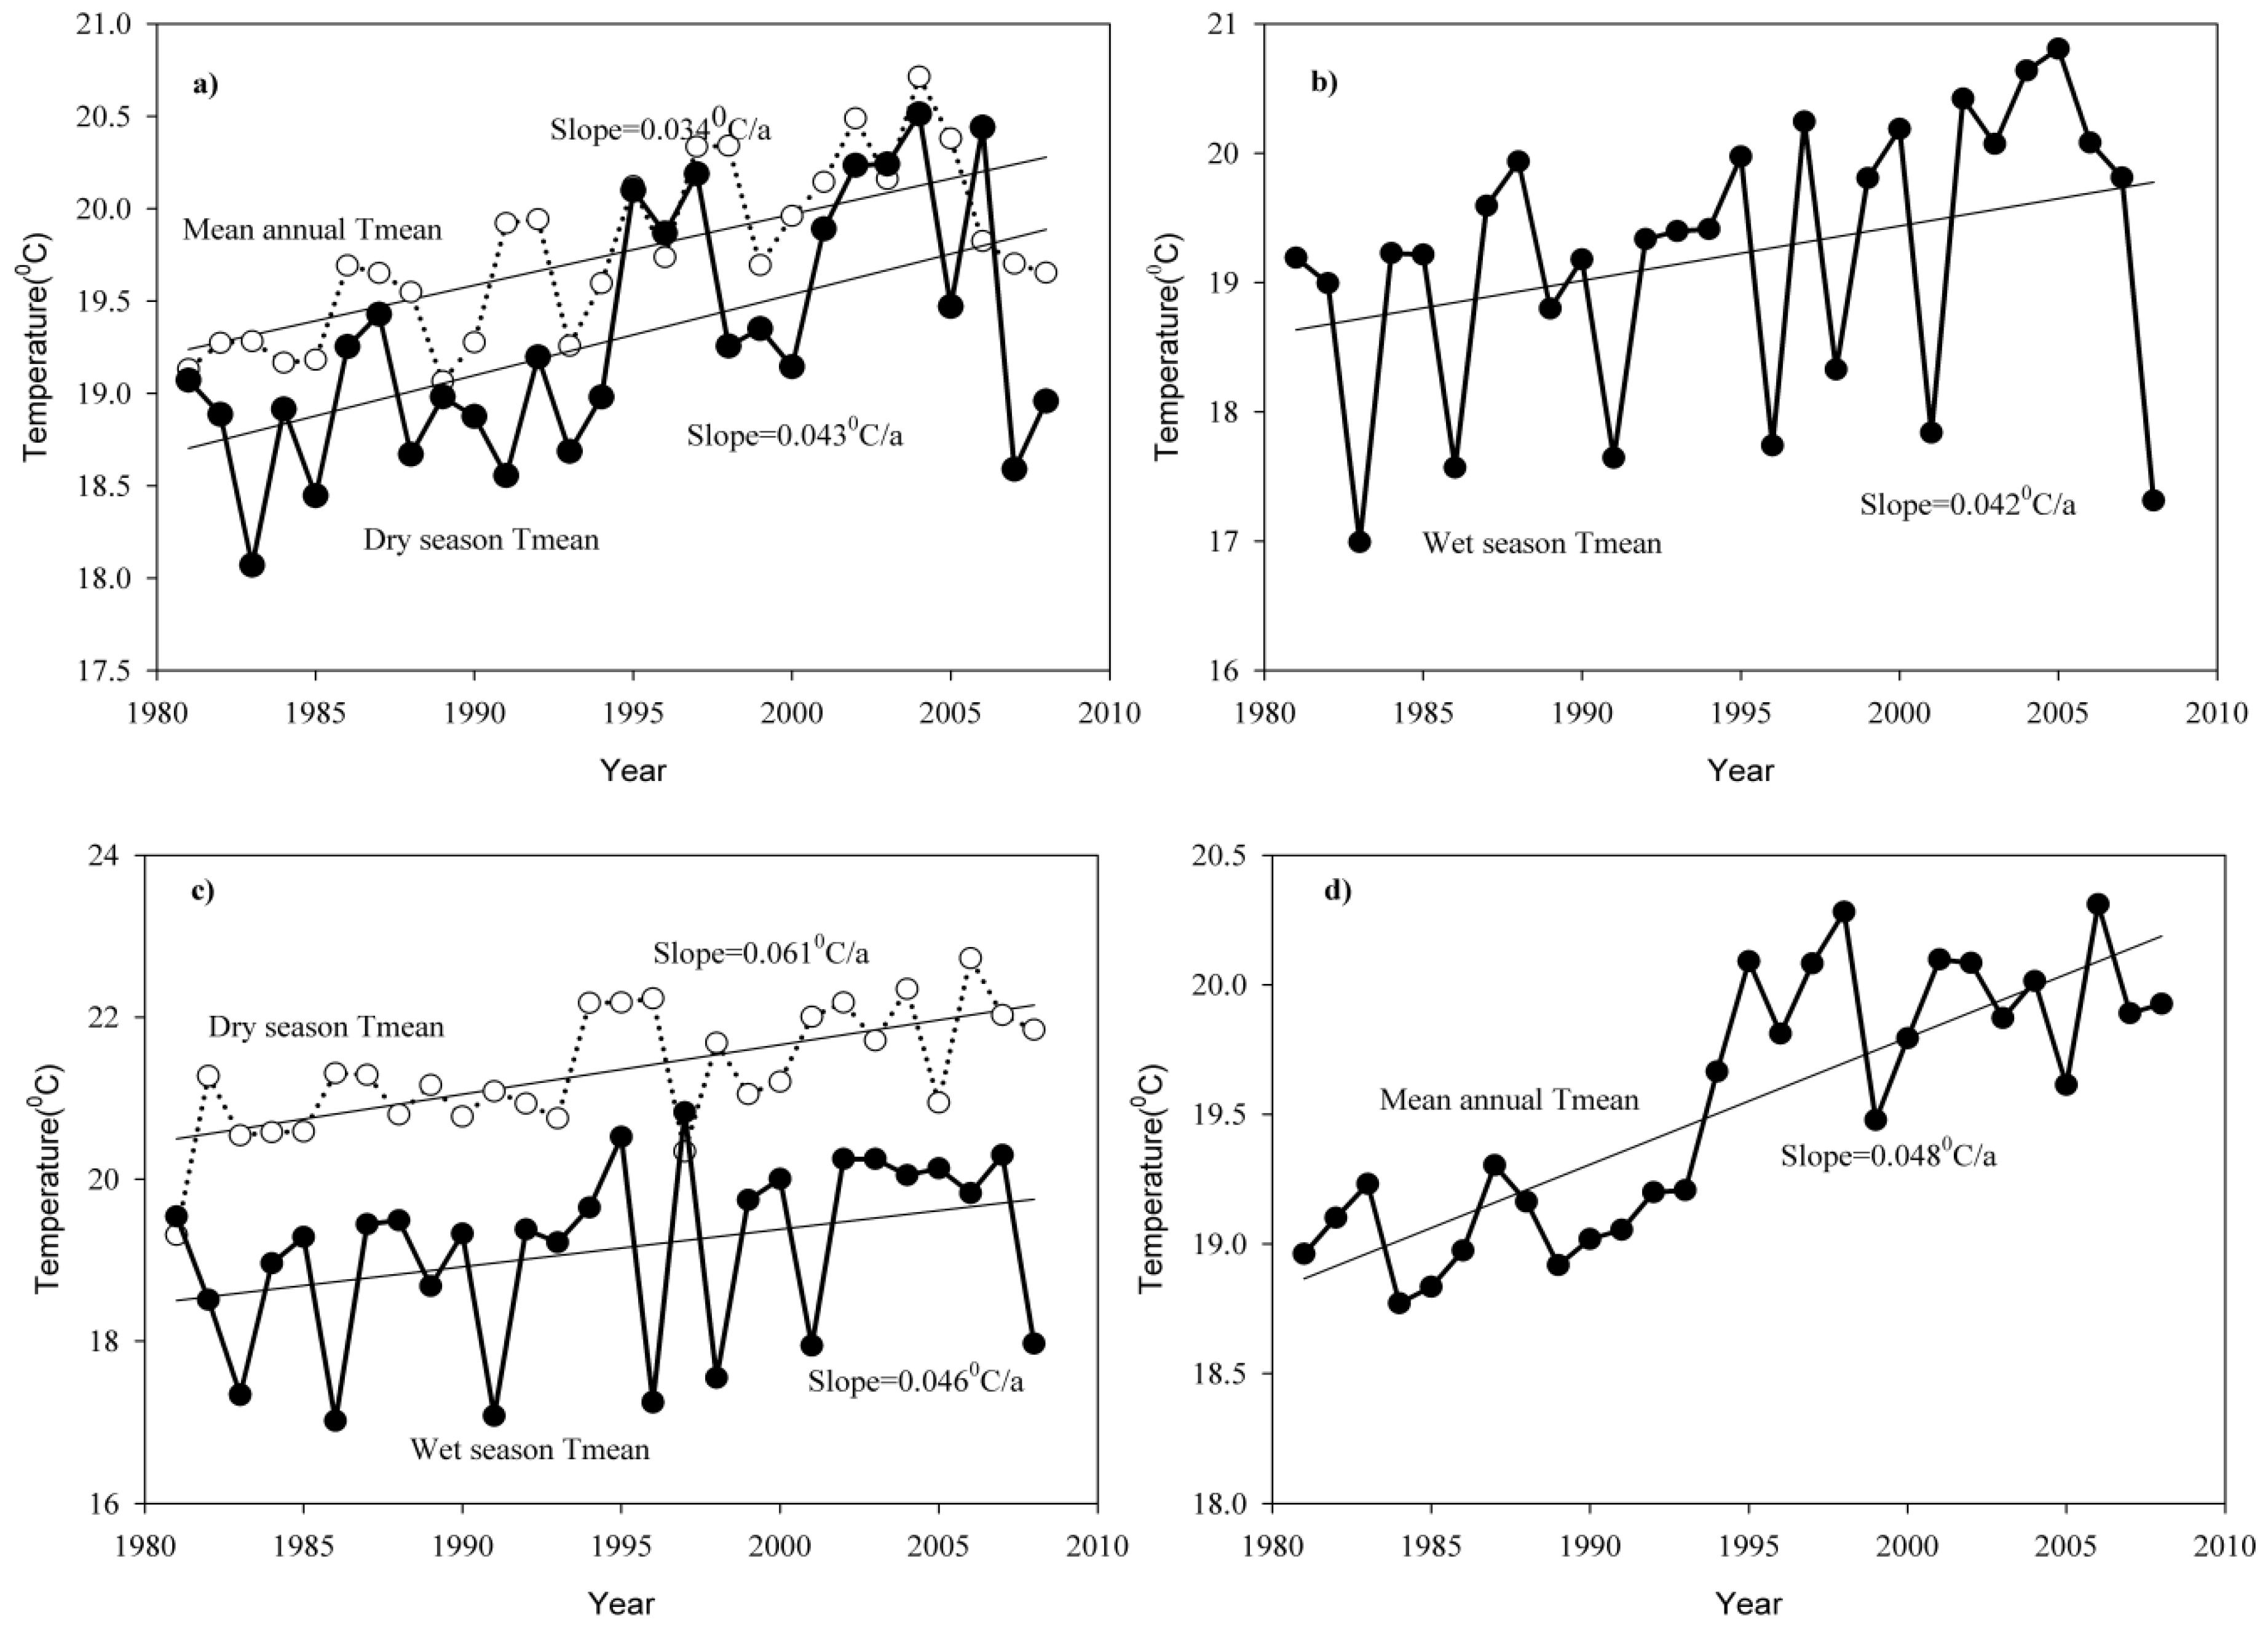
The mean annual and seasonal temperatures for the selected stations in the upper Omo-Ghibe Basin at Assendabo and Jimma showed an increasing trend. For instance, mean annual, wet and dry season temperatures have increased about 0.34, 0.42, and 0.43 °C per decade for Assendabo station, and 0.48, 0.46, and 0.61 °C per decade for Jimma station (Figure 3).

4.1.2. Detection of Change Points for Temperature Time Series

The results from Pettit test indicated that statistically significant increasing change points were identified for the majority of the stations. It is apparent that the change points occurred around the late 1980s, mid-1990s, and early 2000s (Table 1). During these years, the temperature increased about 0.67 °C–0.95 °C on average. This value is the difference between the mean before and after the change. For instance, at Assendabo station the change point for mean annual temperature was in 1995. The mean temperature before the change point was 19.36 °C and the mean temperature after the change point was 20.03 °C, thus, the change was 0.67 °C. Regarding Wolkite station, the change point for the mean annual temperature was in 1996, which means before and after the change point was 19.61 °C and 20.56 °C, the change was therefore 0.95 °C. The selection of the two stations was made due to the range of the change that is statistically significant at 0.01 and 0.05 significance level. Similar patterns were also observed for the rest of the stations.

4.2. Rainfall

For the Mann-Kendall test, we used all investigated datasets directly, because none of the data series was correlated at a 0.05 significance level, which was tested by a serial correlation test. Table 2 presents variations and trends of the mean annual rainfall at eleven stations. The mean annual rainfall varied between 1146 mm at Hossana station (in the southeastern part of the basin) and 1759 mm at Limugenet station (in the northwestern highlands of the basin). The interannual rainfall variability is shown by the coefficients of variation in (Table 2). They varied from 12.09% at Woliso station (in the northeastern highlands of the basin) and 29% at Bele station (in the southeastern part of the basin). See the location of the stations in Figure 1.

4.2.1. Annual Rainfall Trend

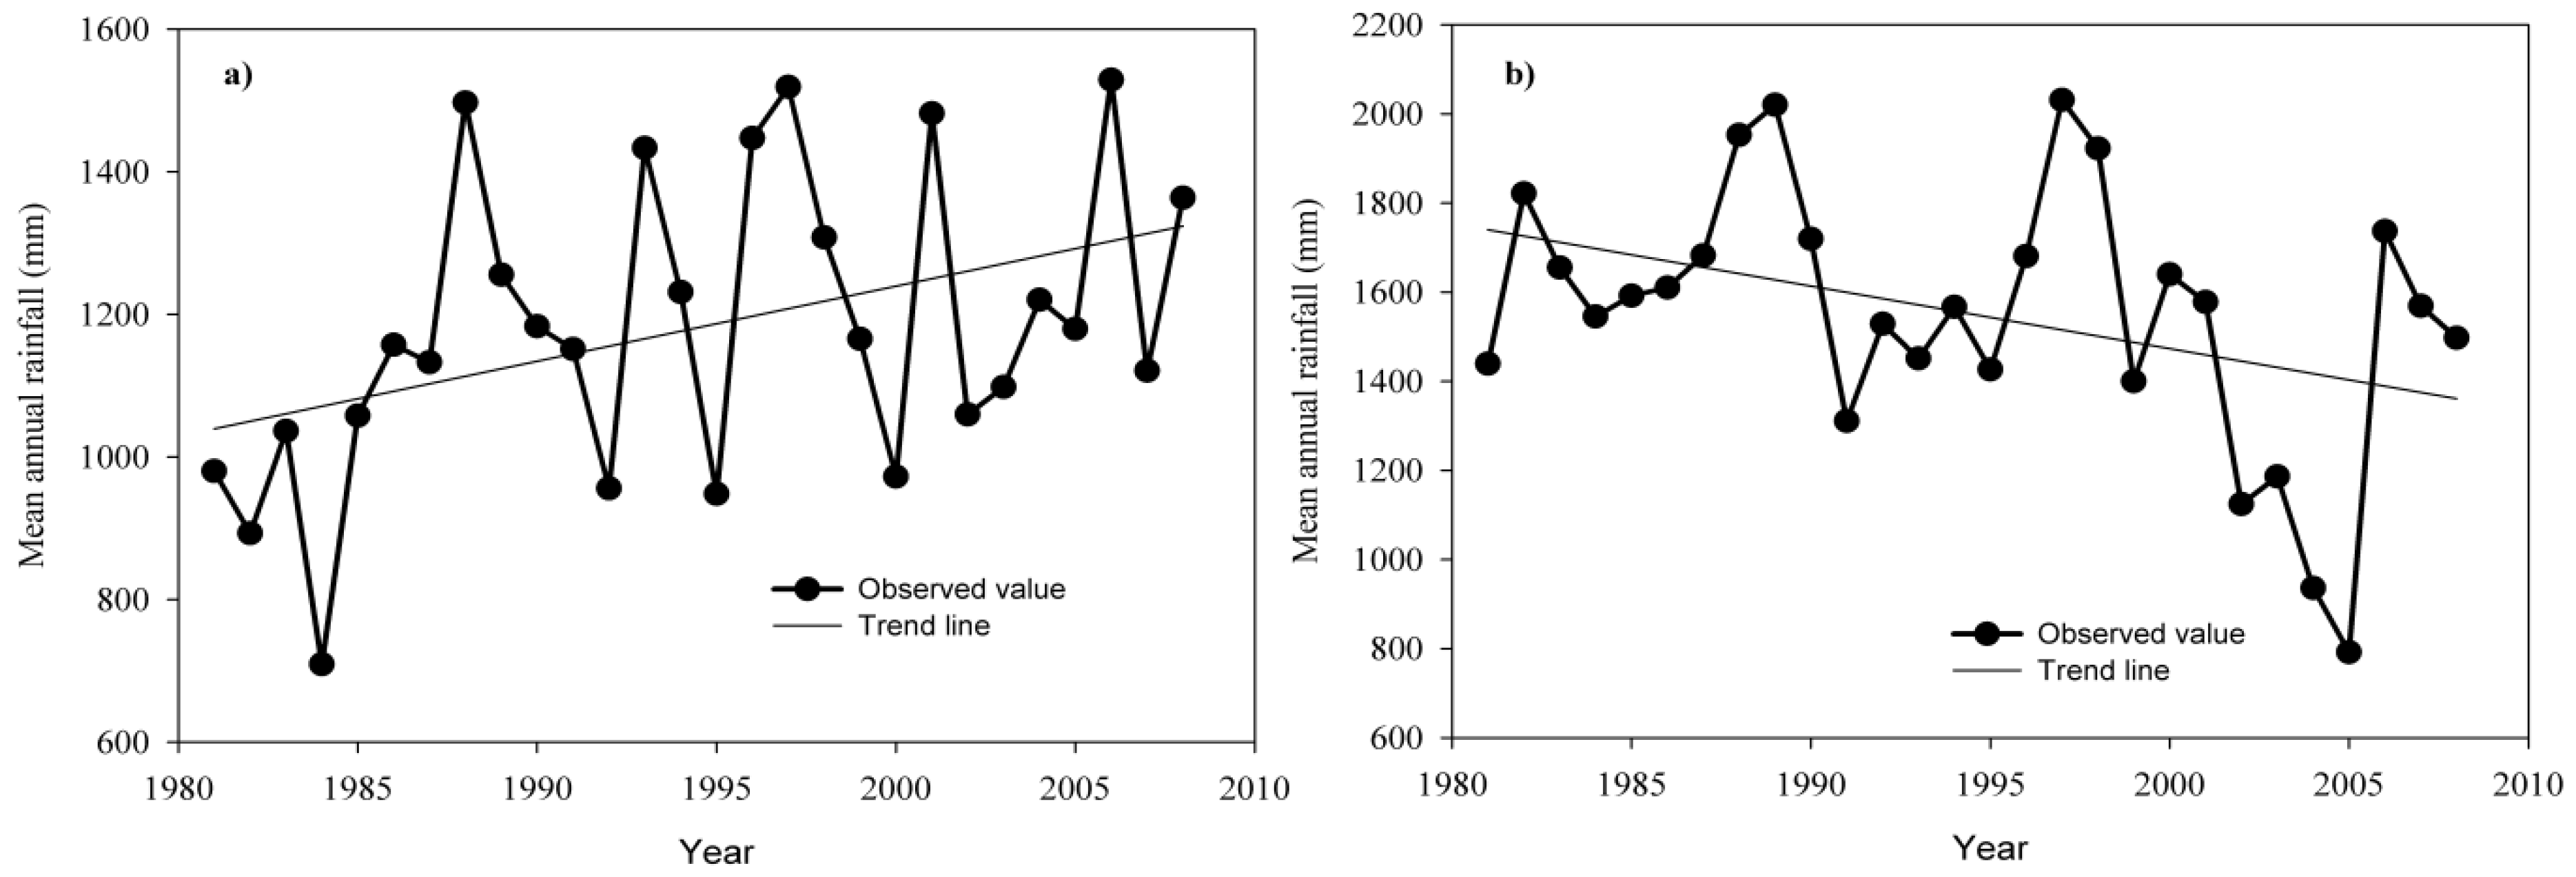
The mean annual rainfall showed a decreasing trend in six out of eleven stations. However, only three (Assendabo, Shebe, and Sekoru) stations have experienced statistically changes evaluated at a 0.05 significance level (Table 3). The rainfall decreased at Shebe and Sekoru, whereas it increased at Assendabo station (Figure 4).

4.2.2. Seasonal Rainfall Trend

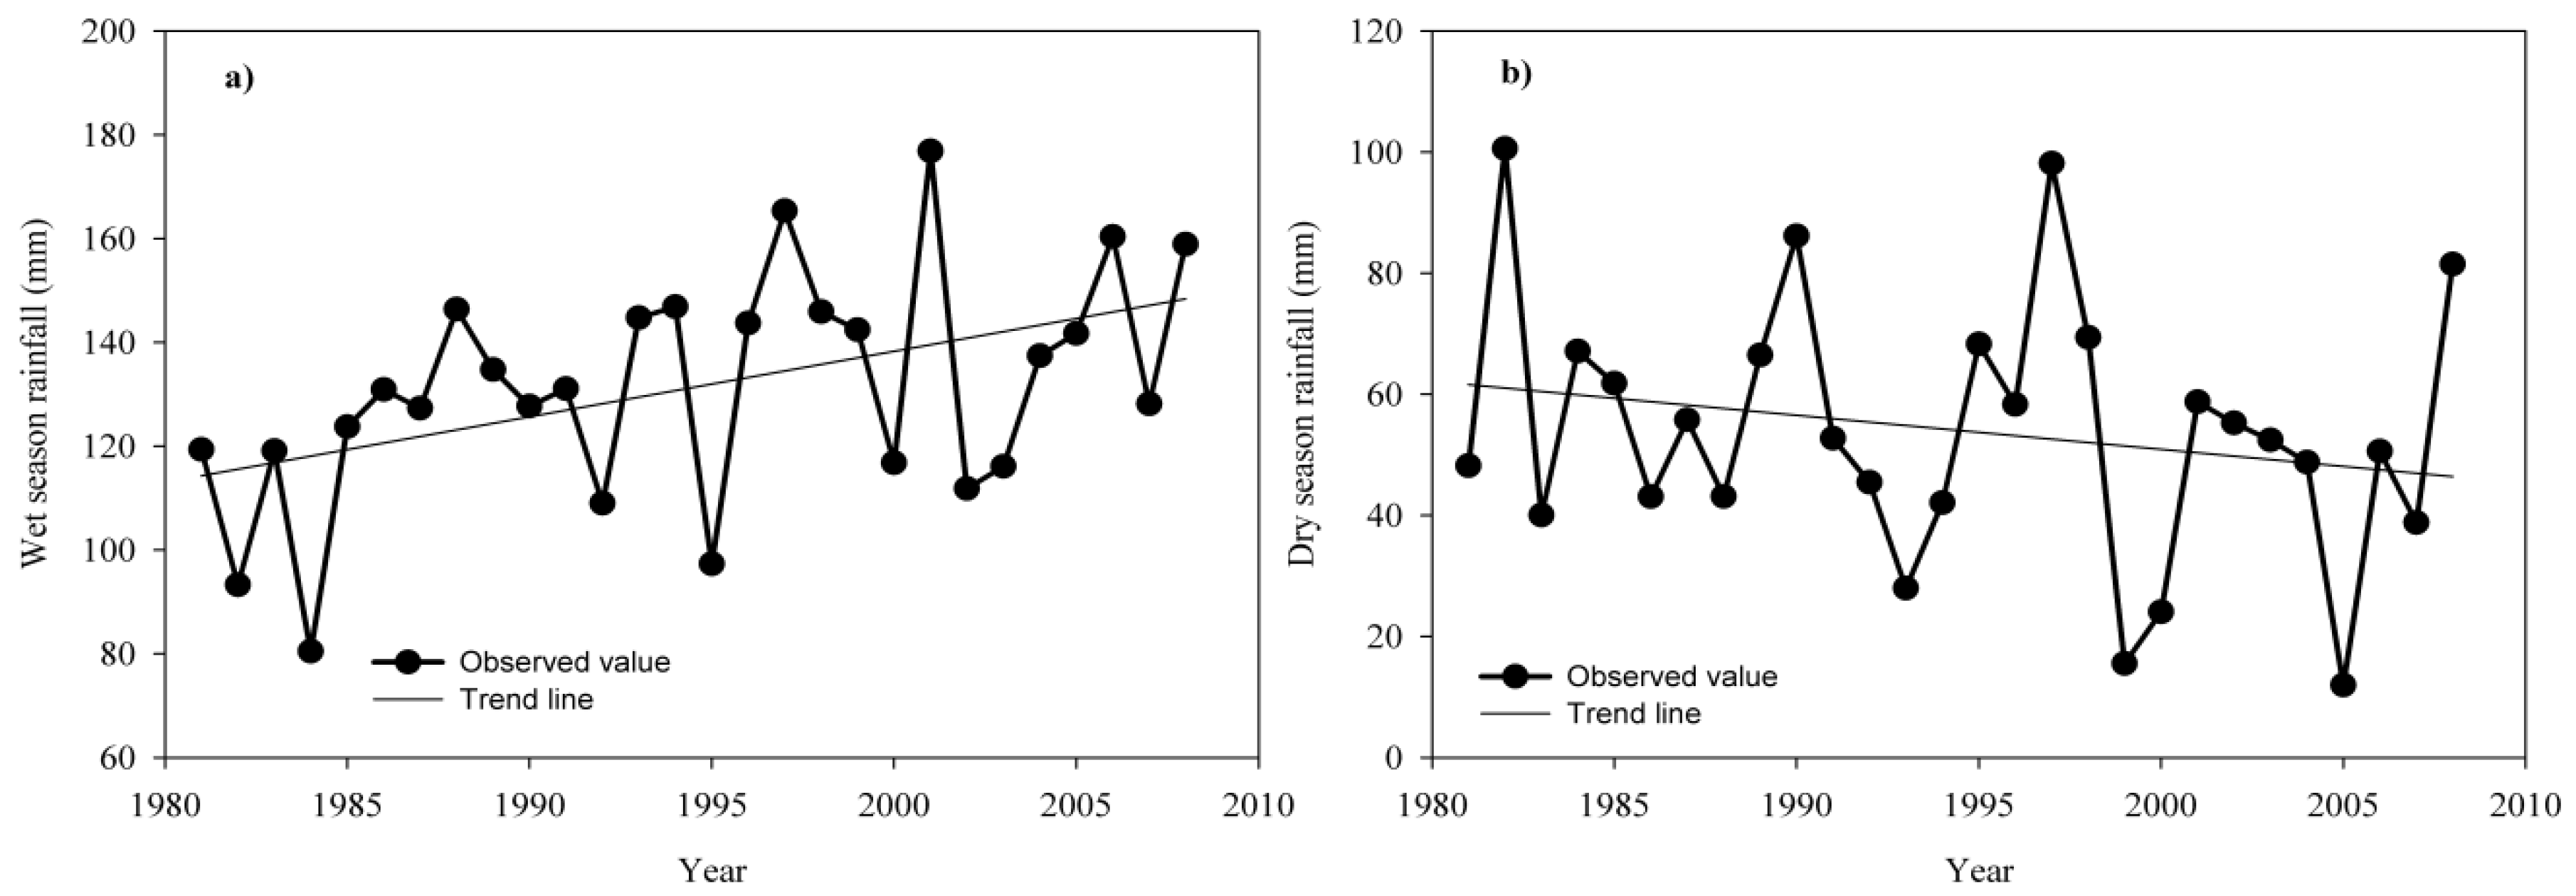
The wet season is between March and October and the dry season is between November and February. This classification is also aligned with Korecha [32], in its homogeneity climate classification. The seasonal trend analysis indicated heterogeneous results both for the wet and the dry season. In the wet season, a weak rise of rainfall was observed in six out of eleven stations, but only Assendabo station has experienced a statistically significant increase at 0.05 significance level. The remaining station showed a decreasing but not significant trend (Table 3). However, during the dry season, a decreasing trend was observed in six out of eleven stations but the trend was only statistically significant at Shebe station (Figure 5).

4.2.3. Monthly Rainfall Trends

Generally, the trends were not significant at a monthly time scale for the majority of the investigated climate stations. However, for some monthly values, statistically significant upward and downward trends were observed. For instance, April and January in the southeastern part (Bele and Wolita) and in the central highland (Assendabo) exhibited significant upward rainfall trends with the Mann-Kendall statistics (Z = 2.07), (Z = 2.51), and (Z = 1.98) respectively. Instead, February rainfall in the southern and the southwestern highland (Bonga and Limugenet) exhibited a downward trend with (Z = −205) and (Z = −2.09).

4.2.4. Detection of Change Points for Annual Rainfall

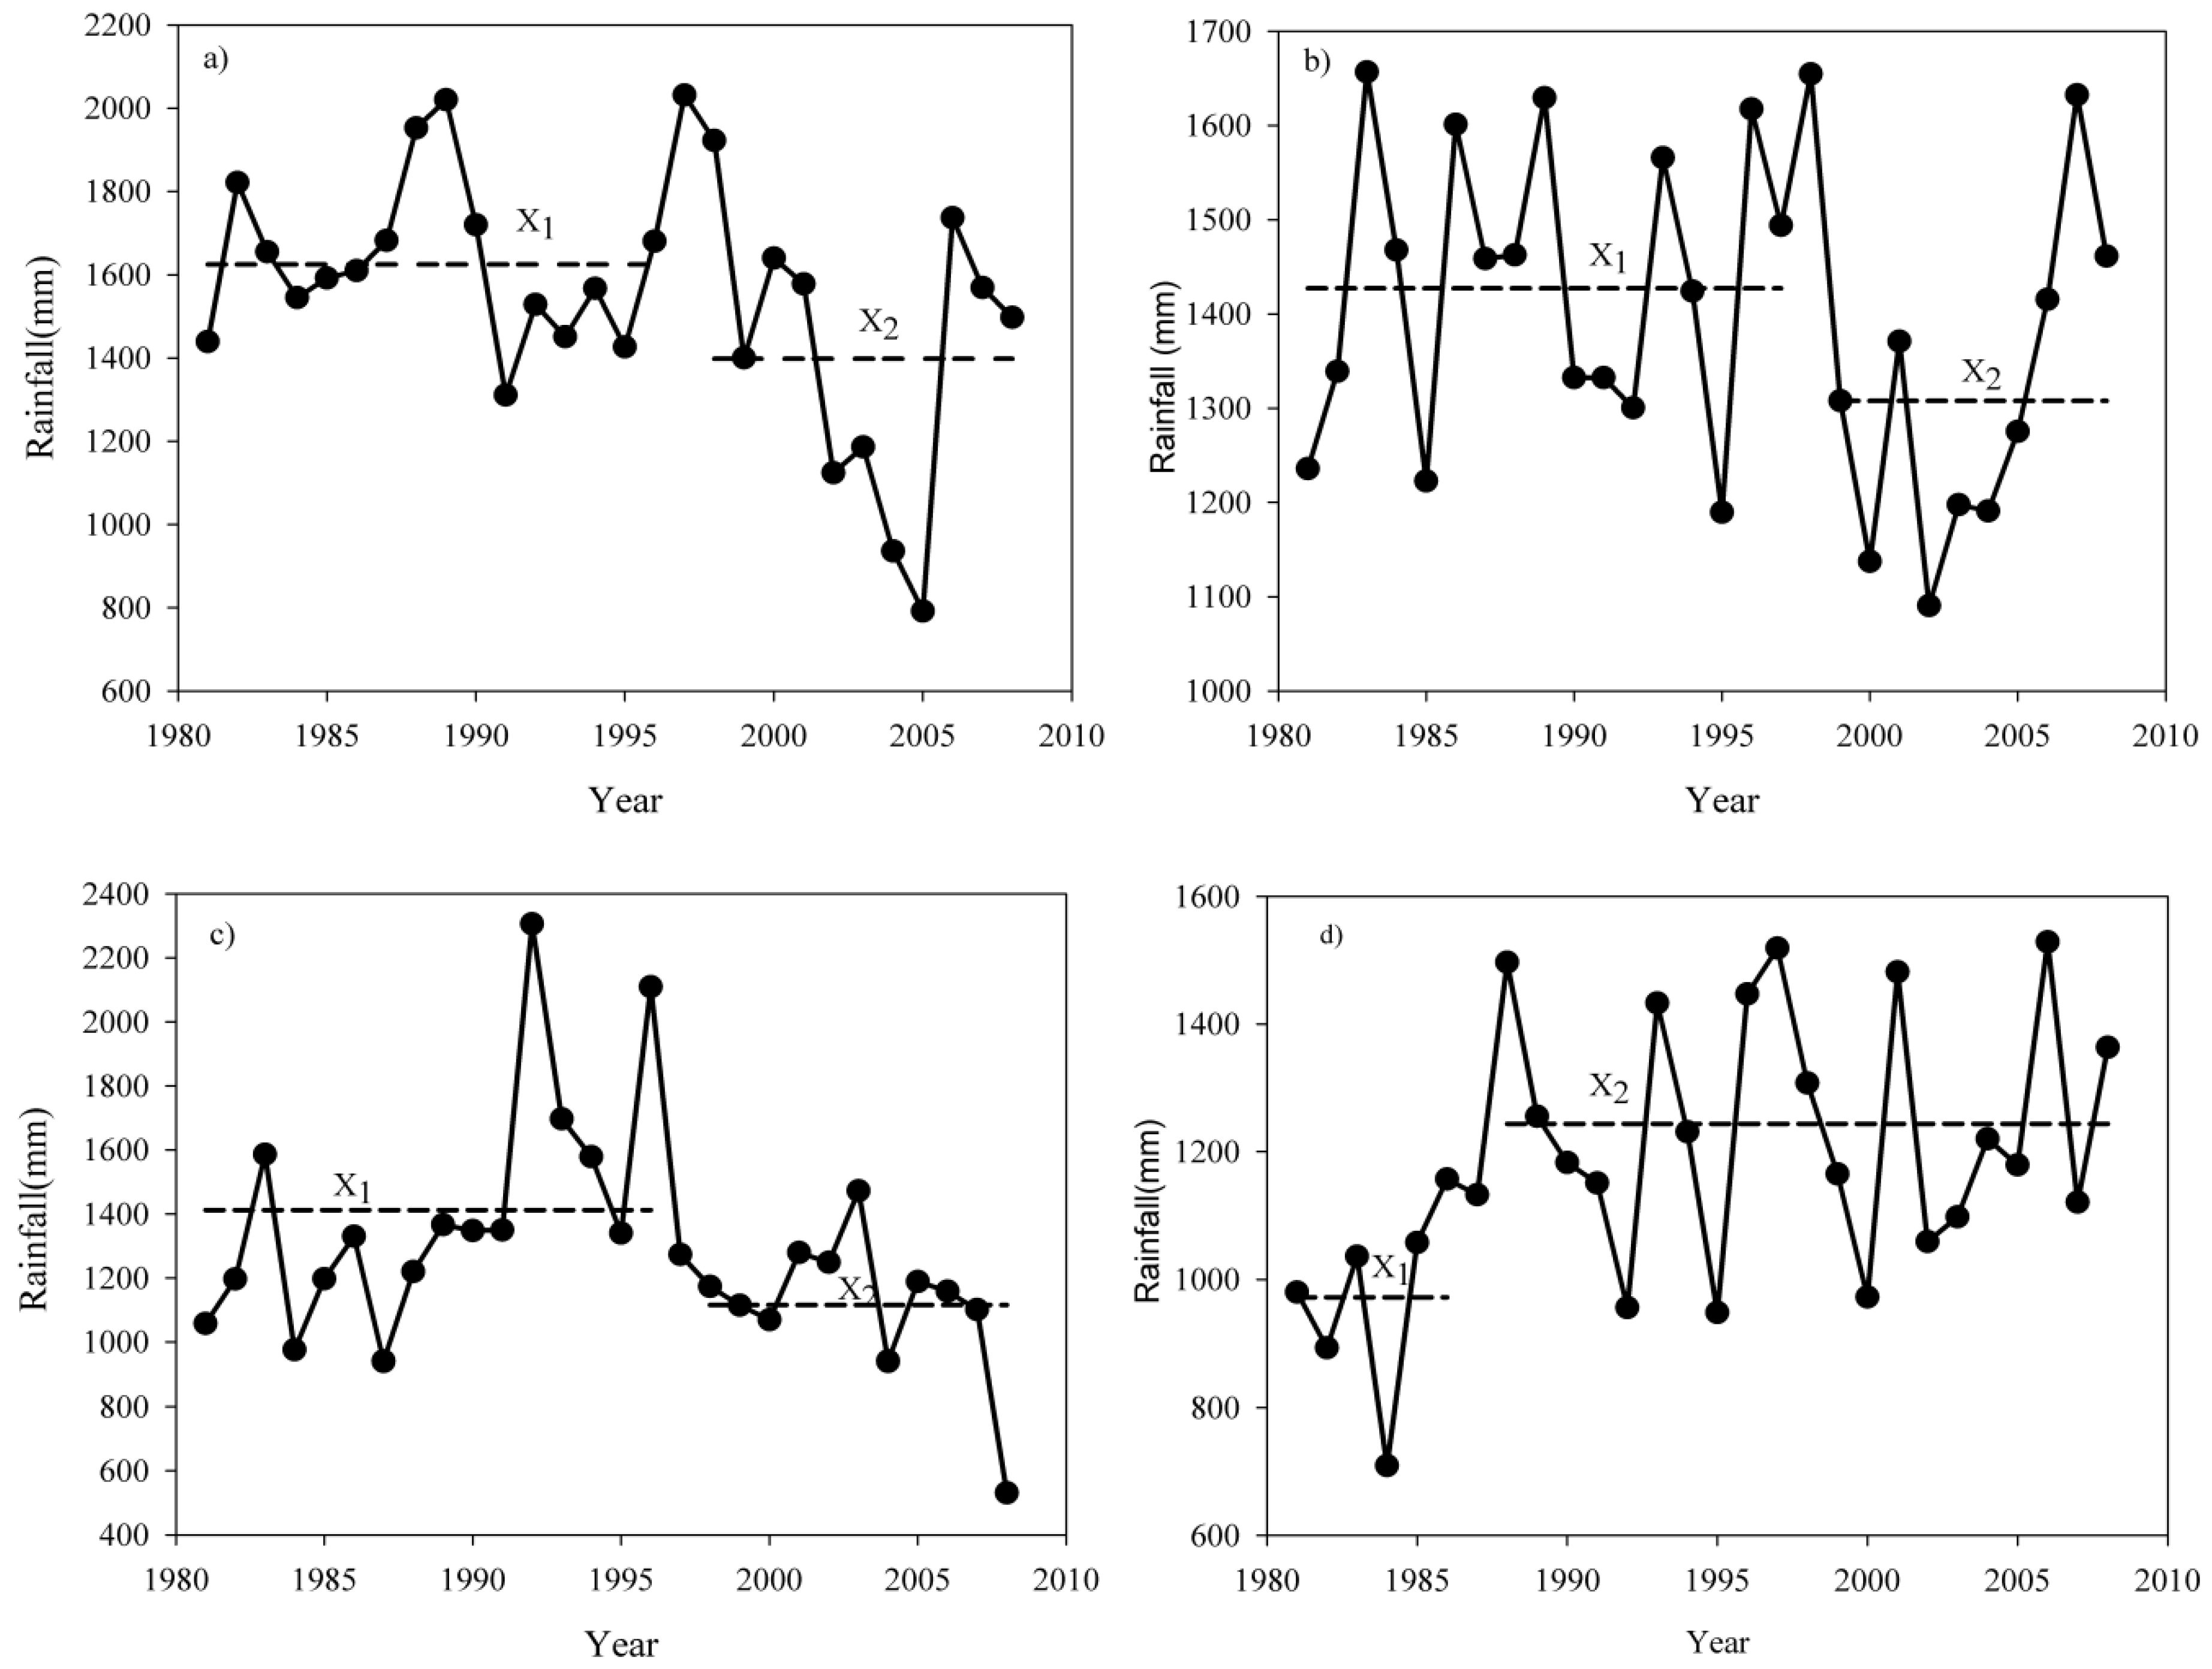
The Pettit test indicated that the annual rainfall exhibited an abrupt change in different time series for various stations. The mean annual rainfall at Sekoru, Shebe, and Wolkite stations exhibited a downward change occurred in the years 1998, 1997, and 1997, respectively. Whereas, the stations Assendabo and Bele showed an upward change that occurred in the years 1987 and 1996, respectively. The change point analysis in annual rainfall shown about 45.5% of the total records. The remaining stations indicated no significant change point in rainfall. In this regard, we illustrated four selected stations having the change point of detection in late 1990 and in 1987, shown in Figure 6.

4.2.5. Detection Change Points of Seasonal Rainfall

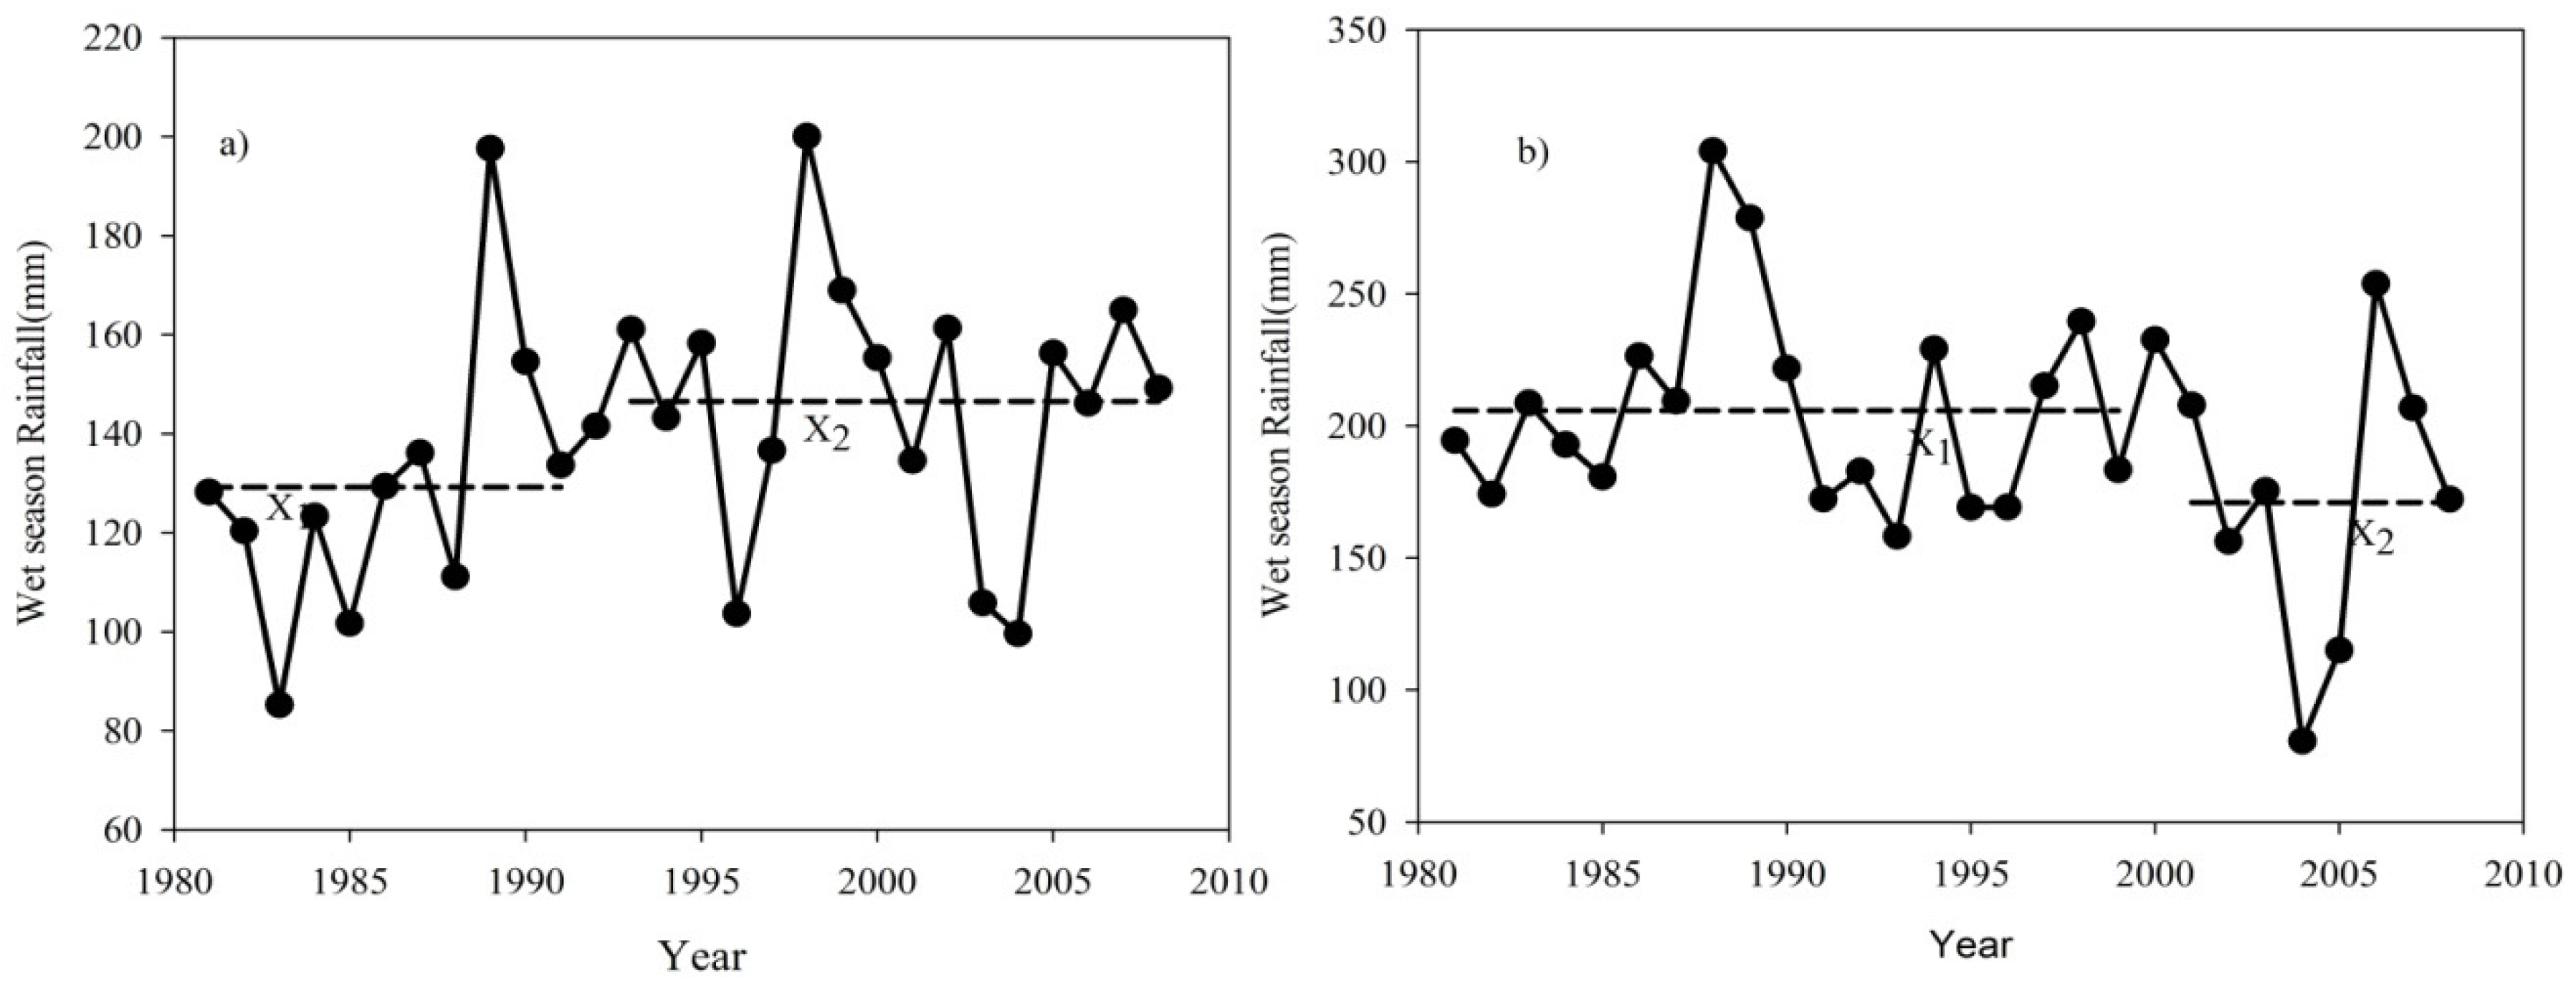
The Pettit test for seasonal rainfall exhibited different change points for different seasons. Accordingly, the wet season analysis indicated statistically significant downward change at two stations, Shebe, and Wolkite, occurred in 2000 and 2003, respectively. On the other hand, a significant upward change was observed at Assendabo station occurred in 1992 shown in Figure 7. Overall, the wet season analysis showed about 27.27% of the total records. In the dry season, a statistically significant downward change exhibited at Bonga station in 1997. On the contrary, significant upward change exhibited at Assendabo station in 1987 shown in Figure 7. Since the rainfall is very small in amount and distribution, the changes in the consecutive years of the recording were too much variable. The change point analysis proved that less than 18.18% of the stations showed different change points.

4.2.6. Detection Change Points of Monthly Rainfall

The results of change point analysis across different months indicated heterogeneous change points. Overall, change in downward direction was prevalent in the months of the dry and wet season. However, few stations showed change points in an upward direction during the wet season.

4.3. Streamflow

Streamflow gauging stations are explained in Table 4, and the results of the Mann-Kendall test for the streamflow time series are summarized in Table 5. The table shows the results of the investigated streamflow trend, which is characterized by different trend directions. Overall, the mean annual and seasonal streamflow analysis indicated a decreasing but statistically insignificant trend. However, only the wet season at Assendabo streamflow station showed a significant increasing trend at the 0.05 significance level.
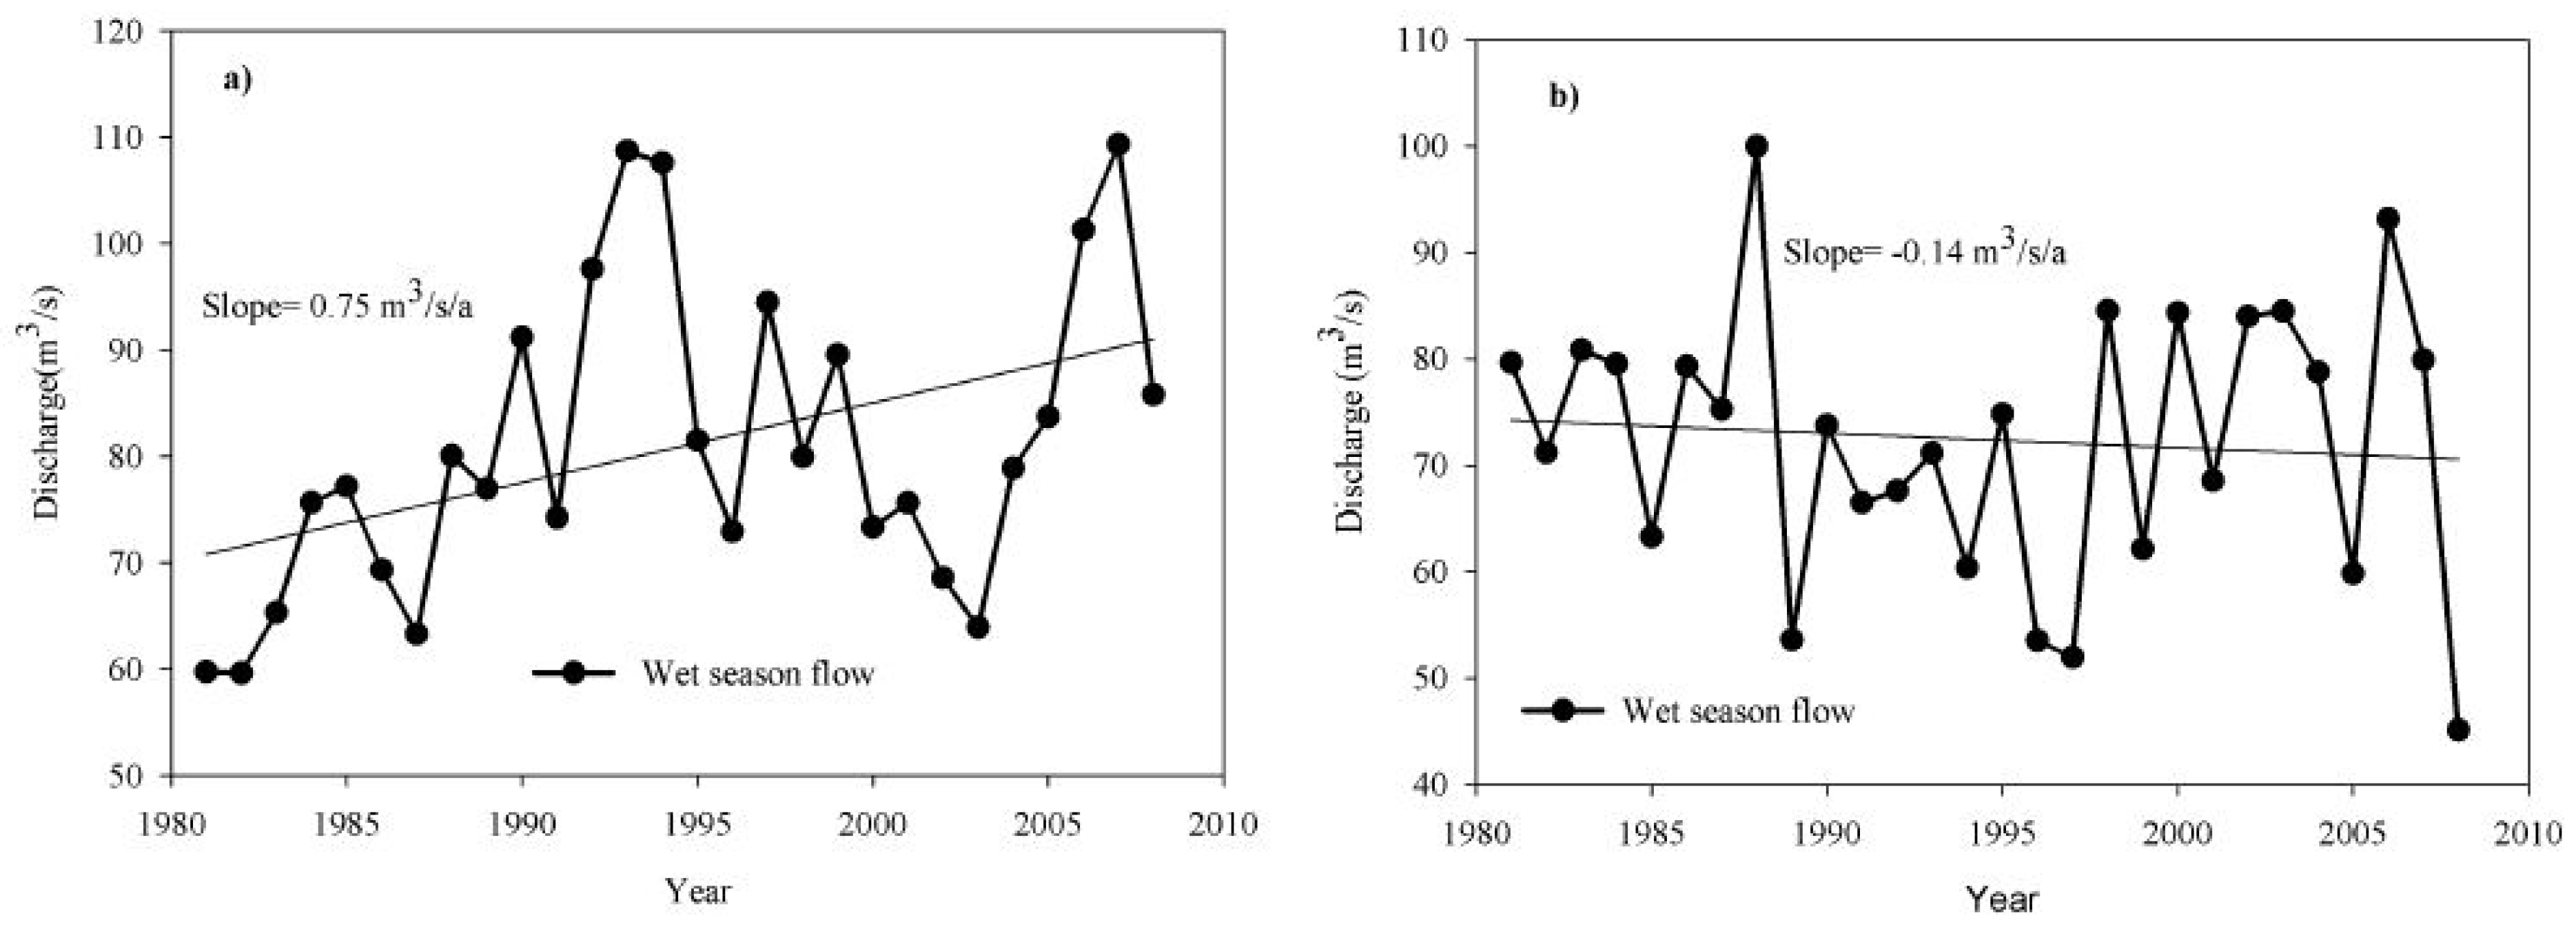
The monthly streamflow analysis in some months indicated upward trends both at the Assendabo and Abelti station at a 0.05 significance level, respectively, shown in Table 5, while Sekoru, Shebe, and Wolkite station showed a mixture of upward and downward trends. However, statistically significant downward trends were observed at Shebe and Wolkite streamflow stations February, March, and December (Table 5). The remaining months did not exhibit significant streamflow trends. The time series plots of the wet season streamflow for the selected stations are shown in Figure 8.

Detection of Change Points in Streamflow Time Series

The change point analysis indicated several change points at the majority of the stations. The test result of the mean annual streamflow at Assendabo and Abelti exhibited an upward change that occurred around 1989 and 1987. While the mean annual streamflow at Sekoru showed a downward change in 1998, the remaining two streamflow stations showed a downward change, which was statistically insignificant. Moreover, the seasonal streamflow analysis at Assendabo and Abelti stations exhibited an upward change that occurred around 1987 but for the stations Sekoru, Shebe, andWolkite, a downward change that occurred around 1998, 1998, and 1989, respectively, was detected. The mean annual and seasonal streamflow change point for selected stations is illustrated in Figure 9.

4.4. Discussion

Generally, the test results are characterized by statistically significant increasing trends in temperature, decreasing trends in mean annual rainfall, a mixture of increasing and decreasing trends in seasonal rainfall and a decreasing streamflow trend in the annual and seasonal streamflow. The increases are more pronounced in the dry season than in the wet season (Figure 2). The map also indicated that the higher the Z score, the stronger the positive temperature change (warming) in the basin. Similar results were reported by the National Meteorological Service Agency of Ethiopia [33]. The magnitude of change in temperature for mean annual and seasonal temperature has increased at a considerable rate (Figure 3). This result coincides with previous studies in other parts in Ethiopia [34,35], and also the Ethiopian panel for climate change [36] report indicated a temperature increment by 1.25 °C per 1 °C change of the globe in the next century. In general, most stations in the catchment exhibited a change with continues increment of temperature (Table 1). The observed increase in temperature in the area has a considerable impact on dominant agricultural activities and cascaded hydropower plants in the basin.
The annual rainfall showed a wide variation across the basin and the interannual variability is higher at stations with low elevations and lower at stations with high elevations (Table 2). The mean annual and dry season rainfall shows generally decreasing trends. This result is consistent with the previous study by Kebede and Bewket [15] that covered southwestern Ethiopia and identified a decreasing trend in annual rainfall. Our study confirmed findings by Seleshi and Zanke [13], who reported a significant declining trend in annual and June to September rainfall in the eastern, southern and southwestern parts of Ethiopia since about 1982. In addition, the Ethiopian Panel on Climate Change [36] revealed a rainfall decline in the southern part of the country.
The Mann-Kendall test analysis for seasonal rainfall trend in a wet season indicated a weak but statistically not significant rise of rainfall in the region except the station Assendabo. The seasonal rainfall has a great contribution to the annual rainfall and therefore affects runoff. Over different periods of investigation on a monthly scale, only February and April showed a significant change across the catchment. The remaining months showed different directions of trends but they were statistically not significant. This result is in agreement with Kebede and Bewket [15] and Demissie et al. [37].
The Pettit test results for the change points indicated different times that were not consistent for temperature, rainfall and streamflow data series. Conversely, a few stations (Sekoru and Assendabo) showed a similar change point for rainfall and streamflow. Accordingly, the change point analysis showed that for most of the streamflow gauging stations, the late 1980s and 1990s are the dominant change times. The rainfall variation and a declining trend of moisture have a significant impact on streamflow in the catchment, large-scale water resources development for hydropower production in the basin and different agricultural production activities since the majority is dependent on the rain-fed agricultural system [7,38].
The analysis of streamflow trends for five streamflow stations in the study area showed different directions of trends. The trend results did not show any spatial coherence, rather, contrasting trends were observed between adjacent streamflow gauging stations, particularly for the annual and wet season. For instance, Great-Ghibe at Abelti showed and increasing streamflow for most of the trend tests, while Wabi at Wolkite showed a decreasing streamflow. The same contrasting trends were observed between Bidru Awana at Sekoru and Gilgle gibe at Assendabo (Table 5). The observed trends for most of the hydrological variables were consistent with the previous studies [38]. These heterogeneous results suggest human interventions [39] and natural causes [7]. Generally, the annual and seasonal streamflow for the investigated stations discovered a mixture of increasing and decreasing trends. However, these trends were statistically not significant. Nonetheless, a significant increasing trend was found in Gilgelgibe at Assendabo station at 0.05 significance level. In addition, the result of the monthly flow of Gojeb at Shebe, and Bidru Awana at Sekoru stations indicated a significant decreasing trend that is prevalent in the dry season. The monthly flow for Gilgelgibe at Assendabo and Great gibe at Abelti stations showed a significant increasing trend during the wet season.

5. Conclusions

The trend and change-point analysis was carried out for eight air temperature, eleven rainfall, and five stream gauging stations with a data length from 1981 to 2008 in the Upper Omo-Ghibe basin, Ethiopia. The data were analyzed using Mann-Kendall trend and Pettit test (change point).
The results of temperature analysis revealed that the investigated basin is getting warmer. The spatial distribution showed the minimum and mean temperature, strong trends are prevalent as compared to the maximum temperature both in mean annual and seasonal time series. About 62.5% of the total stations showed a positive trend regarding minimum temperature. The increase in temperature was, on the other hand, more articulated during the dry season. The mean annual rainfall trend analysis indicated decreasing trends for six out of eleven stations. However, only three stations (Assendabo, Shebe, and Sekoru) experienced statistically significant changes at 0.05 significance level. The seasonal trend analysis also revealed heterogeneous results both in the wet and in the dry season. The rainfall in the wet season has shown a weak rise whereas the rainfall in dry season exhibited declining trends. The monthly rainfall trend analysis showed that except February and April which had a significant decreasing and increasing trends respectively, the remaining months had no significant trends at all. The streamflow analysis identified different direction of trends. The flow in Gojeb at Shebe, Bidru Awana at Sekoru, and Wabi at Wolkit in the investigated catchments showed a decreasing trend in mean annual and seasonal time series. On the other hand, Gilgel Gibe at Assendabo and Great Gibe at Abelti exhibited an increasing trend but a statistically significant trend was observed only at Assendabo during the wet season. Monthly flow had the same pattern particularly at January, February, April, and May showed significant change at 0.05 significance level.
The Pettit test regarding change points exhibits different times, which were not consistent for temperature, rainfall and streamflow data series. For most of the streamflow gauging stations, the late 1980s and 1990s are the dominant change points. There is a tendency of decreasing trend and change-point sign for mean annual and dry seasons flow in the investigated catchment. Generally, the finding provides important information on hydro-meteorological changes in the study catchment. It is considered that the changes for the observed hydro-meteorological variables might be related to both changes in climate variability, either local or global, and land use/land cover change over the investigated periods. However, quantification of the causes attributed to the changes in stream flows, either from anthropogenic activities (land use/land cover change) or climate change or climate variability are beyond the focus of this study. Therefore, there is a need for more research relating to land-use change detection using remote sensing and statistical analysis of hydro-meteorological variables. In addition, for proper utilization of the scarce water resources in the region, it is recommended to quantify the effects of land use/land cover and climate change using rainfall-runoff modeling.

Author Contributions

D.J. designed the study, carried out data analyses and wrote the manuscript. B.A. and A.B. reviewed the statistical analysis and substantially revised the text during the review process. B.L. coordinated the study and gave substantial input to the manuscript.

Funding

This study was funded by the Ethiopian Ministry of Education (MoE), the Hawassa University and the Germany Academic Exchange Service (DAAD, Grant number: 57162825).

Acknowledgments

We are very grateful to the Ethiopian National Meteorological Agency (ENMA) for providing us with the temperature and rainfall data. The same gratitude goes for the Ministry of Water, Irrigation, and Electricity (MoWIE) for providing hydrological data, and we are also indebted to German Academic Exchange Service (DAAD), Ethiopian Ministry of Education (MoE) for their financial assistance and the University of Rostock hosting the first author.

Conflicts of Interest

The authors declare no conflicts of interest.

References

  1. Alley, R.B. Wally Was Right: Predictive ability of the North Atlantic “Conveyor Belt” hypothesis for abrupt climate change. Annu. Rev. Earth Planet. Sci. 2007, 35, 241–272. [Google Scholar] [CrossRef]
  2. Miller, W.P.; Piechota, T.C. Regional analysis of trend and step changes observed in hydroclimatic variables around the Colorado River Basin. J. Hydrometeorol. 2008, 9, 1020–1034. [Google Scholar] [CrossRef]
  3. Abdul Aziz, O.I.; Burn, D.H. Trends and variability in the hydrological regime of the MackenziRiverBasin. J.Hydrol. 2006, 319, 282–294. [Google Scholar] [CrossRef]
  4. Rahman, M.A.; Yunsheng, L.; Sultana, N. Analysis and prediction of rainfall trends over Bangladesh using Mann–Kendall, Spearman’s rho tests and ARIMA model. Meteorol. Atmos. Phys. 2017, 129, 409–424. [Google Scholar] [CrossRef]
  5. Javari, M. Trend analysis of monthly rainfall over Atrak River Basin, Iran trend analysis of monthly rainfall over Atrak River. Int. J. Appl. Environ. Sci. 2017, 12, 1411–1448. [Google Scholar]
  6. Elsharkawy, S.G.; Elmallah, E.S. Spatiotemporal investigation of long-term seasonal temperature variability in Libya. Atmos. Res. 2015, 178–179, 535–549. [Google Scholar] [CrossRef]
  7. Tekleab, S.; Mohamed, Y.; Uhlenbrook, S. Hydro-climatic trends in the Abay/Upper Blue Nile basin, Ethiopia. Phys. Chem. Earth 2013, 61–62, 32–42. [Google Scholar] [CrossRef]
  8. Tesemma, Z.K.; Mohamed, Y.A.; Steenhuis, T.S. Trends in rainfall and runoff in the Blue Nile Basin: 1964-2003. Hydrol. Process 2010, 24, 3747–3758. [Google Scholar] [CrossRef] [Green Version]
  9. Conway, D. The climate and hydrology of the Upper Blue Nile River. Ethiop. J. Sci. 2000, 23, 139–161. [Google Scholar]
  10. Bewket, W.; Conway, D. A note on the temporal and spatial variability of rainfall in the drought-prone Amhara region of Ethiopia. Int. J. Climatol. 2007, 27, 1467–1477. [Google Scholar] [CrossRef]
  11. Cheung, W.H.; Senay, G.B.; Singh, A. Trends and spatial distribution of annual and seasonal rainfall in Ethiopia. Int. J. Climatol. 2008, 28, 1723–1734. [Google Scholar] [CrossRef]
  12. Jury, M.R.; Funk, C. Climatic trends over Ethiopia: Regional signals and drivers. Int. J. Climatol. 2013, 33, 1924–1935. [Google Scholar] [CrossRef]
  13. Seleshi, Y.; Zanke, U. Recent changes in rainfall and rainy days in Ethiopia. Int. J. Climatol. 2004, 24, 973–983. [Google Scholar] [CrossRef]
  14. Seleshi, Y.; Camberlin, P. Recent changes in dry spell and extreme rainfall events in Ethiopia. Theor. Appl. Climatol. 2006, 83, 181–191. [Google Scholar] [CrossRef]
  15. Kebede, G.; Bewket, W. Variations in rainfall and extrem event Indices in the western part of Ethiopia. J. Sci. 2009, 32, 129–140. [Google Scholar]
  16. Funk, C.; Rowland, J.; Eilerts, G.; Kebebe, E.; Biru, N.; White, L.; Galu, G. A Climate Trend Analysis of Ethiopia; U.S. Geological Survey Fact Sheet 2012–3053; United States Geological Survey: Reston, VA, USA, 2012.
  17. World Bank. Ethiopia: Managing Water Resources to Maximize Sustainable Growth: A World Bank Water Resources Assistance Strategy for Ethiopia; World Bank: Washington, DC, USA, 2006. [Google Scholar]
  18. NMSA (National Meteorological Service Agency). Climatic and Agro-Climatic Resources of Ethiopia; NMSA Meteorological Research Report Series; NMSA: Addis Ababa, Ethiopia, 1996; Volume 1, p. 137.
  19. Adnew, M.; Woldeamlak, D. Variability and trends in rainfall amount and extreme event indices in the Omo-Ghibe River Basin, Ethiopia. Reg. Environ. Change 2013. [Google Scholar] [CrossRef]
  20. MoWR (Ministry of Water Resources). Omo-Gibe River Basin Integrated Development Master Plan Study: Final Report; Volume I Executive Summary; MoWR: Addis Ababa, Ethiopia, 1996.
  21. Mann, H.B. Non parametric test against trend. Econometrica 1945, 13, 245–259. [Google Scholar] [CrossRef]
  22. Pettitt, A.N. A non-parametric approach to the change-point problem. Appl. Stat. 1979, 28, 126–135. [Google Scholar] [CrossRef]
  23. De Luis, M.; Raventos, J.; Gonazalez-Hidalgob, J.; Sanchez, J.R.; Cortina, J. Spatial anlysis of rainfall trends in the region of Valencia (East Spain). Int. J. Climatol. 2000, 1469, 1451–1469. [Google Scholar] [CrossRef]
  24. Hamed, K.H. Trend detection in hydrologic data: The Mann–Kendall trend test under the scaling hypothesis. J. Hydrol. 2008, 349, 350–363. [Google Scholar] [CrossRef]
  25. Shahid, S. Rainfall variability and the trends of wet and dry periods in Bangladesh. Int. J. Climatol. 2009, 30, 2299–2313. [Google Scholar] [CrossRef]
  26. Yue, S.; Pilon, P. A comparison of the power of the t test, Mann-Kendall and bootstrap tests for trend detection. Hydrol. Sci. J. 2004, 49, 21–38. [Google Scholar] [CrossRef]
  27. Hess, A.; Iyer, H.; Malm, W. Linear trend analysis: A comparison of methods. Atmos. Environ. 2001, 35, 5211–5222. [Google Scholar] [CrossRef]
  28. Helsel, D.R.; Hirsch, R.M. Studies in Environmental Science. In Statistical Methods in Water Resources; Elsevier: Amsterdam, The Netherlands, 1992; p. 546. [Google Scholar]
  29. Yue, S.; Pilon, P.; Phinney, B.; Cavadias, G. The influence of autocorrelation on the ability to detect trend in hydrological series. Hydrol. Process 2002, 16, 1807–1829. [Google Scholar] [CrossRef]
  30. Love, D.; Uhlenbrook, S.; Twomlow, S.; Van Der Zaag, P. Changing rainfall and discharge patterns in the northern Limpopo Basin, Zimbabwe. Water SA 2010, 36, 335–350. [Google Scholar]
  31. Mu, X.; Zhang, L.; McVicar, T.R.; Chille, B.; Gau, P. Analysis of the impact of conservation measures on stream flow regime in catchments of the Loess Plateau, China. Hydrol. Process 2007, 21, 2124–2134. [Google Scholar] [CrossRef]
  32. Korecha, D. Characterizing the Predictability of Seasonal Climate in Ethiopia., Norway. PhD. Thesis, University of Bergen, Bergen, Norway, 2013. [Google Scholar]
  33. NMSA. Climate Change National Adaptation Programme of Action (NAPA) of Ethiopia; The Federal Democratic Republic of Ethiopia (FDRE), Ministry of Water Resources: Addis Ababa, Ethiopia, 2007.
  34. Abdo, K.S.; Fiseha, B.M.; Rientjes, T.H.M.; Gieske, A.S.M.; Haile, A.T. Assessment of climate change impacts on the hydrology of Gilgel Abay catchment in Lake Tana basin, Ethiopia. Hydrol. Process 2009, 23, 3661–3669. [Google Scholar] [CrossRef]
  35. Elshamy, M.E.; Seierstad, I.A.; Sorteberg, A. Impacts of climate change on Blue Nile flows using bias-corrected GCM scenarios. Hydrol. Earth Syst. Sci. 2009, 13, 551–565. [Google Scholar] [CrossRef] [Green Version]
  36. EPCC. Ethiopian Panel on Climate Change first Assessment Report, Agriculture and Food Security (Working Group II); Ethiopian Academy of Sciences: Addis Ababa, Ethiopia, 2015. [Google Scholar]
  37. Demissie, A.; Saathoff, F.; Seleshi, Y. Trends of hydro-meteorological data and impact of climate change on the streamflow of Gilgel Gibe 1 River Basin-Ethiopia. Int. J. Curr. Res. 2013, 5, 2988–2993. [Google Scholar]
  38. Viste, E.; Korecha, D.; Sorteberg, A. Recent drought and precipitation tendencies in Ethiopia. Theor. Appl. Climatol. 2013, 112, 535–551. [Google Scholar] [CrossRef]
  39. Degefu, M.A.; Bewket, W. Variability, trends, and teleconnections of stream flows with large-scale climate signals in the Omo-Ghibe River Basin, Ethiopia. Environ. Monit. Assess 2017, 189, 142. [Google Scholar] [CrossRef] [PubMed]
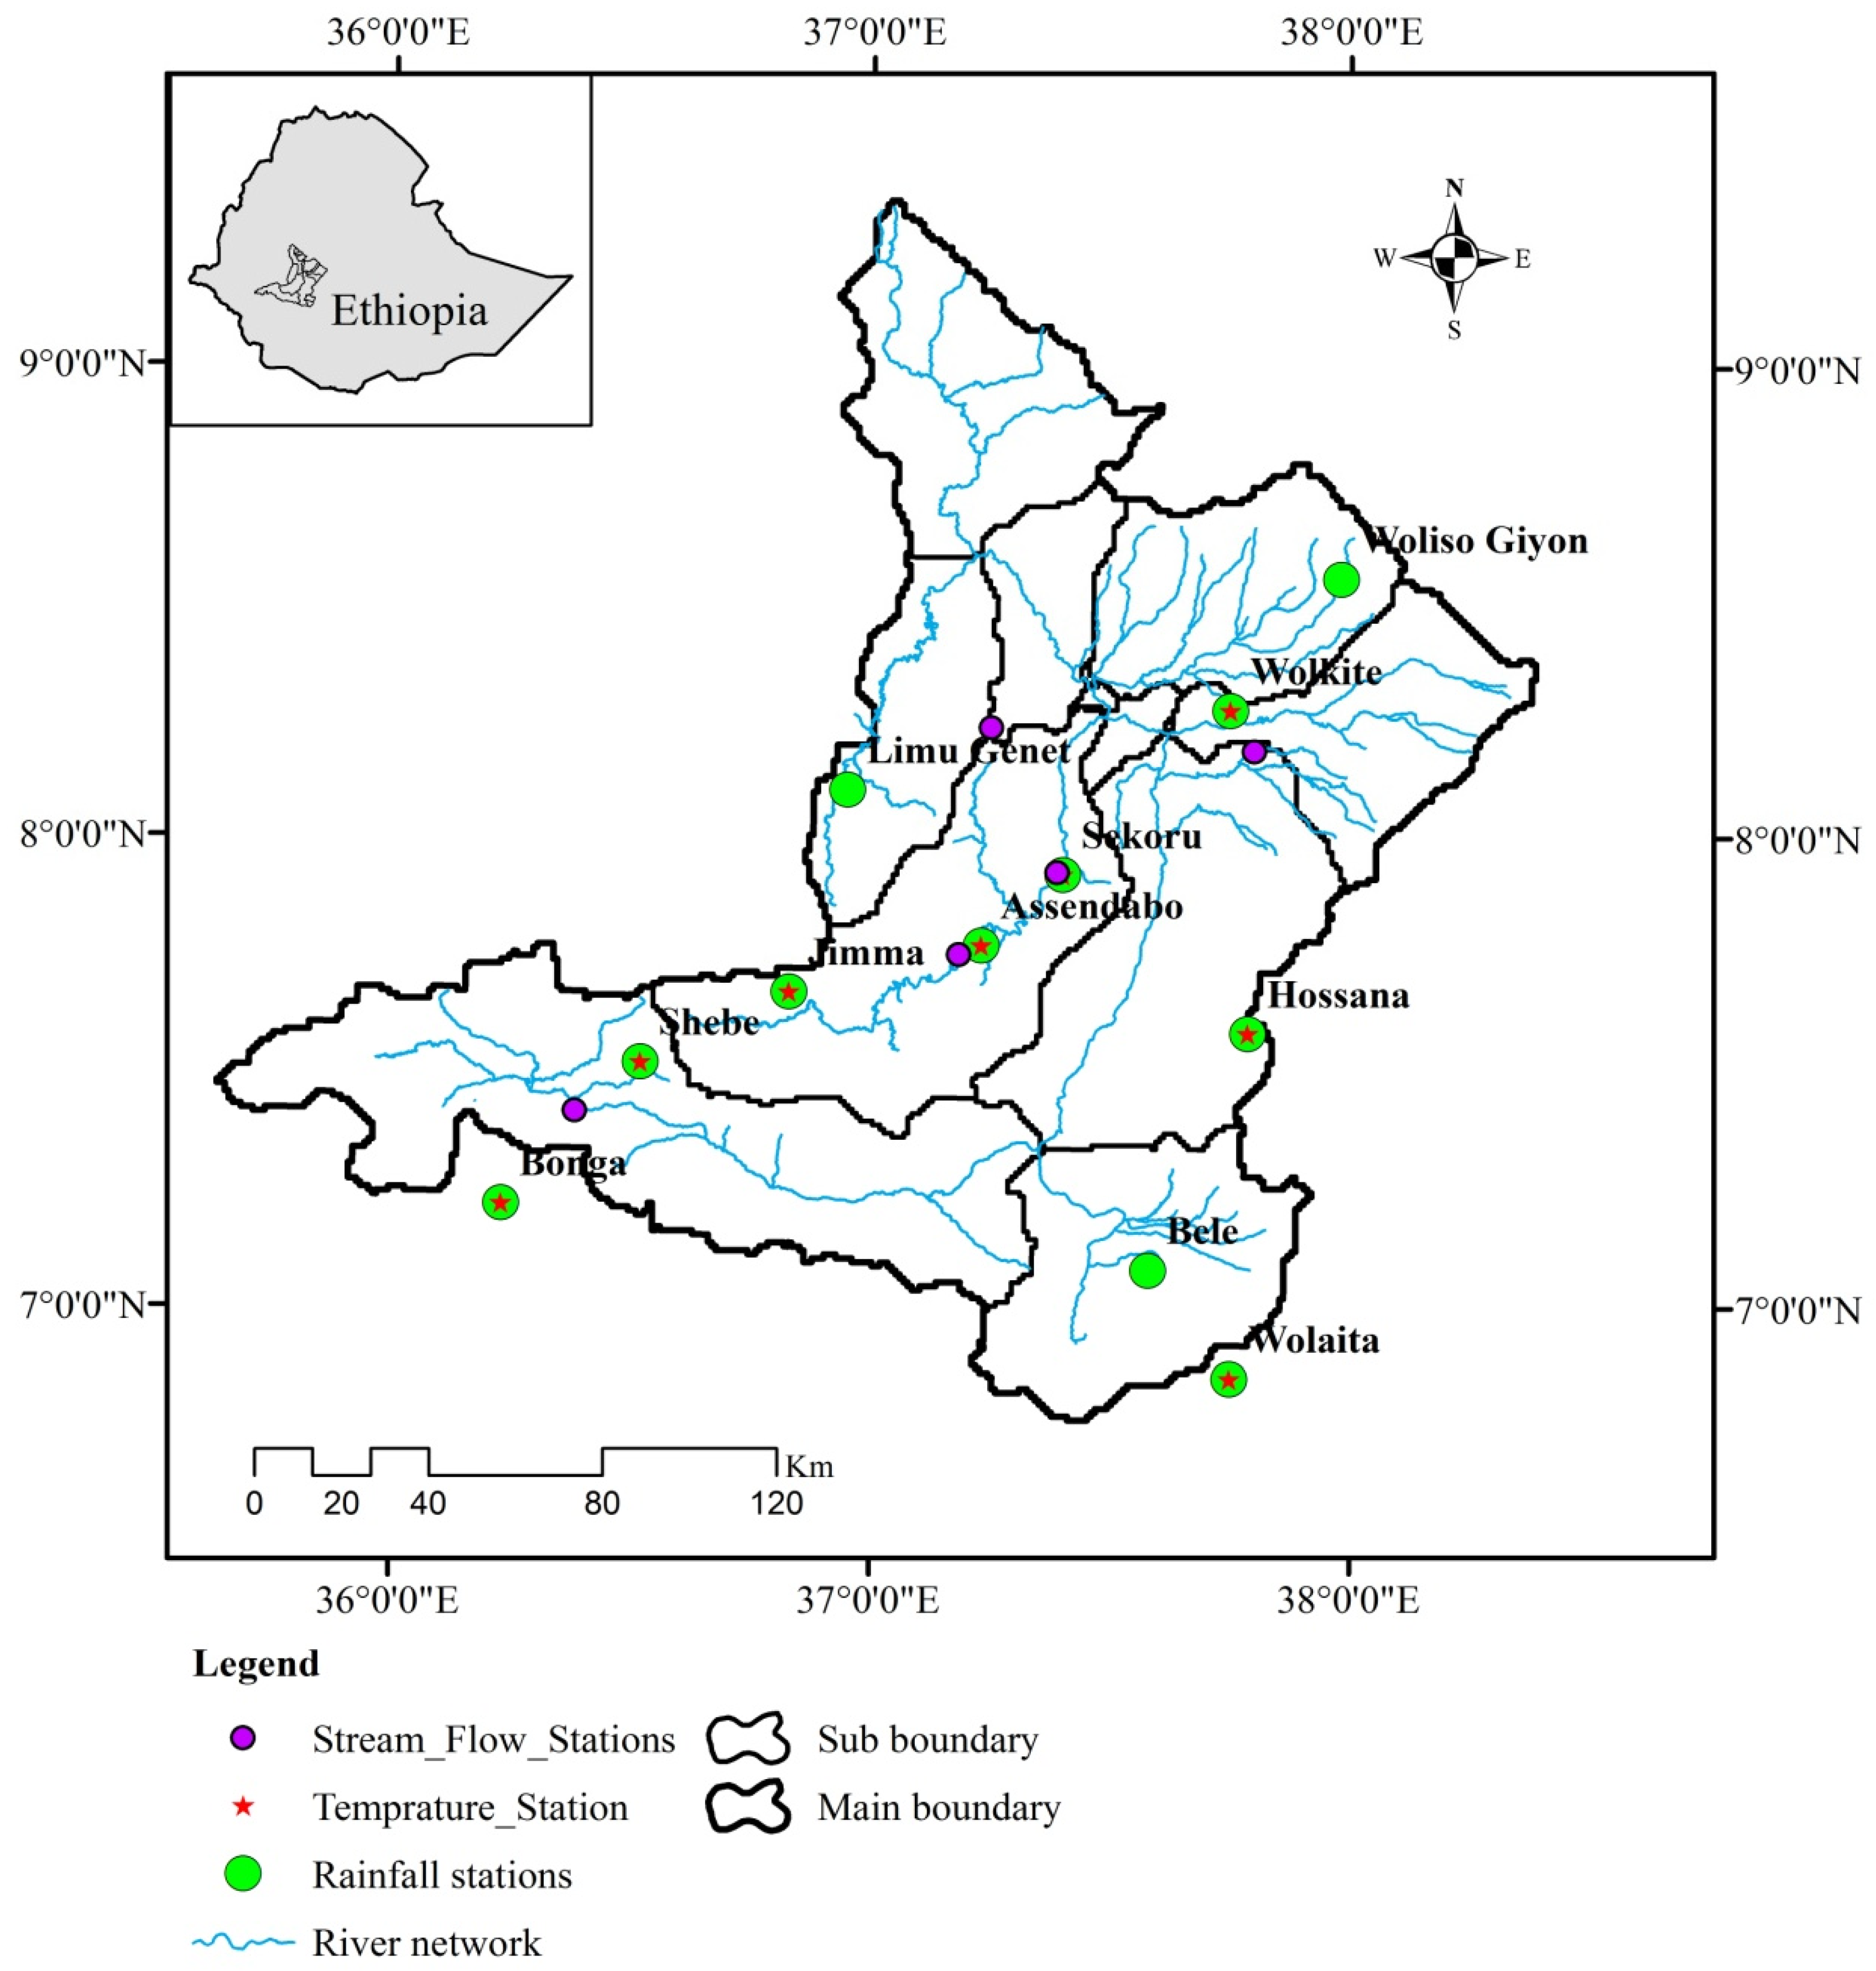
Figure 1. Location Map of the study area and meteorological stations of Upper Omo-Ghibe Basin (Gibe III catchment), Ethiopia.
Water 11 01951 g001
Figure 2. Spatial variation of temperature trends showing Z values in the Mann-Kendall test during the dry season: (a) minimum, (b) maximum, and (c) mean temperature.
Water 11 01951 g002
Figure 3. Mean annual and seasonal temperature trends for selected stations in upper Omo-Ghibe basin: (a,b) for Assendabo station, (c,d) for Jimma station.
Water 11 01951 g003
Figure 4. The mean annual rainfall trends for selected stations using a Mann-Kendall test: (a) Assendabo station and (b) Shebe station.
Water 11 01951 g004
Figure 5. Seasonal rainfall trends for selected stations: (a) Wet season at Assendabo and (b) dry season at Shebe.
Water 11 01951 g005
Figure 6. Annual rainfall time series plots for the change of time detection at (a) Shebe station, (b) Sekoru station, (c) Wolkite station, and (d) Assendabo station. The dashed lines represented by X1 and X2 are the mean of the time series before and after the change point respectively.
Water 11 01951 g006
Figure 7. Seasonal rainfall time series plots with change point detection: (a) Wet season at Assendabo station, and (b) wet season at Shebe station. The dashed lines represented by X1 and X2 are the mean of the time series before and after the change point, respectively.
Water 11 01951 g007
Figure 8. Time-series plots for (a) wet season flow at Assendabo station and (b) wet season flow at Shebe station.
Water 11 01951 g008
Figure 9. Mean annual and seasonal streamflow time series and change points: (a,b) Mean annual and wet season discharge at Assendabo station, (c,d) Mean annual and wet season discharge at Sekoru station. The dashed lines represented by X1 and X2 are the mean of the time series before and after the change point, respectively.
Water 11 01951 g009
Table 1. Summarized results of Pettit test for the mean annual and seasonal time scales. The first, second and third rows indicate for the minimum, maximum, and mean temperature, a positive sign in the parentheses indicate an increasing shift, and a negative sign indicates a decreasing shift. Bold numbers indicate p-values for statistically significant change points.
StationsMean AnnualWet SeasonDry Season
Assendabo1995(+), 0.001987(+), 0.011992(+), 0.00
1987(−), 0.091982(−), 0.111988(−), 0.15
1995(+), 0.001997(+), 0.051995(+), 0.00
Bonga1985(+), 0.252000(+), 0.121987(+), 0.04
1996(−), 0.211996(−), 0.161997(−), 0.40
1985(+), 0.111985(+), 0.301985(+), 0.07
Hossana1999(−), 0.411986(+), 0.421996(−), 0.16
1988(−), 0.111986(−), 0.031991(−), 0.05
1988(−), 0.701996(−), 0.671995(−), 0.54
Jimma1994(+), 0.001993(+), 0.031989(+), 0.02
1994(+), 0.001997(+), 0.041998(+), 0.00
1994(+), 0.001992(+), 0.051994(+), 0.00
Sekoru1993(−), 0.161993(−), 0.221987(+), 0.15
1988(−), 0.161986(−), 0.531988(−), 0.25
1993(−), 0.281996(−), 0.532002(+), 0.44
Shebe1993(−), 0.061990(−), 0.611991(−), 0.32
2001(−), 0.072001(−), 0.412001(−), 0.08
1999(−), 0.081993(-), 0.411993(−), 0.03
Wolkite2002(+), 0.002002(+), 0.012000(+), 0.00
1999(+), 0.021997(+), 0.031999(+), 0.01
1996(+), 0.002002(+), 0.011994(+), 0.00
Wolita1991(+), 0.031999(+), 0.011999(+), 0.05
1987(+), 0.022002(+), 0.231994(+), 0.14
1995(+), 0.072002(−), 0.401987(+), 0.03
Table 2. Description of the meteorological stations in the upper Omo-Ghibe basin covering the period 1981–2008.
Meteorological StationMean Annual Rainfall
(mm/year)
CV (%) for Rainfall DataCV (%) for Temp. DataMean Annual
Temp. (°C)
Elevation
(m.a.s.l)
% Rainfall RecordMissing Aver. Temp. Record
Assendabo118117.382.4919.7024000.28 1.6
Bele173029.38__12003.81_
Bonga163112.843.7819.3416503.65 3.06
Hossana114622.715.7017.0812004.012.86
Jimma152013.192.4819.5217250.010.02
Limugenet175915.53__16909.86_
Sekoru139012.174.5019.6121005.08 6.03
Shebe155018.654.1819.1216358.03 8.12
Wolita125128.352.0219.0813001.865.04
Woliso124112.09__20007.05_
Wolkite127727.305.4720.3115508.066.12
Table 3. Results of Mann-Kendall test for annual and seasonal rainfall at eleven stations, bold numbers indicate statistical significant trends at 0.05 level. Positive/negative Z value indicates increasing and decreasing trend, respectively.
StationsMean Annual (mm)CV %Mann-Kendall “Z” Statistics and “p” Value in (Brackets)
AnnualWet SeasonDry Season
Assendabo118117.382.21 (0.01)2.29 (0.01)0.67 (0.25)
Bele173029.381.21 (0.03)1.76 (0.04)0.16 (0.44)
Bonga163112.84−0.79 (0.48)1.03 (0.20)−1.42 (0.92)
Hossana114622.710.87 (0.19)1.70 (0.04)0.00 (0.50)
Jimma152013.191.03 (0.20)1.22 (0.11)−0.67 (0.75)
Limugenet175915.53−0.54 (0.74)−0.14 (0.52)−0.16 (0.56)
Sekoru139012.17−1.97 (0.03)−1.34 (0.71)−0.22 (0.59)
Shebe155018.65−1.98 (0.04)−1.34 (0.90)−1.99 (0.04)
Wolita125128.351.26 (0.10)1.38 (0.08)1.21 (0.29)
Woliso124112.09−0.51 (0.70)−0.67 (0.75)0.55 (0.29)
Wolkite127727.30−1.11 (0.87)−1.15 (0.87)−0.40 (0.65)
Table 4. Description of streamflow stations upper Omo-Ghibe basin covering the period 1981–2008.
River NameCatchment Area (km2)Mean Annual Stream Flow (m3/s)CV (%)Stream LocationPeriod of Records% Age of Missing Value
Gilgel Gibe296639.4927.17Assendabo1981–2008-
Bidru Awana410.4342Sekoru1981–2008-
Gojeb357754.3419.02Shebe1981–20080.5
Wabi186634.7937.28Wolkite1981–20080.36
Great Gibe15,690195.5334.03Abelti1981–20080.48
Table 5. Trend results of Mann–Kendall ‘Z’ statistic, and ‘p’ value (in brackets) for streamflow time series. Bold numbers indicate statistically significant trends at the 0.05 level. Positive/negative sign of Z indicates increasing/decreasing trend, respectively.
Stream Flow
Variables
Stations
AssendaboSekoruShebeWolkiteAbelti
Mean annual+1.74 (0.04)−0.83 (0.81)−0.20 (0.58)−0.22 (0.59)+0.83 (0.20)
Wet season+2.29 (0.01)−0.63 (0.74)−0.43 (0.67)−0.12 (0.55)+1.19 (0.12)
Dry season+0.63 (0.26)−0.12 (0.45)−1.70 (0.04)−0.77 (0.78)+1.11 (0.13)
January+2.92 (0.00)+1.09 (0.14)+1.86 (0.03)+0.63 (0.26)+2.88 (0.00)
February+3.08 (0.00)+0.26 (0.60)2.29 (0.01)2.73 (0.00)+3.04 (0.00)
March+1.90 (0.03)−0.12 (0.55)2.57 (0.01)+0.32 (0.38)+3.00 (0.00)
April+2.17 (0.01)+0.91 (0.18)+1.13 (0.02)+0.34 (0.37)+2.73 (0.00)
May+2.29 (0.01)−0.51 (0.70)+0.63 (0.26)+0.26 ((0.40)+2.96 (0.00)
June+0.87 (0.19)−1.01 (0.84)+0.32 (0.38)−0.43 (0.67)+2.37 (0.01)
July+1.58 (0.06)−0.65 (0.74)−1.22 (0.89)+0.20 (0.42)+1.50 (0.07)
August+1.54 (0.94)−1.28 (0.10)−1.82 (0.03)−0.04 (0.48)+0.28 (0.61)
September+0.63 (0.26)−1.13 (0.87)−1.15 (0.87)−0.97 (0.83)+0.63 (0.26)
October+0.36 (0.36)−0.08 (0.53)+0.12 (0.45)+0.16 (0.44)+0.40 (0.35)
November+0.99 (0.16)−1.32 (0.91)+0.00 (0.50)+1.09 (0.14)+0.85 (0.20)
December+2.05 (0.98)−0.43 (0.33)2.37 (0.01)+0.18 (0.57)+1.50 (0.93)