1. Introduction
Although flow around a cylinder is one of the classical subjects of fluid dynamics, few investigations have focused on the analysis of the turbulence structures of a steady flow at scoured horizontal cylinders. This topic is relevant in the hydraulic field because it is encountered in many engineering applications, such as pipelines suspended, laid on or half-buried installed across mobile riverbeds, where a small depth-to-diameter ratio is most relevant and scouring occurs under unidirectional current [
1]. In all these cases, the 3D flow field is extremely complicated due to the separation and the creation of multiple vortices. However, the complexity is further exaggerated owing to the dynamic interaction between the flow and the movable bed [
2]. Erosion may occur around the pipelines, causing a higher gap between it and the bed surface and, therefore, compromising their safety. Several research findings can be found in literatures for estimating the local scour around underwater pipelines under unidirectional current [
3]. Some of these studies have shown that the scour depth under unidirectional current is always higher than that under pure wave action or the combined effect of wave and current with the same bottom shear stress [
3]. Accurate estimates of the scour depth are important because flow-induced oscillation by wake-vortex shedding may provoke fatigue failure of the pipeline itself [
4], which is subjected to additional unsteady forces such as lift and drag.
The first investigation for estimating scour depth at submarine pipeline was conducted by Chao and Hennessy [
5], who proposed an analytical method for estimating the maximum scour depth under pure current condition. The use of this method was supported by other authors e.g., [
6,
7,
8]. The main drawback of the method is the use of a potential flow theory in deriving the solution. In real flow, the fluid is not inviscid, and separation occurs at the rear of the pipe. This phenomenon affects the flow conditions [
3]. Later, Kjeldsen et al. [
9] proposed an equation that implies that the scour depth only depends on flow velocity and pipe diameter, but excludes the effect of flow depth and grain size. Bijker and Leeuwestein [
10] stated that the scour depth depends on the undisturbed flow velocity, pipe diameter, flow depth, height of pipe above bed level, and grain size. They stated that the principal cause of erosion is a local increase in transport capacity of the water passing a pipeline, while deposition occurs where this capacity decreases [
3]. Ibrahim and Nalluri [
11] proposed two empirical equations relating the scour depths to flow parameters for both clear-water and live-bed conditions. The equations were derived purely from curve fitting technique. Furthermore, they stated that the grain size has no influence on the scour depth, apart from the indirect influence on the value of the critical velocity. Hansen et al. [
12] obtained a relationship between the bed velocity in the scour hole and the two geometric quantities
e/
D and
ds/
D, where
e is the gap between the underside of the cylinder and the original bed level,
D is the cylinder diameter and
ds the scour depth. They stated that the flume width would also influence this relationship. Mao [
13] examined the scour profiles below pipelines under different flow velocities and observed that, for
ds/
D < 1
ds, is a weak function of the flow Shields parameter. He also identified two cases of the scour process: (1) jet period, which decides the maximum scour depth; (2) wake period, which decides the location of maximum scour depth. Maza [
14] proposed a graphical solution for the estimation of
ds that is a function of the initial gap-pipe diameter ratio and the flow Froude number, while Moncada and Aguirre [
15] gave an empirical equation of
ds assuming a similar functional representation used by Maza [
14]. Chiew [
16] identified that piping plays a dominant role in initiating scour at submarine pipelines. Later, Chiew [
3] proposed an empirical function relating the flow depth ratio,
h/
D, with the gap-flow rate ratio, which can be used to determine the amount of gap flow through the scour hole at equilibrium conditions. Li and Cheng [
17] used the finite difference method to solve the Laplace equation of velocity potential and a boundary adjustment technique to calculate the scour profiles below pipelines, while Brørs [
18] used the finite element method to simulate the scour profiles below pipelines. Dey and Singh [
4] examined their experimental results to describe the influence of various parameters on the equilibrium scour depth, that is flow depth, sediment gradation, different shaped cross-sections of pipes. Lately, Mohr et al. [
19] related the rate of scour beneath a pipeline to the fundamental erosion properties of the sediment, namely the transport rate along the bed and the true erosion rate of the sediment. These arguments lead to two new empirical formulas that may be used to predict the time scale of the scour process beneath subsea pipelines. Note that these previous researches concentrate on soil scour around fixed pipelines. More recently, Gao et al. [
20] simulated experimentally the current-induced sand scour around a vibrating pipeline to further investigate the mechanism of the coupling effects between pipe vibration and sand scour.
At the same time, several studies have been carried out both numerically and experimentally on the flow field analysis considering a flat bed. A state-of-art review of the research on the cylinder-bed surface interactions exposed to currents was conducted by Fredsøe [
1]. For example, Bearman and Zdravkovich [
21] carried out an experimental study on the flow around a cylinder lying horizontally at various elevation above a plane bed surface. They demonstrated that regular vortex shedding was suppressed for all gaps less than about 0.3
D. For gaps greater than 0.3
D, the Strouhal number, that is the ratio between inertial forces due to the unsteadiness of the flow and expresses the oscillating flow mechanisms, was found to be remarkably constant and the only influence of the plate on vortex shedding was to make it a more highly tuned process as the gap was reduced. Later Zdravkovich [
22] studied in detail the flow separation from a flat plate induced by a circular cylinder. He demonstrated that when the cylinder was placed above the bed surface, the downstream separation region contained two counter-rotating vortices separated by stagnant fluid. However, no regular vortex shedding was observed in this configuration, whereas he reported that in the case of turbulent boundary layer vortex shedding occurred for a gap of 0.2
D and for the laminar boundary layer at a gap of 0.3
D. Lei et al. [
23] analyzed the hydrodynamic forces and vortex shedding of a cylinder at different locations in the boundary layer. They proposed a quantitative method for identifying the vortex shedding suppression point. Their observations showed that the vortex shedding is suppressed at a gap of about 0.2–0.3
D, depending on the thickness of the boundary layer. This critical gap decreases as the thickness of the boundary layer increases. Price et al. [
24] performed visualization studies on the flow-cylinder interactions in the boundary layer. Specifically, they distinguished four distinct regions: (i) for gaps < 0.125
D, the gap flow is suppressed or extremely weak, and separation of the boundary layer occurs both upstream and downstream of the cylinder. Although there is no regular vortex shedding, there is a periodicity associated with the outer shear-layer; (ii) in the region between 0.125
D and 0.5
D, the flow is very similar to that for very small gaps, except that there is a pronounced pairing between the inner shear-layer shed from the cylinder and the wall boundary layer; (iii) the region between 0.5
D and 0.75
D is characterized by the onset of vortex shedding from the cylinder; (iv) for the fourth region, with a gap greater than
D, there is no separation of the wall boundary layer, either upstream to or downstream of the cylinder. However, downstream of the obstacle, alternate vortex shedding from the cylinder affects the wall boundary layer. Hatipoglu and Avci [
25] studied experimentally and numerically the flow around a horizontal cylinder mounted and partially buried, showing that the lengths of the separation regions near the upstream and downstream of the cylinder decreased with the increasing burial ratio. More recently, Akoz et al. [
26] studied quantitatively the flow characteristics of the circular cylinder laid on a fixed surface, by using the Particle Image Velocimetry (PIV) technique. The main purpose was to reveal the mechanisms of vortical flow structures that are mostly responsible for scour and burial processes. They demonstrated that the intersection of the bed surface and cylinder enhances the burial mechanisms hydrodynamically even in wake flow regions. Furthermore, it was shown that the wake flow region is shortened in size in the longitudinal direction as a function of the Reynolds number. More recently, Arslan et al. [
27] studied for four different submergence ratios the 3D unsteady flow around a rectangular cylinder with the large eddy simulation (LES) turbulence model. To conduct the analysis, they used the experimental data obtained by Malavasi and Guadagnini [
28]. As a result, they characterized the behavior of vortex structures generated by separated flow and the hydrodynamic forces acting on the semi-submerged structure.
Few are the studies in which the turbulence flow structures are analyzed focusing in the neighborhood of the cylinder considering a mobile bed. The first studies on this topic were those of Kjeldsen et al. [
9] and Mao [
13], who examined the flow around a pipe placed over a scour hole, Jensen et al. [
29] investigated experimentally the flow around a pipeline placed initially on a flat bed at five characteristic stages of the scour process in currents. They found that the mean flow field and turbulence around and the force on a pipeline undergo considerable changes, as the scour below the pipeline develops in time and space. Moreover, vortex shedding comes into existence at early stages of scour process, first in a somewhat premature form caused by the close proximity of the dune formed downstream the pipe as a result of deposition of scoured material. As the dune moves away from the pipe, the vortex shedding gradually reaches a stage which resembles the shedding process of a free cylinder. Starting from this experimental campaign, Smith and Foster [
30] examined the flow physics around the pipeline (considering also the bed scouring phenomenon) using numerical modelling. They compared the mean horizontal and vertical velocities and the wake characteristics measured by Jensen et al. [
29] to those obtained by applying a computational fluid dynamics (CFD) model (Flow3D) using both a two-equation
k-ε model and a Smagorinsky LES turbulence closure scheme for five stages of the scour process.
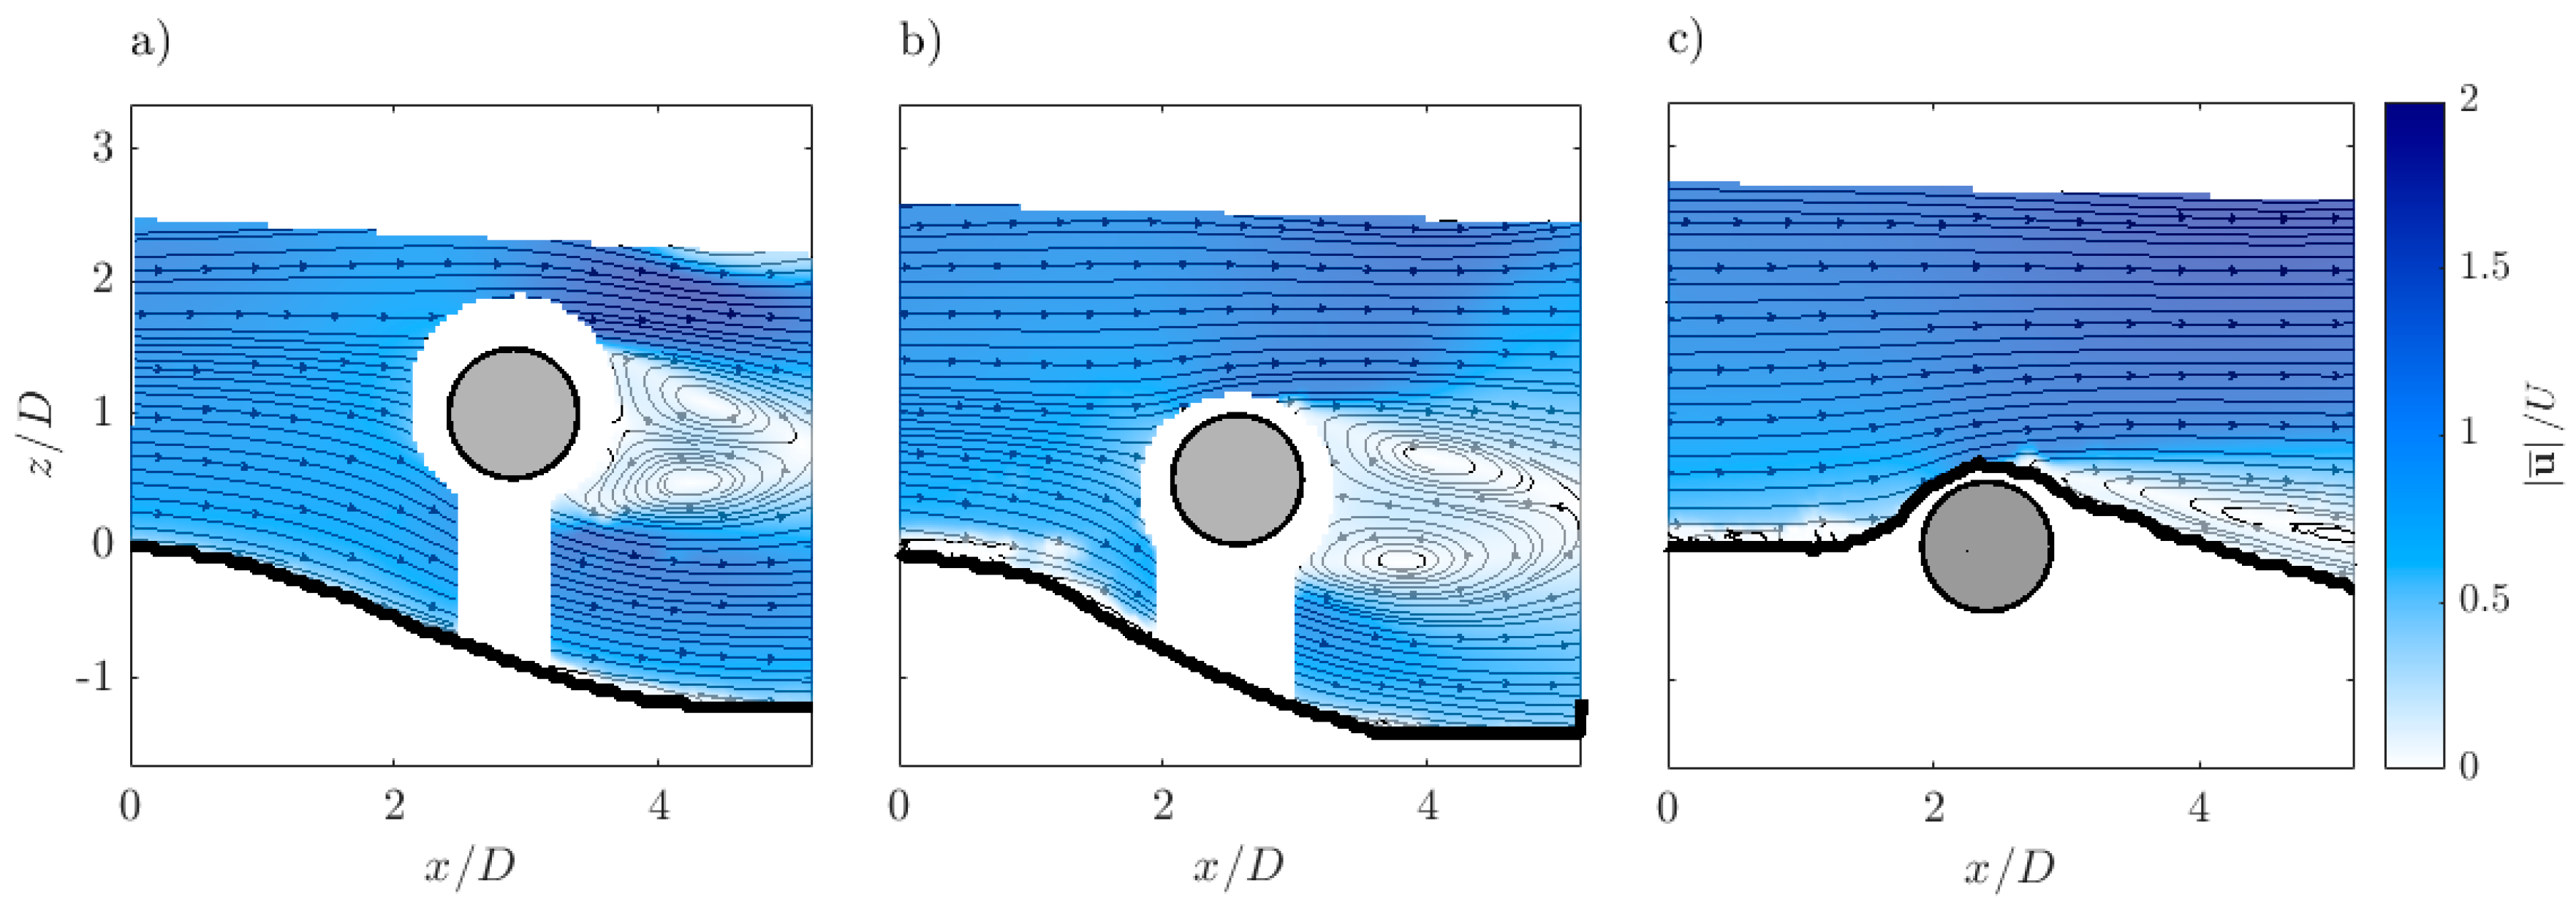
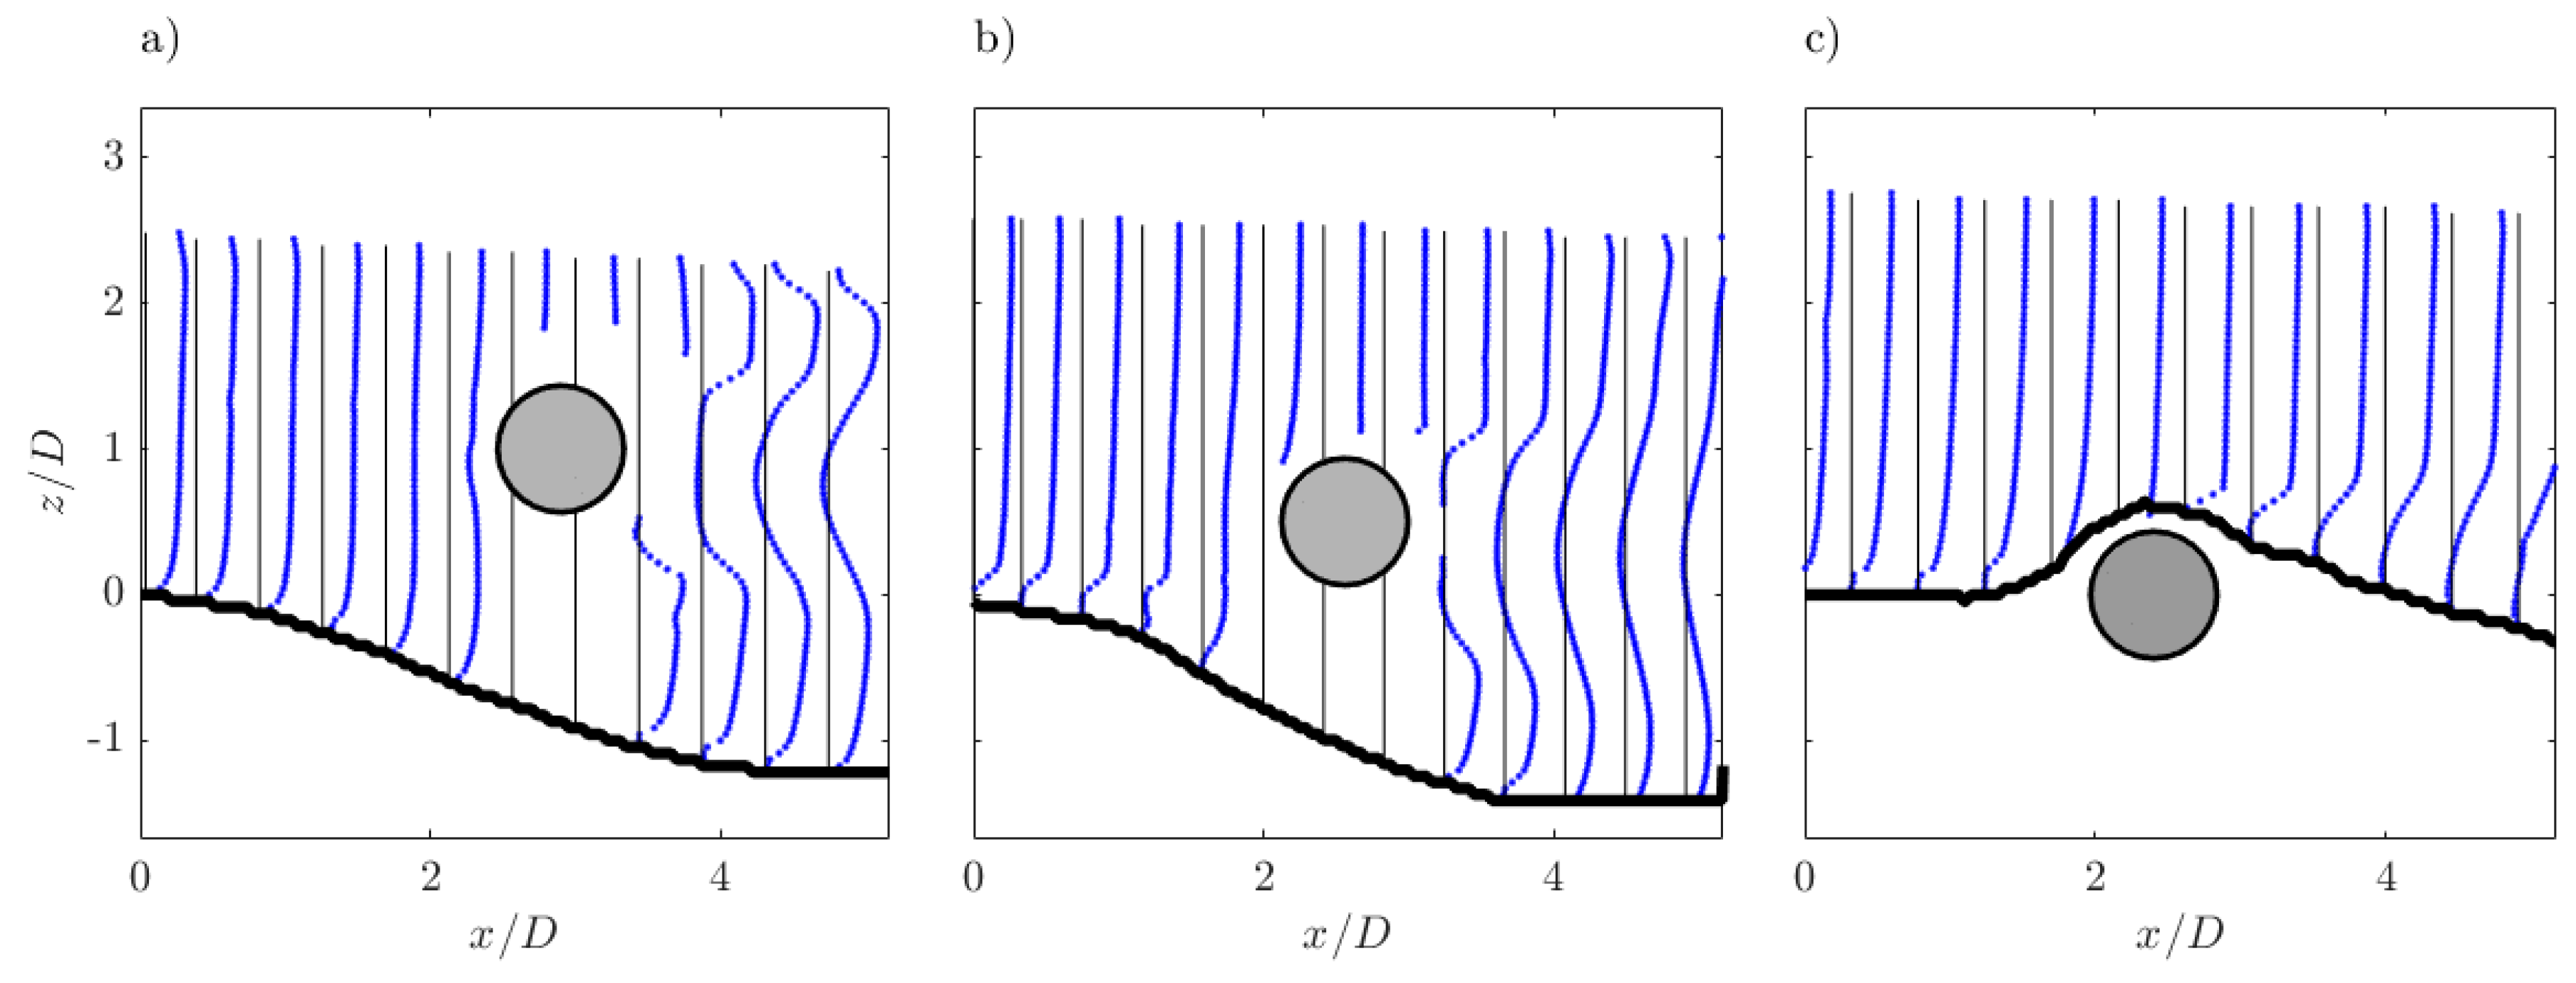
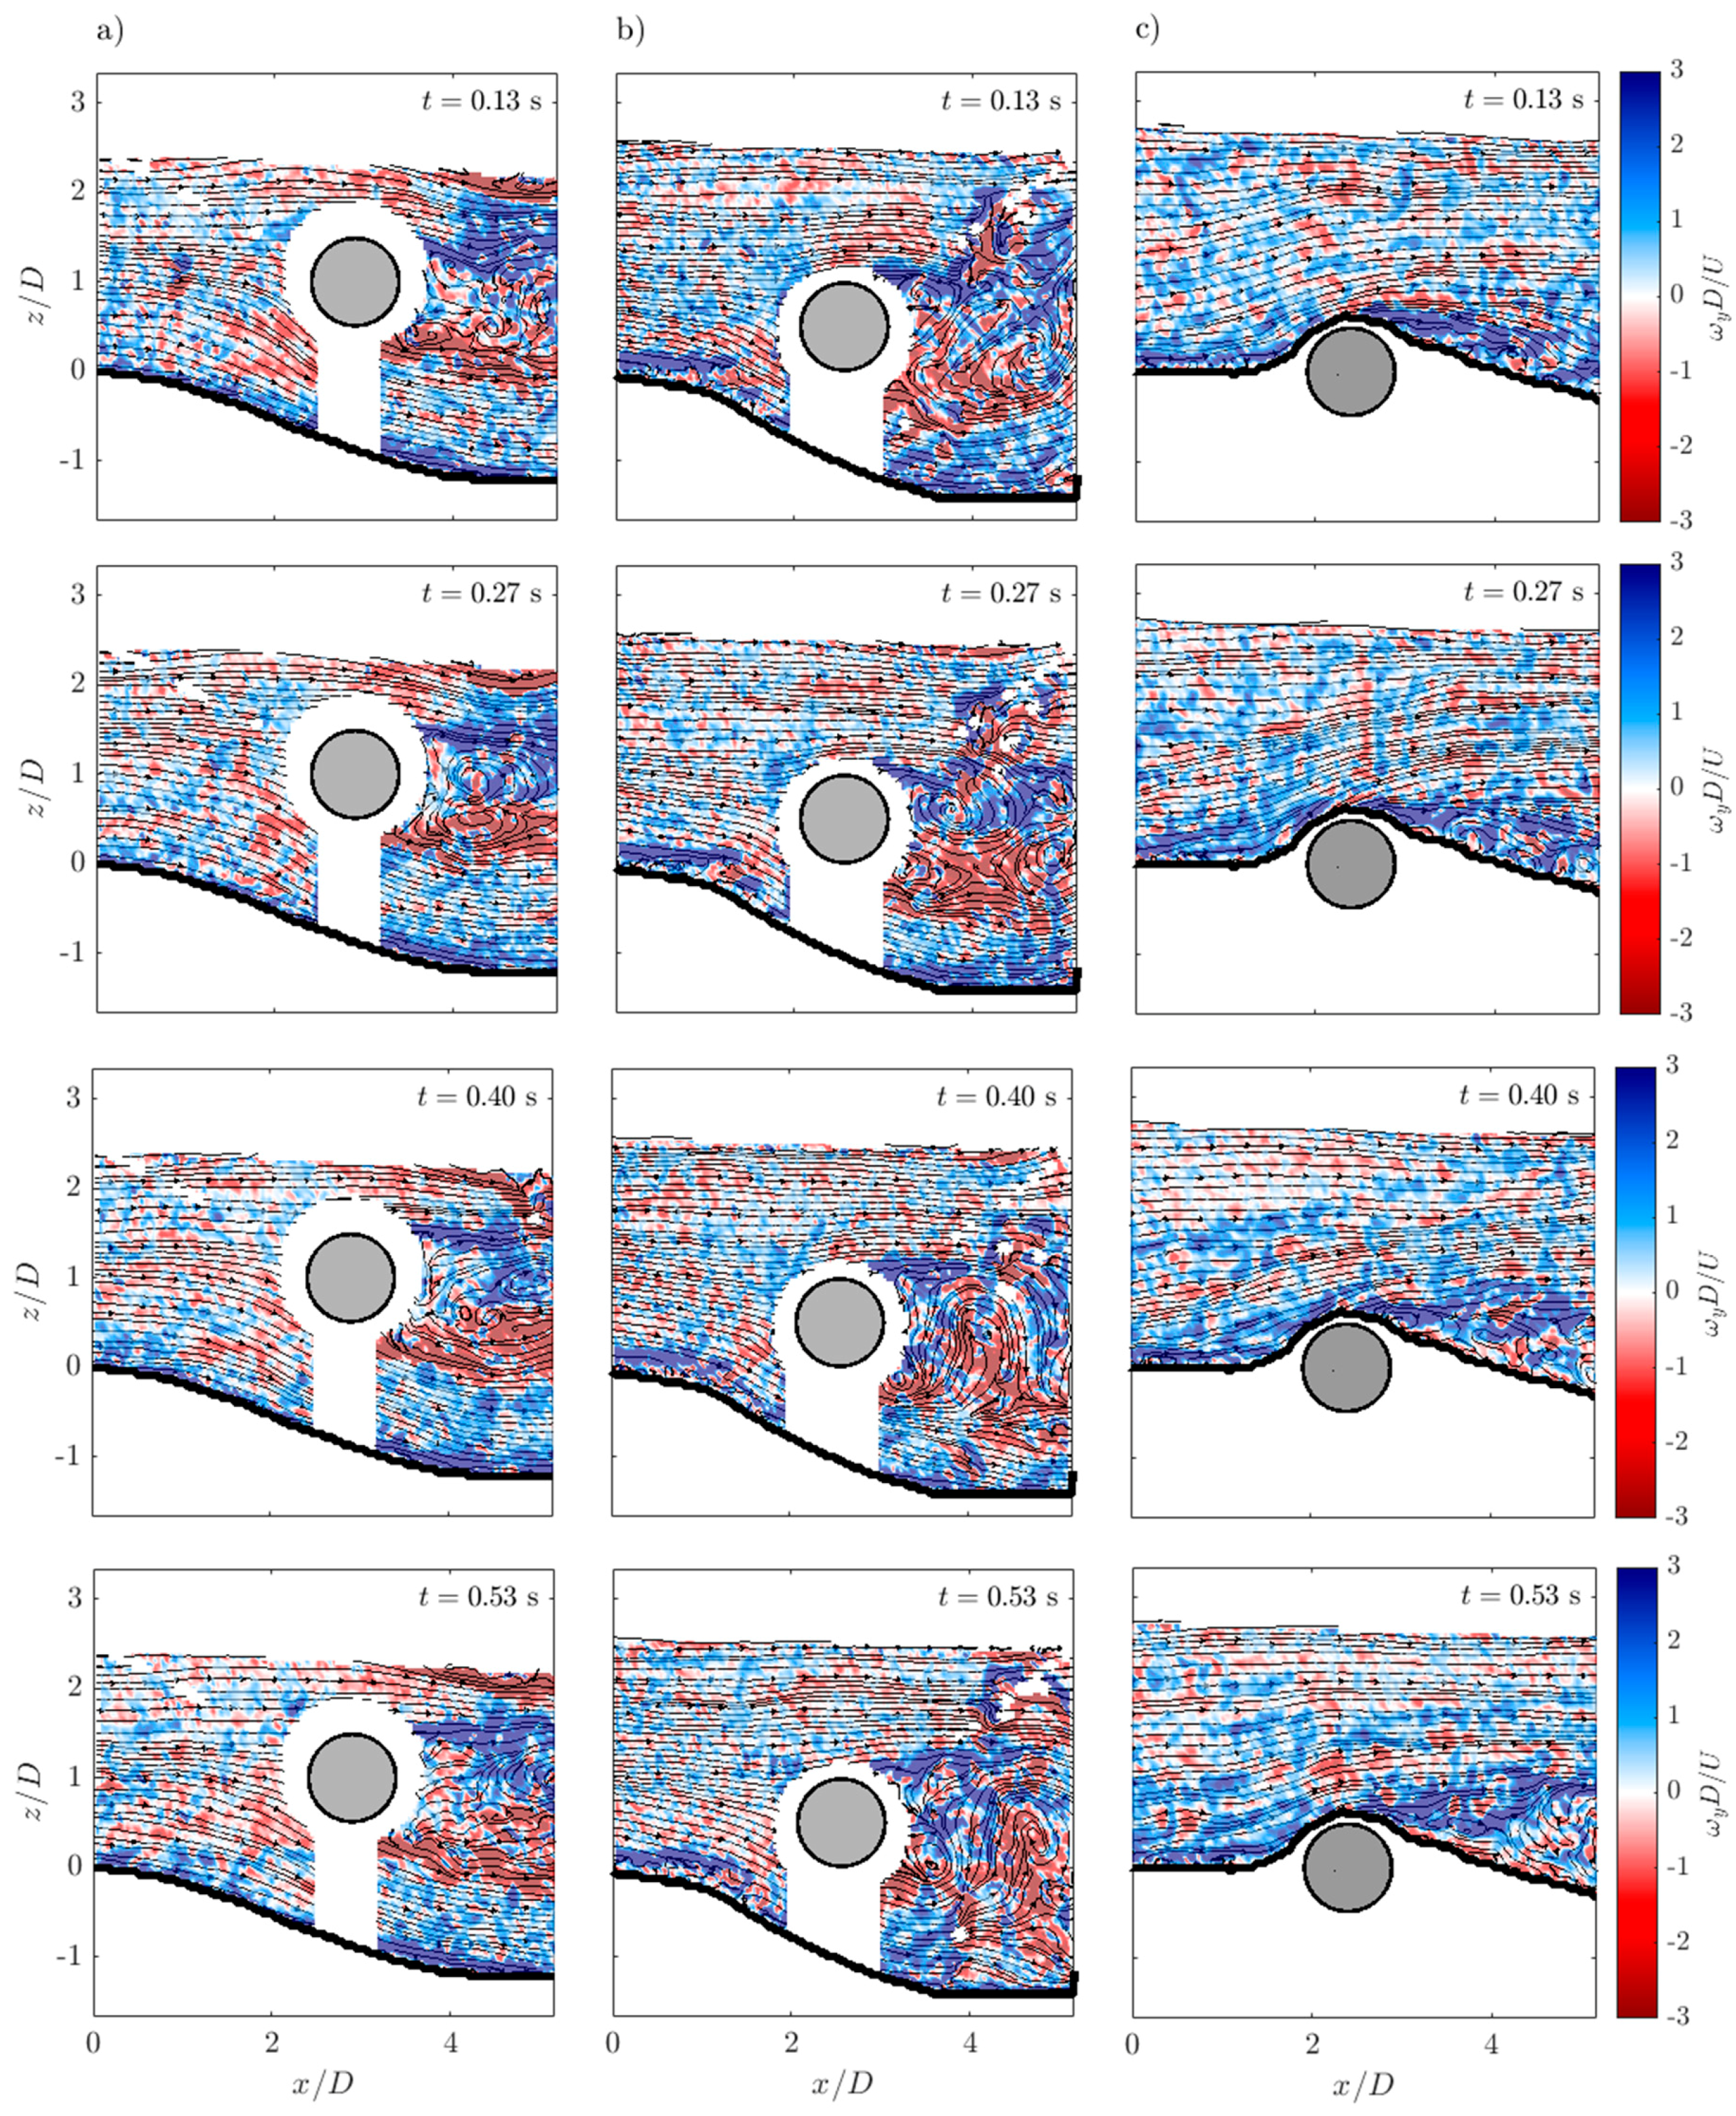
Thus, the main purpose of the study was to identify the flow structures in shallow water condition developed once the bed scour reached the equilibrium, varying the gap between the cylinder and the bed surface. Specifically, three different conditions were reproduced in a laboratory flume: a suspended cylinder, a laid on cylinder and a half-buried cylinder. The analysis was focused on the velocity measurements in correspondence of the horizontal cylinder and on the determination of the instantaneous and ensemble-averaged velocity fields, the instantaneous and ensemble-averaged vorticity fields, viscous and Reynolds stresses, and the ensemble-averaged turbulence indicators. In addition, the equilibrium longitudinal bed profiles were discussed in order to better comprehend the effect induced by the flow-structure interactions.
2. Experimental Set-Up and Procedure
The experimental campaign was performed at the Laboratorio “Grandi Modelli Idraulici” (GMI, Università della Calabria, Italy). A recirculating flow channel (9.6 m long, 0.485 m wide, 0.5 m deep) was used in this study. The flume side walls were made of glass in order to visualize the flow. The inlet of the flume comprised of a stilling tank, an uphill slipway, and honeycombs (having a diameter of 10 mm) to dampen the flow disturbances at the entry. The test section was located at 7.33 m downstream of the flume entrance and it was 0.165 m long. The flow depth was regulated by a downstream tailgate. To collect the outflow, a tank equipped with a calibrated Thomson weir to measure the flow discharge was attached downstream of the tailgate.
The bed was constituted by very coarse sand having a median sediment size d50 of 1.53 mm (0.06 mm < d < 2 mm, where d is the size of sediments) and geometric standard deviation σg [=(d84/d16)0.5] of 1.24, where d16 and d84 are the 16% and 84% (by weight) finer sizes of sediments, respectively. The sediment density was ρs = 2680 kg/m3. To prepare the bed, sediments were initially spread within the flume and screeded to create a bed with a longitudinal slope S0 of 0.1%.
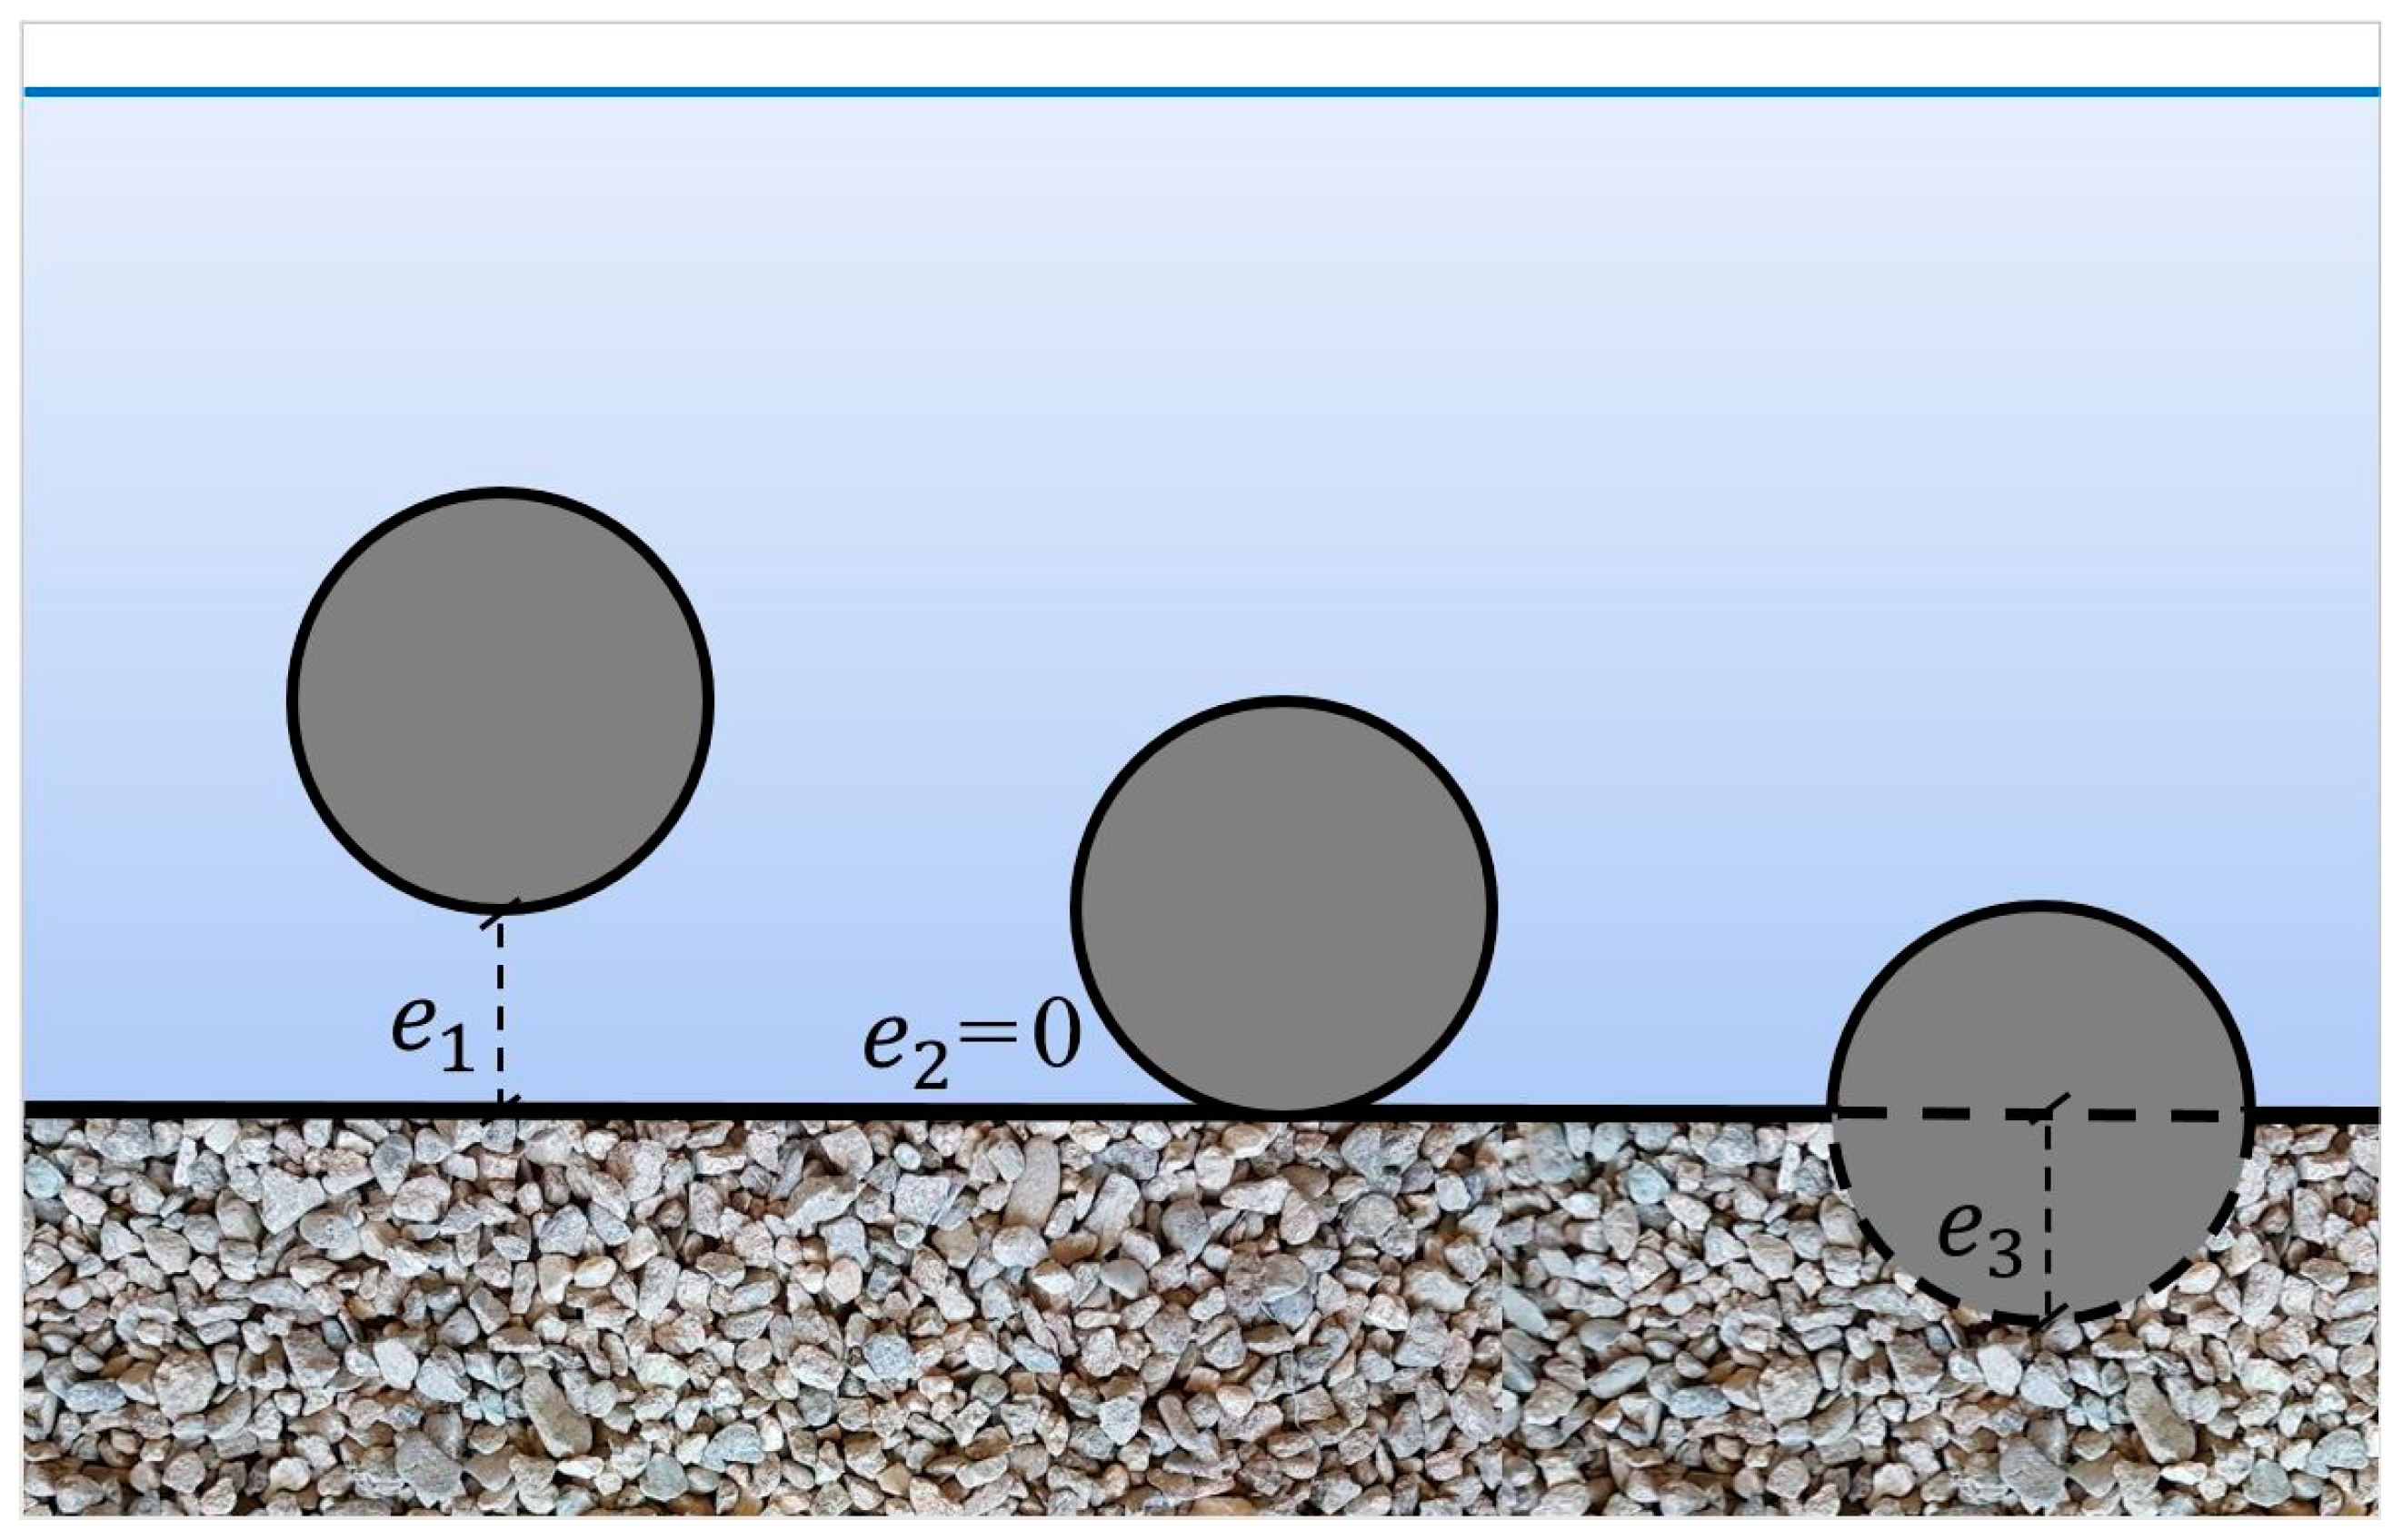
A horizontal cylinder of 30 mm in diameter made of Plexiglas was set up at the center of the test section. The cylinder was fixed to the flume walls and kept normal to the flow direction. Three different gaps, respectively
e1,
e2 and
e3, between the cylinder and the bed surface were considered, as represented in
Figure 1 and reported in
Table 1: (i) suspended cylinder; (ii) cylinder laid on the bed; (iii) partially buried cylinder. To ensure direct comparisons of the results, the bed surface was leveled at the start of each experiment.
The runs were carried out under the same hydraulic conditions. Specifically, the initial flow depth
h was about 0.074 m, as measured immediately upstream to the cylinder from the sediment crest. Therefore, the aspect ratio
B/
h was greater than 5 (
B being the flume width) and the effect of the sidewalls is negligible [
31] in our experimental set-up. However, the ratio
h/
D was kept constant and equal to 2.5. Thus, being
h/
D < 5 [
4], the shallowness effect is present in all the runs and, therefore, the resulting scouring process is due to the cylinder-bed surface interactions at different gaps in shallow water condition. The threshold flow velocity,
Uc, was determined using Neill’s empirical formula [
32] and was equal to 0.37 m/s, higher than the average flow velocity
U =
Q/(
Bh) ≈ 0.28 m/s,
Q being the flow discharge. This indicates a clear-water condition. The flow Reynolds number
Re (=4
Uh/
υ, where
υ = 1.04 × 10
−6 m
2/s at 18.4 °C is the kinematic water viscosity), the flow Froude number
Fr [=
U/(
gh)
0.5, where
g is the gravitational acceleration], the cylinder Reynolds number
Rec (=
UD/
υ, where
D is the cylinder diameter) and the other hydraulic parameters are listed in
Table 1 for each experimental run. Specifically, upstream of the cylinder (where the flow was not affected), the shear velocity
u* was estimated by extending the Reynolds shear stress profile linearly to the maximum gravel crest as
(where
and
are the temporal velocity fluctuations in the streamwise and vertical directions, respectively, and
zc is the maximum gravel crest elevation). Hence, the Reynolds number of the sediments
Re* was calculated as
u*ε/
υ, where
ε is the equivalent sand roughness height ≈ 2
d50 [
33].
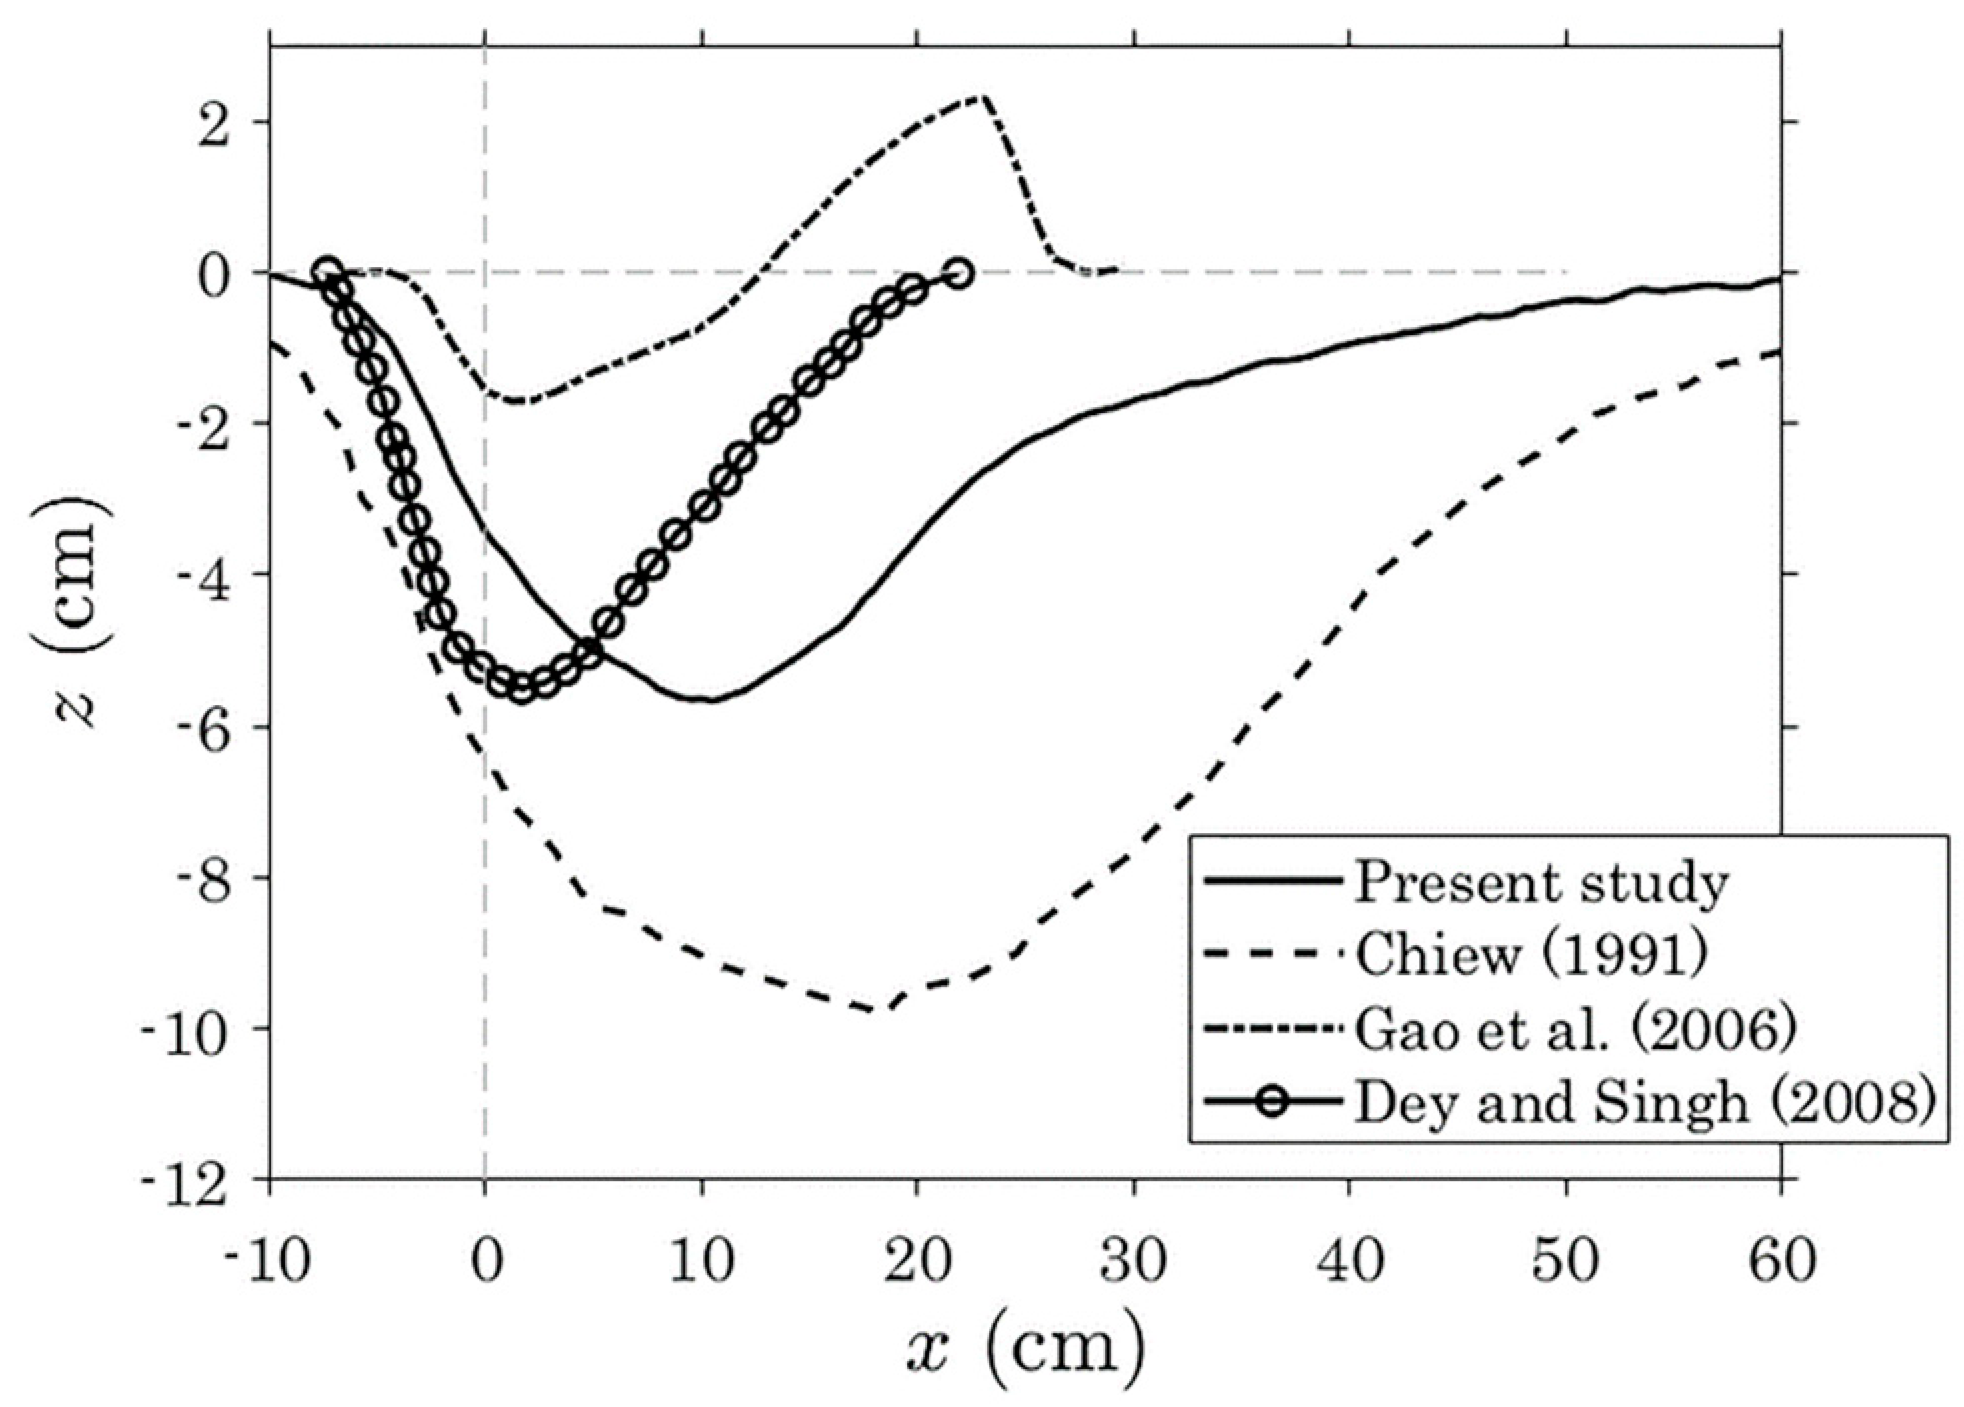
During all the experimental runs bed scouring occurred. It was found that the equilibrium scour depth was reached within 24 h for all the three experimental runs. This is in line with the findings of Chiew [
3]. Dey and Singh [
4] demonstrated that the time to reach the equilibrium scour below a pipeline is shorter than that at an abutment, since it is due to strong pressurized flow and not to primary or horseshoe vortex. Also, Mao [
13] observed equilibrium scour below a cylinder in just over 3 h.
A 2D PIV system manufactured by TSI was used to measure the flow field. It consisted of a 12 bit CCD camera (Nikon, city, country, 50 mm F1.8 lens, 2048 × 2048 pixel
2 resolution, 15.2 × 15.2 mm
2 sensor size) and a double pulse Nd:YAG laser with a frame rate of 15 Hz and a pulse energy of 200 mJ at a wavelength of 532 mm. Titanium dioxide powder, having a diameter of 3 μm and a mass density of 4.26 kg/m
3, was used as a tracer during flow measurements. The test section was illuminated with the laser to capture the movement of the tracer particles through the camera placed parallel to the laser sheet. The flow measurements were taken in correspondence of the horizontal cylinder. In order to measure the flow field, 3000 pairs of images were captured over a period of about 200 s. The inter-frame time between two laser pulses was set equal to 1400 μs, which means that, considering
U ≈ 0.28 m/s, we were able to measure only eddies greater than 0.39 mm. The actual size of the eddy is imposed by the spatial resolution of the PIV measurements [
34]. The field of view was 165 × 165 mm
2 with an interrogation area of 32 × 32 pixel
2. A 50% overlap of the interrogation areas was employed to increase the spatial resolution of the measurement [
35] to about 1.3 mm (which corresponds to 12.4 pixel/mm). The Insight 4G-2DTR software was used during the acquisition phase and to process the resulting data.
The precision in the flow velocity measurements with a PIV system depends to a great extent on the errors introduced by the sub-pixel estimator in the cross-correlation. This is known as “peak-locking” and is a bias error in the PIV that occurs when the particle images are too small, causing the particle image displacement to be biased toward integer value. The error is estimated to be 10% of the particle image diameter, which is the diameter in pixels of the particle as seen through the camera [
36]. The mean particle image diameter in the present case is about 1 pixel, and a typical displacement between the cross-correlation image pairs is 5 pixels in the main flow direction. Therefore, the estimated random error of the measured velocity vector in each interrogation area is about 2% for the streamwise velocity component.
However, as
a priori method, in order to reduce peak-locking, through a trial and error procedure we set an aperture number
f# equal to 11, in order to ensure that all the tracer particles in the light sheet (having a thickness of 2 mm) were in focus. Nevertheless, following the procedure described in Padhi et al. [
34], we used also and
a posteriori method pre-processing all the images by using a filter (already available in the Insight 4G-2DTR software), which optimized the particle image diameter with respect to the peak estimator, in order to improve the signal-to-noise ratio.
The flow was stopped at the end of the measurement phase and, subsequently, the flume was slowly emptied without any disturbance for the bed scour by using a bottom outlet located 1 m downstream of the test section. For each run, the bed surface was acquired with the photogrammetry technique. Photogrammetry is used in different fields such as topographic mapping, architecture, engineering, cultural heritage and geology e.g., [
37,
38,
39]. Following the procedure described in Penna et al. [
40], a Nikon D5200 camera was used, equipped with a Nikkor 18–55 mm f/3.5–5.6 G VR lens. The resulting 3D point cloud was at first transformed into an unstructured triangular mesh by using the software PhotoScan (Agisoft, St. Petersburg, Russia). Then a structured grid was extracted using the commercial software Rhinoceros (McNeel & Associates, Seattle, WA, USA), with a spatial resolution
δl = 5 mm in both the streamwise and spanwise directions.
4. Conclusions
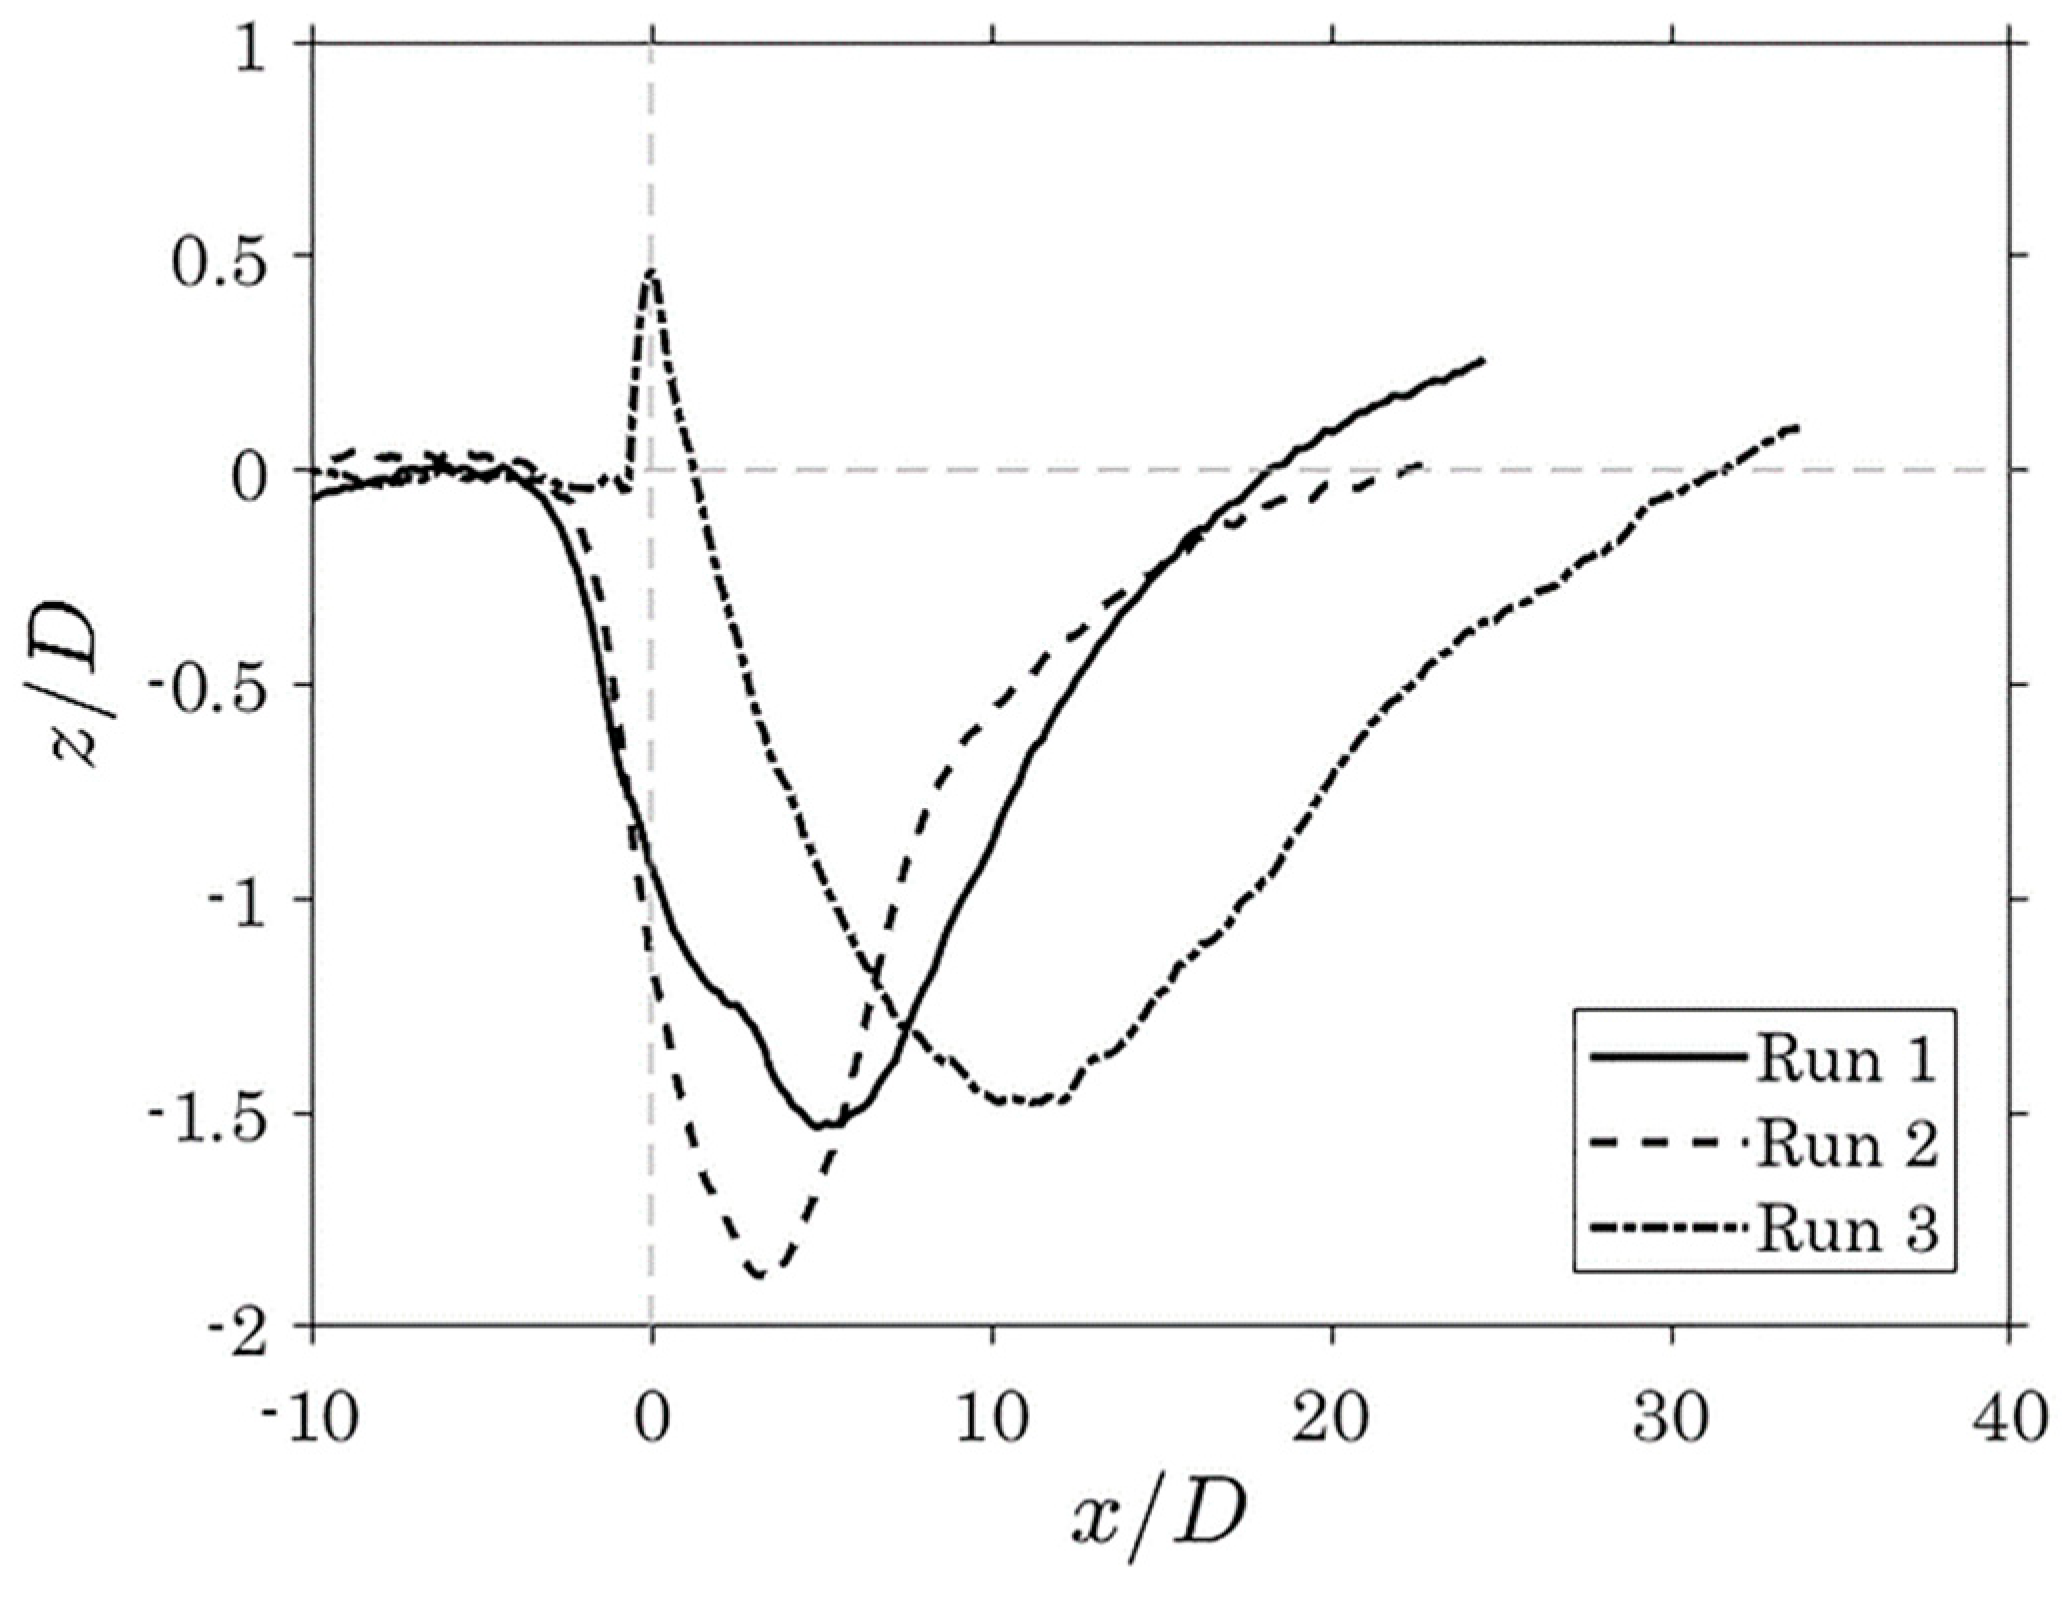
This study examines the turbulence characteristics at scoured horizontal cylinders in different condition of submergence, in order to deepen the knowledge investigating the flow-structure interactions in the presence of a mobile bed in shallow-water condition. Three experimental runs were performed considering a suspended cylinder, a laid on cylinder and a half-buried cylinder. Specifically, bed scouring occurred in all the runs and the resulting bed configurations were analyzed in order to better comprehend the flow dynamics.
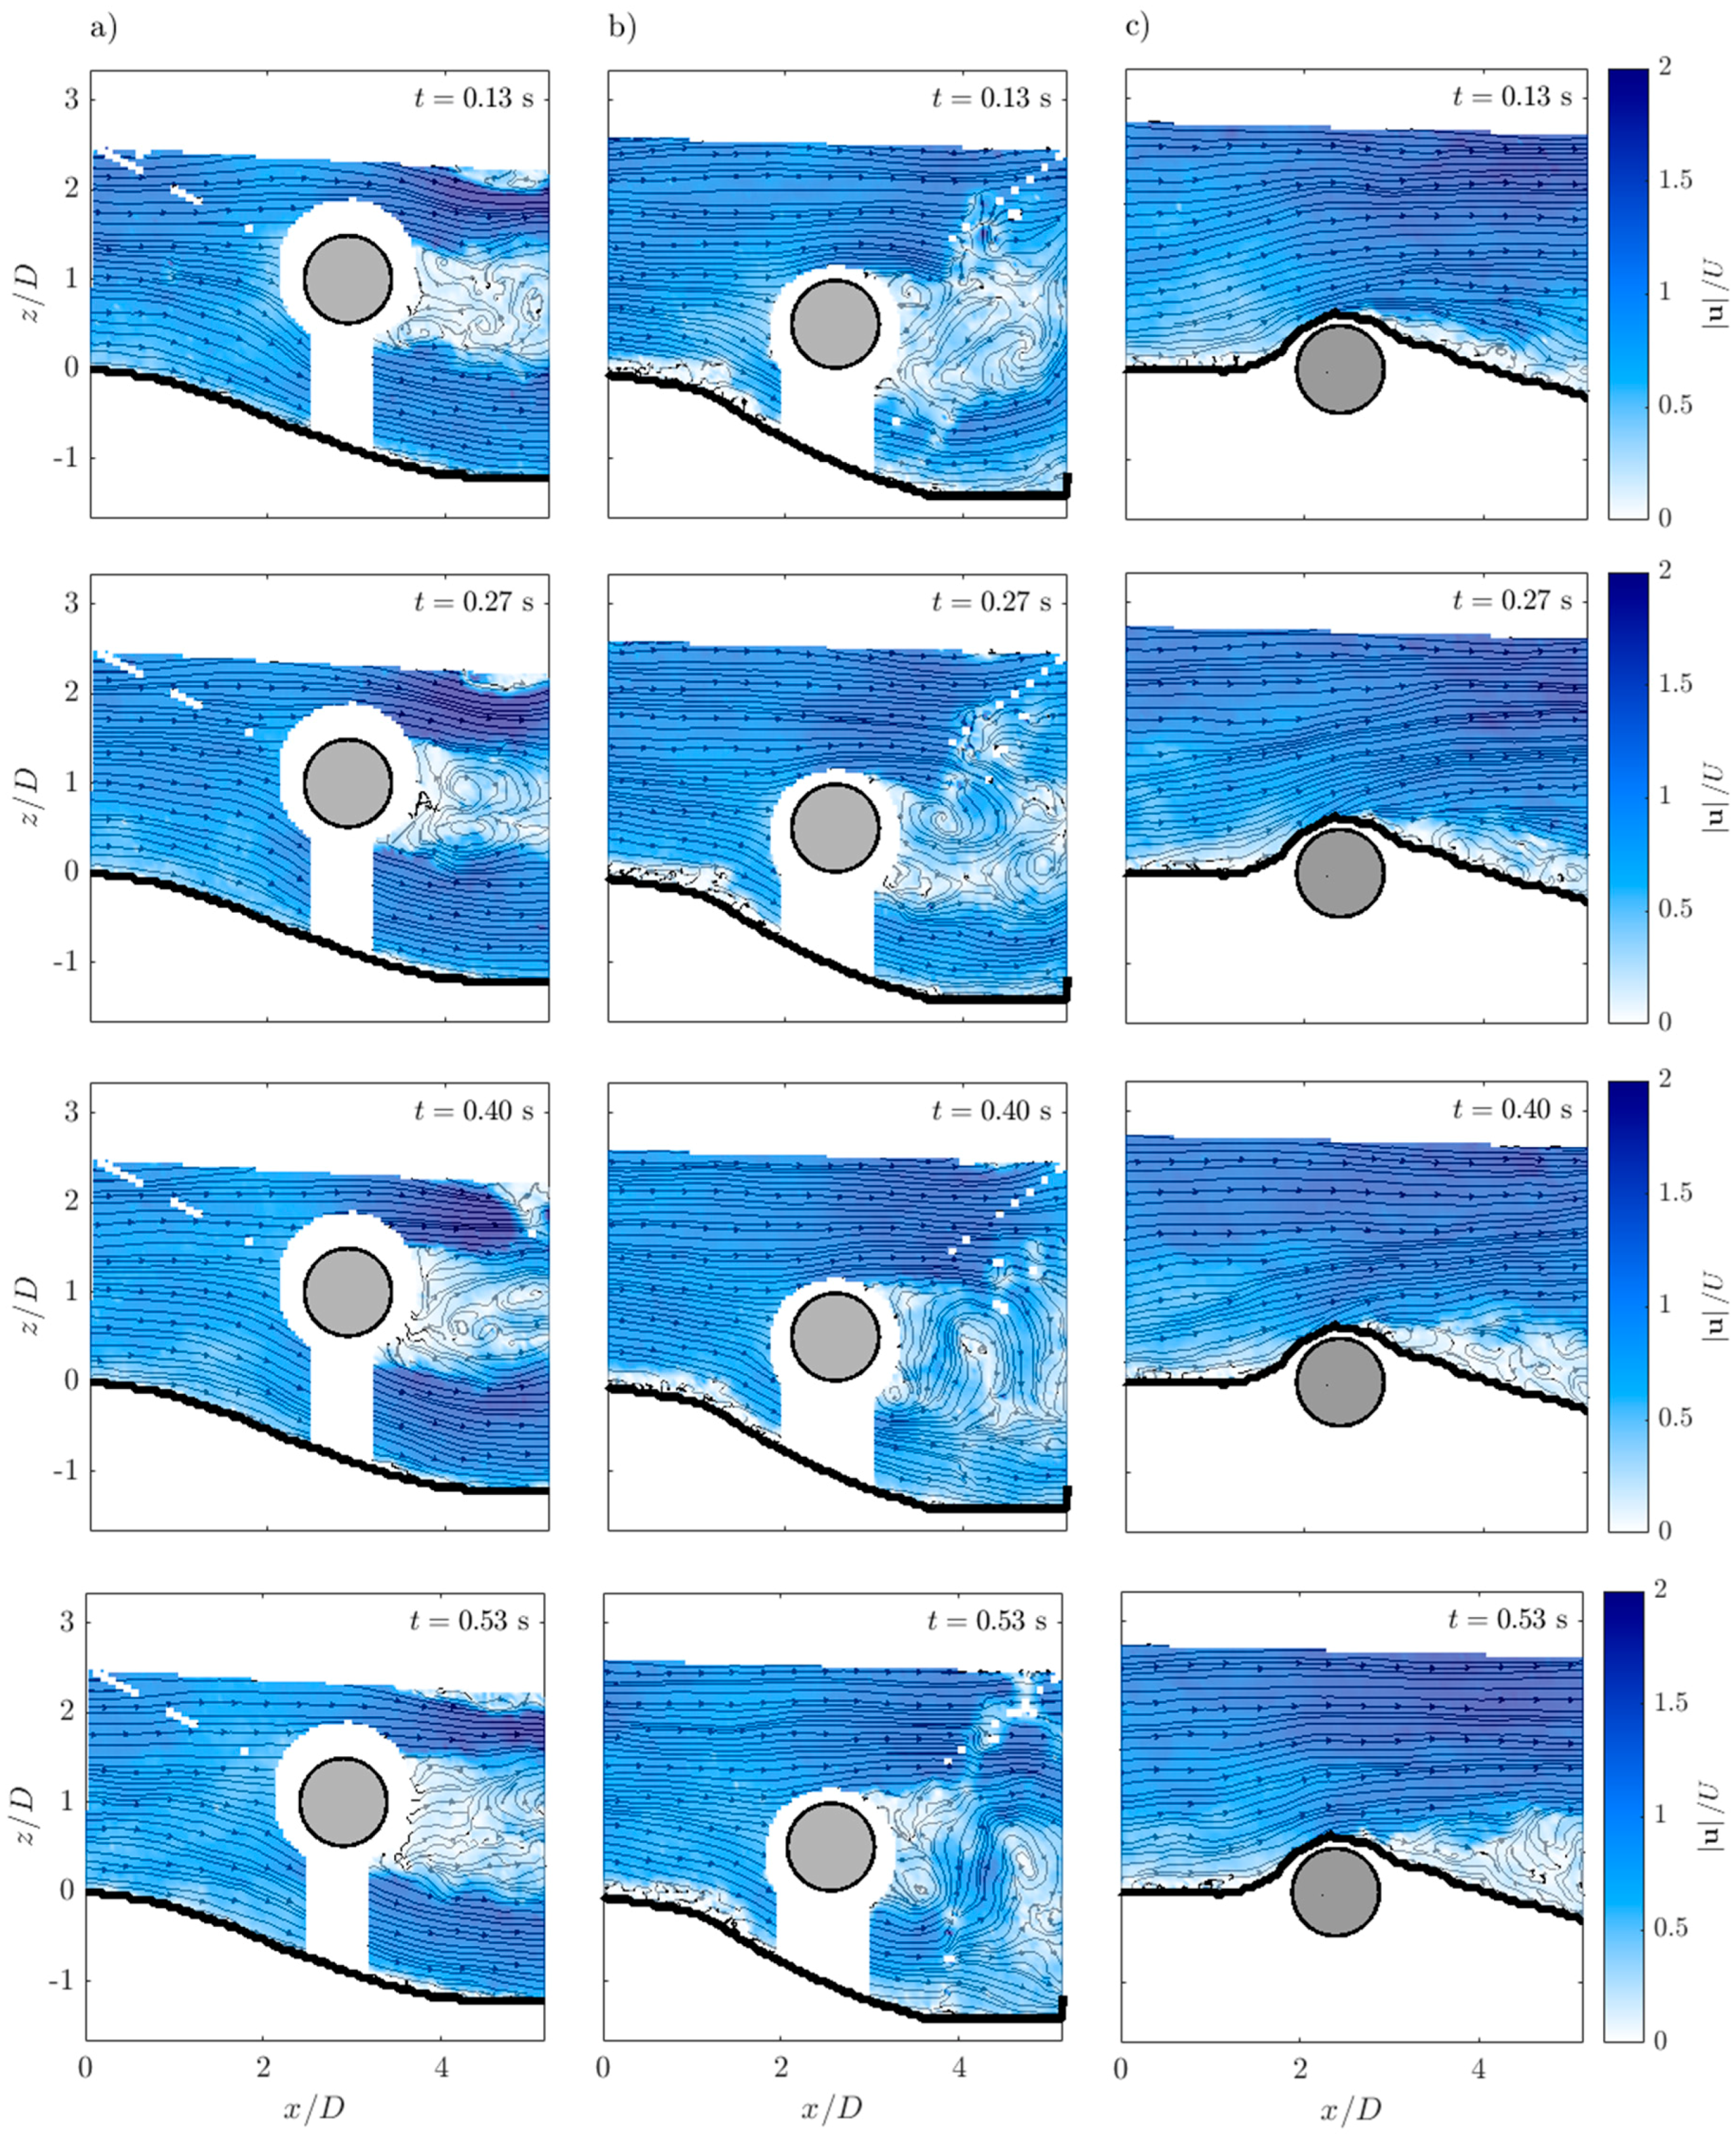
For the first two conditions, at the end of the scouring phase, it was demonstrated that the incoming flow approaches the upstream face of the cylinder and causes flow separation. Thus, the main flow is divided into two flows: one part is oriented towards the bed surface, whereas the other part is oriented towards the free surface. The velocity at the underside of the cylinder is slightly lower than the one at the top side, as observed by Jensen et al. [
29] in their experiments. This latter is also responsible for the formation of the scour hole that involves the area upstream to and beneath the cylinder owing to tunnel erosion. This phenomenon is more pronounced when the cylinder is laid on the bed. In the wake zone, for the suspended cylinder a greater amount of flow passes below it. Therefore, this flow tends to expand immediately downstream of the cylinder, limiting the extension of the induced vortex system. The analysis of the vorticity field revealed that in the wake region vorticity assumes positive values in the upper zone and negative values in the lower part, that is with clockwise and counterclockwise rotations, respectively. This is in accordance with the results obtained by Bearman and Zdravkovich [
21], Price et al. [
24] and others, since it was demonstrated that vortex shedding occurs at gaps higher than 0.3
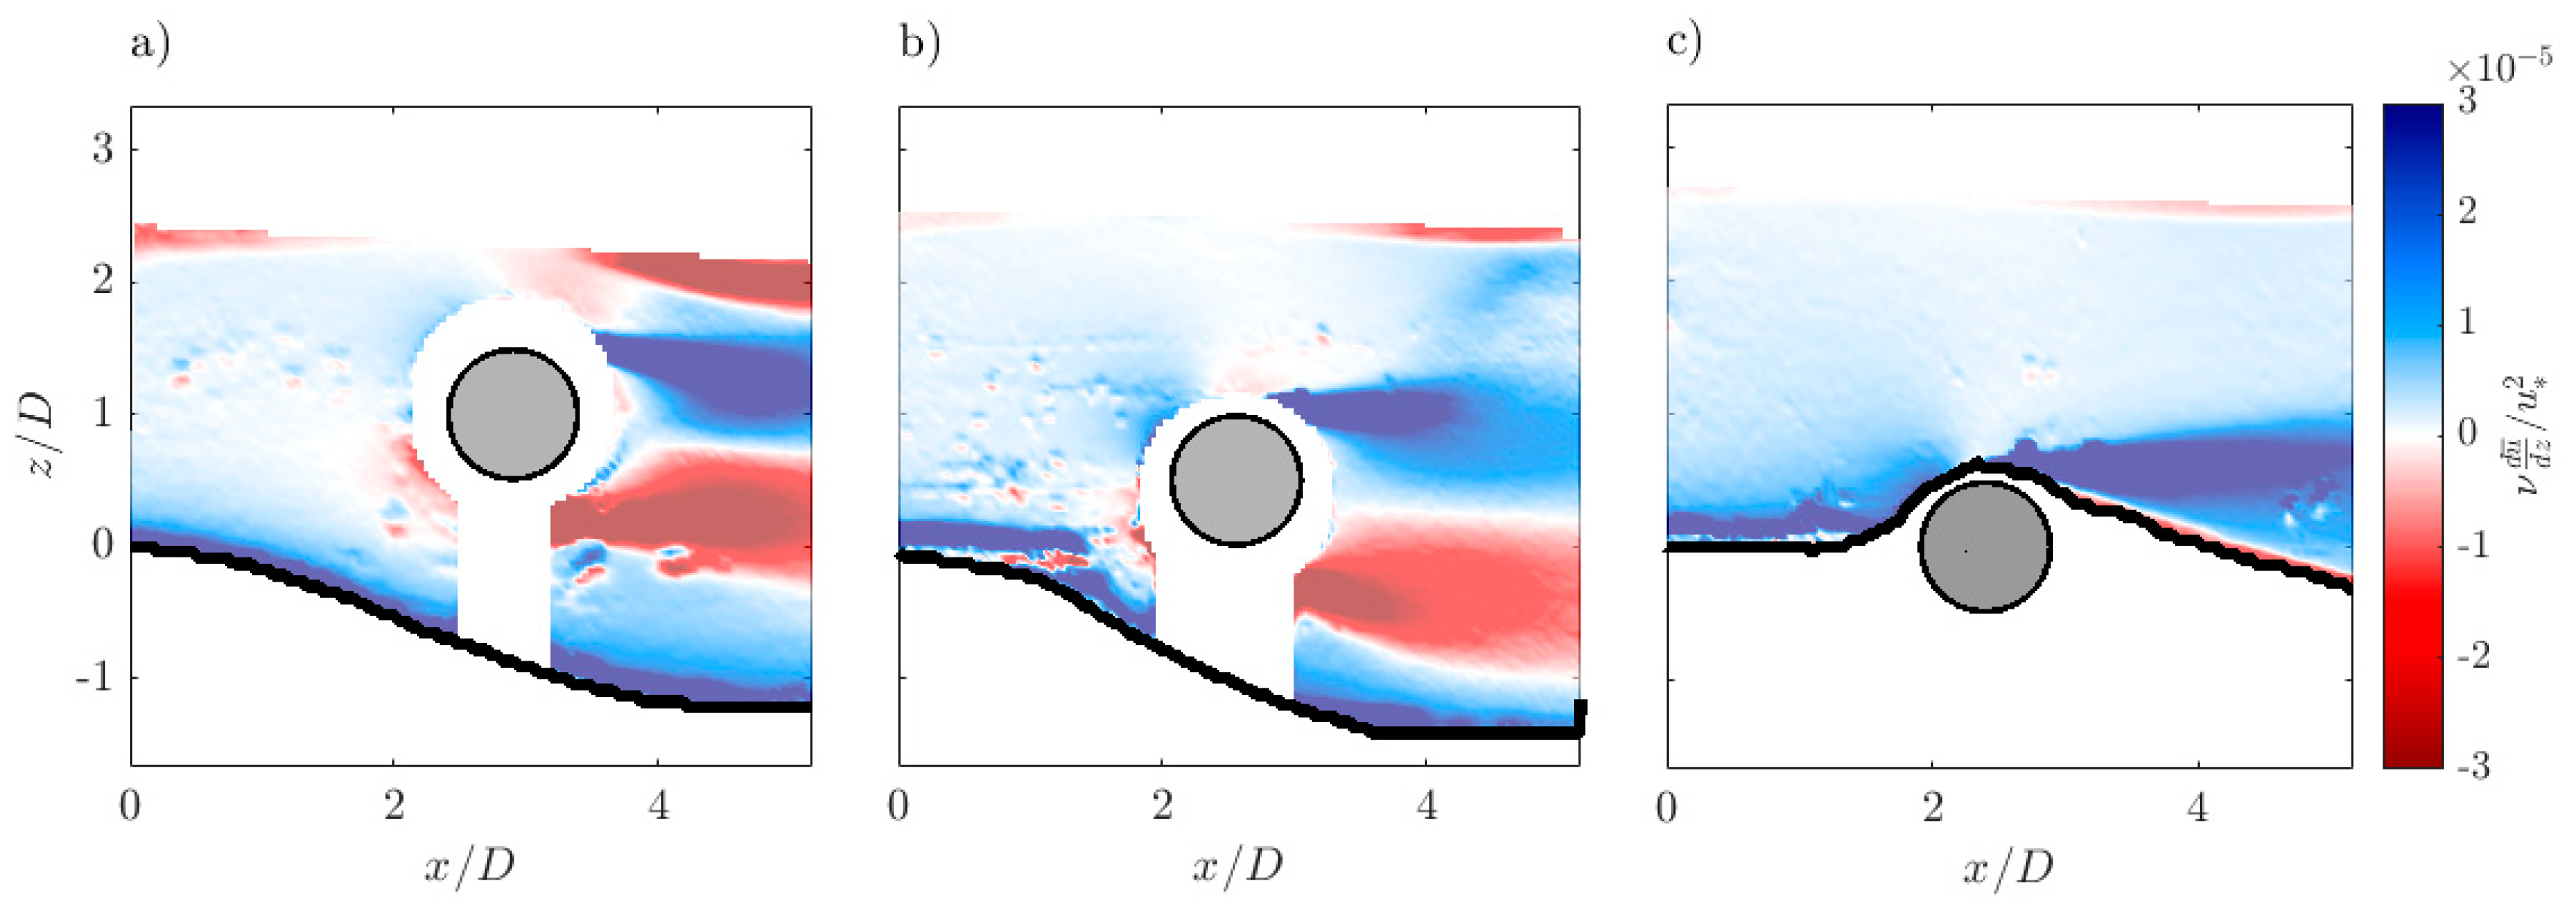
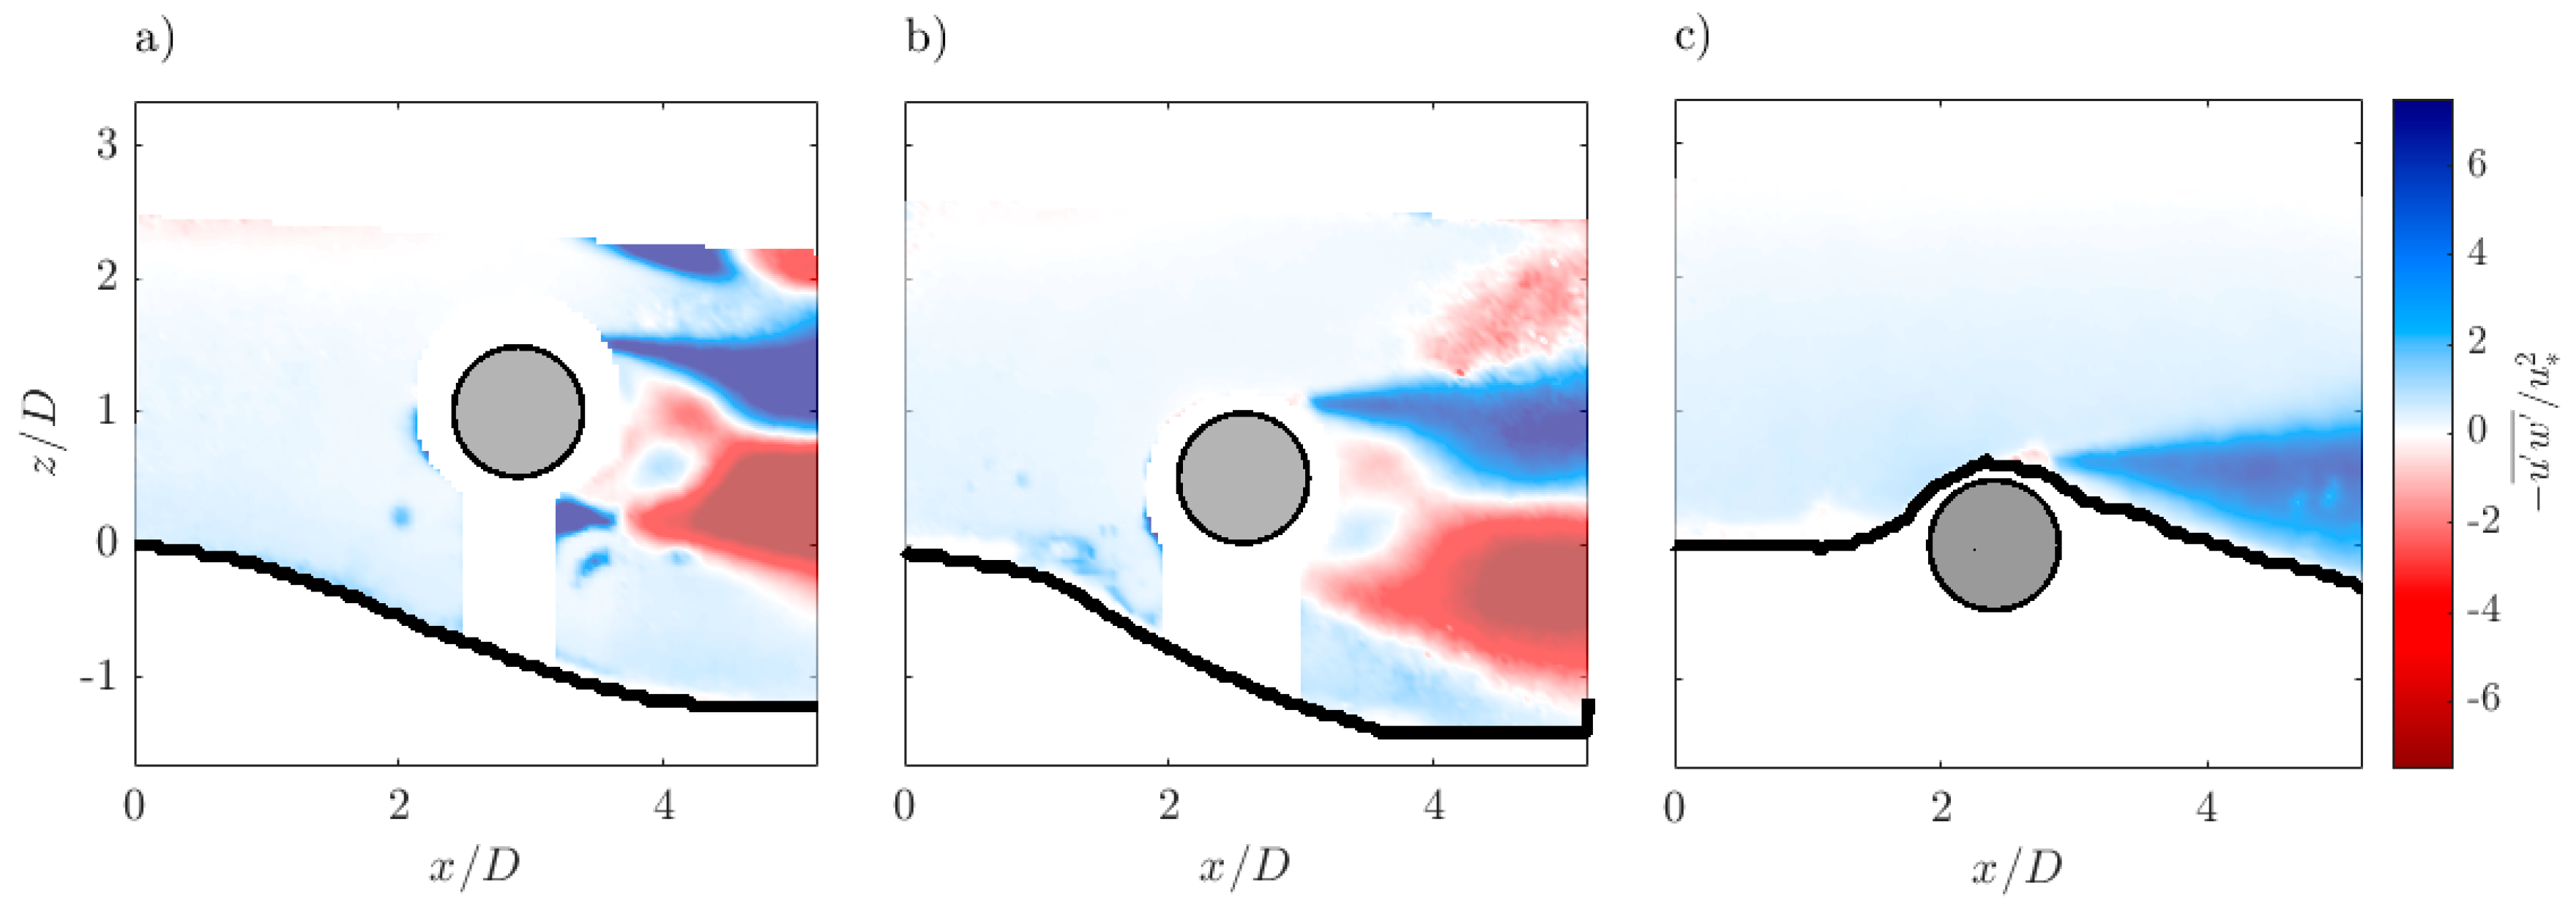
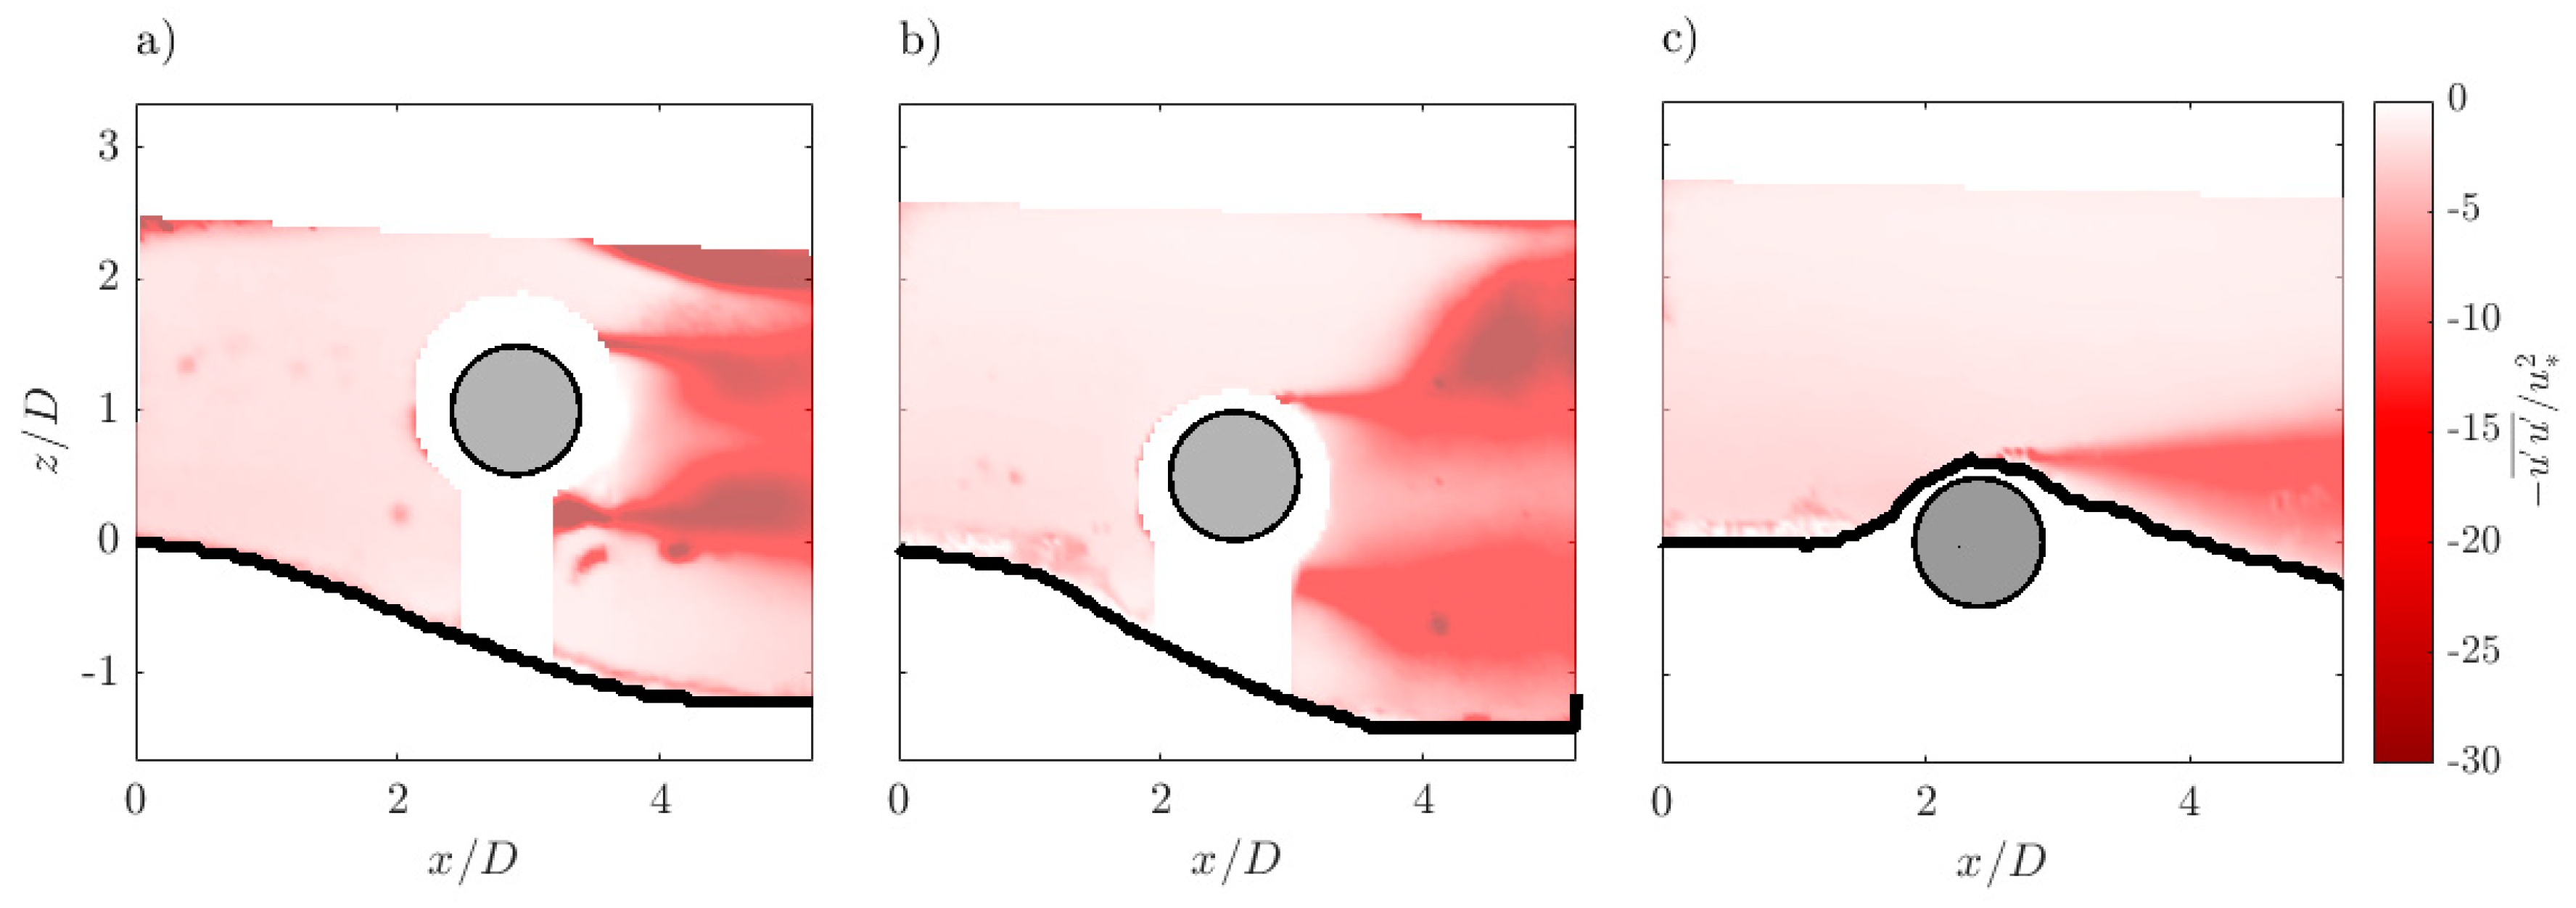
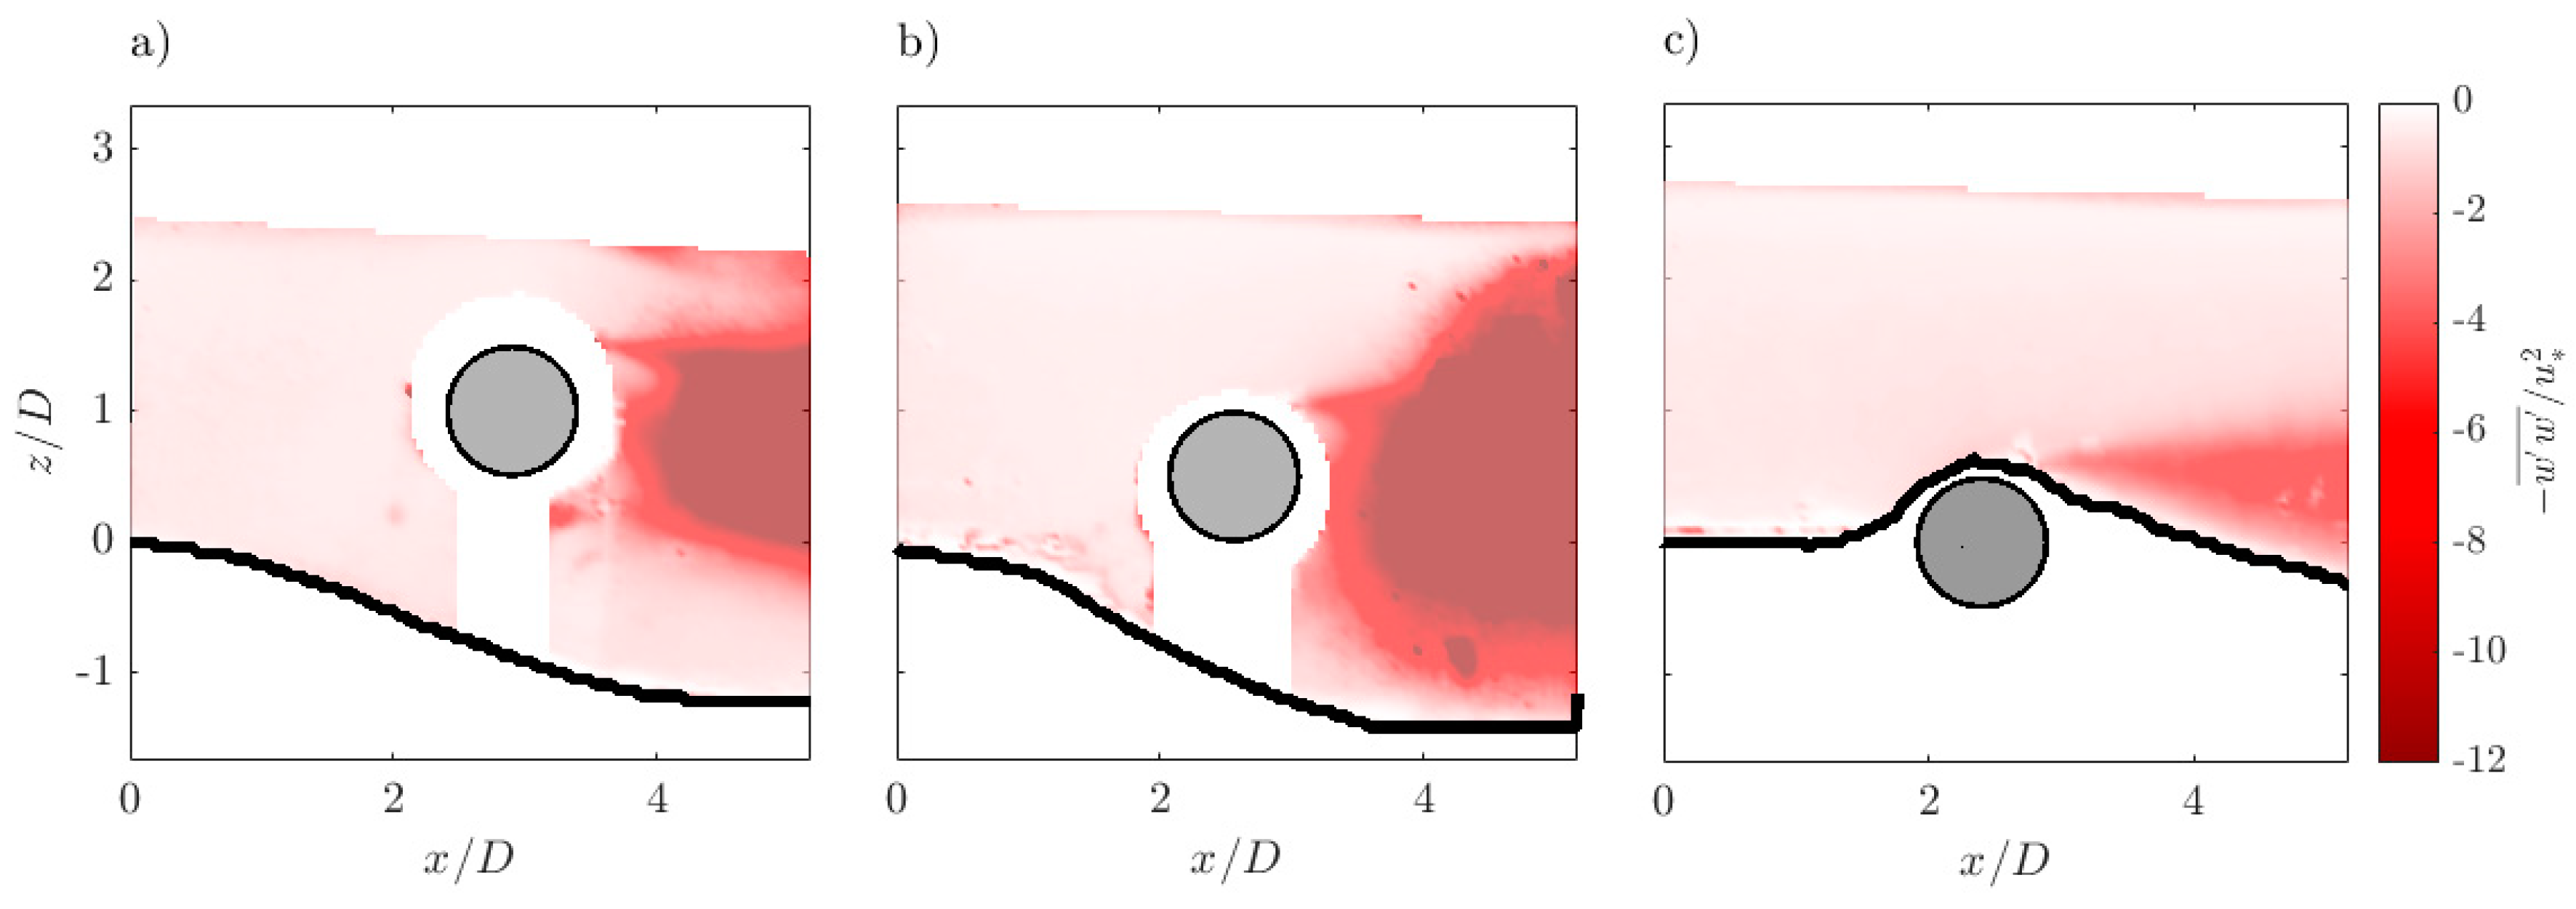
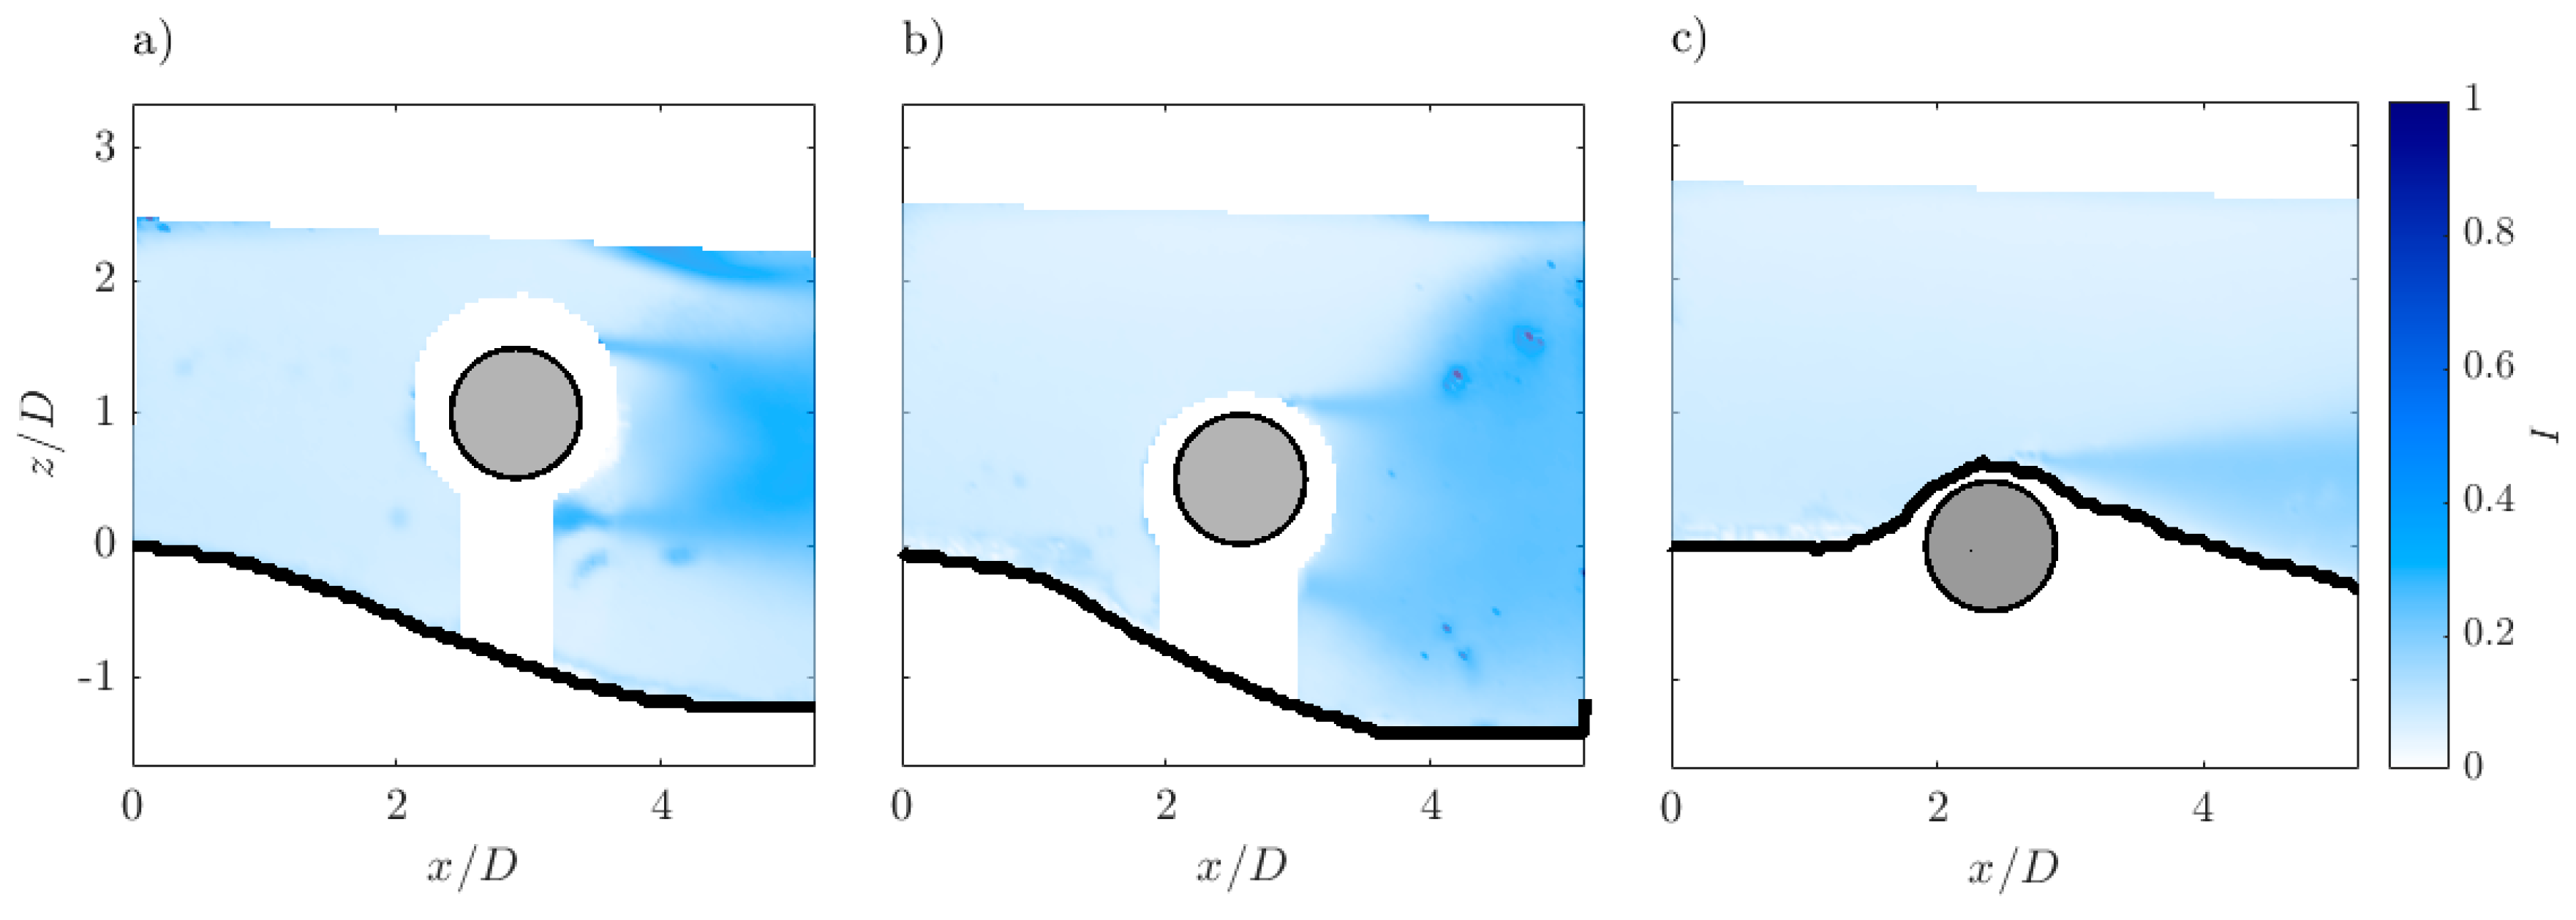
D. The strong turbulent mixing process in these areas is highlighted by the Reynolds shear stress distribution, indicating a downward transport of momentum in the downstream direction and an upward transport of momentum in the upstream direction, respectively. To support these observations, the turbulence level was calculated and it was found that fluctuations in the streamwise and vertical directions cause the enhancement of the turbulence level immediately downstream of the obstacle, reaching a value within the range 0.3–0.5, indicating a moderate turbulence level.
A different behavior was observed when the cylinder was initially half-buried. Tunnel erosion did not occur and, as a consequence, the obstruction represented by the cylinder created an adverse pressure gradient resulting in the separation of flow lines forming a vortex on the upstream front of the cylinder. Separation of flow also took place at the free-stream side of the cylinder. A reverse roller was formed in the wake region. This was responsible for the local scour downstream of the cylinder. The vorticity pattern showed the presence of the clockwise vortex in the scour hole with a strong mixing process that entrains high-momentum fluid into the recirculation region. It was demonstrated that here the turbulence level can be classified as moderate (I ≈ 0.4).
Additional work in the future is required to take into account other variables that may affect the investigated turbulence structures (e.g., cylinder diameter, shape of the pipe, flow discharge, water depth), their development during the scouring process and also other in-depth statistical analyses (such as the third-order statistics to provide a very accurate measure of the TKE dissipation rate [
52] or correlation functions to analyze the turbulent coherent structures [
53]).
This study represents an advancement in the current understanding of the flow-structure interaction at scoured horizontal cylinders subjected to currents. It was demonstrated that bed changes should be considered in the analysis of the flow field and in the prediction of the forces acting on the cylinder rather than considering a plane boundary, because the effects are very different and depend also on the gap between the cylinder and the bed itself.


