The results of this study consist of original experimental kinetic data and their treatment through appropriate kinetic modeling. The experimental conditions are close to real conditions during ATV campaigns, in terms of temperature, nitrogen headspace, water storage duration (up to 24 weeks), initial silver concentration and S/V ratio. More specifically, nitrogen headspace is used during potable water preparation and treatment on the ground, with an initial silver concentration of 0.5 mg/L. The higher silver concentration of 10 mg/L is used only for the preconditioning of water tanks to be launched to the ISS. The S/V ratio in the ISS water systems, including full or rather empty water tanks, varies between 0.1 and 1.0 cm−1. Therefore, the results of this study apply to real conditions encountered in space missions.
4.1. Experimental Kinetic Data
All three metallic materials are submitted to stagnant experiments with potable water containing 10 mg/L of silver ions introduced to water electrolytically. The results of silver ions concentration in the bulk with respect to exposure time are shown in
Figure 1.
Figure 1a presents the results of experiments conducted at surface over volume ratio (S/V) equal to 1.0 cm
−1, whereas
Figure 1b depicts the results for tests performed at S/V equal to 0.1 cm
−1.
Figure 1a shows that the highest Ag loss from the bulk is observed for Ti where after 6d of exposure Ag loss reaches a plateau. In addition, the highest remaining Ag concentration in the bulk water throughout the test is observed for electropolished SS316L material. Ag reduction rate in the bulk is slower for electropolished SS316L than for the passivated SS316L material. Considering the standard deviation of measurements, Ag concentration in the bulk remains statistically constant and reaches a plateau for both SS316L materials.
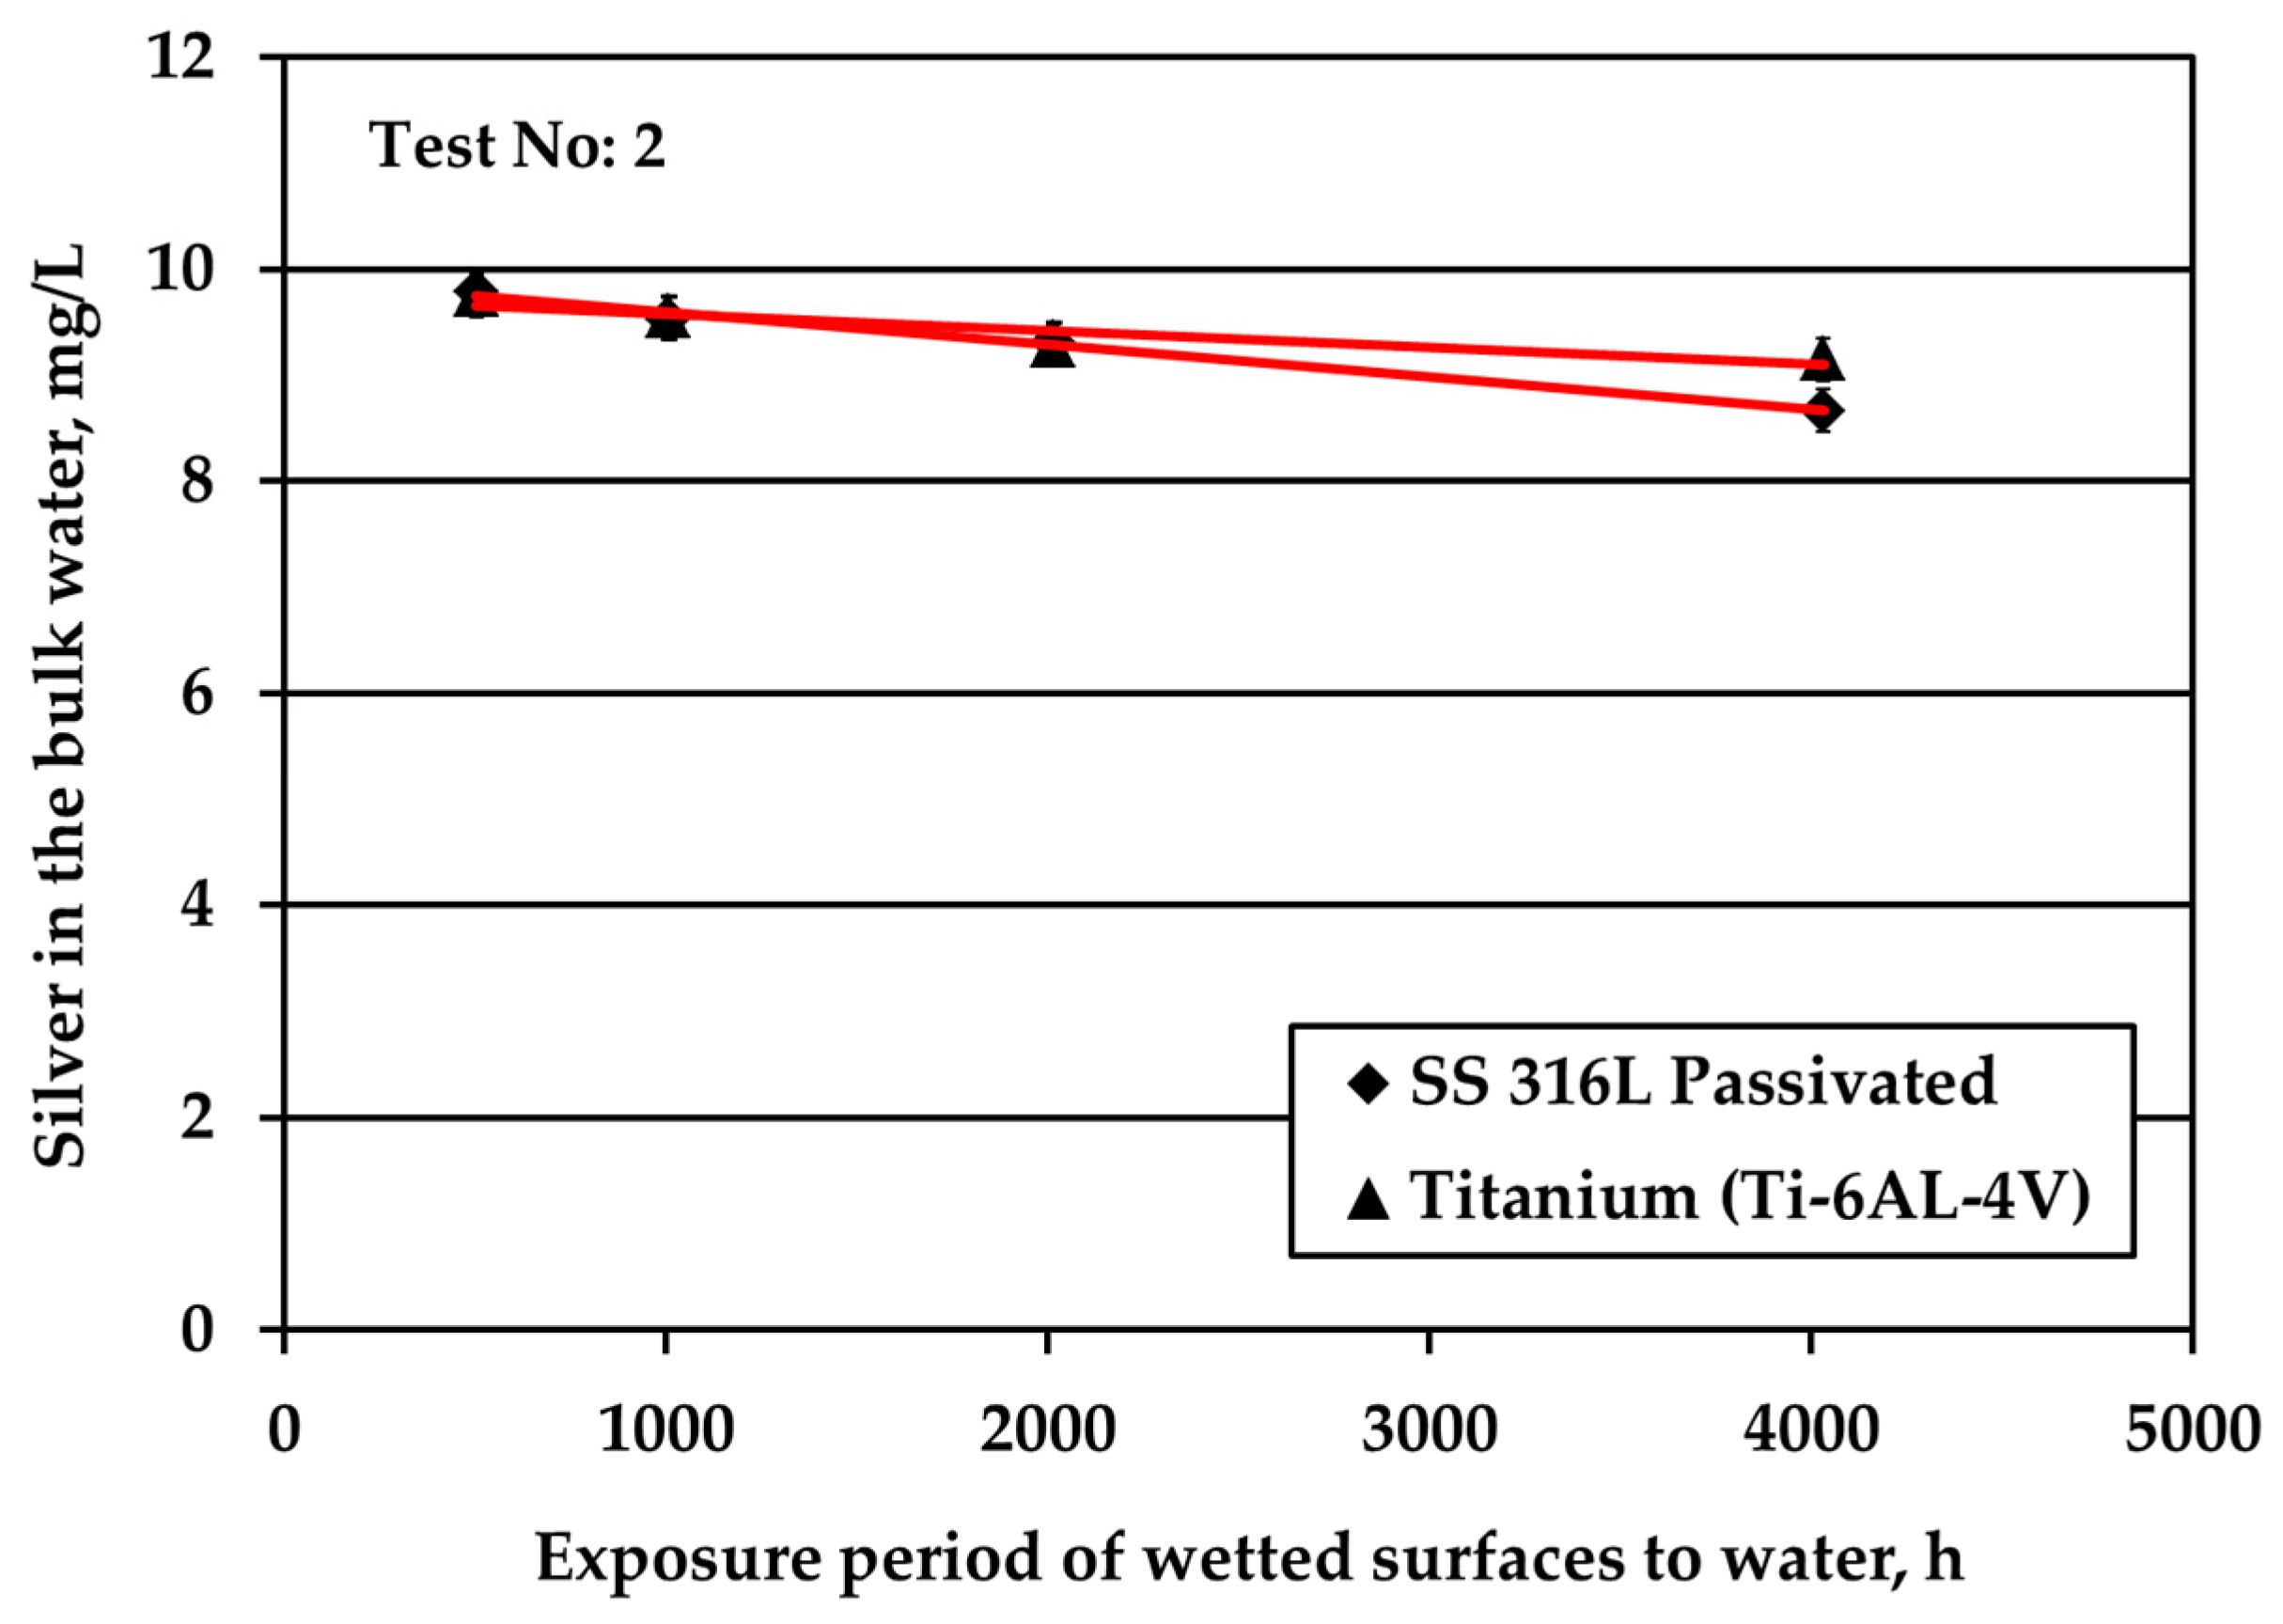
The decrease of the S/V parameter by one order of magnitude, at 0.1 cm
−1, leads to a continuous and almost linear reduction of silver, as shown in
Figure 1b. The same behavior is presented by the passivated SS, as well. However, the rate in the case of Ti alloy is higher. Regarding the passivated & electropolished SS coupons, there is a change in the rate of Ag reduction after 12 weeks of exposure period that is attributed to employing a different batch of coupons: data points at the initial four exposure times are obtained by using coupons that show higher potential in silver deposition compared to the data points at the two longer times that are more resistant to silver deposition. This behavior is observed although the specifications for the electropolished material are identical for both batches. The difference is attributed to the rather uncontrolled machine finishing of the coupons during their manufacture, as it turned out by the clarifications provided by the manufacturer. Passivated & electropolished SS coupons exposed to water up to 6 days behave similarly to the other two metals, as shown in
Figure 1b. However, after 12 weeks of exposure to water with 10 mg/L Ag, Ag concentration is comparable with six weeks of exposure, whereas only a trivial further reduction is observed for up to 24 weeks. On the other hand, it should be taken into consideration that a small reduction in Ag bulk concentration corresponds to high Ag deposition variations since the S/V ratio is low and Ag concentration is high. Ag ion concentration reduction in water is strongly related to the deposition phenomena of Ag onto different types of solid surface material. Previous studies revealed the underlying deposition phenomena for both SS and titanium alloy materials [
12,
13]. On SS surfaces, silver is deposited in its metallic form, in line with a galvanic deposition mechanism [
12]; while on titanium alloy Ti-6Al-4V it is deposited in its ionic form, in line with either a galvanic deposition or ion exchange mechanism [
13].
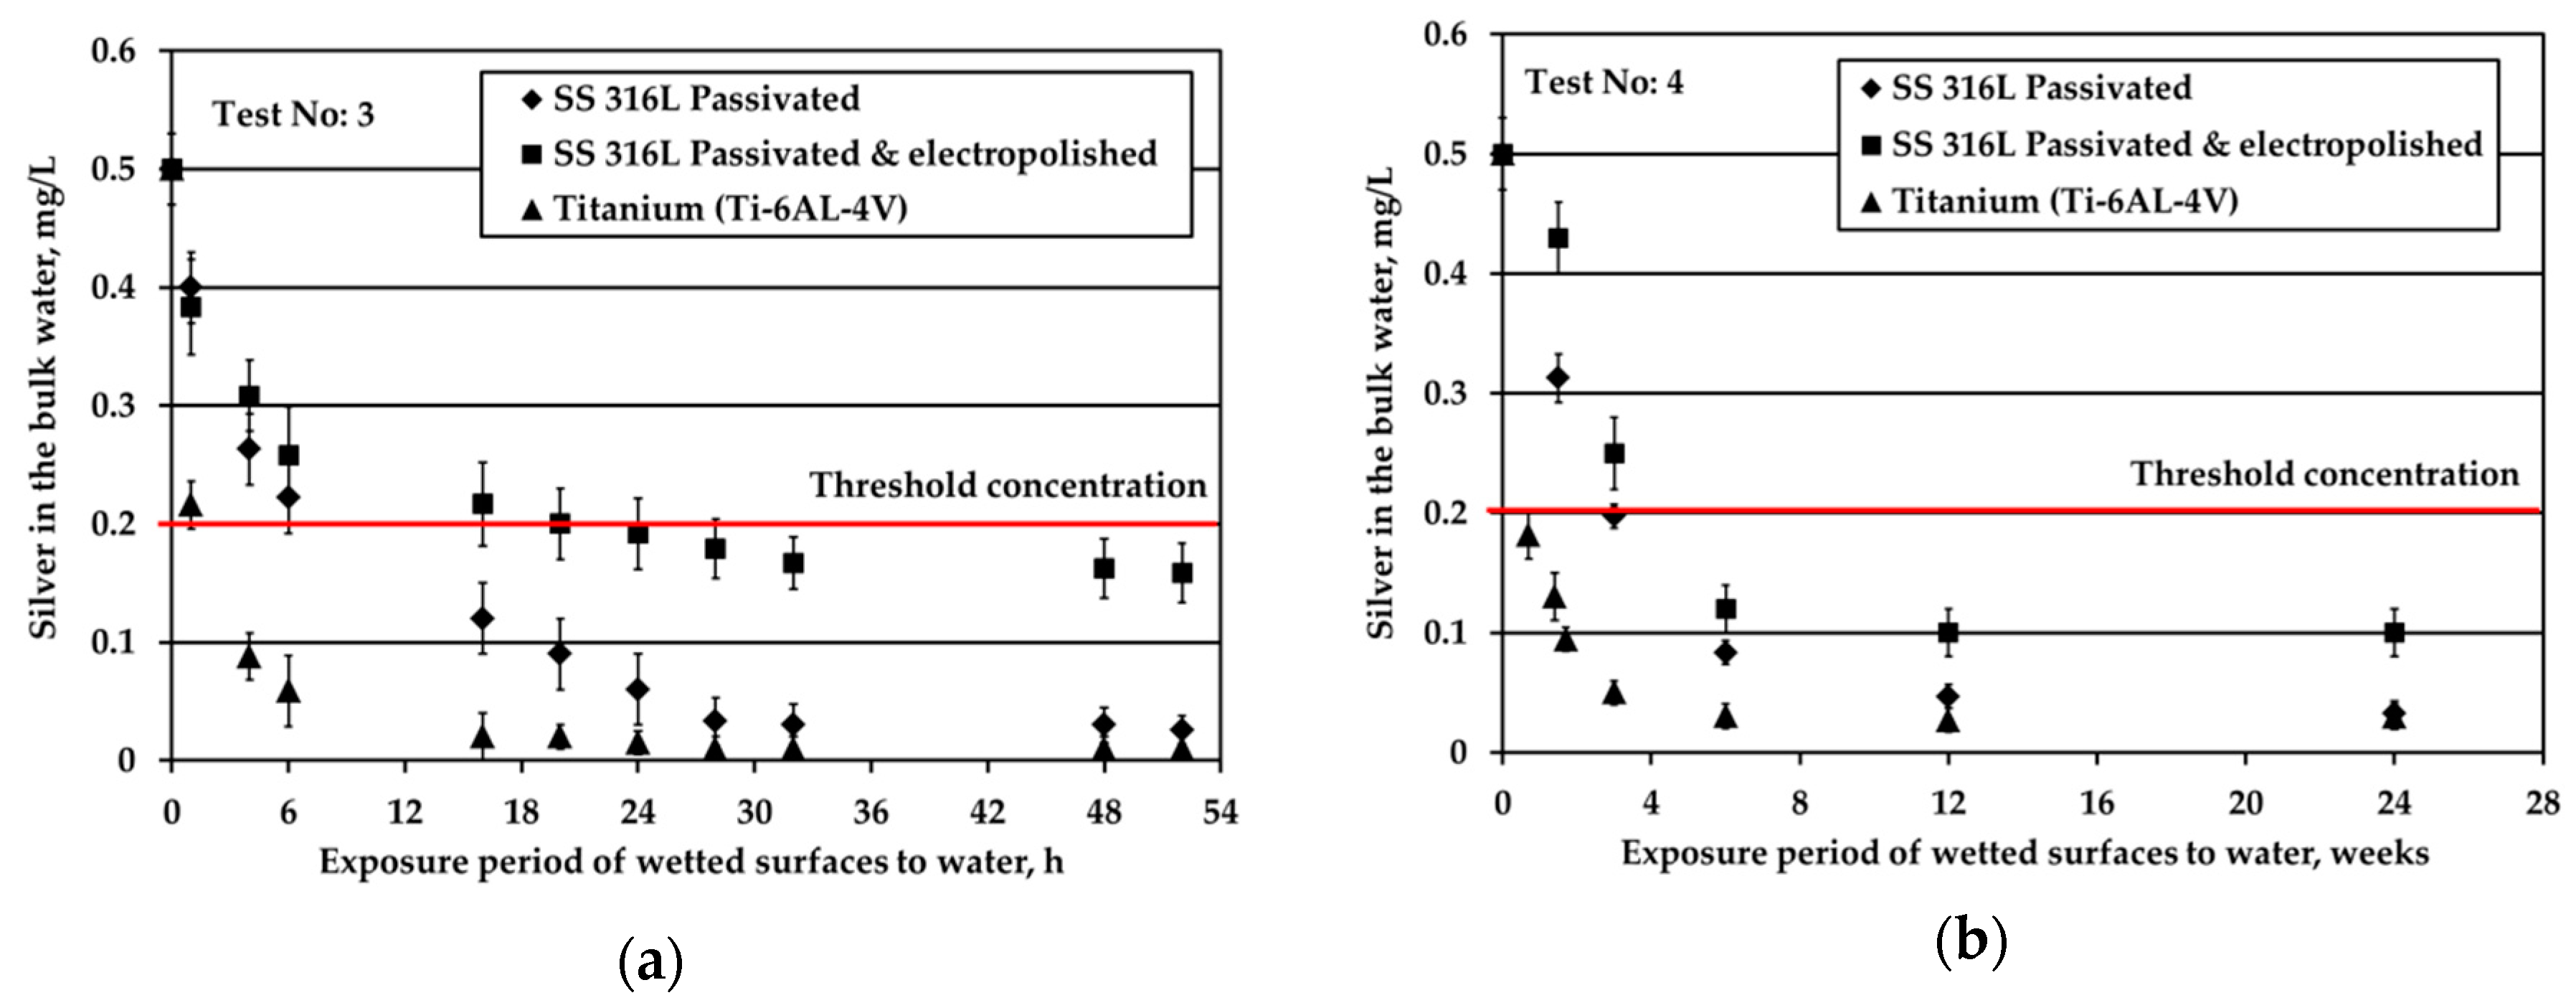
Figure 2 depicts the results obtained when testing the potable water (0.5 mg/L Ag) against three different solid surfaces under stagnant conditions and nitrogen headspace. The red line is added to signify the threshold Ag concentration, 0.2 mg/L, set by the space agencies to warrant sufficient disinfection of potable water. As shown in
Figure 2a, at S/V equal to 1.0 cm
−1, when water is in contact with Ti alloy, Ag is almost fully depleted after about 6 h of the exposure period. For the SS316L materials, Ag is rapidly reduced from the bulk water in the first 6 h; next, the reduction rate becomes gradual and after 32 h silver reduction rate tends towards a plateau (although a small rate is still noticeable). At the very end of the test, Ag is almost fully depleted in the case of passivated SS316L, while for electropolished SS316L Ag concentration is slightly below the threshold limit of 0.2 mg/L. Regarding titanium alloy, Wallace et al. [
6,
7] also recorded a remarkable silver reduction in the bulk, since the residual silver ions concentration was only 0.025 mg/L after 1680 h of exposure period and initial silver fluoride concentration into water of 0.4 mg/L. The test coupons were inserted to the test setup at S/V ratio around 0.6 cm
−1, while prior to exposure, the test coupons were passivated for 24 h into water containing 100 mg/L silver ions. The results of
Figure 2a show that although silver deposition was high during passivation (initial 24 h), its deposition continued during the exposure experiments.
Figure 2b presents the evolution of Ag concentration in the bulk potable water with respect to exposure time under nitrogen headspace and S/V ratio equal to 0.1 cm
−1. These conditions are close to the real conditions used in water storage tanks of ground support equipment during ATV missions, where the wetted surface is made of SS material [
3]. In this study, when in contact with passivated SS316L, Ag in the bulk water is reduced rapidly for the first six weeks of exposure. After that, the observed Ag reduction continues only gradually even after several months of exposure. Likewise, Roberts et al. [
15] observed a considerable silver reduction, higher than 10% of the initial silver concentration, when SS316L solid surfaces were exposed to water containing 0.5 mg/L Ag at a ratio of S/V equal to 0.14 cm
−1. In this study, the overall reduction of Ag is calculated around 70% after 21 days of exposure. The results between the two studies are comparable considering the differences in the experimental setup and more specifically in the employed S/V ratios. Moreover, the results are in line with the experiments performed in water tanks used for the ATV missions [
3]. After 24 weeks of exposure, Ag was reduced from 0.5 to about 0.1 mg/L in the bulk water. However, the pattern of Ag removal was different. After four weeks of water storage a sharp Ag reduction to slightly above 0.3 mg/L was observed. For the next eight weeks, the rate of reduction was close to zero, whereas for the last 12 weeks the rate of reduction became equal to the initial one that was observed for the first four weeks of water storage. Since these measurements were performed only once, it was concluded that there is strong evidence that silver may be reduced below the threshold limit of 0.2 mg/L and that the water shall be stored not more than three months in SS tanks. Measurements of Ag in water onboard the ISS, where the material of water tank changes from SS (in GSE) to polymeric FEP (in ISS water tanks) revealed that Ag may be further reduced even below 0.1 mg/L [
23] posing health risks to cosmonauts.
Similar to passivated SS316L, electropolished SS316L causes a swift reduction of silver in the bulk water during the first six weeks of exposure, whereas later the reduction of silver progresses very slowly. The highest remaining silver concentration in the bulk at the end of the test is observed for electropolished SS316L material. For Ti solid surfaces, Ag reduction in the bulk is significantly faster: Ag concentration is below the threshold of 0.2 mg/L after just five days of exposure, while after six weeks Ag is almost fully depleted.
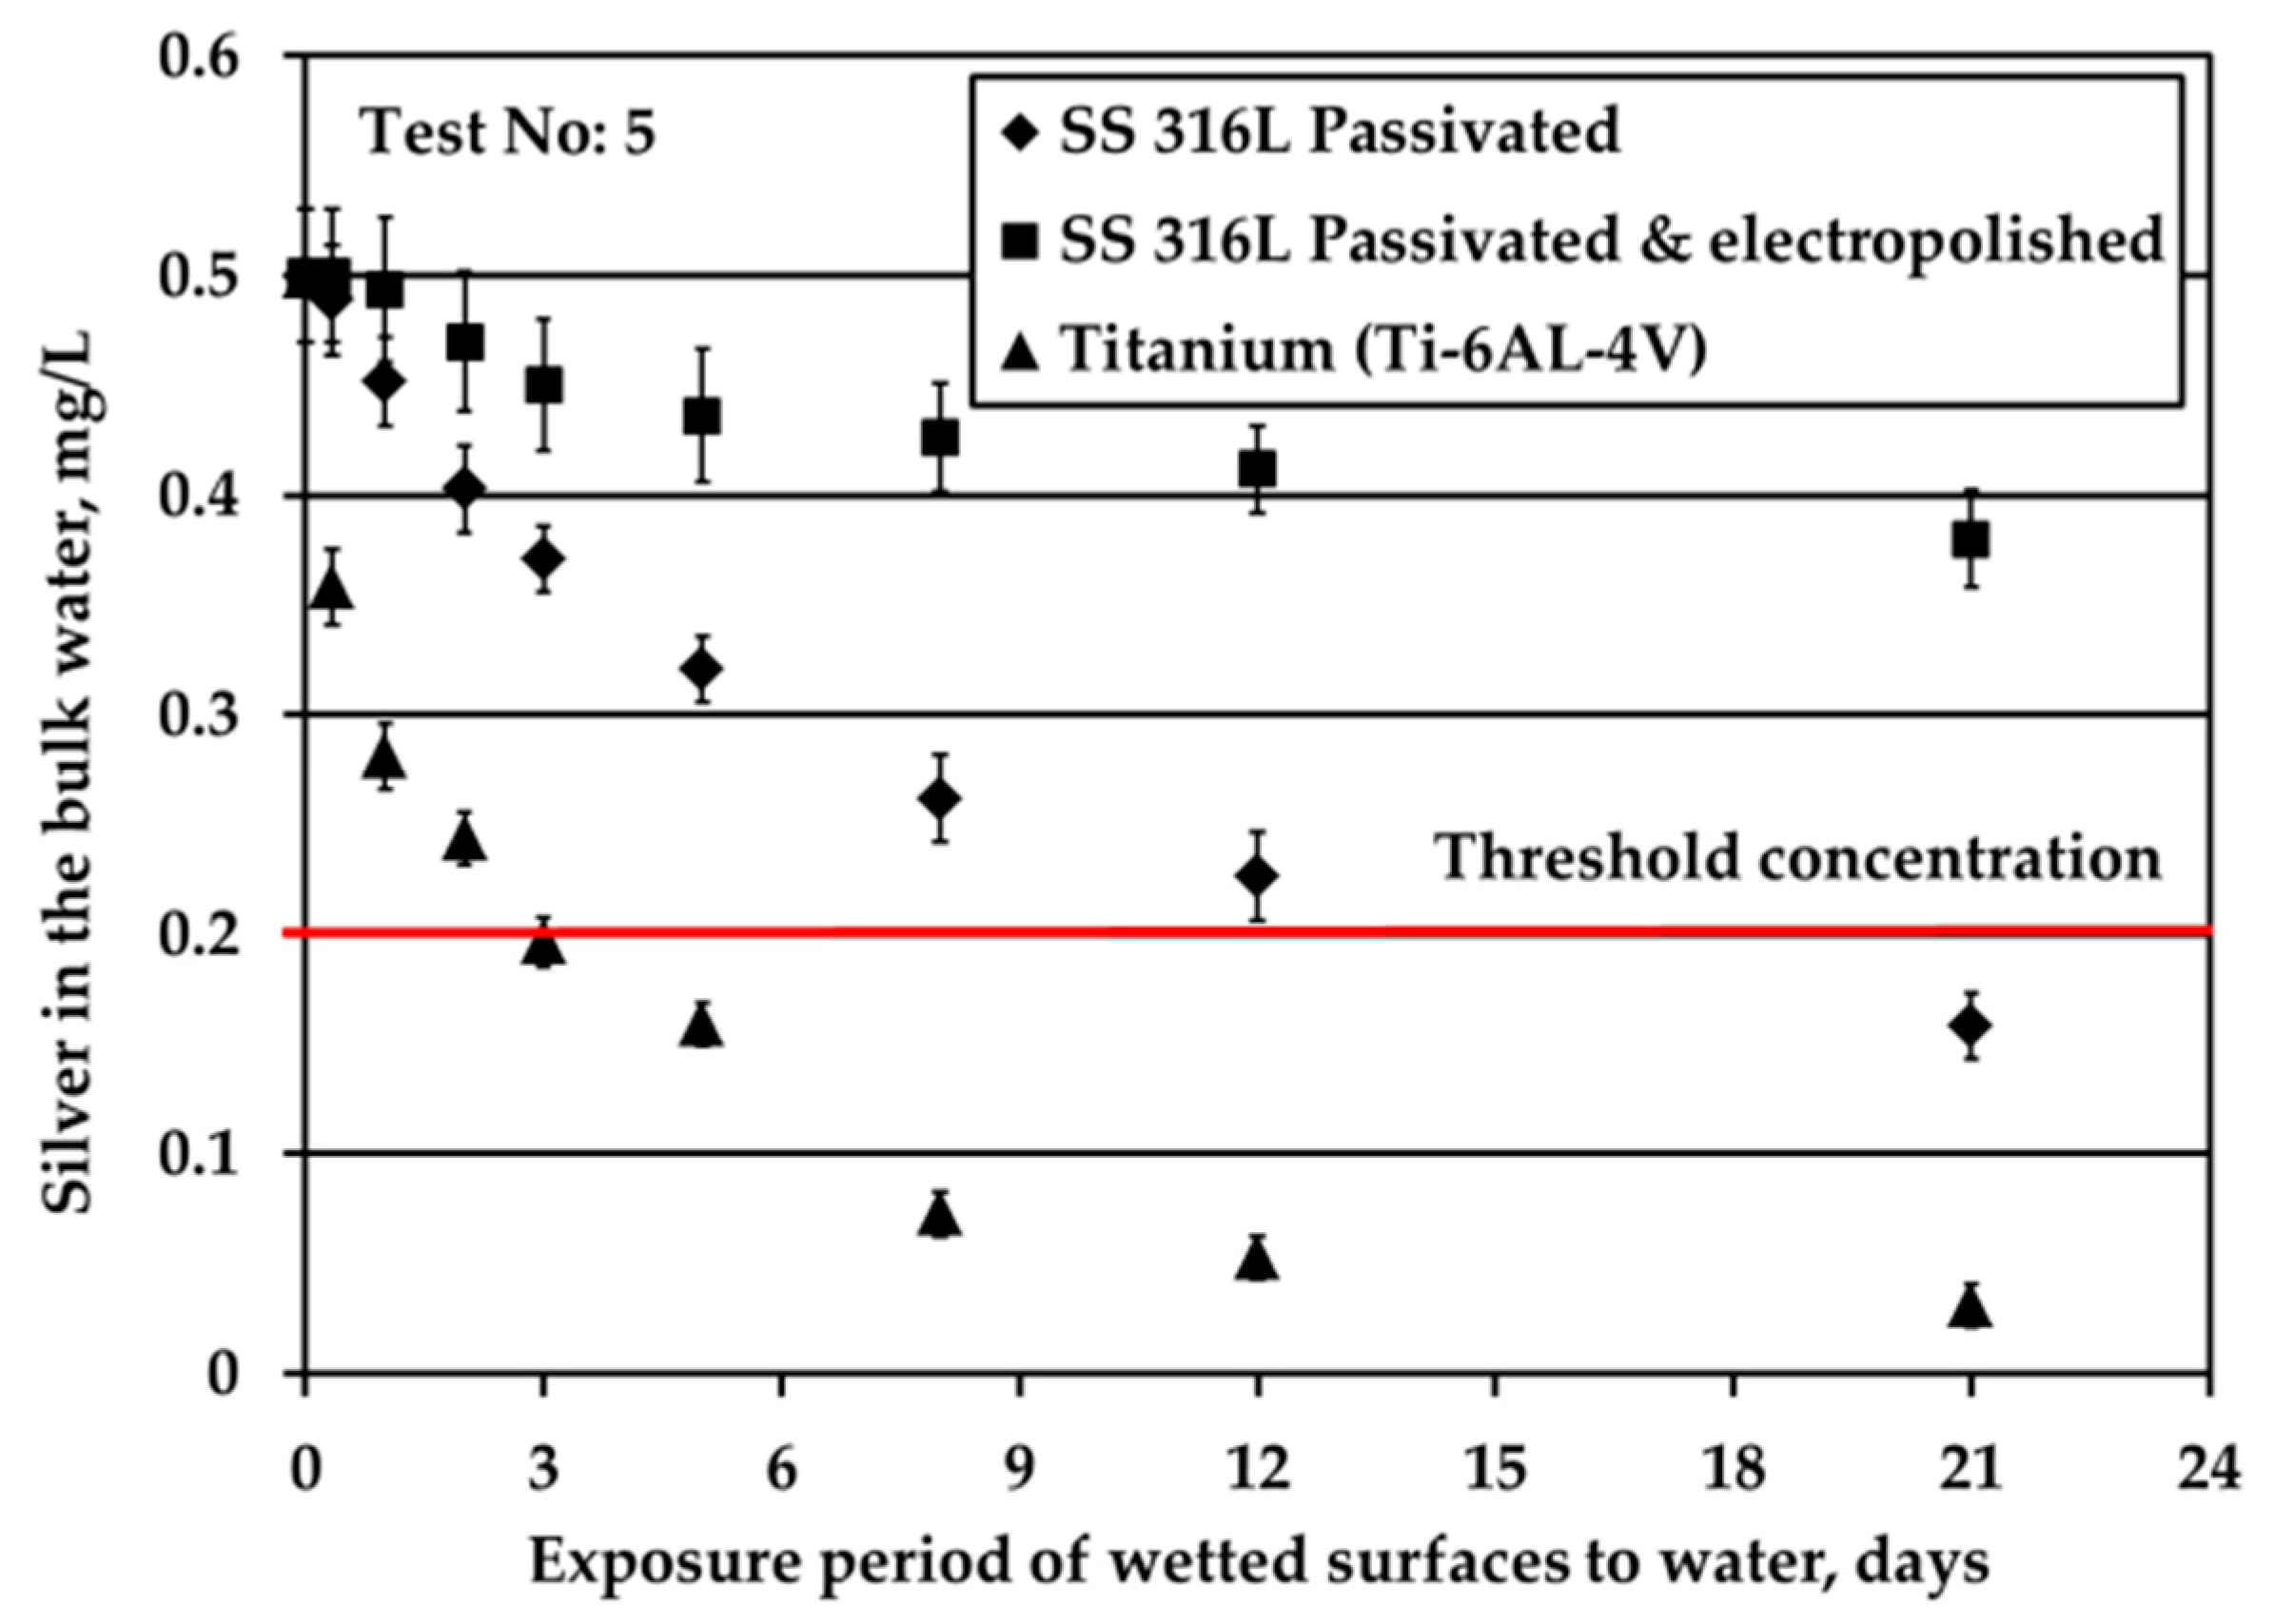
The reduction of Ag concentration in the bulk water with regards to the type of solid surfaces is demonstrated in
Figure 3. These tests are conducted under water flow conditions (by applying mechanical shaking), nitrogen headspace and S/V equal to 0.1 cm
−1. The aim of these experiments is to examine the depletion of Ag ions when Ag mass transfer limitations are eliminated. The initial Ag ions concentration in water is equal to 0.5 mg/L, similar to that used in ATV water tanks, in order to elucidate phenomena using experimental conditions close to real ones.
Ti alloy surface triggered fast Ag loss from the bulk water since after only three days Ag passes below the limit of 0.2 mg/L Ag. Regarding the SS solid surfaces, Ag loss is faster for passivated SS316L than for electropolished SS316L material. Ag loss for passivated SS316L solid surface is comparable with that reported in ATV processes [
4]. Rough comparisons between the
Figure 2b and
Figure 3 (Ag depletion in potable water in the absence and in the presence of water flow, respectively) indicate that either Ag deposition is independent of water flow or that even minor movements of water during water storage contribute to Ag transfer to the surface (for example, these movements could be because of chamber vibrations).
4.2. Analysis and Modeling of the Experimental Data
According to the generalized model, as described earlier, the characteristic time for mass transfer in the test cell is given as τ = L2/(3D). In this study, the characteristic time corresponds to τ = 6.1 h for S/V = 1 cm−1 and τ = 25 d for S/V = 0.1 cm−1. This characteristic time corresponds to a 63% reduction of initial silver concentration in case of a mass transfer dominated process. The corresponding reduction at time t = 3τ is 95%.
As shown in
Figure 2a, Ti alloy solid surface exhibits a reduction of Ag concentration of 56% in just one hour whereas the characteristic time, in this case, is 6.1 h. From this single counterexample, it is quite clear that diffusion is not the only mass transfer mechanism as would be expected for stagnant water. In this particular case mass transfer is about five times faster than a diffusion-controlled process. This can be ascribed to some kind of convection. In order to understand the sensitivity of the mass transfer process on even very slight water motion, the characteristic velocities for diffusion can be denoted as u = D/L = 150 nm/s (S/V = 1 cm
−1) and 15 nm/s (S/V = 0.1 cm
−1). This means that even floor vibrations or natural convection currents (due for instance to small temperature fluctuations) can considerably increase mass transfer. The issue is that the convection contribution is based on unspecified events, so the mass transfer coefficient is rather arbitrary and so different from experiment to experiment. This fact renders the experiments with mass transfer kinetic contribution useless for extracting information for surface reaction kinetics (unlike in the case of pure diffusion where the known mass transfer coefficient could be part of the model).
In the case where silver loss from the bulk is studied under water flow conditions, water velocities are many orders of magnitude larger than that of diffusion certifying that the kinetics of these particular experiments refer to surface reaction alone without any shadowing from mass transfer in the bulk water.
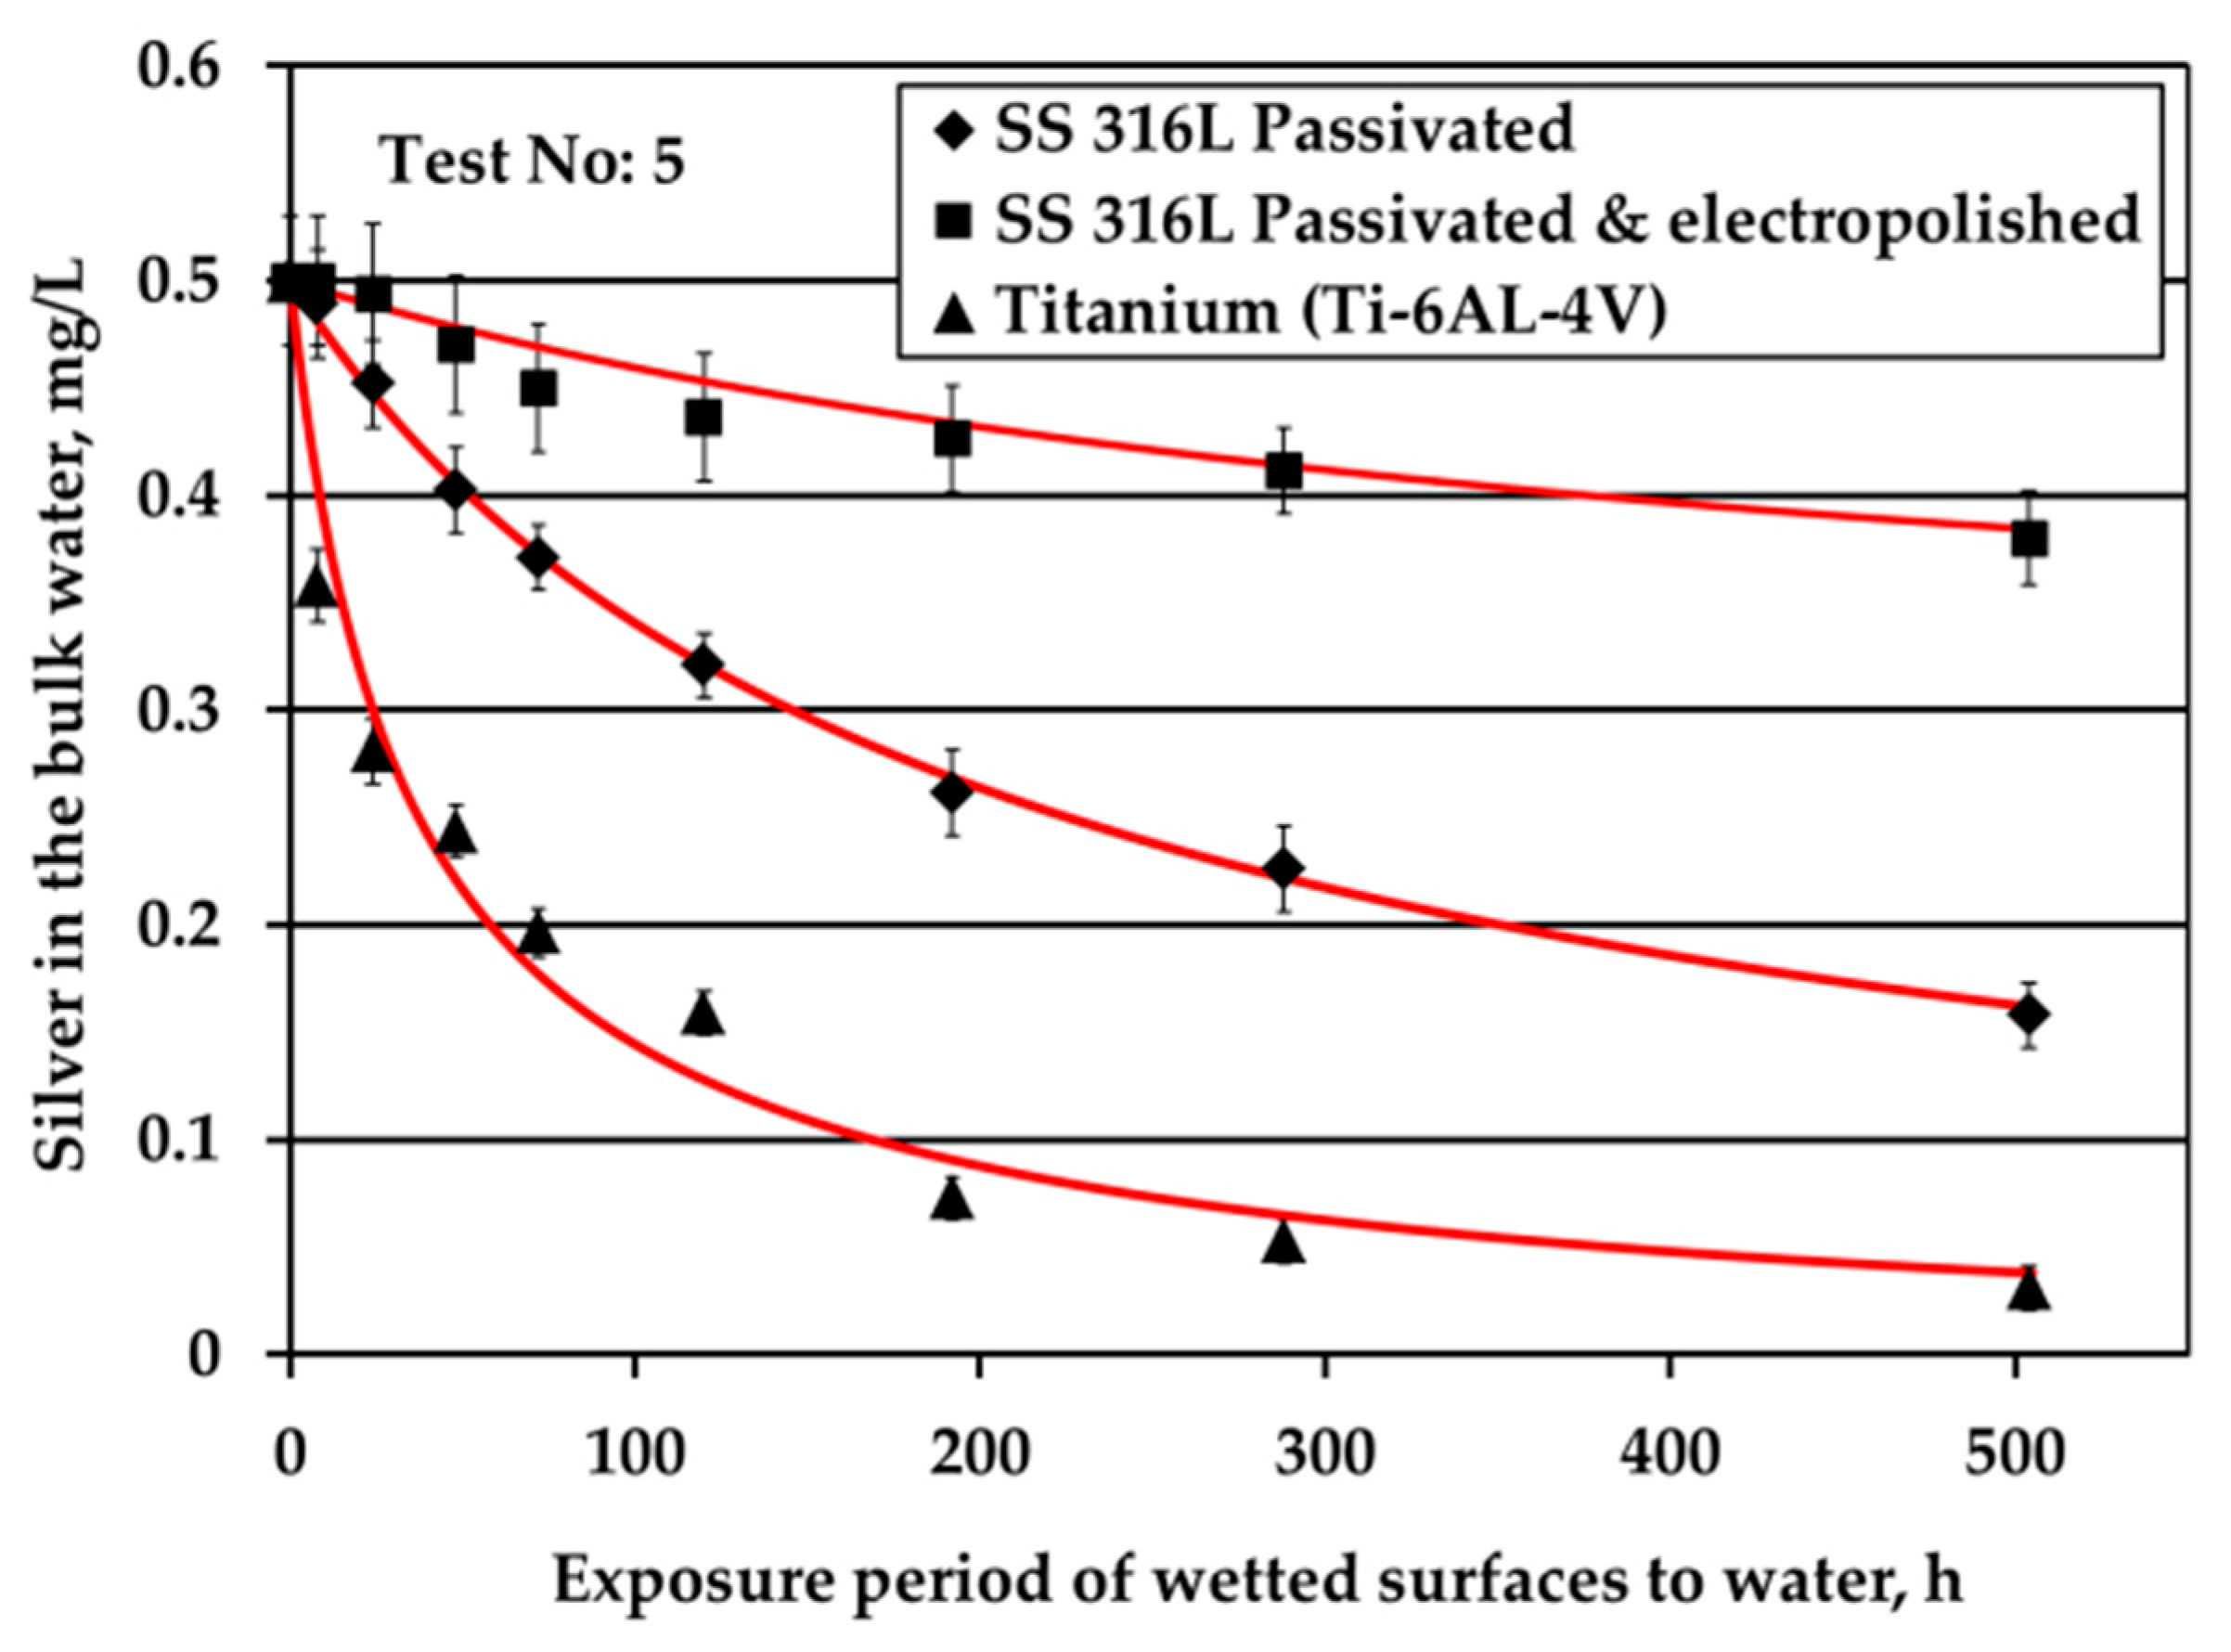
Equation (7) cannot be integrated analytically with the reaction kinetics expression in equation (9), so a numerical integration is employed based on the Euler technique [
24]. The parameters k, q
m, n are computed such that there is a reasonable agreement between theoretical and experimental evolution of C. It should be noted that a much better fitting could have been achieved by considering a more complex form of function R or assuming different value of n for each material, but such a task is worthless given the scatter of the experimental points. The aim is to extract the simplest possible model giving acceptable results in the range of the experimental data. In this case, the experimental data (taken from
Figure 3) and the fitting concentration evolution curves are demonstrated in
Figure 4. Hereafter, all kinetic plots are plotted versus time in hours, because all kinetic parameters, e.g., kinetic constants, are calculated and given in hours.
It is worth noticing that the experimental data are fitted using the same value of the exponent n (=1.5) for all three types of examined solid surfaces. This exponent denotes the rate of approaching the asymptotic value q
m. The kinetic constant k was found to be k = 0.05 cm/h for passivated SS316L material, k = 0.01 cm/h for electropolished SS316L material and k = 0.3 cm/h for Ti alloy solid surface. They maximum uptake capacity is q
m = 0.00555 mg/cm
2 for passivated SS316L, q
m = 0.002 mg/cm
2 for the electropolished SS316L sample and q
m = 0.00555 mg/cm
2 for the Ti alloy surface, as shown in
Table 2.
The same experimental conditions, as regards the S/V ratio and Ag concentration, but in stagnant water conditions produced the results shown in
Figure 2b. The kinetic curves are quite similar to those of the test under water flow (
Figure 3) for the same exposure period. This is not surprising since the diffusion characteristic mass transfer time is 25 days which for a convection acceleration factor of 5 (as in the test with S/V = 1.0 cm
−1) reduces down to five days which is much shorter than the experimental duration. The particular set of data confirms the current analysis but it has no additional information to offer regarding surface reaction kinetics.
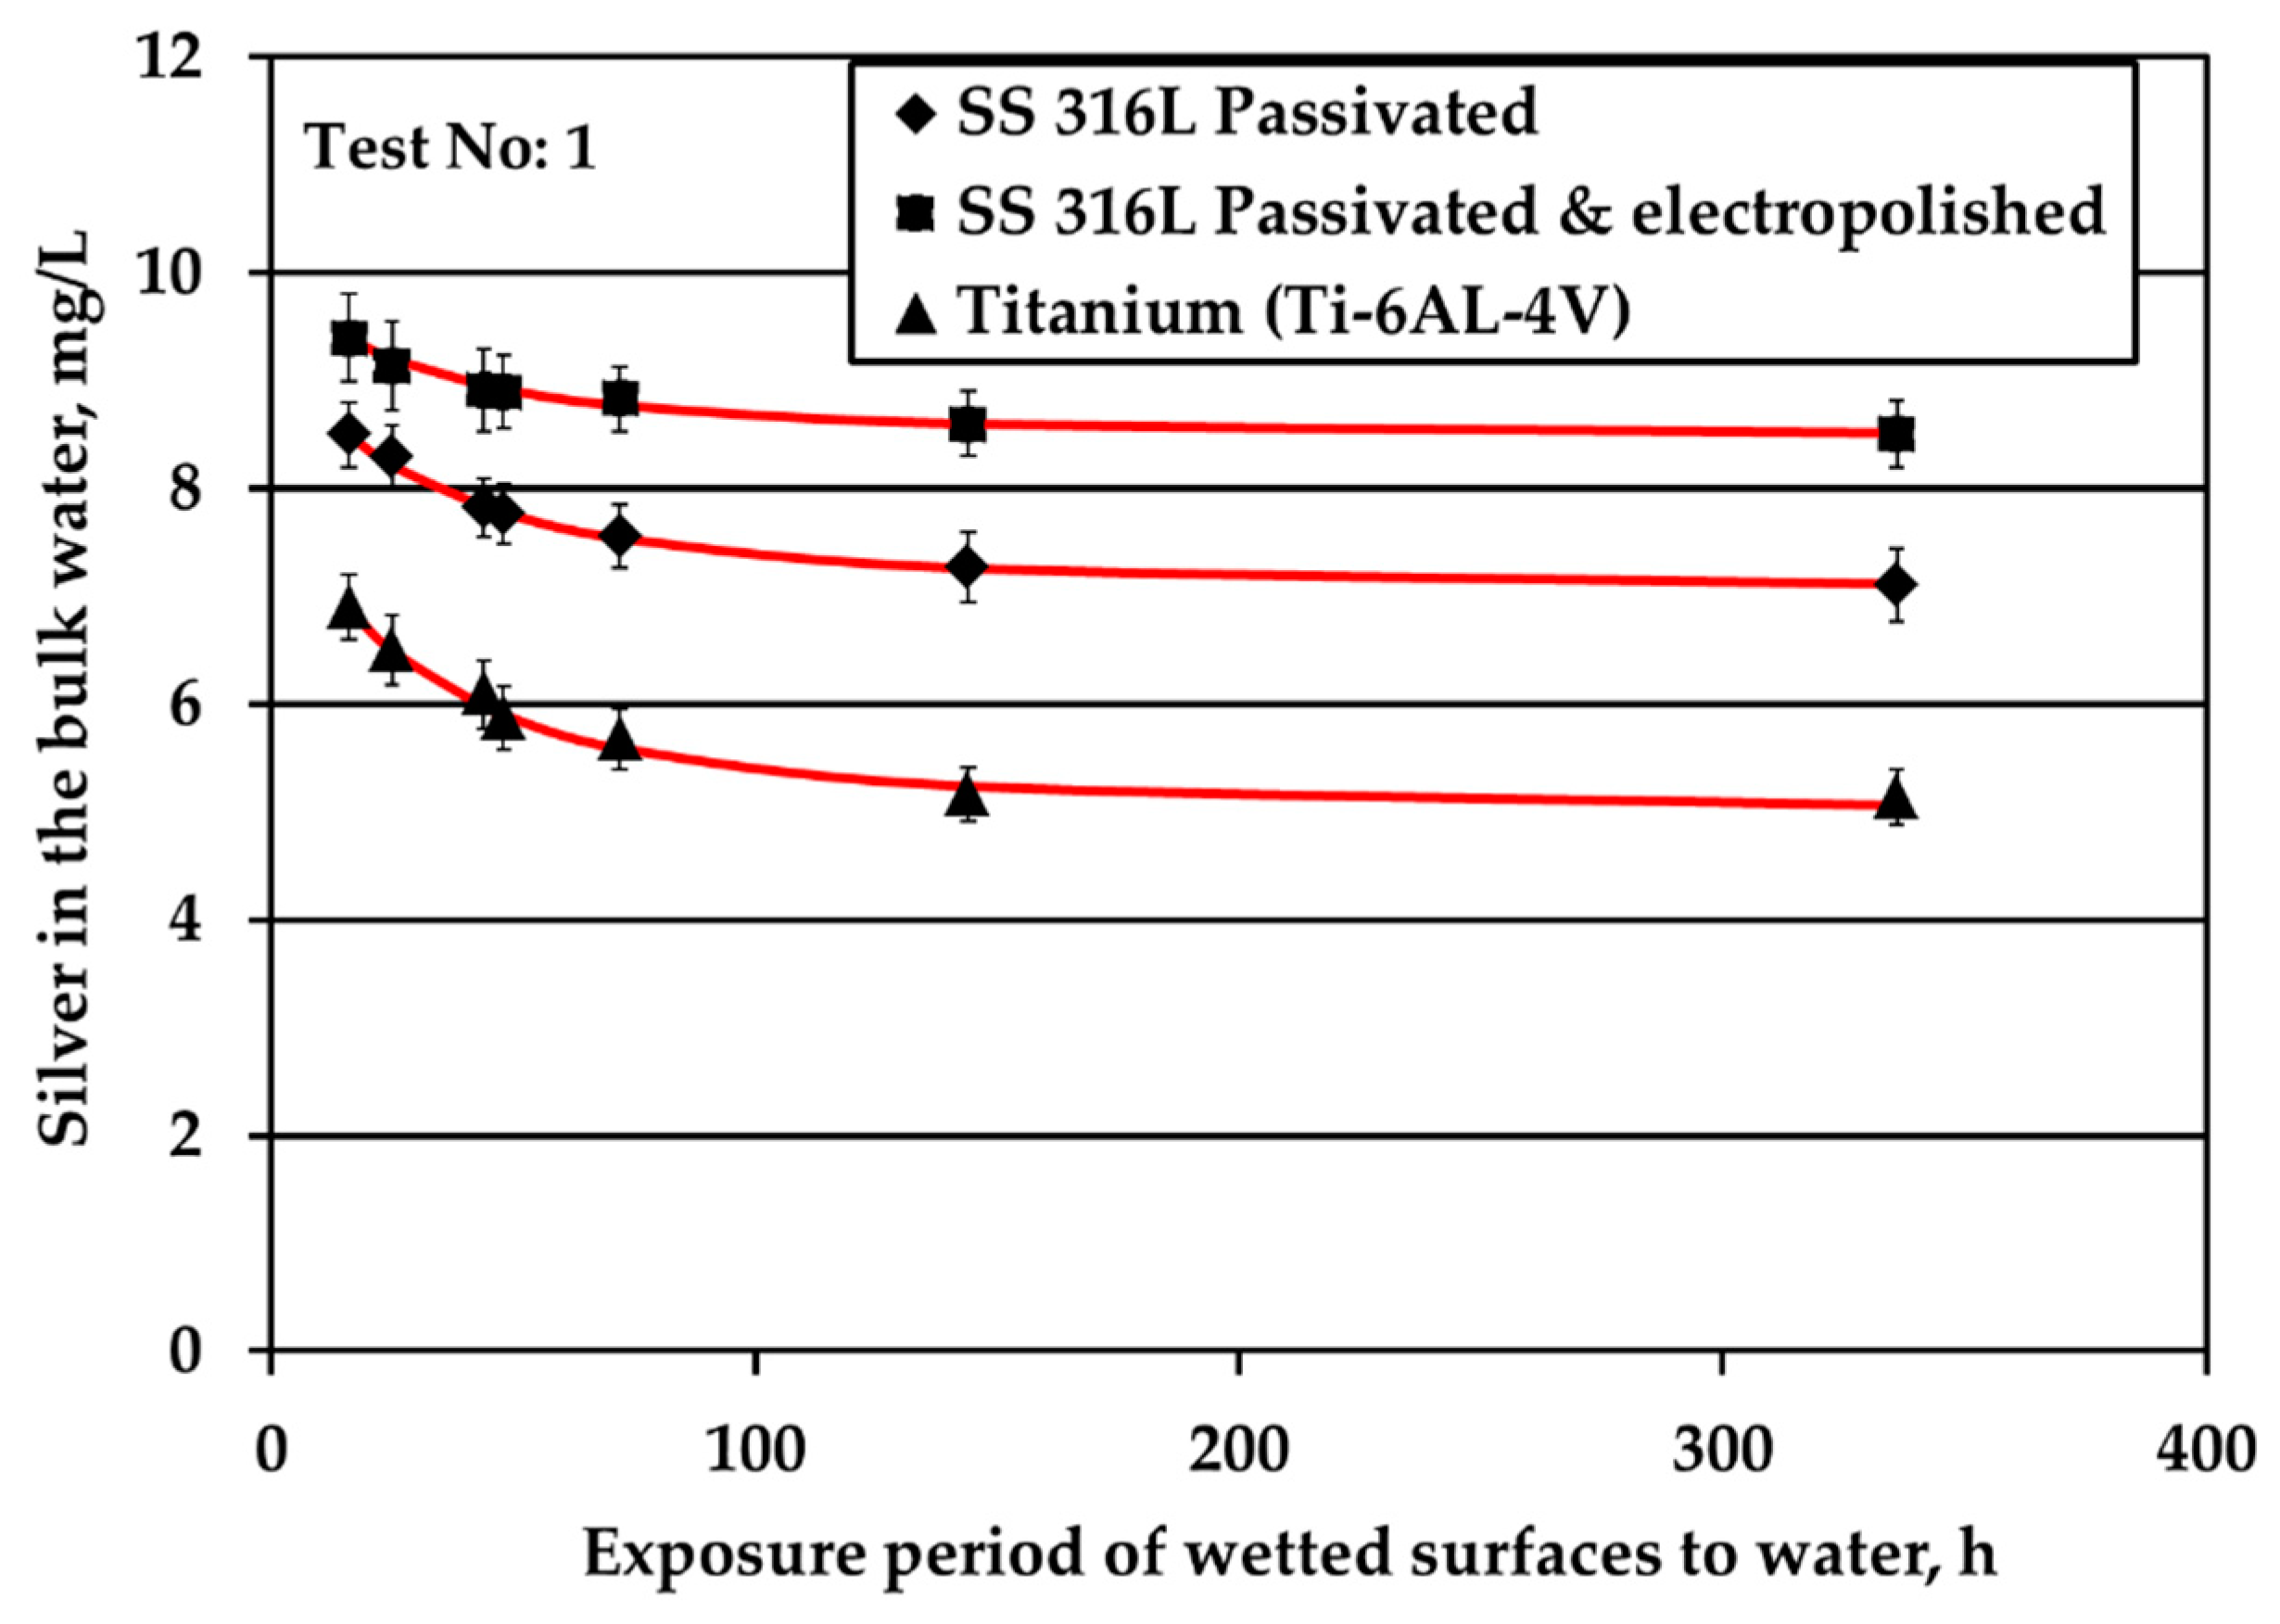
The next set under examination is that of solid surfaces exposed to water with 10 mg/L Ag ions under S/V ratio equal to 1.0 cm
−1 (
Figure 1a). The characteristic mass transfer time is 6 hours so the initial part of the concentration evolution curve is influenced by mass transfer and cannot be used for kinetic parameter extraction. Nevertheless, the concentration evolution after t
in = 16 h is very slow (compared to the mass transfer dynamics) so this part of the process can be safely considered as surface reaction dominated. The type of data here is very different from those of the test performed under water motion since they refer to a much larger bulk Ag concentration, which can be considered constant (approximately equal to its average value) during the examined period. It is attempted to keep the reaction expression similar to these derived previously. So, the following form is considered:
The parameter K(mass/area/time) is now a constant since the bulk concentration is assumed constant during the experiment. The above relation is substituted in equation (7). It is noted that the effect of mass transfer can be ignored for t > t
in. Let us denote C
in the measured concentration now t = t
in. Equation (7) can be integrated analytically (using the solute mass balance q = V(C
o−C)/S and the initial condition C = C
in at t = t
in) to give:
where B = V/(Sq
m). The parameters K and q
m are chosen such that the above expression matches the data of Test #1 for t
in = 16 h. The values of the parameters computed from the fitting are; passivated SS316L solid surface: K = 0.00011 mg/cm
2/h, q
m = 0.003 mg/cm
2; electropolished SS316L solid surface: K = 5.5 × 10
−5 mg/cm
2/h, q
m = 0.0015 mg/cm
2; Ti alloy solid surface: K = 0.00023 mg/cm
2/h, q
m = 0.005 mg/cm
2.
The experimental and the fitted concentration evolution curves for the test of S/V = 1.0 cm
−1 and Ag concentration = 10 mg/L in the absence of water motion are shown in
Figure 5. The values of q
m are comparable (albeit smaller) than those of the previous analysis for the test performed under water motion. The loading, q, range is part of the corresponding range spanned in the experiments performed under water motion. It is interesting that the values of the kinetic constant K derived from results of tests without water motion (equivalent to kC of test performed under water motion case) are found to be similar or larger to those of the test under water motion, confirming the common knowledge that the surface reaction rate is an increasing function of bulk concentration.
Finally, the results obtained from the experiment with S/V = 0.1 cm
−1 and Ag ions concentration equal to 10 mg/L (
Figure 1b) are analyzed through the kinetic model. The characteristic mass transfer time is 25 d, but the very slow kinetics after t
in = 21 days implies that mass transfer contribution can be ignored for t > t
in. So, only the data for passivated SS316L and Ti alloy solid surfaces are useful. The particular data are of specific importance since they correspond to larger values of loading than the so far examined results. It is found then the exponent n in the kinetic expression must take the value 1 (instead of 1.5), in order to match the data for Ti alloy. Equation (7) with the following kinetic expression:
is integrated analytically starting from t = t
in to give:
where again B = V(Sq
m). The fitting values are K = 7.2 × 10
−6 mg/cm
2/h and q
m = 0.0089 mg/cm
2. The data from passivated SS316L solid surface can be described by a straight line which implies that n = 0 in the kinetic equation. The value of K derived from the data is 3.1 × 10
−6 mg/cm
2/h. The q value at the end of the experiment is about four times larger than the q value at the end of test performed under water motion. The experimental and the fitting concentration evolution curves for tests conducted with S/V = 0.1 cm
−1 and Ag ions concentration equal to 10 mg/L are shown in
Figure 6.
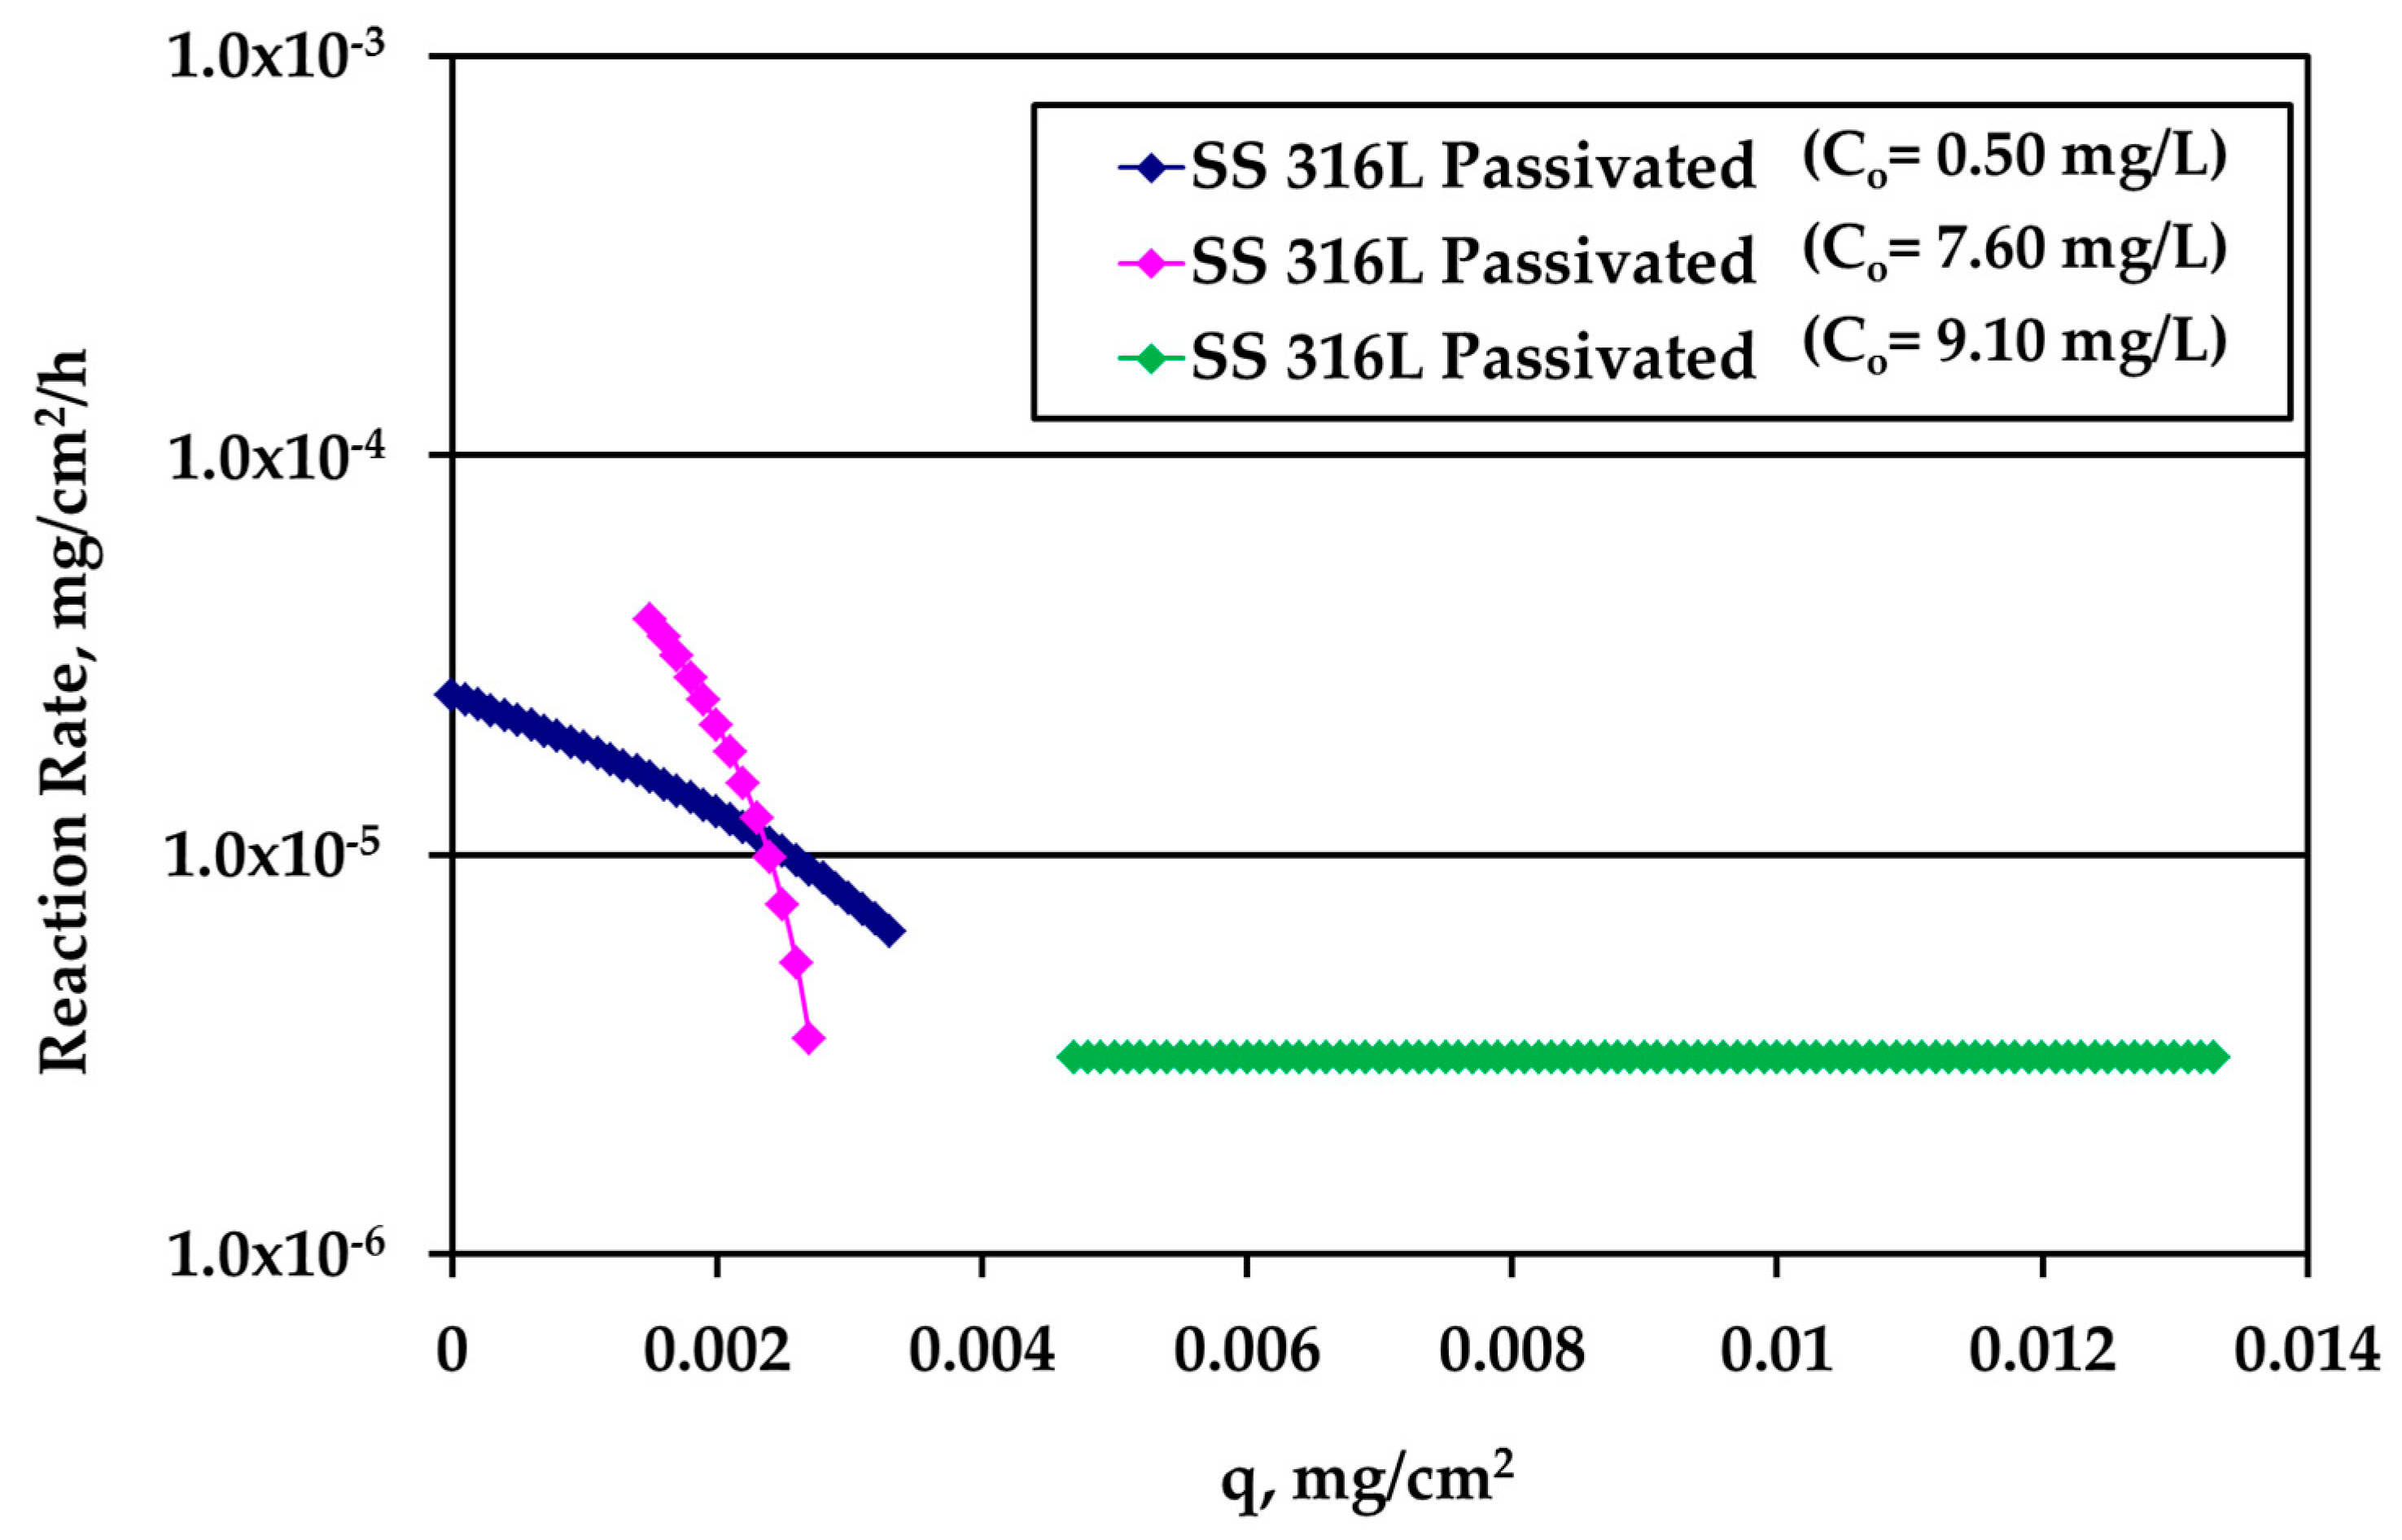
It is very interesting to plot the reaction rate R (mg/cm
2/h) versus the loading q using the whole information extracted above from the experiments. The results for passivated SS316L are shown in
Figure 7. The different curves refer to different kinetic experiments and to different Ag bulk concentration values.
At low loadings, the rate is larger for larger Ag bulk concentration, as expected. As loading increases, the rate concentration dependence decreases indicating that bulk concentration and loading influence the reaction rate in series and not independent from each other. The crossing of the two different concentration curves is not essential since it is due to the asymptotic behavior of the data obtained during tests with high Ag concentration (10 mg/L) and S/V = 1.0 cm−1. A slight modification of the last experimental point would eliminate this crossing. A loading independent reaction rate appears at large values of q.
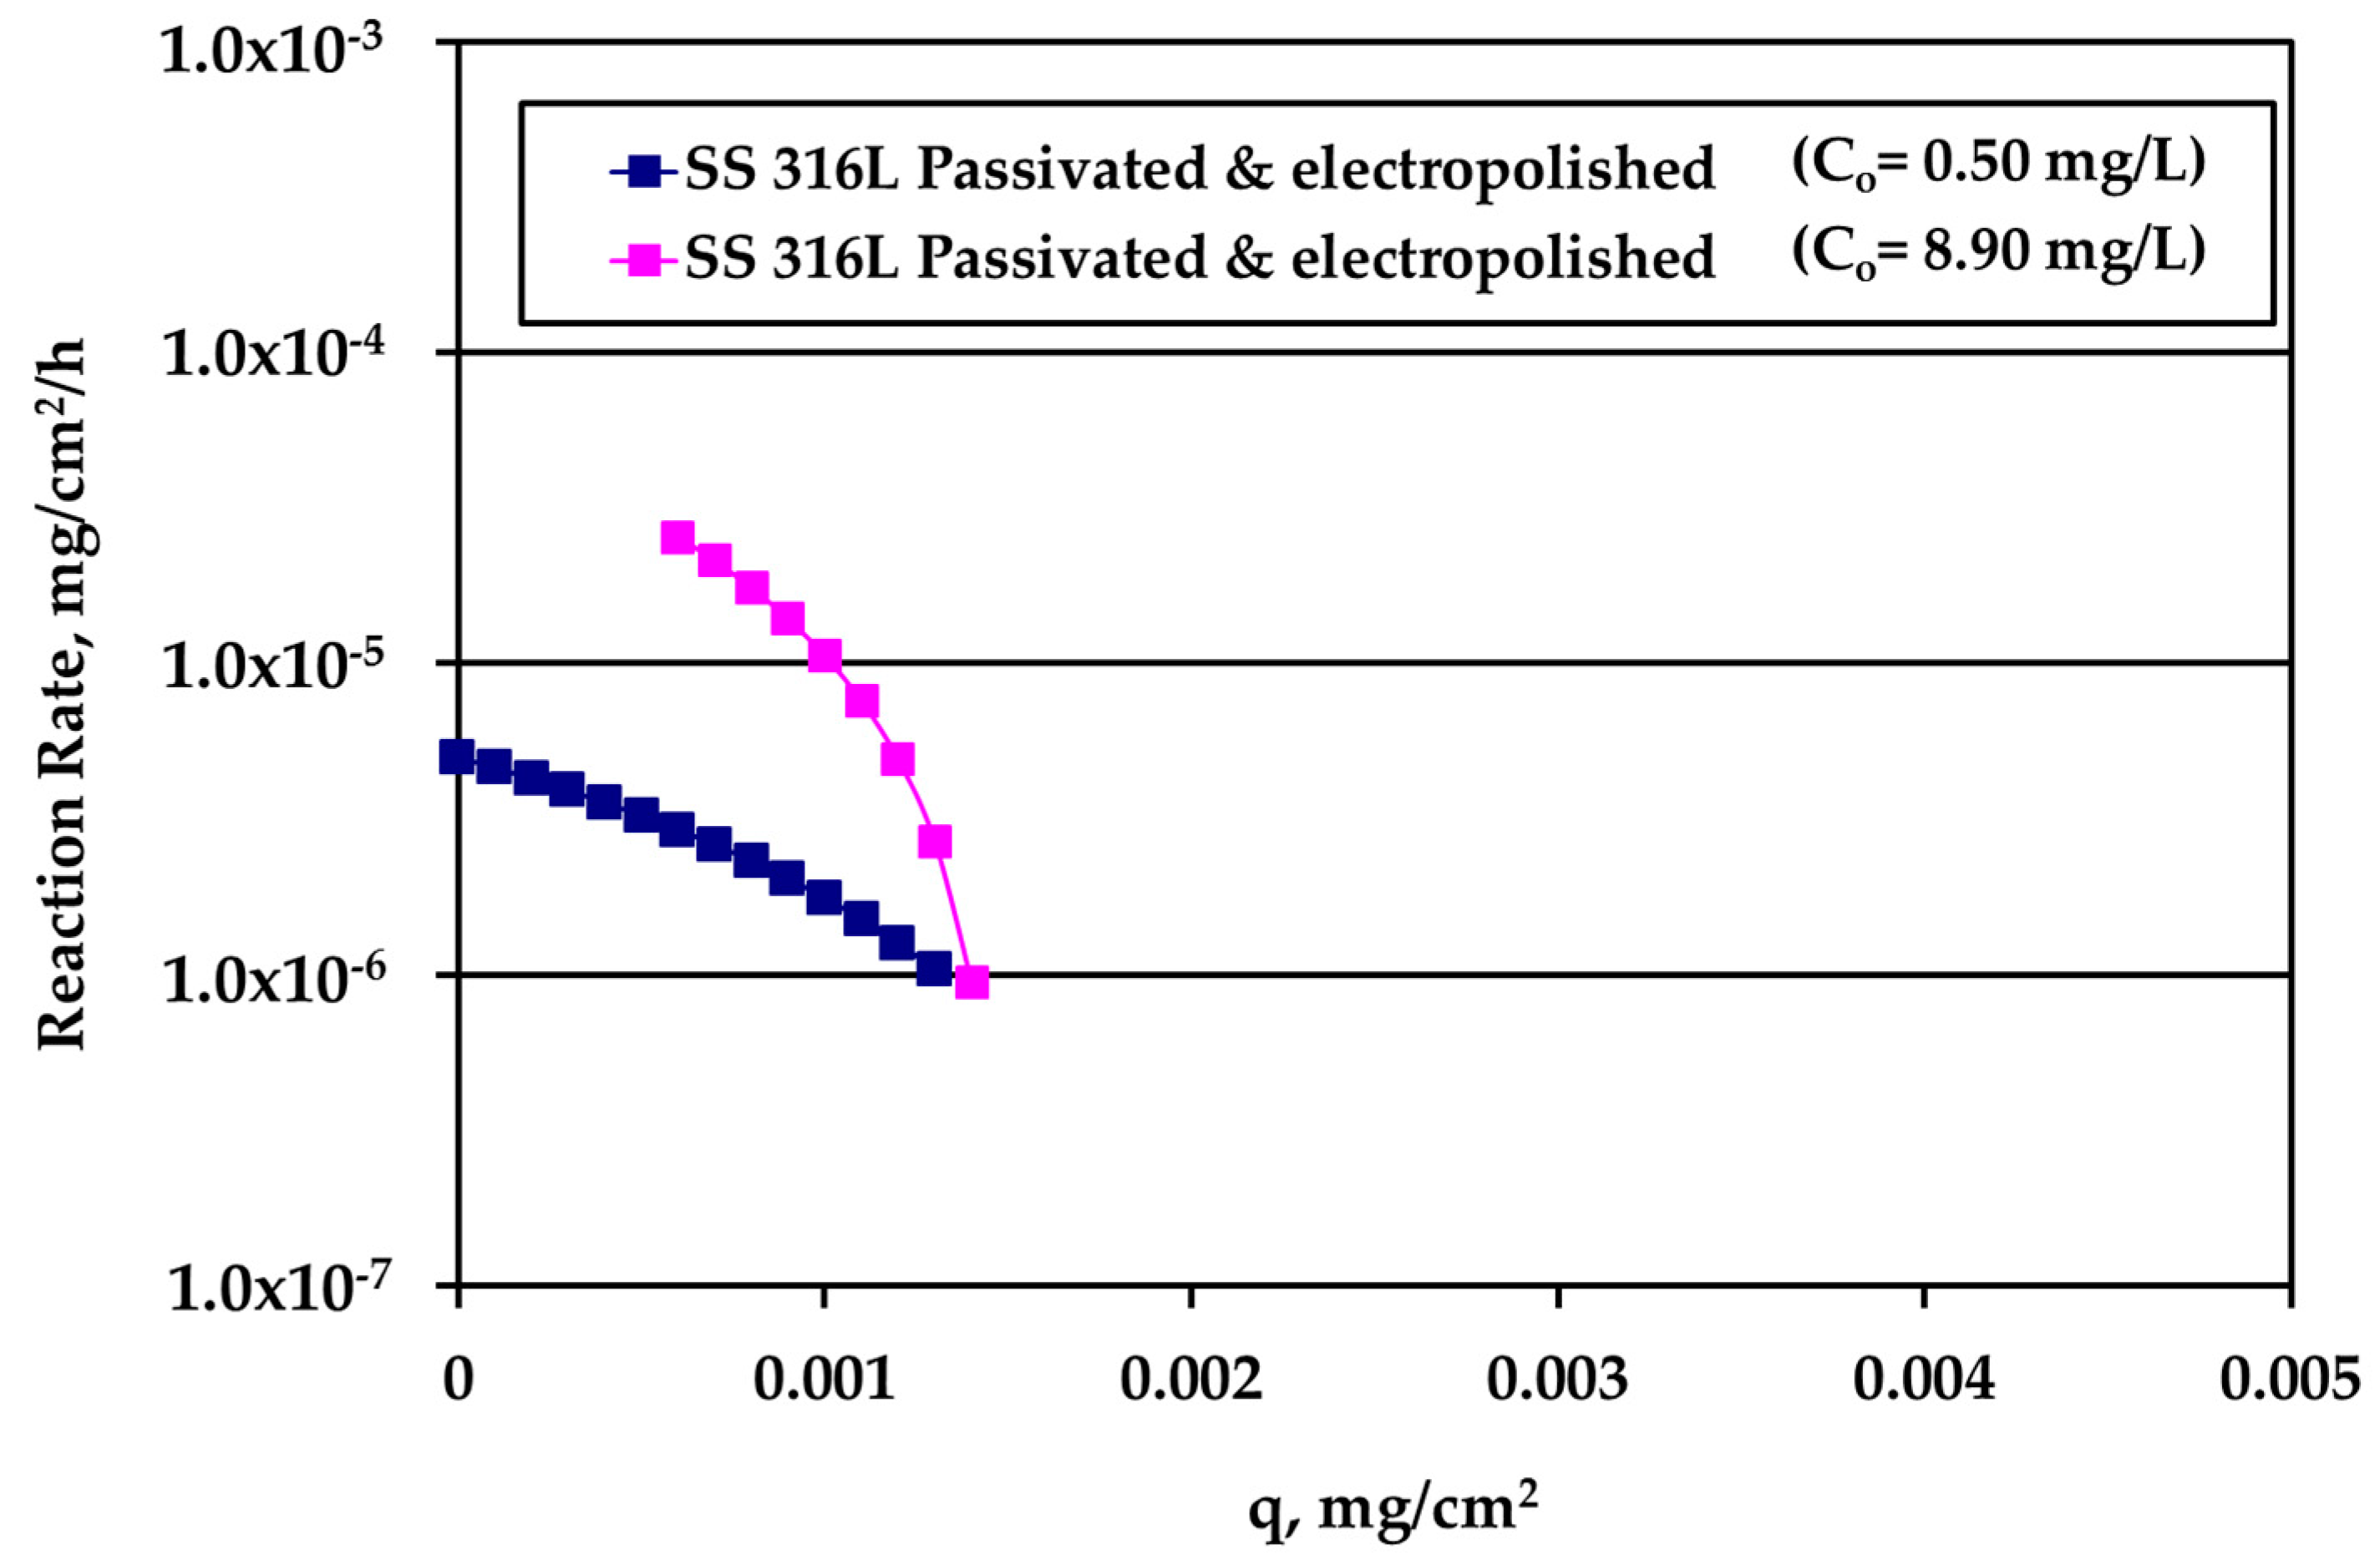
The rate data for electropolished SS316L appear in
Figure 8. The rate is clearly higher for higher Ag bulk concentration and the difference decreases as q increases. The loading capacity q
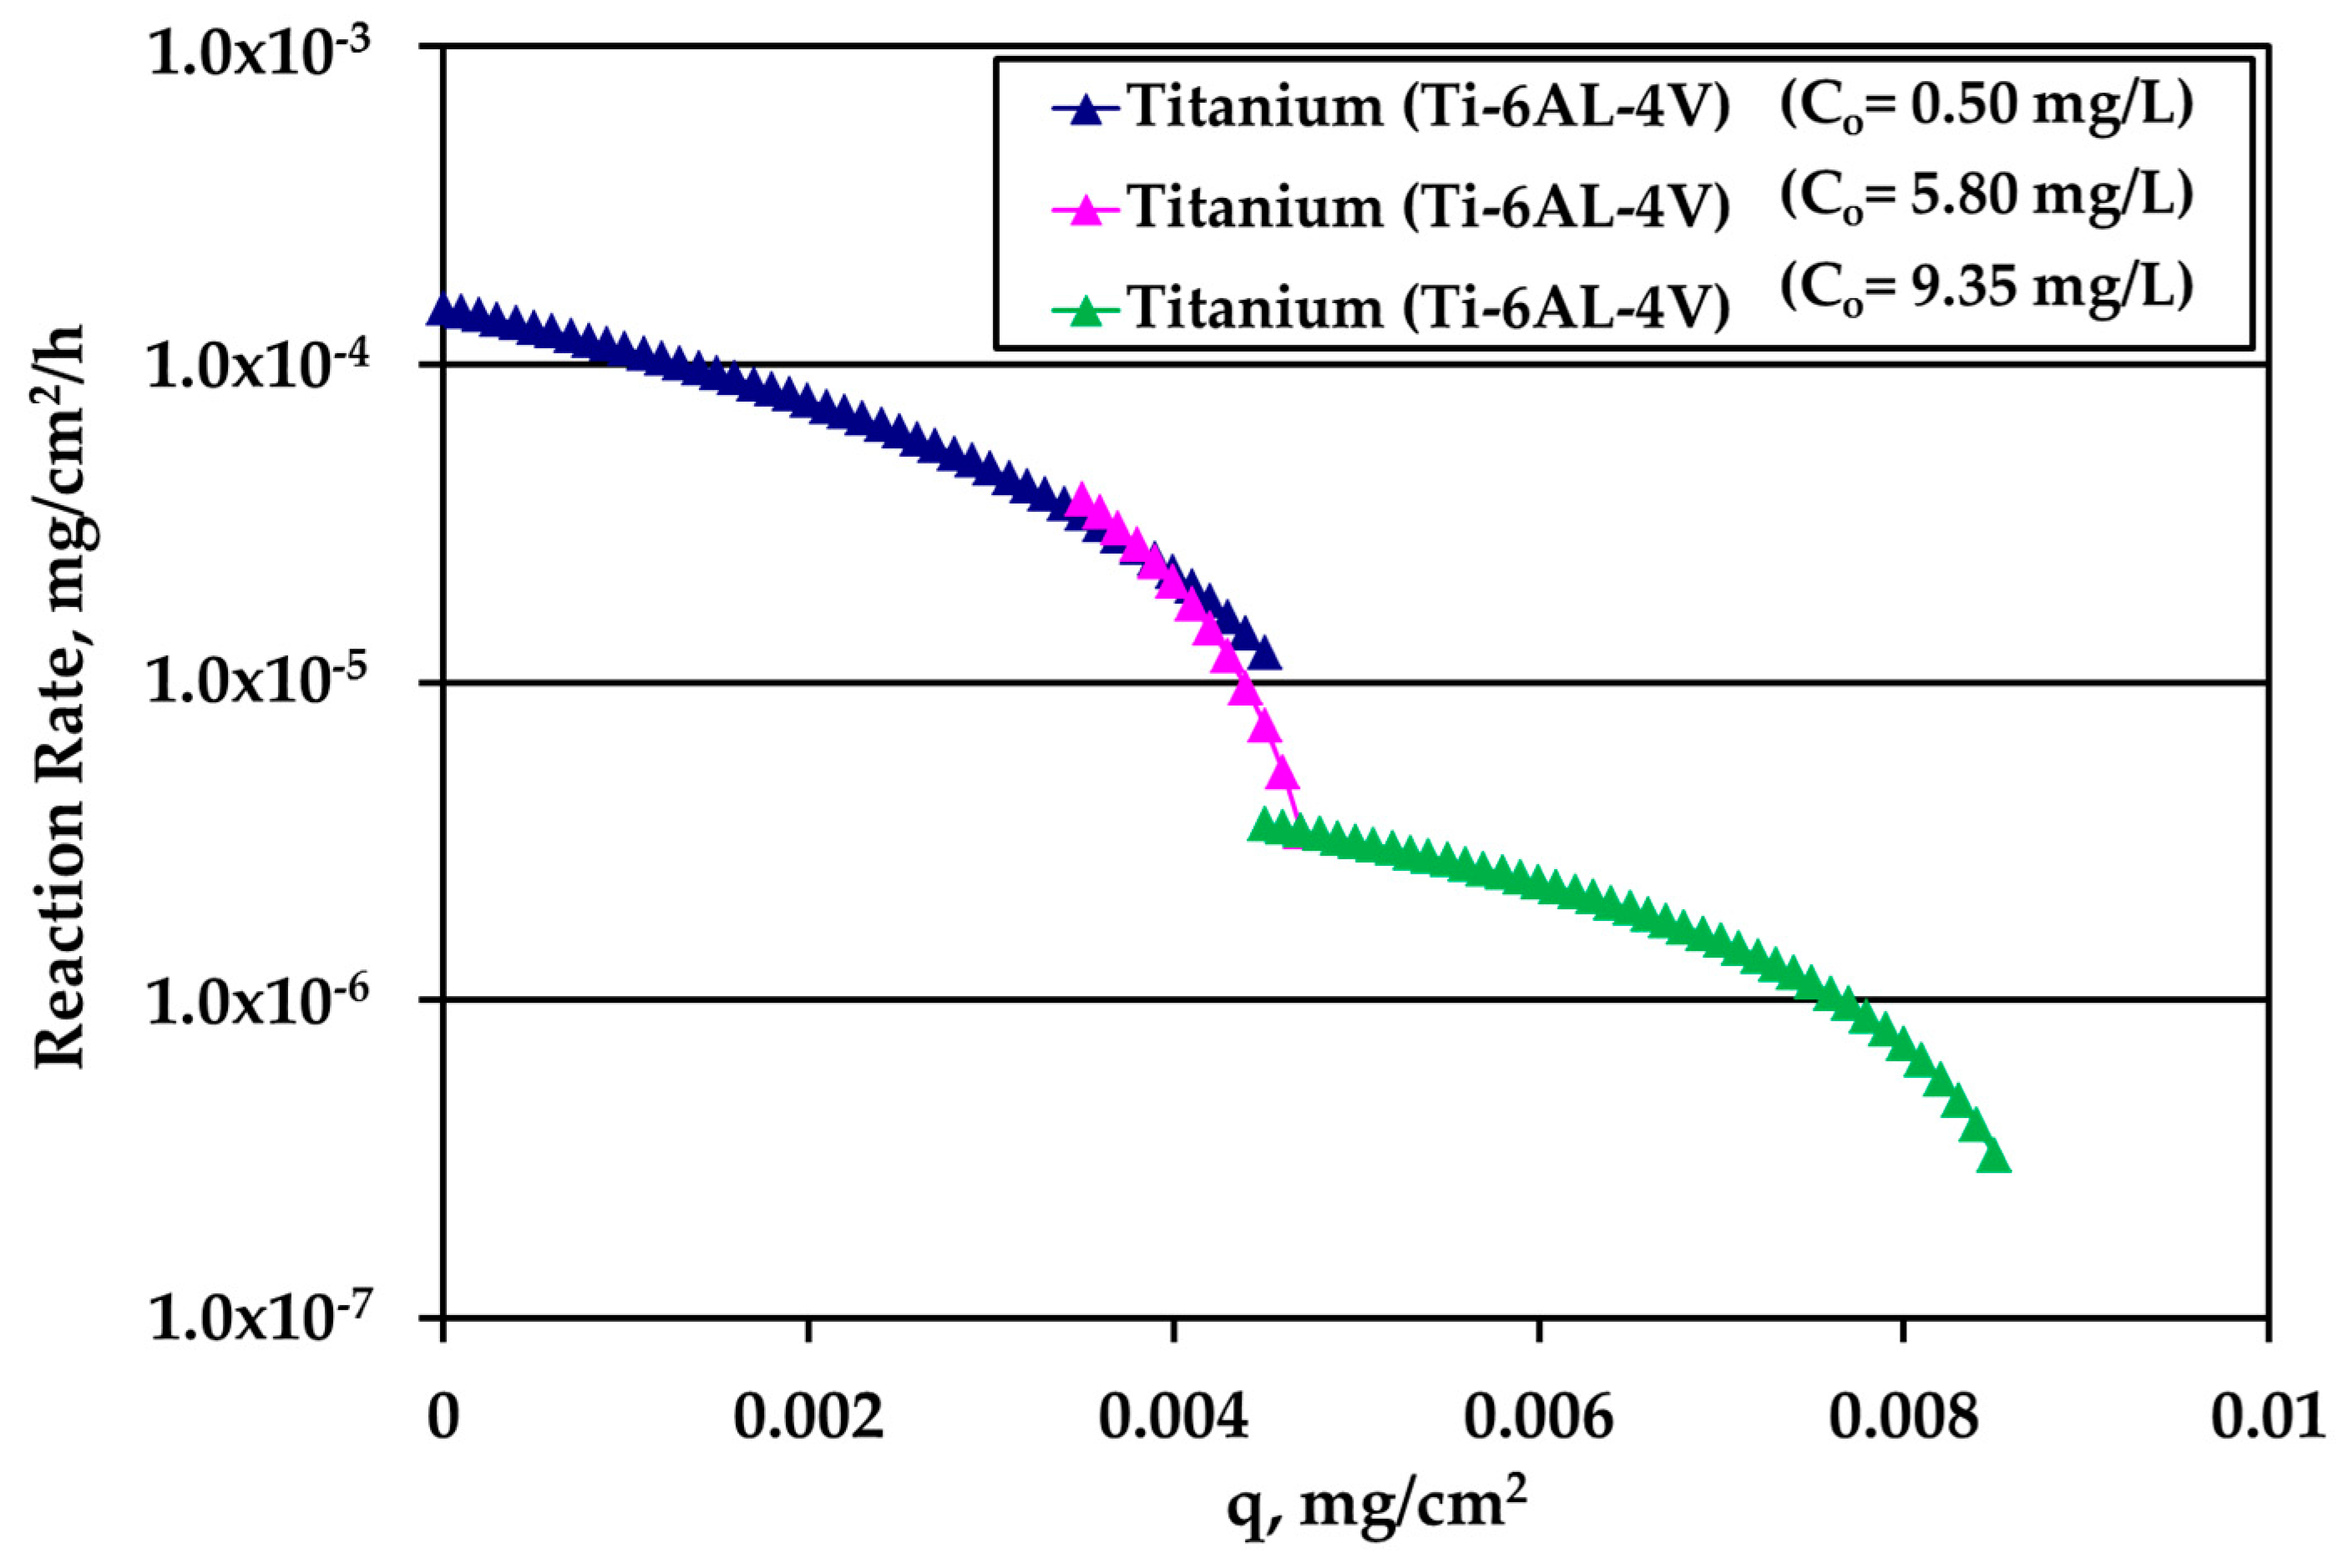
m of tests under water motion appears to be much smaller for this solid surface. Finally, the reaction rate for Ti alloy is presented in
Figure 9. There is an overlap between the data from the experiments performed under water motion and experiment conducted at high Ag concentration (10 mg/L) and S/V = 1.0 cm
−1 in stagnant conditions, indicating an independence from bulk concentration at the common range of loading q. In case of Ti, the whole set of rate data can be described by a single curve for q dependence as it is clear in
Figure 9.
Summarizing the findings of this study, the electropolished SS material shows the lowest value of silver deposition capacity, referred herein as loading; however, the surface reaction rate remains stable as loading increases, suggesting that most probably this type of material is prone to continuous silver deposition. On the other hand, for the titanium alloy, the surface reaction rate is progressively decreasing as the silver deposition increases; indicating that under specific conditions the surface of this material can get saturated. If so, this material has a high potency to be used for long term storage of water, without observing further silver depletion from water and posing risks to human health. Still, the outcomes of this study should be investigated further including considerations such as the verification of maximum loading capacity of each candidate material and the reverse phenomena that might occur under real conditions.
A very recent work studies the interaction of Ag ions with a stainless steel surface (304 SS) [
25]. The experimentally inventory is certainly more extended than the present one. The focus is on antimicrobial properties of the surface (for terrestrial applications) in contrast with the present work in which the remaining Ag in the bulk liquid is of practical interest. Li et al. [
26] demonstrate that no Ag removal from the surface occurs for ultrapure water whereas in case of tap water the removal is very low. Ag can be removed from the surface only using chemical means. This is in perfect agreement with the present argument that Ag is incorporated into the metal through a chemical reaction. On this ground, it can be stated that the Ag incorporation to the metal surface kinetics is erroneously treated as a typical adsorption process, as shown by Li et al. [
26]. All the adsorption kinetic models are tested against the data and it was found that the pseudosecond order one describes better the data. It is reminded that they are purely empirical models offering no extrapolation capabilities (see Ref. [
25] for a detailed analysis to the subject). On the other hand, here the correct interpretation of chemical reaction domination has been made and chemical reaction expressions that describe the experimental data were derived.
Further to the direct findings of the present work like the superiority of Ti over SS surfaces for the particular application examined (retaining of Ag in the bulk liquid), its major contribution is that a specific framework is proposed for the modeling and subsequently design of water storage systems for long term missions. It was shown that an essential step of the Ag removal from the bulk mechanism is the surface reaction. This mechanism can be isolated by the intense stirring of the experimental set-up allowing in this way the derivation of surface reaction kinetic expressions. These expressions can be further improved in the future by considering additional experimental data and consulting the theoretical background of the galvanic replacement process. The final stage of the proposed procedure is the modeling of the storage system operation in the space station. In that case, diffusion has a considerable influence on the Ag removal kinetics and it must be modeled in detail. Also, the effect of varying water level due to water consumption must be considered. This type of modeling will eventually allow the overall optimization of the water storage system in the ISS. Obviously, the derivation of surface reaction kinetic rate, which is the purpose of the present work, is an essential step of the above strategy.


