4.1. Data Stationarity and Cointegration Test
This paper uses a panel data model to analyze the drag effect of water resources in the four major economic zones (East, Central, West, and Northeast China) based on data from 1987 to 2017 for 31 provinces (municipalities and autonomous regions). The stability and co-integration of the data will have an impact on the analysis of the drag effect of economic growth [
3,
8,
20,
21]. At the same time, due to the two-dimensional nature of the panel data, the stability of the data directly determines the credibility of the results, so a panel data model is adopted. Before the regression analysis, the data should be tested for stationarity and co-integration. The most common method is the unit root test [
8,
20,
21]. In this paper, two-unit root test methods are used, the same-root LLC (Levin–Lin–Chu) test and different-root Fisher-ADF test. If the hypothesis of the existence of a unit root is rejected in both tests, the data is considered to be stationary. If the hypothesis of the existence of a unit root is accepted, the data is considered to be unstable.
Based on formula 3, the logarithms of GDP, Water, Labor, and Capital are calculated—
,
,
, and
, respectively. The unit root tests were performed using STATA software. By testing the first-order difference values of
,
,
, and
, it is found that there are no unit roots at the significance level of 1%, indicating that these four variables are all first-order single integer I (1) (
Table A1).
Co-integration refers to the sequence of a linear combination of two or more non-stationary variables; that is, the sequence of these variables has a long-term equilibrium co-integration relationship [
8,
20,
21]. The unit root test results show that the variables are the same order and single, so the co-integration test can be performed. Through the data stability and co-integration tests, it is found that
,
,
, and
are an unstable sequence (
Table A2). However, there is at least one co-integration relationship between them, indicating that there is a long-term stable equilibrium relationship between the variables, and the regression residuals of the equations are stable. Therefore, further regression analysis can be done.
4.2. Analysis of the Spatial Dimension of the Drag Effect of Water Resources
According Equation (8),
. α is the elasticity coefficient of the capital, β is the elasticity coefficient of the water resources, n is the labor growth rate. Based on the results of Variable coefficient panel model in
Table 4, we can get the second column (Water) is equal to β, the third column (Capital) is equal to α, and the seventh column (N-Labor) is equal to n. Therefore, we can get the growth drag of water resources, and the results is in the ninth column (D-Water).
Under water resource constraints, China’s overall economic growth rate dropped by 0.15%. The average annual growth rate of the eastern, western, central and northeastern regions declined by 0.23%, 0.07%, 0.43%, and 0.09% (
Table 4). That is to say, the economic growth of the central region is more affected by water resources, followed by the east, west and northeast. It can be seen that the drag effect of water resources on the central region, which is affected by rapid economic growth (a GDP growth rate of 10.61%), cannot be ignored. Water resources constrain the economic growth of the central region at a rate of 0.43% per year. If this rate continues, the economic growth rate in the central region will be reduced to 91.34% in 2040. From the perspective of regional characteristics, Henan Province in the central region is a large grain province, and Hunan Province is a land of rice. The economic growth of these provinces is highly dependent on water resources, so there is a large water drag effect on the economic growth of the central region. The eastern region is a coastal city with a developed aquaculture industry and a high degree of dependence on water resources. Therefore, the economic growth of the region is also constrained by there being less available water. The economic growth of the western and northeastern regions is less constrained by water resources, which is mainly related to the development direction of the region. The economic growth in the northeast region mainly relies on the development of energy, such as oil and coal. The labor force growth rate in the western region is small (1.22%), and the capital stock accumulation rate is relatively fast (13.06%). The economic growth is mainly related to the accumulation of capital stock and has little dependence on water resources. Therefore, the water resources efficiency of the economic growth in the western region is lower than that in other parts of the country.
There is a large regional imbalance in China’s water resources, and there are also serious regional imbalances in economic growth [
36]. Therefore, there are also differences in resource constraints to economic growth in different regions. In order to more fully reveal the impact of water resources in different regions of China on the economic growth of the region, this paper conducts regression analysis on 31 provinces and cities, based on panel data from 1987 to 2017 (
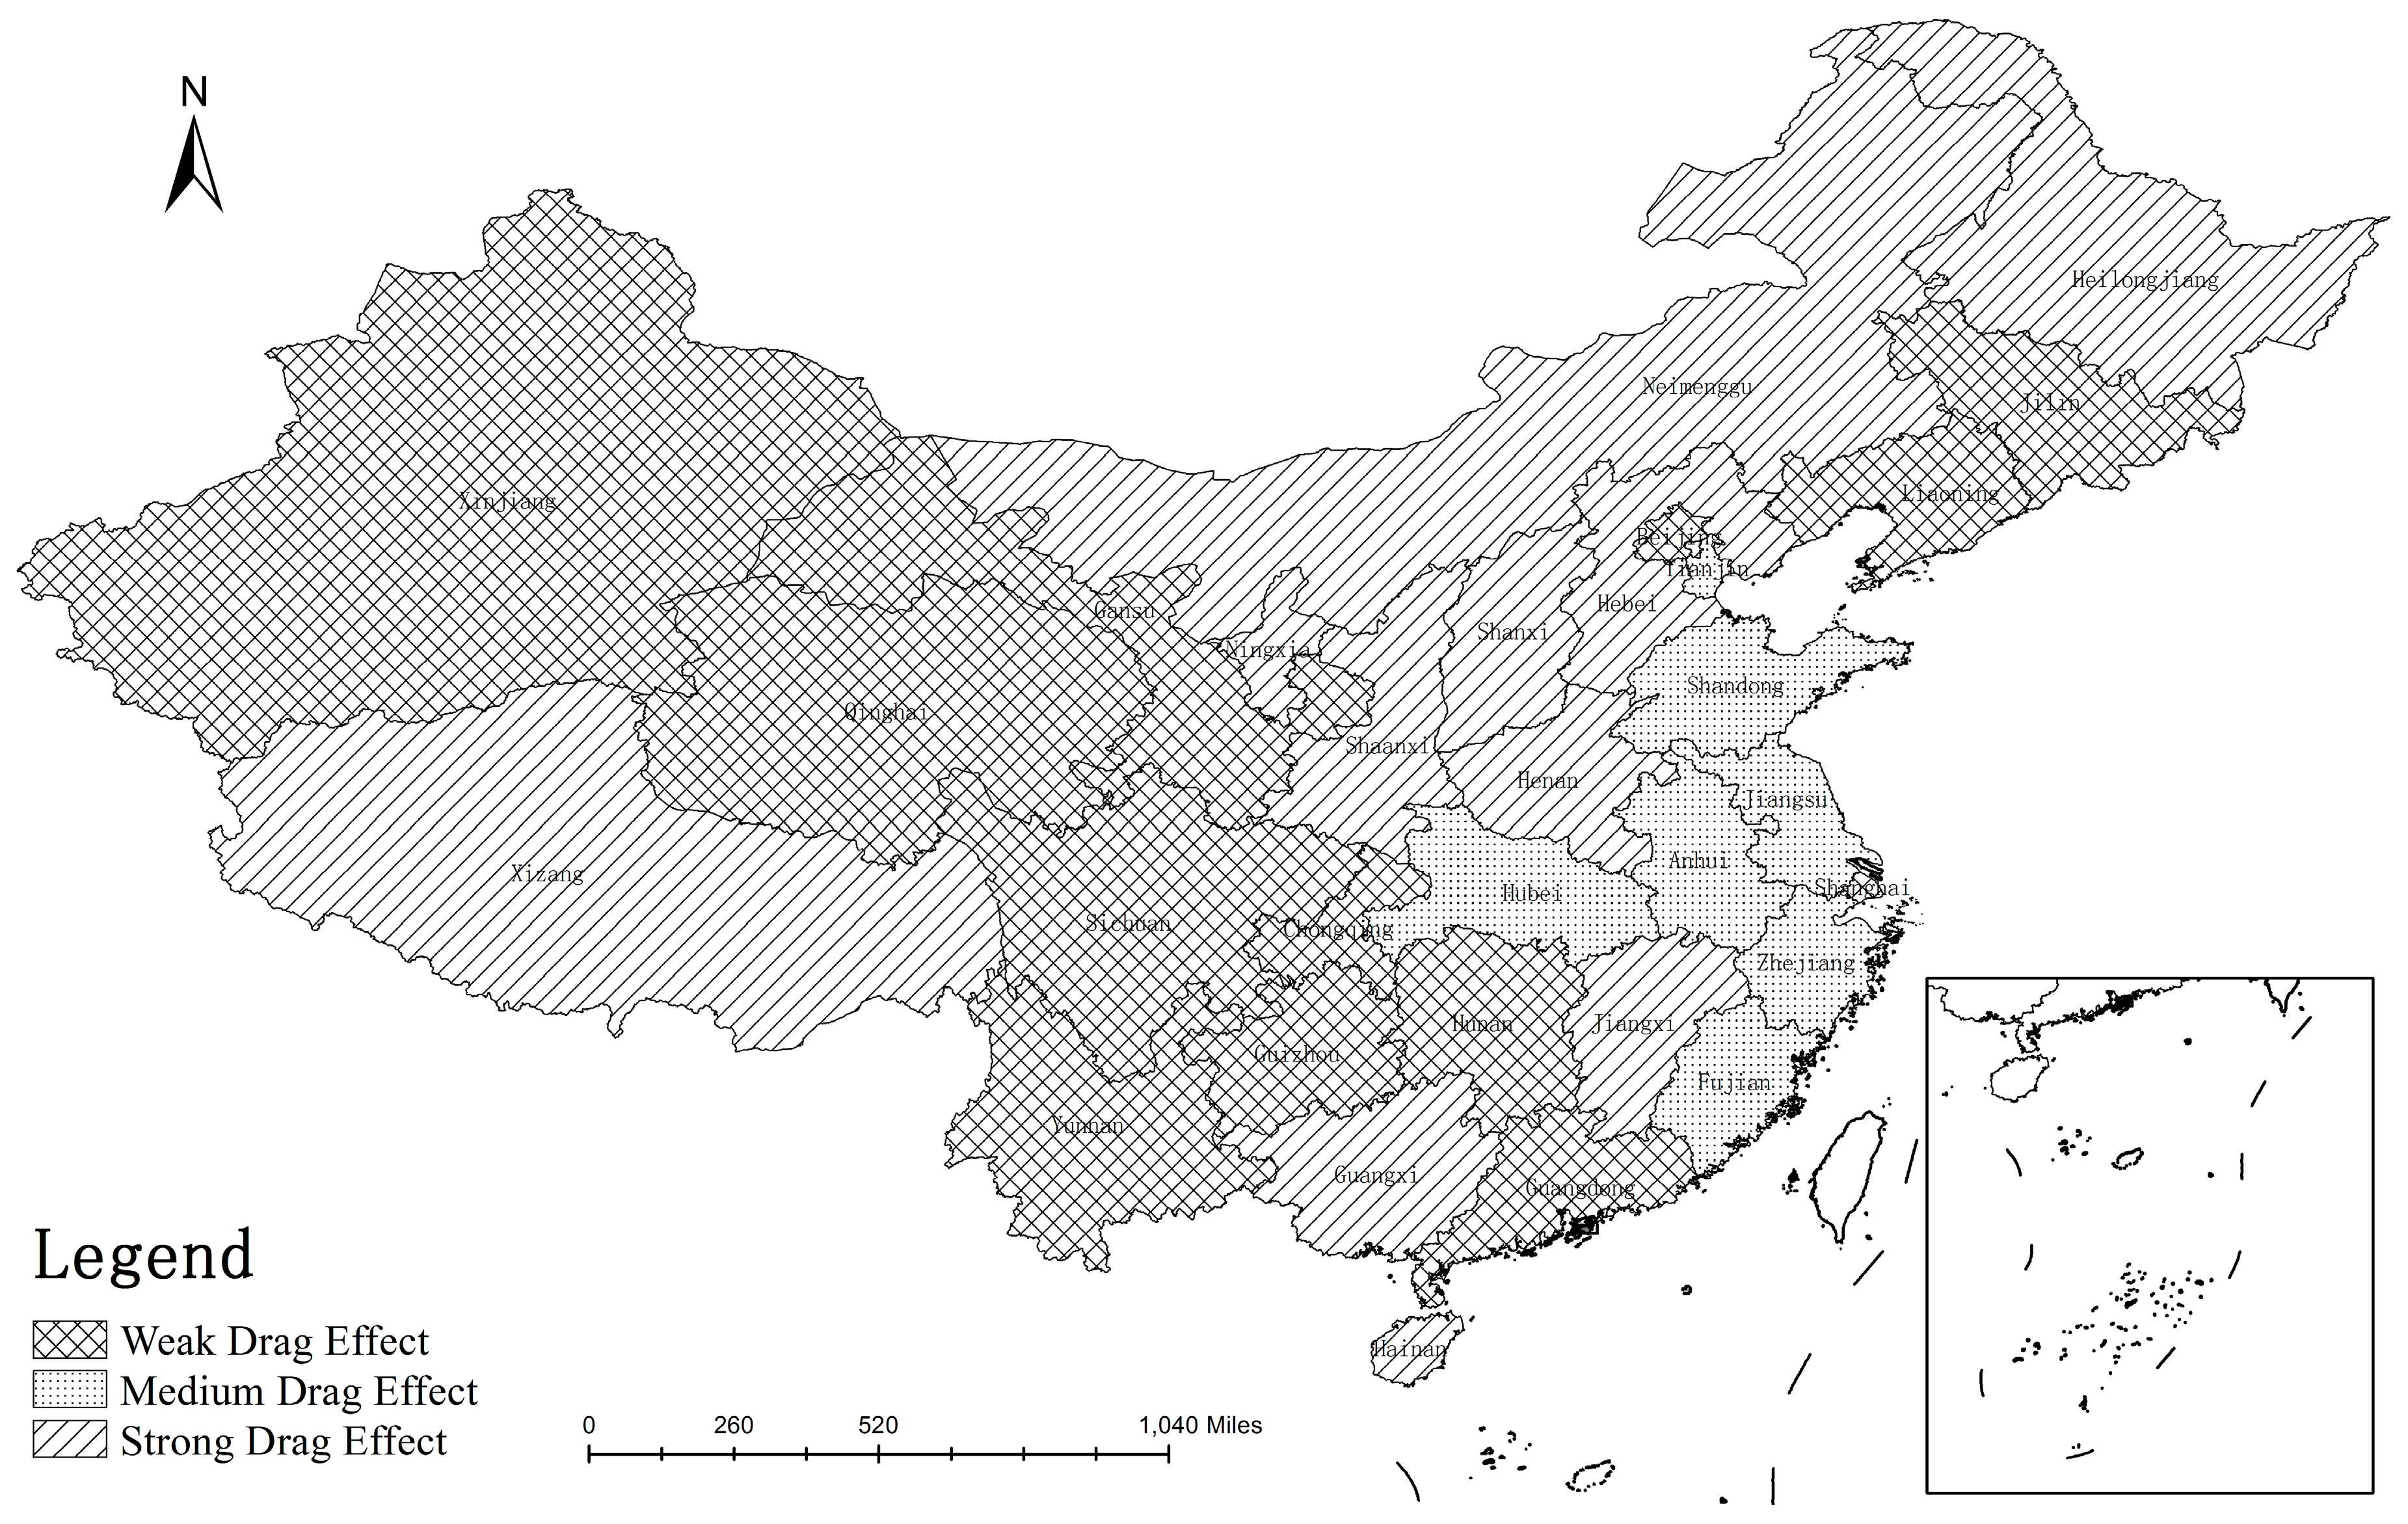
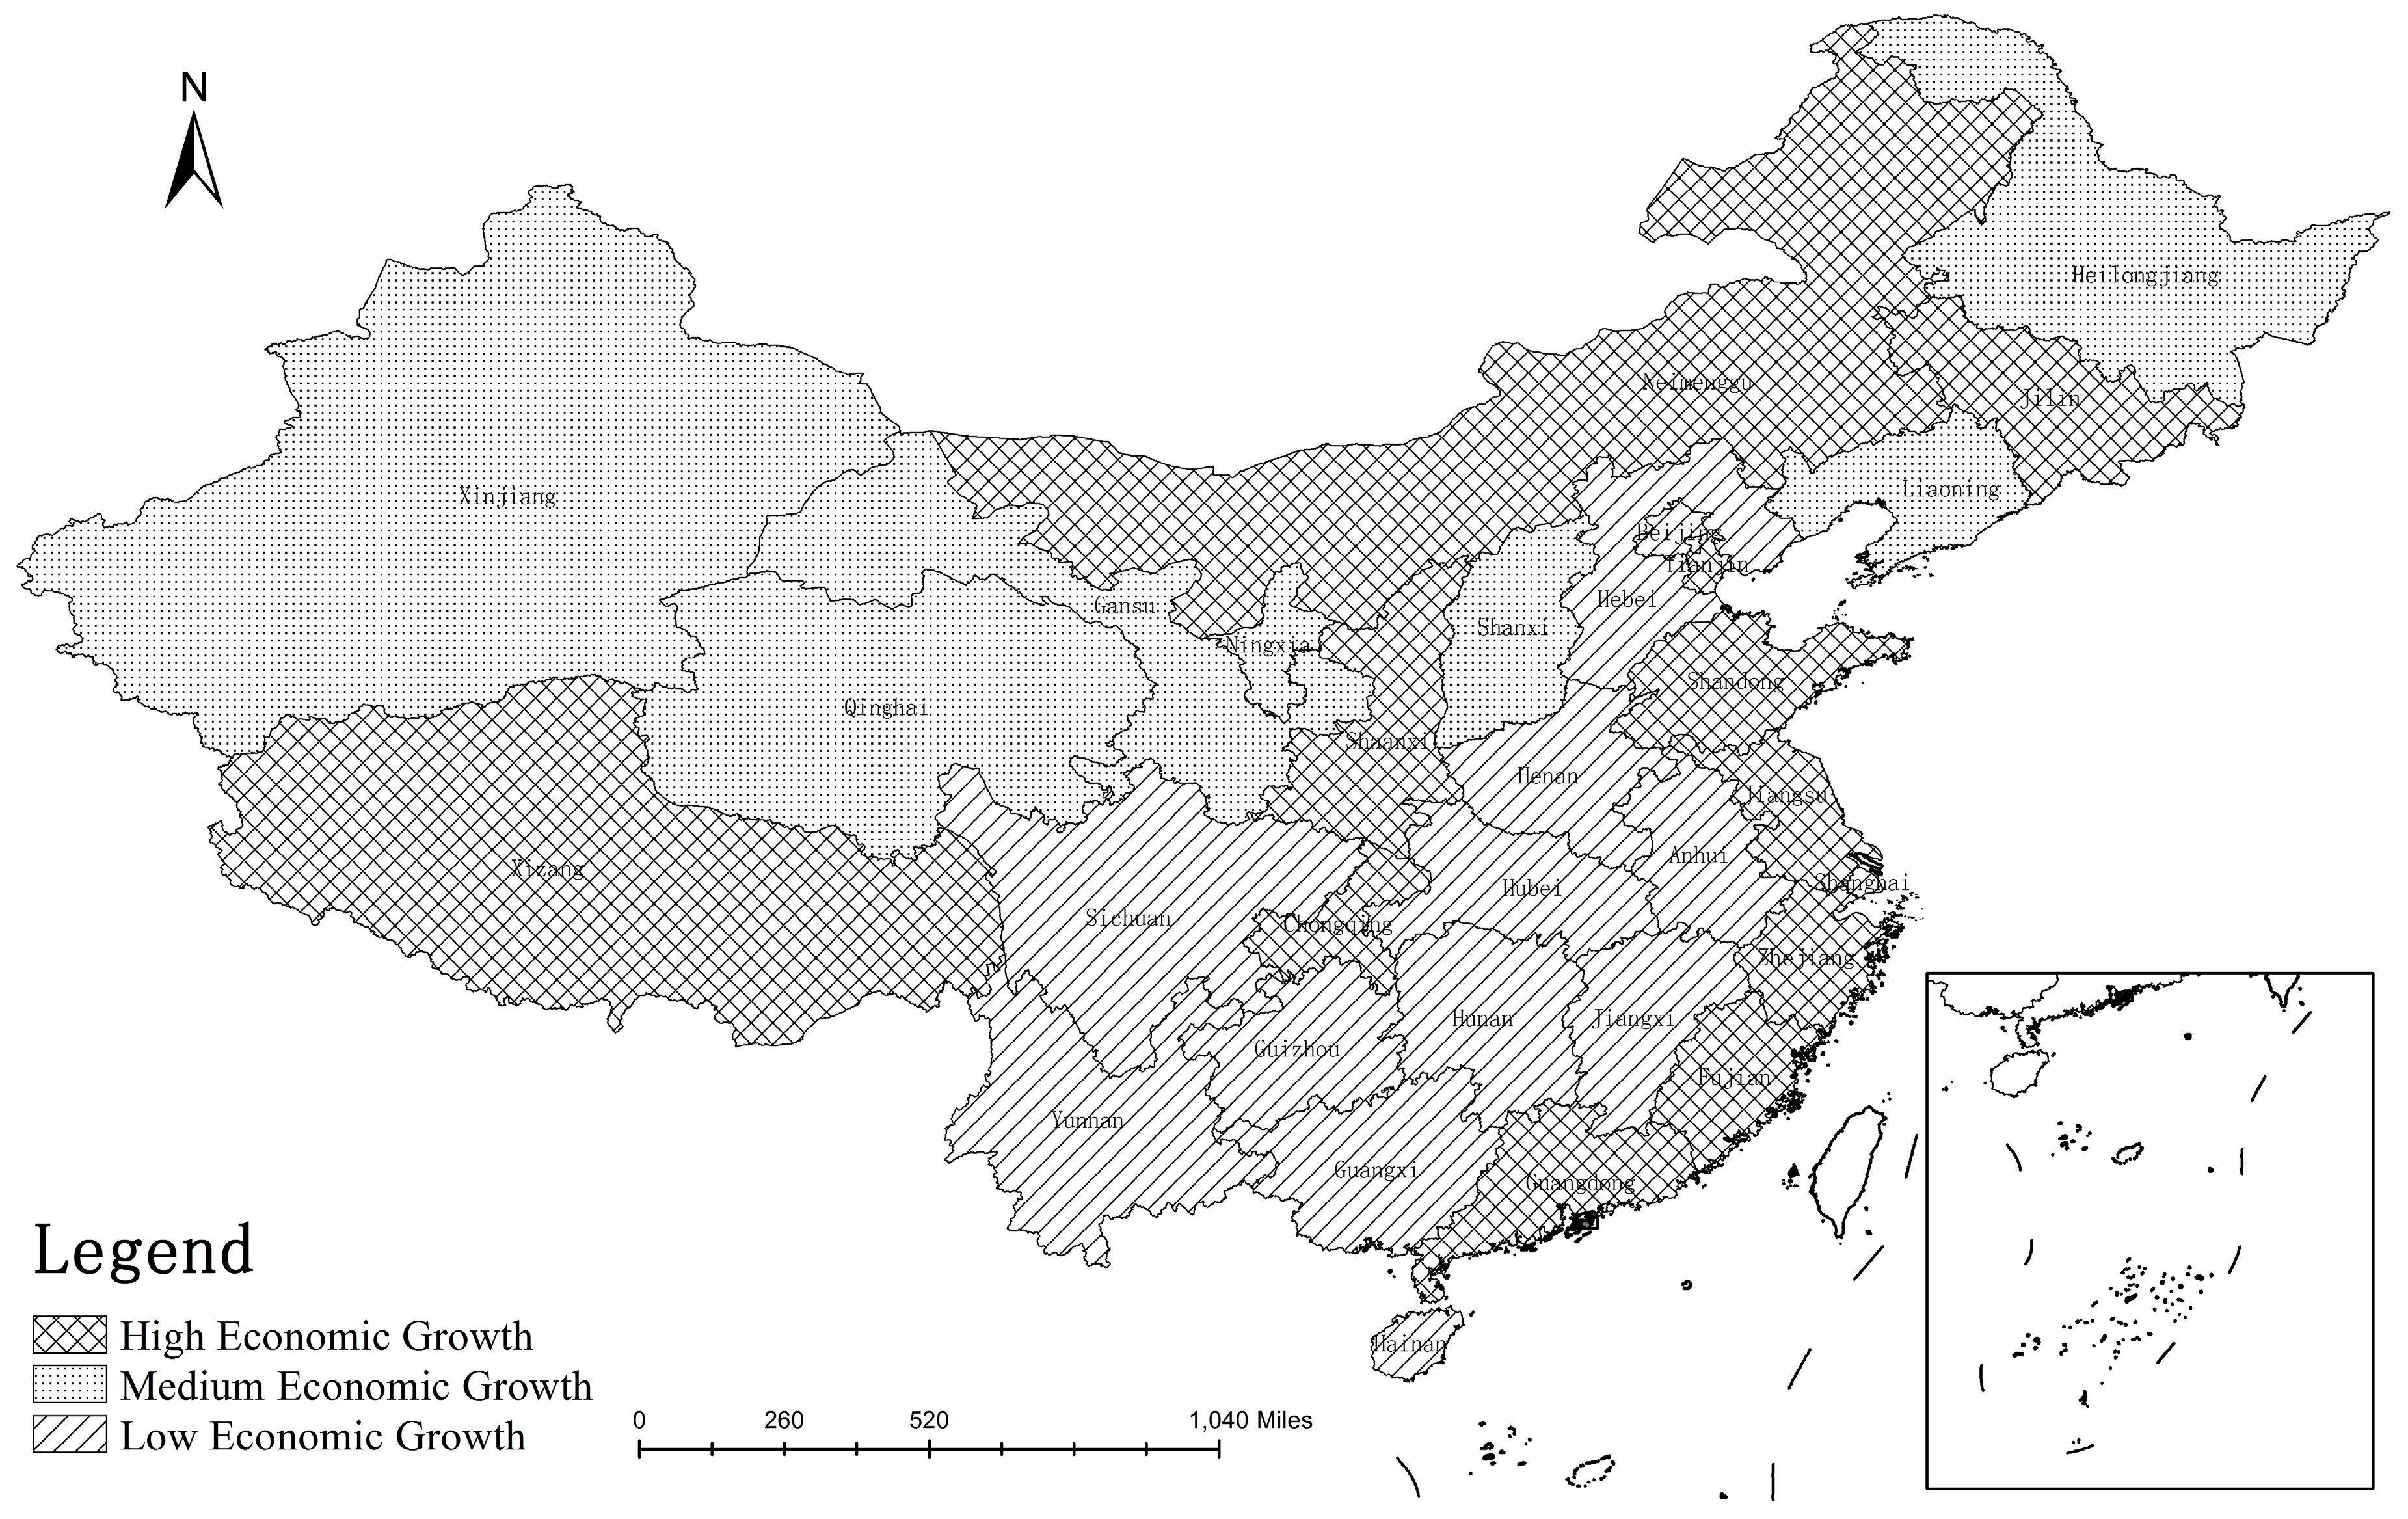
Table 4). At the same time, according to the size of D-Water and N-GDP, 31 provinces and cities are divided into weak, medium and strong, which constitute three “Growth Drag” constraint levels (
Figure 2), and low, medium and high, which constitute three economic growth types (
Figure 3).
The drag effect of water resources in Beijing, Gansu and other provinces are weakly constrained. There are two main reasons for why water resources are less constrained by the economic growth of these provinces: the economic growth rate of provinces, such as Beijing, Shanghai, and Chongqing, ranks in the top 10 in the country, the labor growth rate is medium-speed, and the accumulation of capital stock is fast, indicating that it is local. The greater degree of economic growth is related to the accumulation of capital, so water resources are relatively less restrictive to these areas. In the central and western regions of Hunan and Gansu, the economic growth rate is slow, and the labor growth rate is lower than the national average. The current situation of sparsely populated land has largely alleviated the pressure of water resources on economic growth.
The water resources of Hebei, Shaanxi, Henan and other provinces have moderate constraints on the economy. The reasons are mainly divided into two categories: In Tibet, Guangxi, Henan and other large and medium-sized land areas, the capital stock growth rate is higher than 13.5%, and the labor growth rate is higher than 1.20%. The high-speed accumulated capital and increasing labor force have led to an increasing demand for water resources in these areas, which has led to a moderate constraint on water resources growth. Hainan and Hebei have developed coastal cities with a medium-speed growth. The growth rate of the labor force is remarkable, and the increasing demand for water resources by the labor force is also increasing. Therefore, the water resources in these areas have a moderate constraint on economic growth.
Water resources are strongly constrained in economically developed areas, such as Tianjin and Jiangsu, mainly because the region attracts a large amount of high-quality labor, resulting in an increase in the labor growth rate. At the same time, the demand for water resources in aquaculture and high-speed industries is increasing, so water resources have created strong constraints on the fast-growing economy of the region. There are two main reasons for the strong constraints on the economic growth of Anhui and Hubei. On the one hand, the fast-growing agriculture in these two provinces is heavily dependent on water resources. At the same time, these areas have a large area, but the available water resources are limited. Therefore, the per capita water resources are low, which leads to the drag effect of water resources on economic growth being higher than that in other provinces. On the other hand, the elasticity coefficient of water resources in these areas is greater than that in most provinces, that is, the contribution of water resources to economic growth is very high. In the case of low water resources, a high dependence on water resources has a strong constraint on economic growth.
4.3. Analysis of the Temporal Dimensions of the Drag Effect of Water Resources
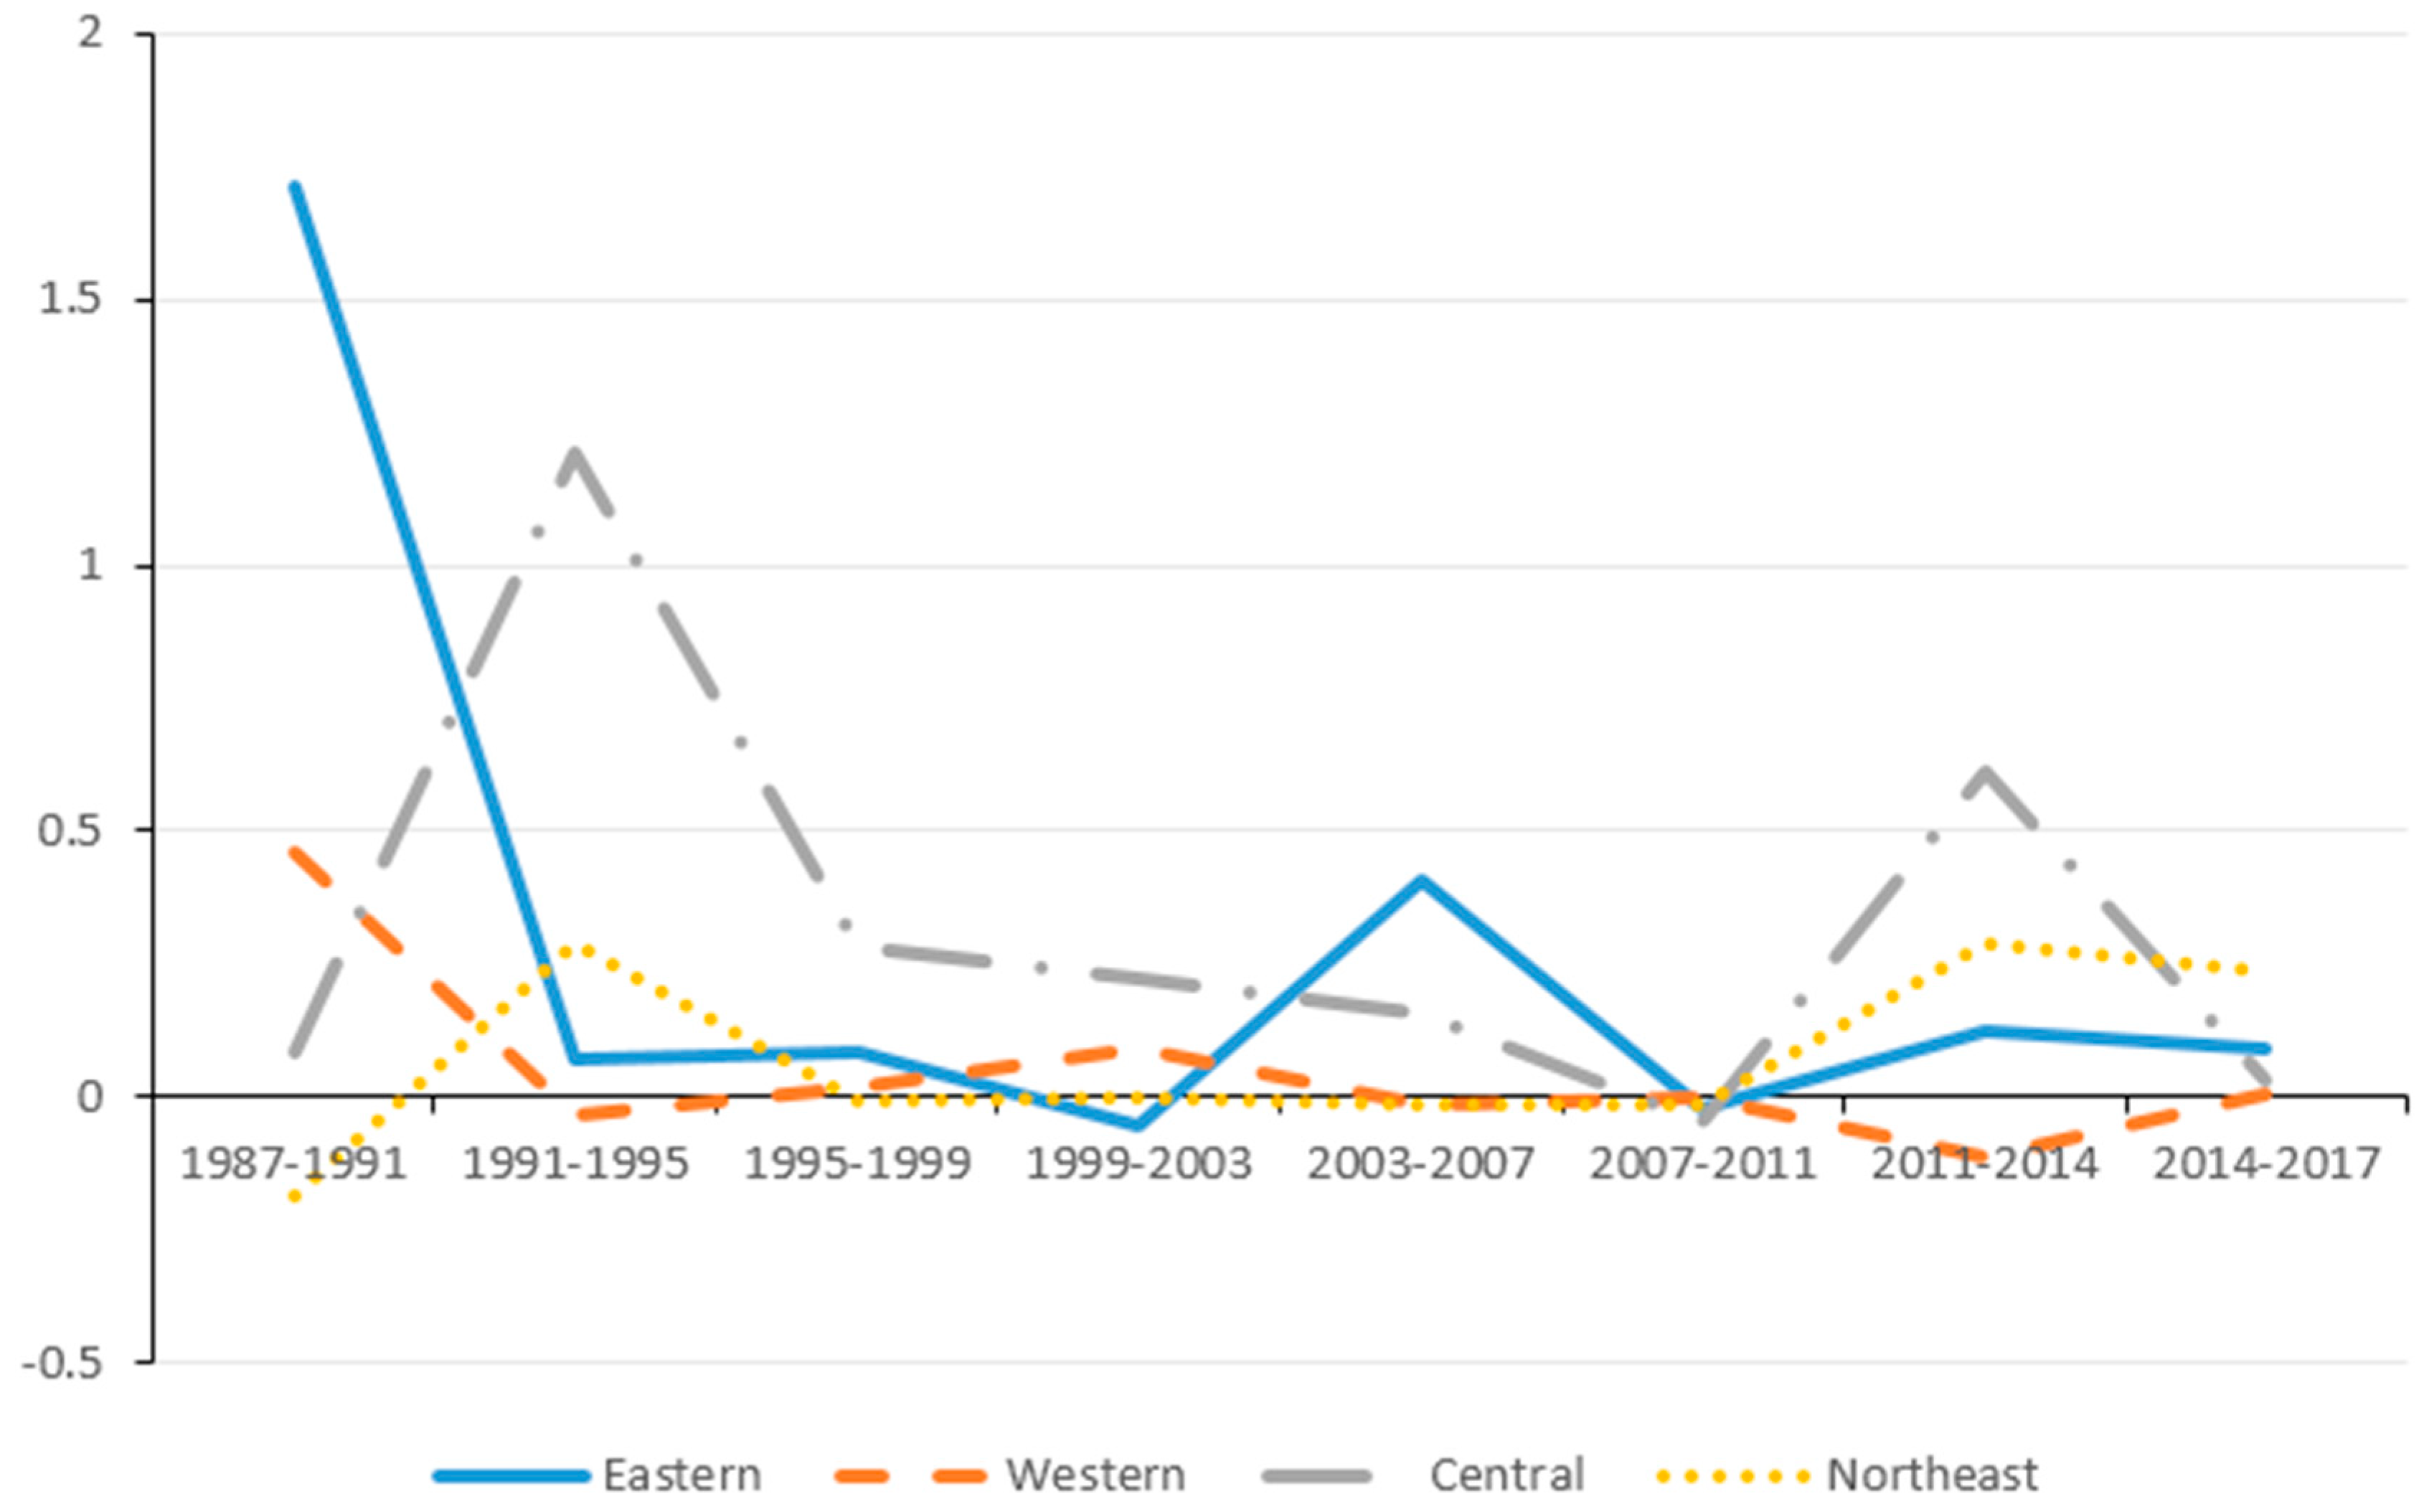
Economic growth is a dynamic process, and the impact of water resources on economic growth is also a dynamic process. In order to further study the impact degree and dynamic change process of water resources in regional economic growth, this paper uses the time variation method of the panel data to examine the changes of the drag effect of water resources on China’s eastern, western, central and northeastern regions from 1987–2017 (
Figure 4,
Table A3).
4.3.1. Analysis of the Drag Effect in the Eastern Region of China
From 1991 to 1999, the economic growth rate and the accumulation rate of fixed capital in the eastern region were the fastest in the past 30 years (averages of 16.81% and 15.04%, respectively). A large influx of labor and rapid capital accumulation caused the demand for resources to increase rapidly. The drag effect of water resources on economic growth became greater. During the period of 1999–2003, the strategy of developing the western region introduced water resources from the central and western regions into the eastern region, which alleviated the restrictions on water resource growth in the eastern region to some extent. Between 1987 and 2017, the economic growth in the eastern region consistently ranked first in the country. The water-end effect of economic growth in the region presents the dynamic characteristics of “obstruction–promotion–obstruction–promotion–obstruction” and gradually approaches a zero value, indicating that the dependence of economic growth on water resources in the eastern region is gradually decreasing. The slowdown in regional agricultural development is mainly related to the transformation of the economy by means of technological progress and capital accumulation. It shows that the economy of the eastern region is gradually entering a stage of sustainable development.
4.3.2. Analysis of the Drag Effect in the Western Region of China
Between 1987 and 2017, the trend of water resources in the western region on economic growth was “obstruction–promotion–obstruction–promotion–obstruction”. Since 2000, China has implemented the strategy of developing the western region. This policy has also accelerated the economic growth of the western region. At the same time, it has also attracted some labor backflow. The return of labor to drive production and living in the western region has increased the demand for water resources, further leading to water shortages. The water resources drag effect became larger. To achieve sustainable development in the western region, it is necessary to optimize the industrial structure, improve technical efficiency, promote the development of green agriculture, reduce the dependence of economic development on water resources, and gradually achieve sustainable economic development.
4.3.3. Analysis of the Drag Effect in the Central Region of China
Between 1987 and 2017, the drag effect of water resources in the central region was second only to that of the eastern region. The main reasons are as follows: First, the labor growth rate in the central region has been declining year-by-year, and the situation of labor loss in the eastern region is more serious. The demand for water resources is reduced. Second, the growth rate of capital stock is “growth-decrease-growth-decrease”, which is basically consistent with the law of economic growth, indicating that economic growth in the central region is mainly related to the accumulation of capital. Third, the growth rate of water consumption in the central region of each period is greater than that of other regions, that is, its economic growth relies heavily on water resources. Fourth, water resources have always imposed constraints on economic growth in the central region and particularly in Henan and Hunan. The agricultural development of Shanxi and other provinces is mainly dependent on water resources. Therefore, water resources have a continuous drag effect on the economic growth of the central region. In response to this problem, the central region should promote water-saving irrigation technology, improve the efficiency of agricultural technology, and reduce the constraints of water resources on economic growth.
4.3.4. Analysis of the Drag Effect in the Northeast Region of China
Between 1987 and 2017, the drag effect of water resources in Northeast China gradually increased. The main reasons are as follows: First, it is related to the industrial layout of the Northeast. From 1987 to 2007, the exploitation of oil fields and coal mines in the three provinces constituted the main economic growth initiatives. Since 2010, the state has gradually controlled the development of small coal mines in the northeast region, banned some small coal mines, transformed the industry in the northeast region, and rapidly developed ice and snow tourism. Therefore, the drag effect of water resources on economic growth in Northeast China during 2012–2017 declined. Second, after 2000, the labor force increased year-by-year, and capital stock was rapidly accumulated. The demand for water resources for living production in Northeast China has been increasing, making the consumption rate of water resources significantly higher than that in other regions, further leading to water resource constraints in the northeast region. The dependence is much higher than that in other regions.


