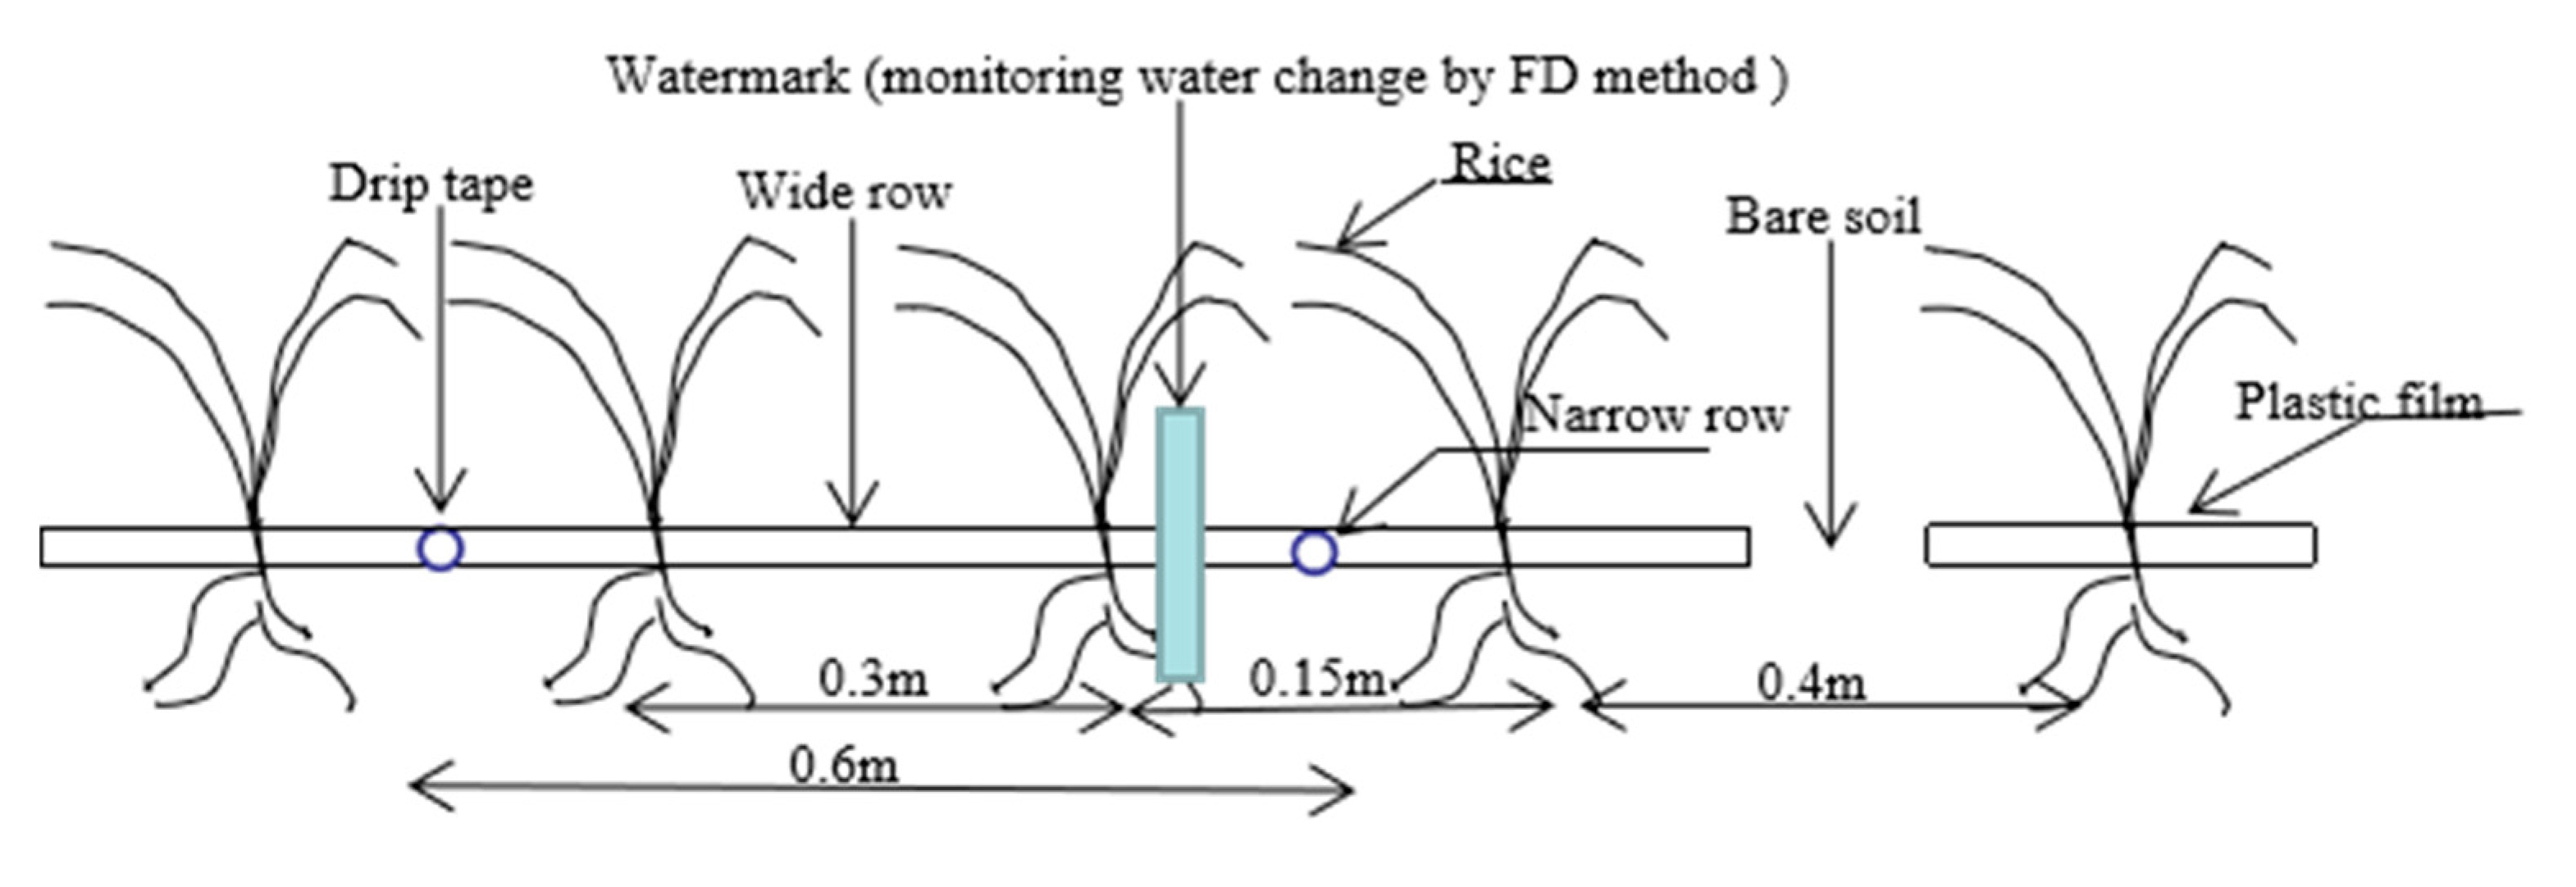
Figure 1.
Rice planting pattern with drip irrigation and plastic film mulching.
Figure 1.
Rice planting pattern with drip irrigation and plastic film mulching.
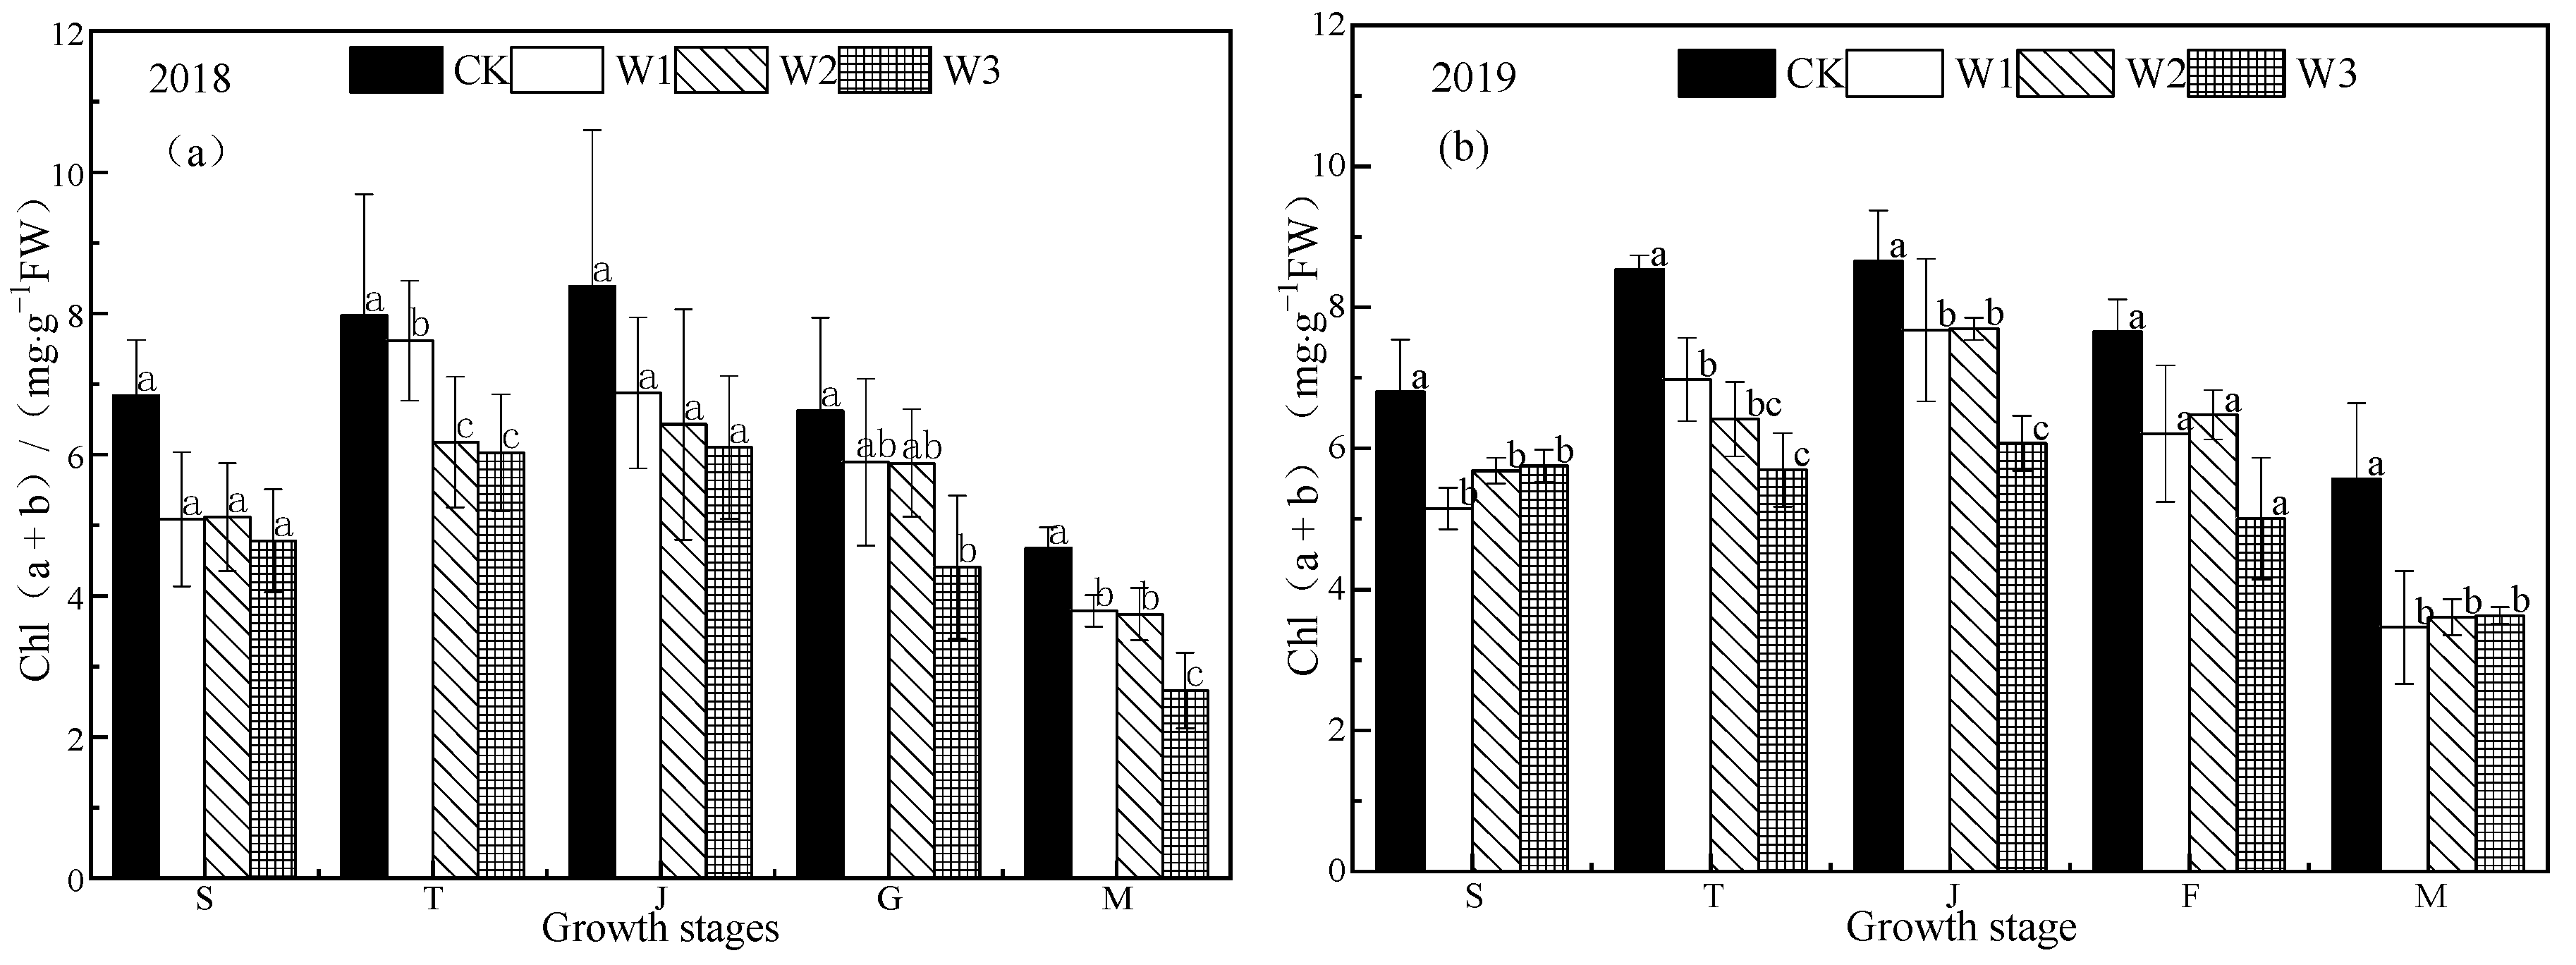
Figure 2.
Changes in chlorophyll content in rice under water stress in (a) 2018 and (b) 2019. CK: flooding treatment, W1: Irrigation limit 0.65–1.00 θs, W2: Irrigation limit 0.75–1.00 θs, and W3: Irrigation limit 0.85–1.00 θs. S, T, J, F, and M represent the seedling, tillering, jointing, grouting, and mature stages, respectively. The data are the mean ± standard error. Different letters indicate significant differences between treatments p < 0.05.
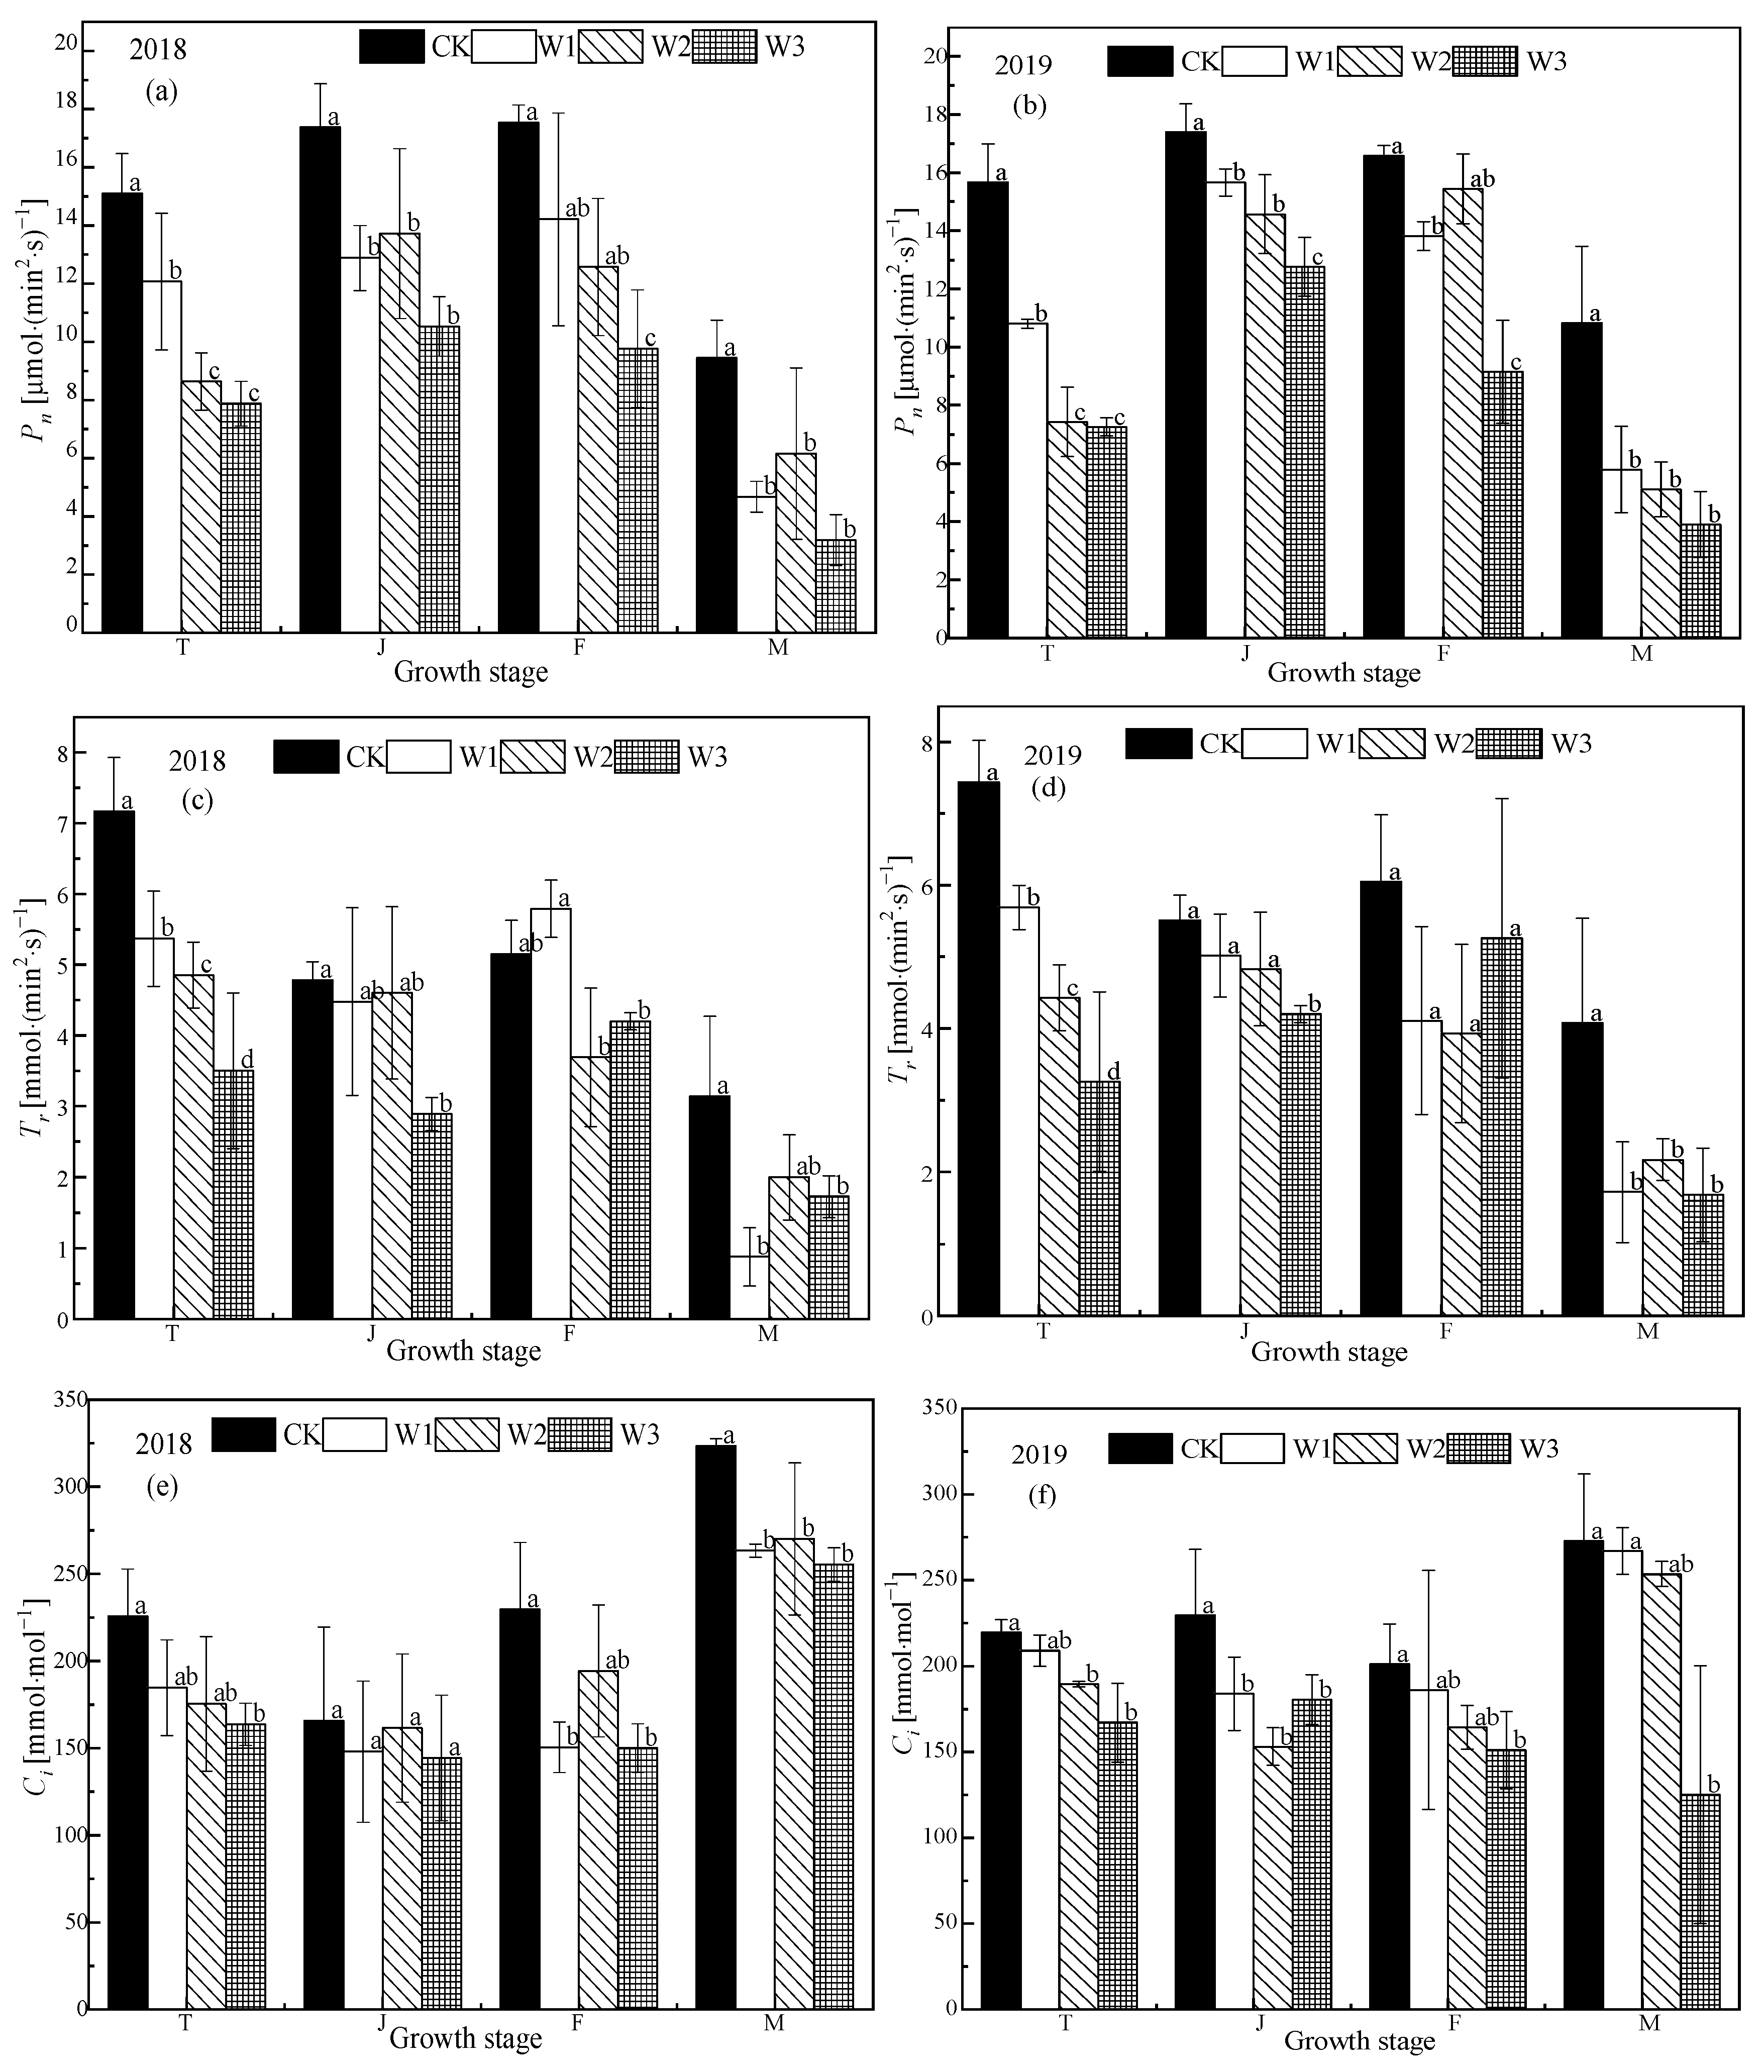
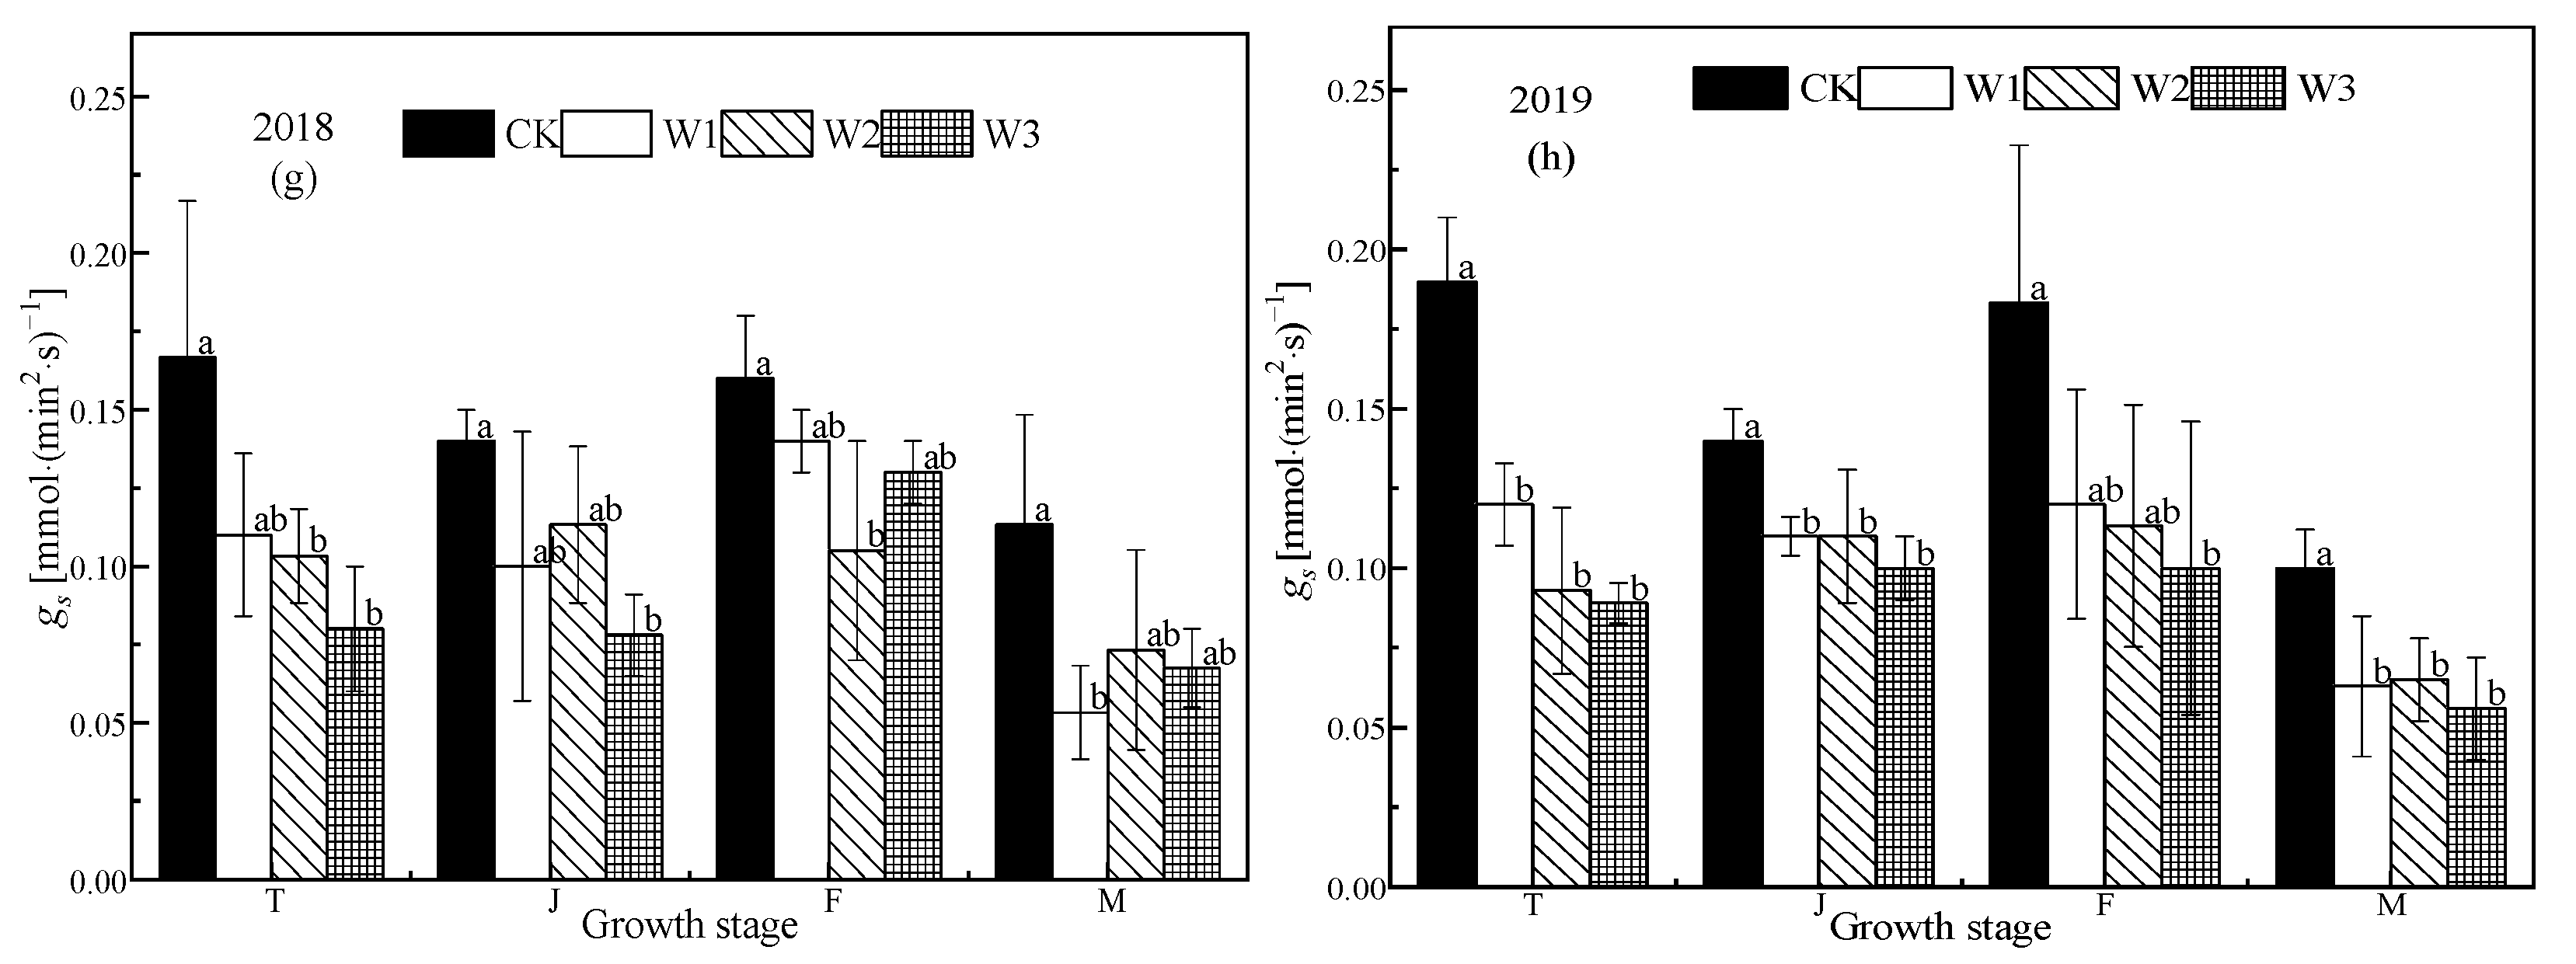
Figure 3.
Photosynthetic characteristics of rice under different water treatment conditions. The (a), (c), (e), and (g) represent the Pn, Tr, Ci, and gs respectively in 2018. (b), (d), (f), and (h) represent the Pn, Tr, Ci, and gs, respectively, in 2019. T, J, F, and M represent the tillering, jointing, grouting, and mature stages, respectively. CK: flooding treatment, W1: Irrigation limit 0.85–1.00 θs, W2: Irrigation limit 0.75–1.00 θs, and W3: Irrigation limit 0.65–1.00 θs. The data are the mean ± the standard error. Different letters indicate significant differences between treatments (p < 0.05).
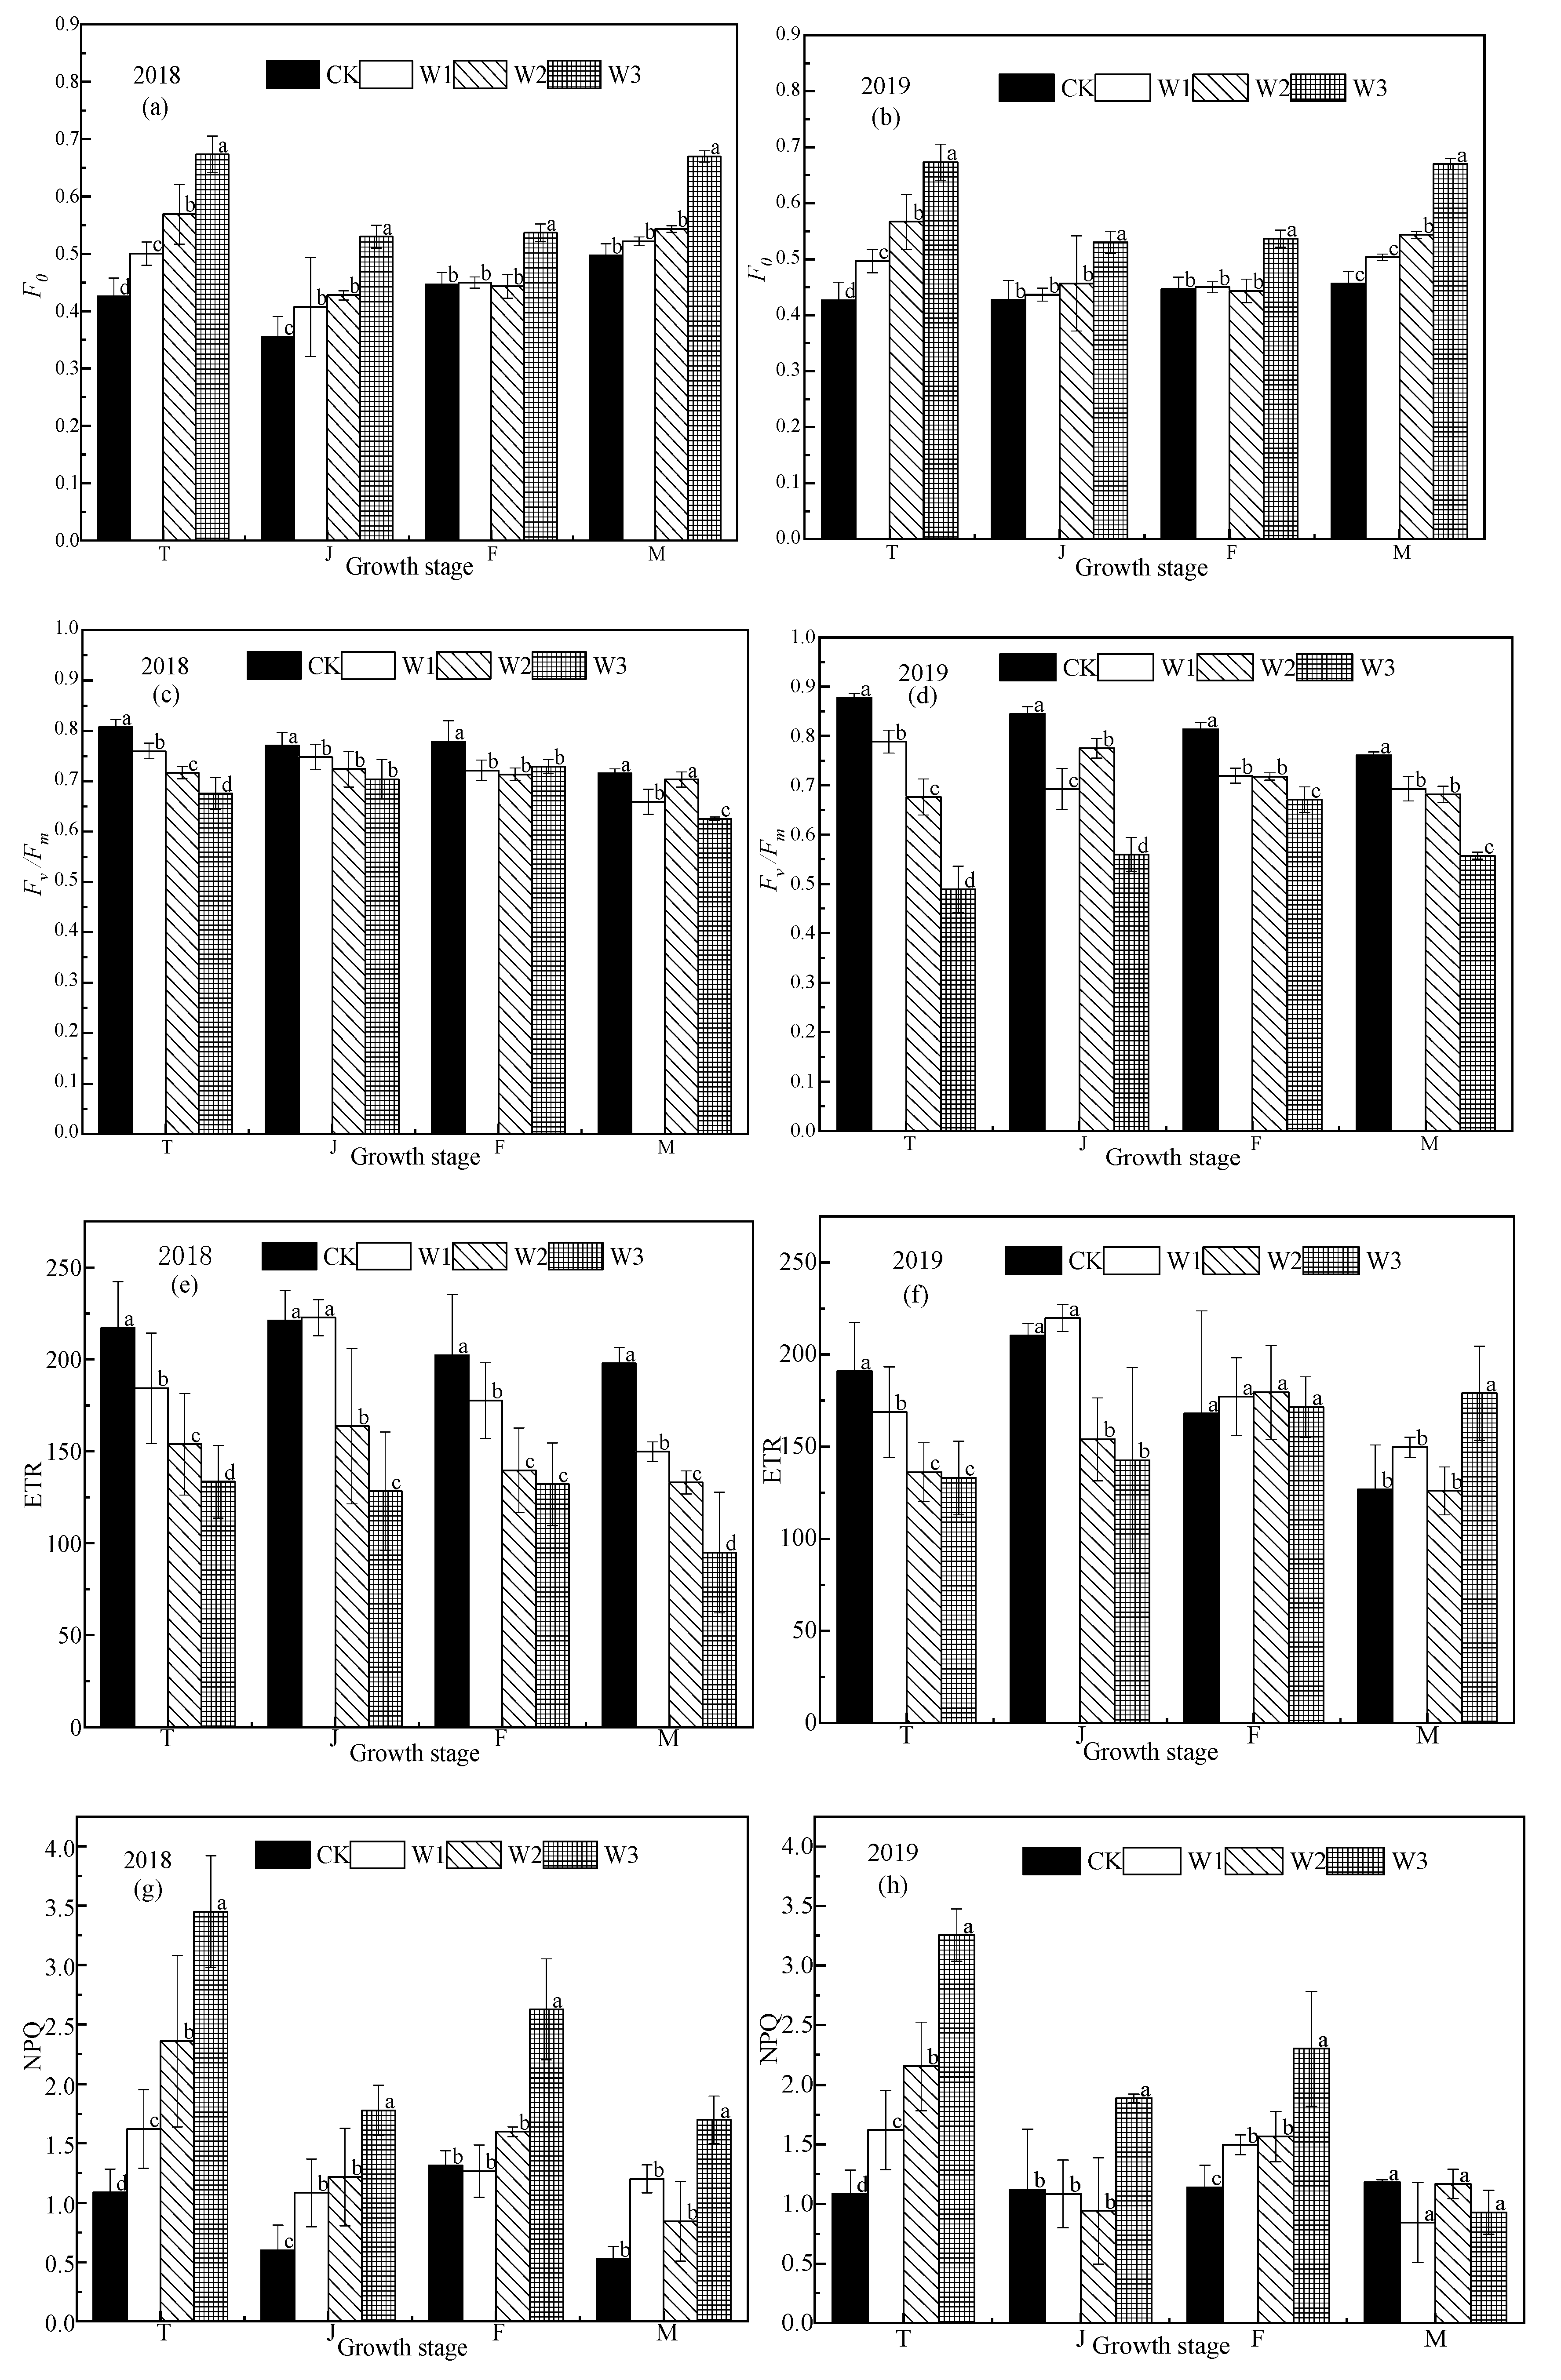
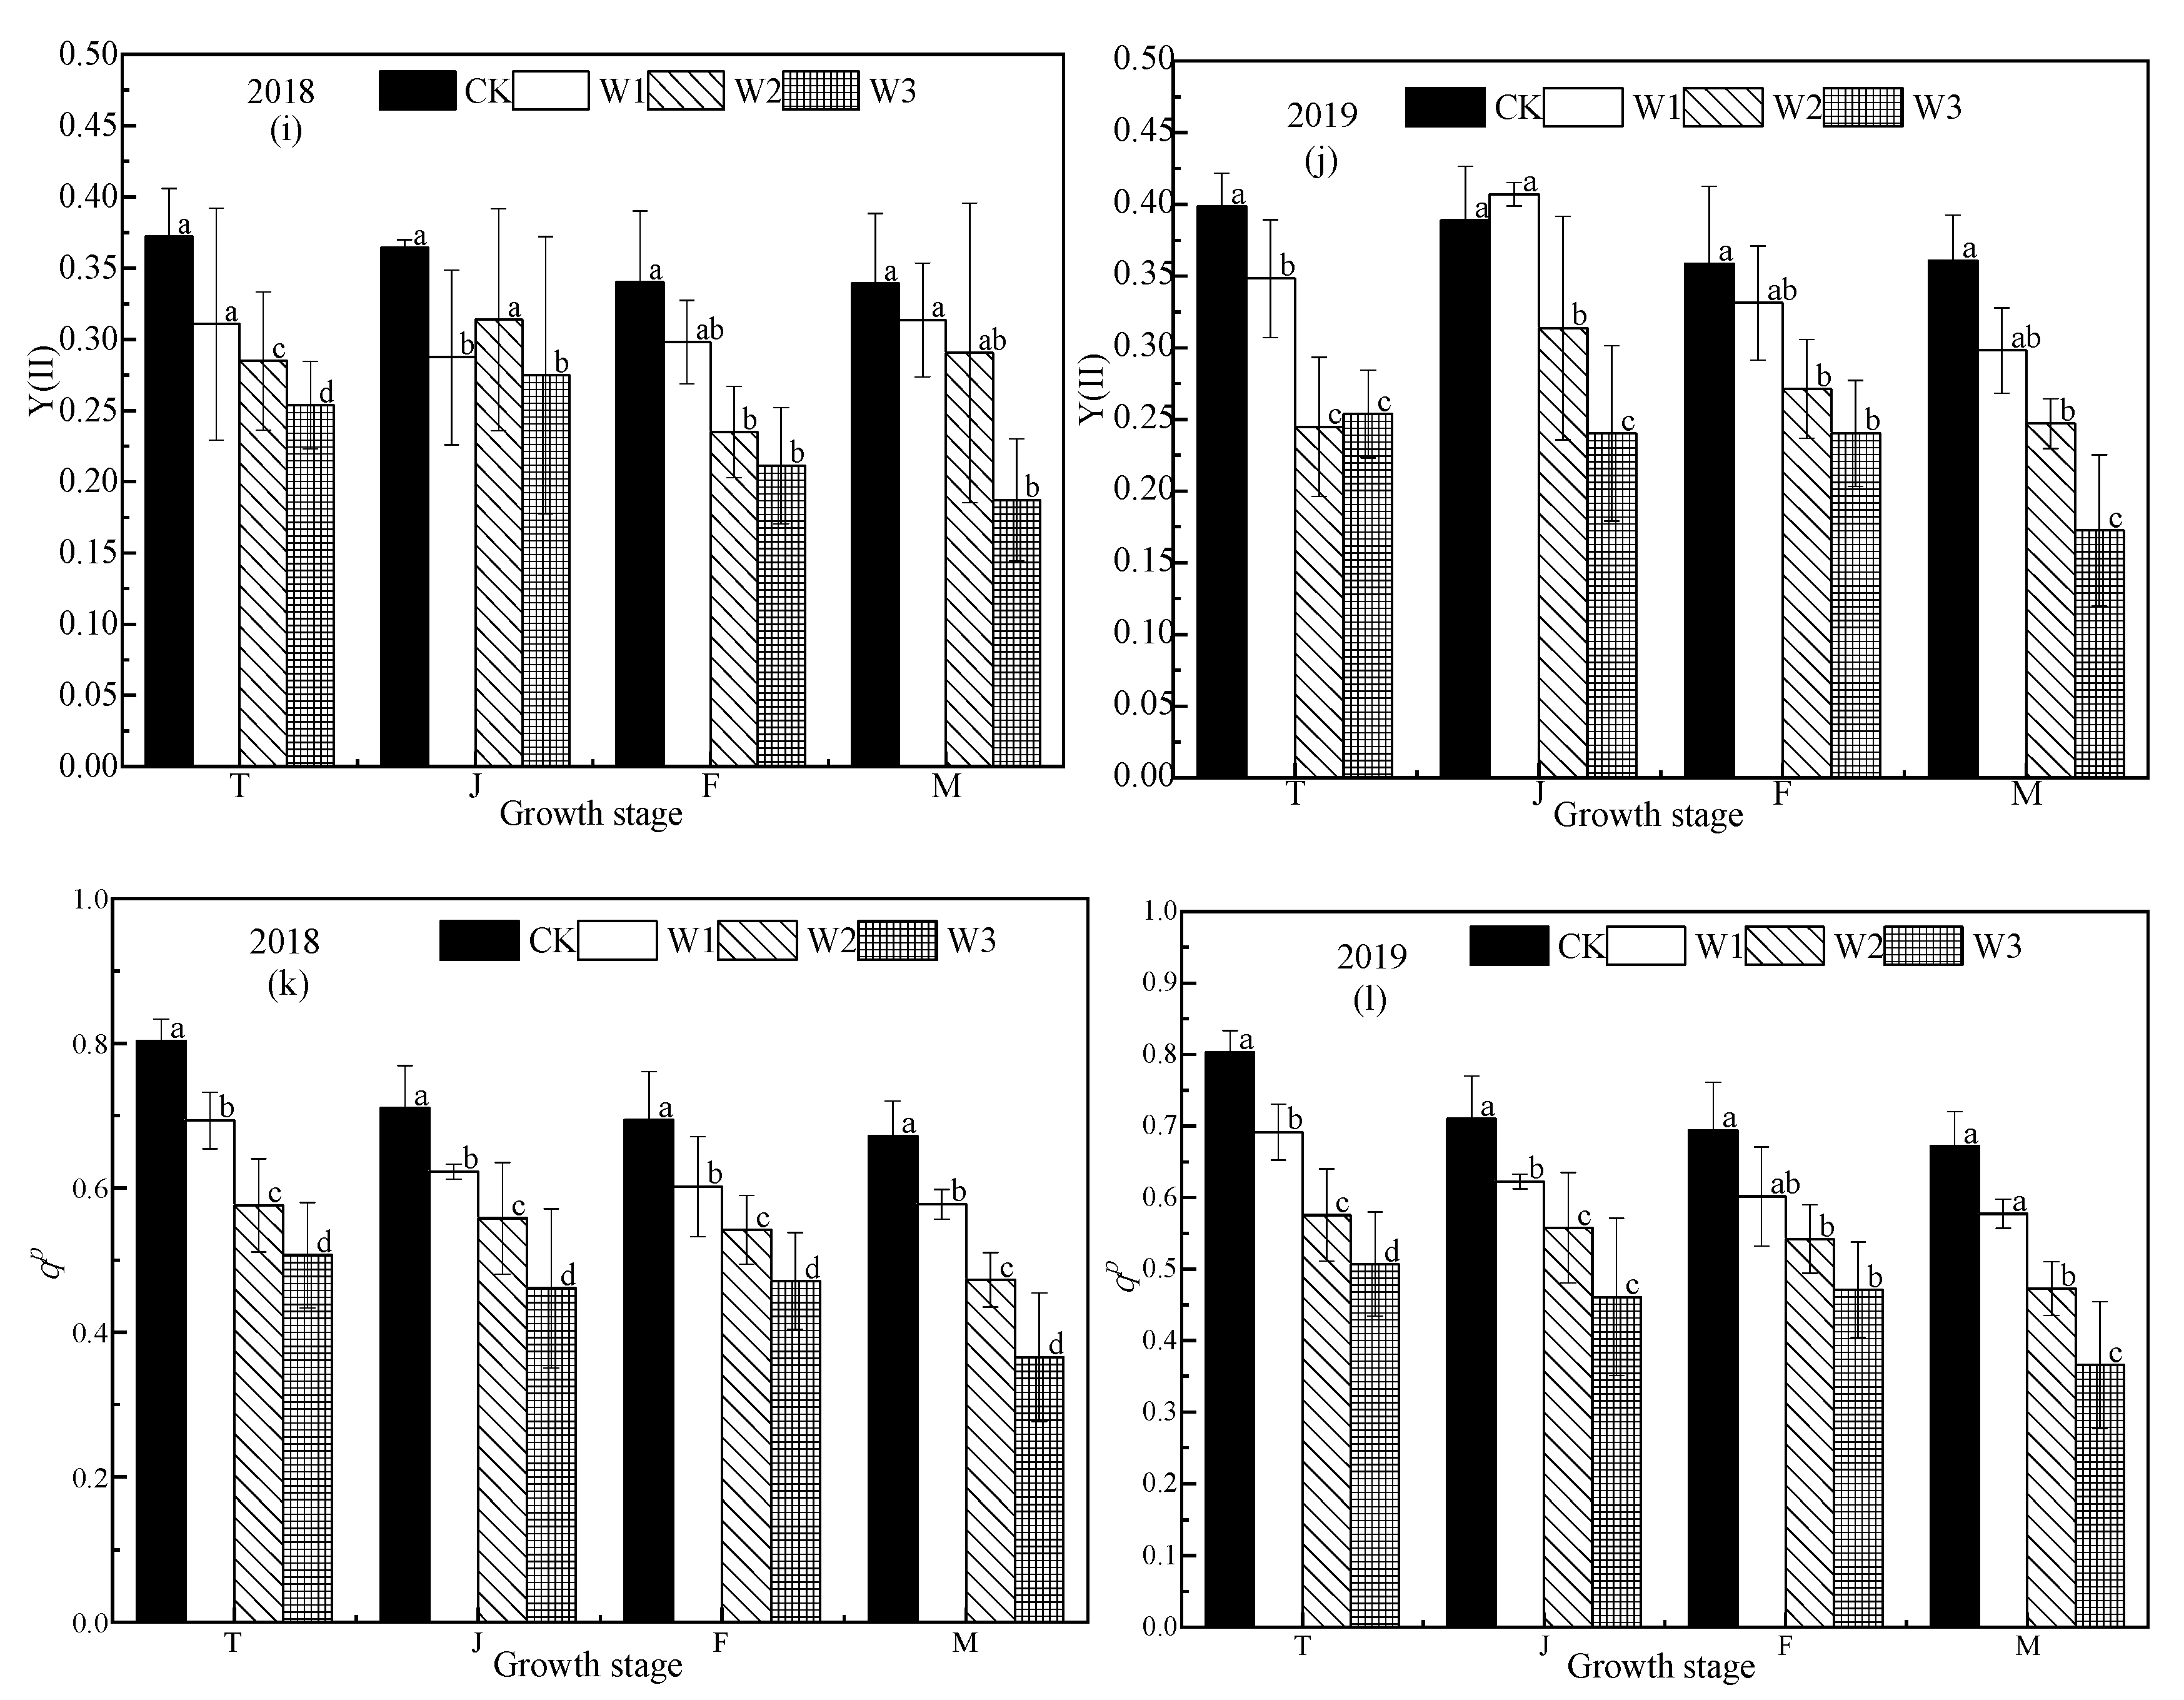
Figure 4.
Fluorescence parameters of rice under different water conditions. The (a), (c), (e), (g), (i), and (k) represent the F0, Fv/Fm, ETR, NPQ, Y(II), and qp, respectively, in 2018. (b), (d), (f), (h), (j), and (l) represent the F0, Fv/Fm, ETR, NPQ, Y(II), and qp, respectively, in 2019. T, J, F, and M represent the tillering, jointing, grouting, and mature stages, respectively. CK: flooding treatment, W1: Irrigation limit 0.85–1.00 θs, W2: Irrigation limit 0.75–1.00 θs, and W3: Irrigation limit 0.65–1.00 θs. The data are the mean ± the standard error. Different letters indicate significant differences between treatments (p < 0.05).
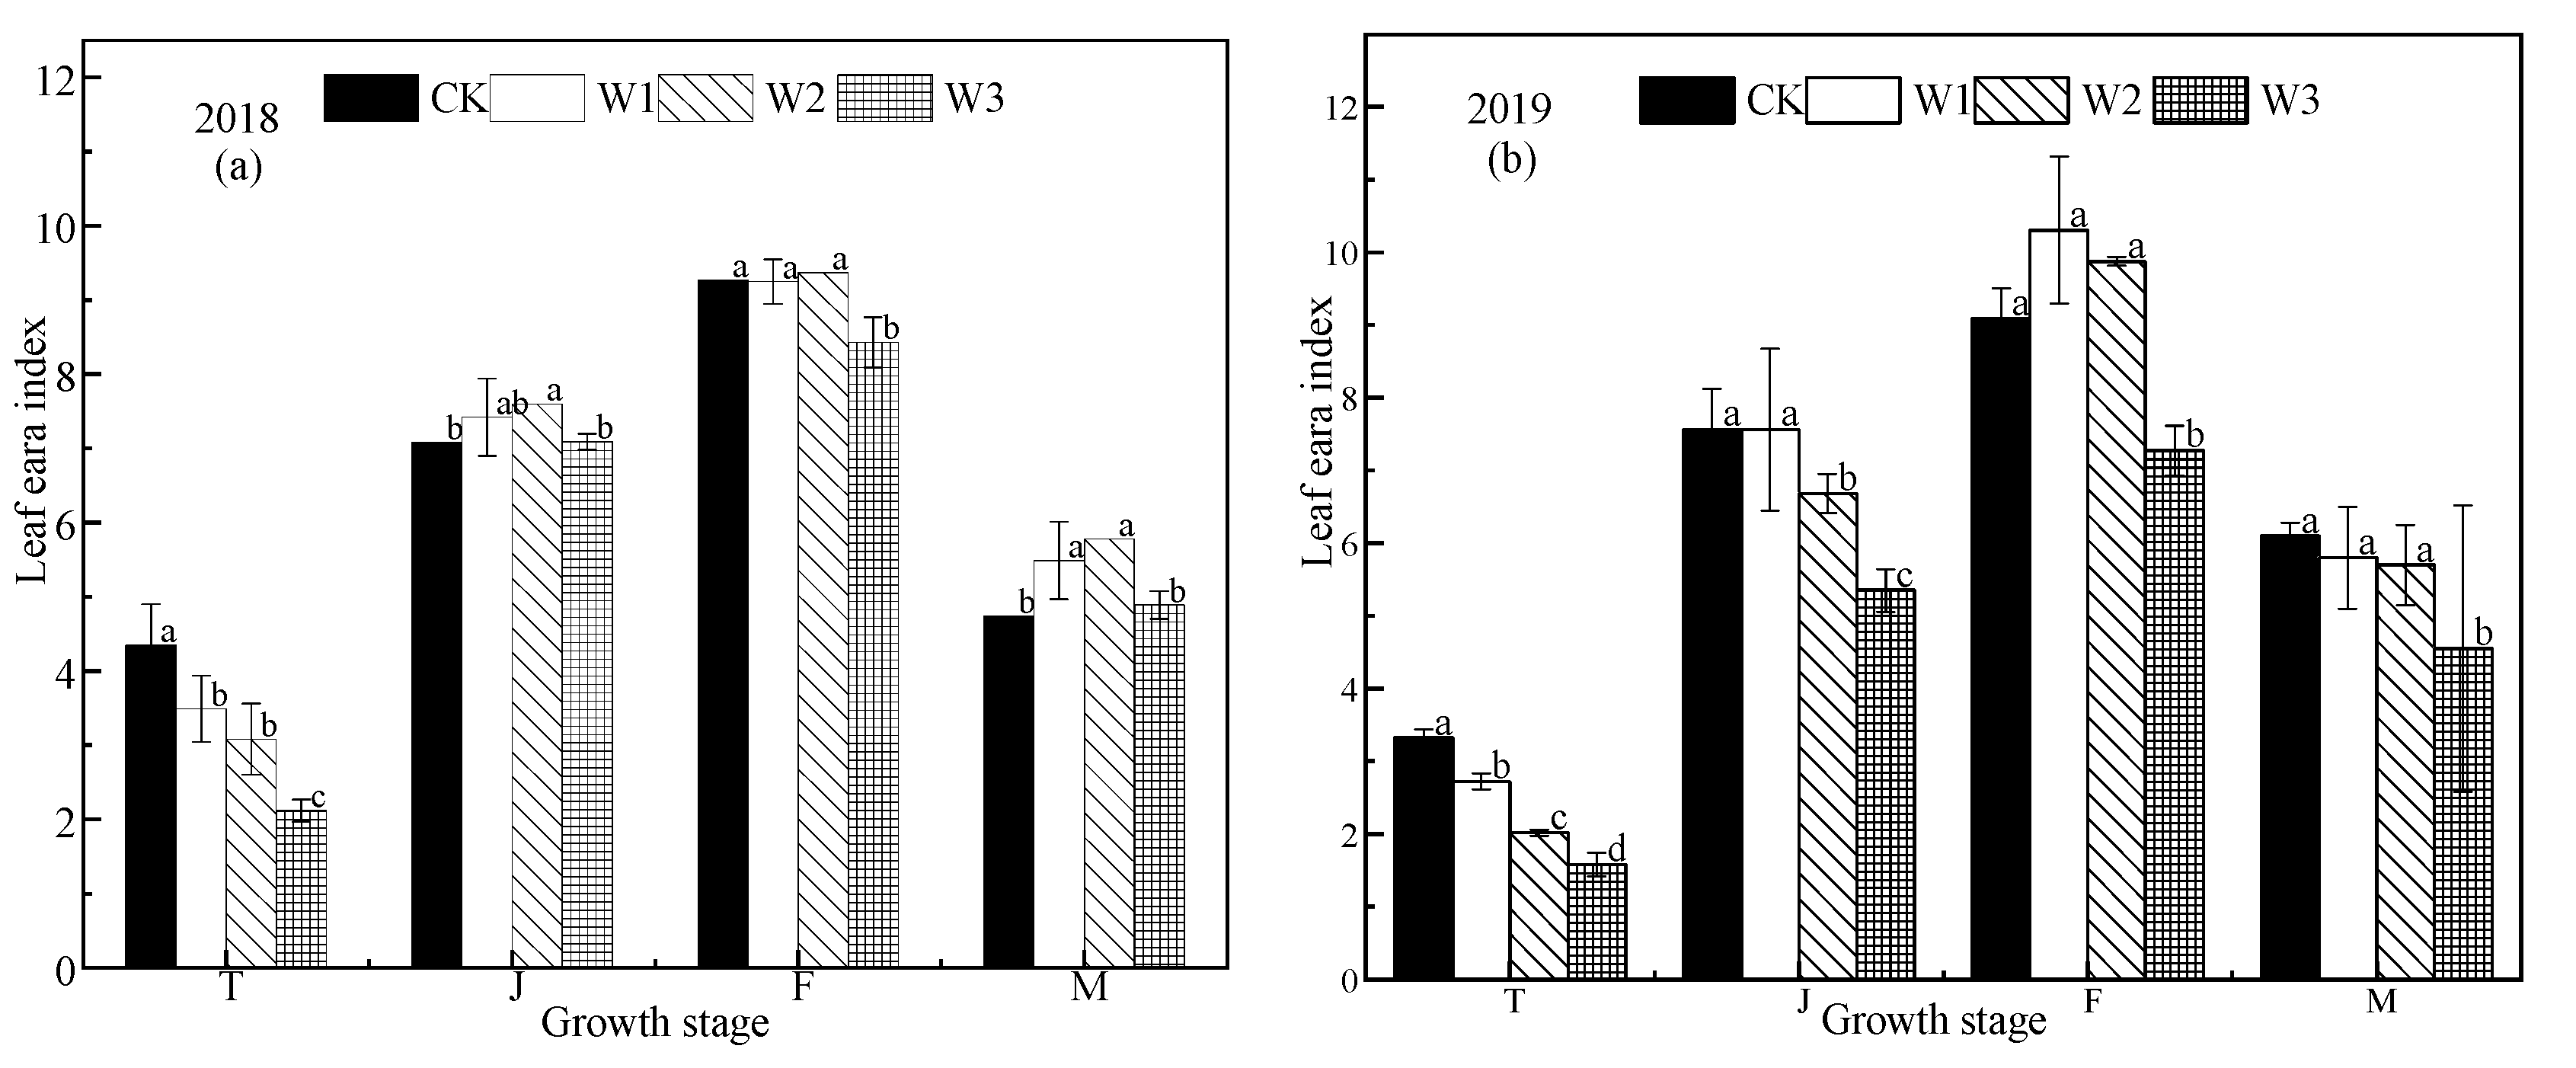
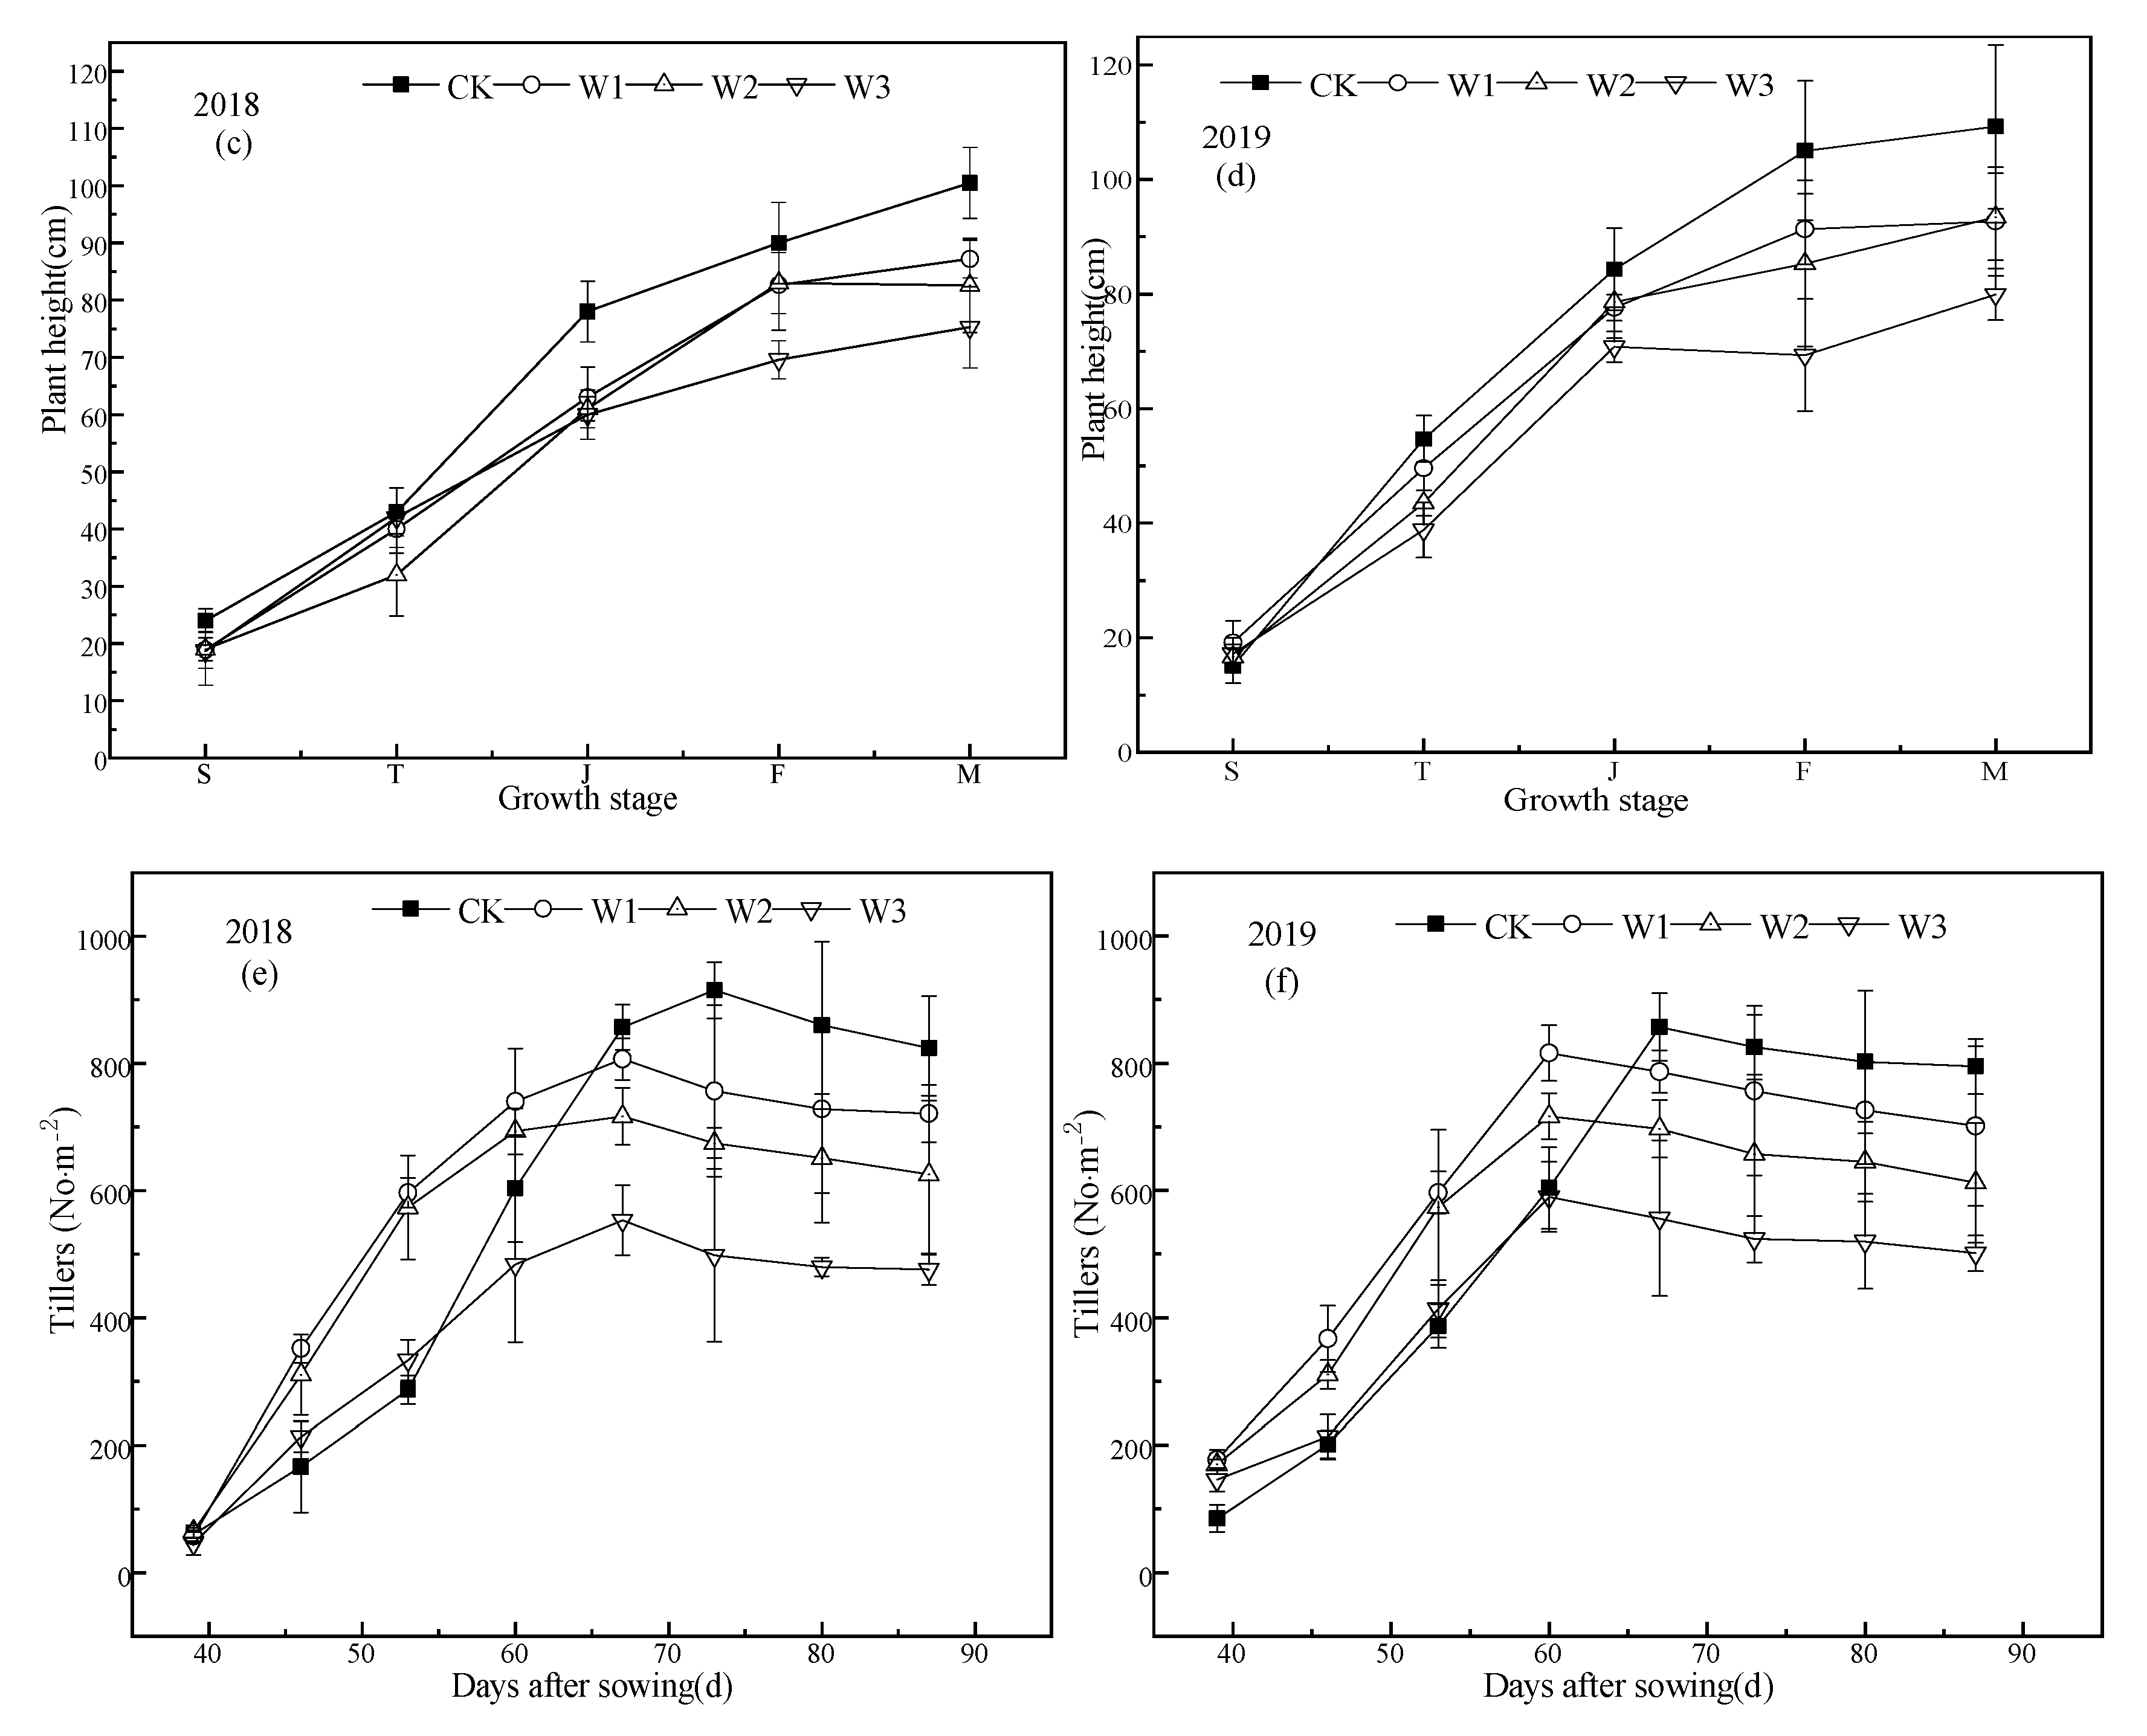
Figure 5.
Effect of different water conditions on rice growth. The (a), (c), (e) represent the leaf area index (LAI), plant height, and number of tillers per unit area respectively in 2018. (b), (d), (f) represent the the leaf area index, plant height, and number of tillers per unit area respectively in 2019. T, J, F, and M represent the tillering, jointing, grouting, and mature stages, respectively. CK: flooding treatment, W1: Irrigation limit 0.85–1.00 θs, W2: Irrigation limit 0.75–1.00 θs, and W3: Irrigation limit 0.65–1.00 θs. The data are the mean ± the standard error. Different letters indicate significant differences between treatments (p < 0.05).
Table 1.
Soil nutrition at the experimental site.
Table 1.
Soil nutrition at the experimental site.
| Year | Total Nitrogen (g kg−1) | Total Phosphorus (g kg−1) | Total Potassium (g kg−1) | Organic Matter (g kg−1) | Available Nitrogen (mg kg−1) | Available Phosphorus (mg kg−1) | Available Potassium (mg kg−1) |
|---|
| 2018 | 1.46 | 1.23 | 14.24 | 11.89 | 67.71 | 22.36 | 521.00 |
| 2019 | 1.05 | 0.93 | 24.17 | 15.69 | 57.70 | 21.80 | 424.00 |
Table 2.
Field water control standards for different irrigation treatments where θs represents field water capacity.
Table 2.
Field water control standards for different irrigation treatments where θs represents field water capacity.
| Treatment | Irrigation Limit | Seedling Stage | Tilling Stage | Jointing Stage | Filling Stage | Maturity Stage |
|---|
| W1 | Irrigation lower limit(θs) | 0.90 | 0.85 | 0.90 | 0.90 | 0.90 |
| Irrigation upper limit(θs) | 1.00 | 1.00 | 1.00 | 1.00 | 1.00 |
| W2 | Irrigation lower limit(θs) | 0.90 | 0.75 | 0.90 | 0.90 | 0.90 |
| Irrigation upper limit(θs) | 1.00 | 1.00 | 1.00 | 1.00 | 1.00 |
| W3 | Irrigation lower limit(θs) | 0.90 | 0.65 | 0.9 | 0.90 | 0.90 |
| Irrigation upper limit(θs) | 1.00 | 1.00 | 1.00 | 1.00 | 1.00 |
| CK | Irrigation lower limit(cm) | 0 | 5 | 5 | 5 | 0 |
| Irrigation upper limit(cm) | 5 | 10 | 10 | 10 | 5 |
Table 3.
Correlation matrix between the chlorophyll index and photosynthetic parameters of drip irrigation rice where * indicates significance at p < 0.05 and ** indicates significance at p < 0.01, sample size (N = 24). The maize transpiration rate (Tr), photosynthetic rate (Pn), stomatal conductance (gs), intercellular CO2 concentration (Ci), chlorophyll content (Chl (a + b)).
| Parameter | Pn | gs | Ci | Tr | Chl (a + b) |
|---|
| Pn | 1.00 | 0.89 * | –0.46 | 0.93 ** | 0.94 ** |
| gs | | 1.00 | –0.67 | 0.98 ** | 0.75 |
| Ci | | | 1.00 | –0.65 | 0.24 |
| Tr | | | | 1.00 | 0.84 * |
| Chl (a + b) | | | | | 1.00 |
Table 4.
Correlation matrix between chlorophyll fluorescence parameters and photosynthesis of drip irrigated rice where * indicates significance at p < 0.05 and ** indicates significance at p < 0.01, sample size (N = 24). maximum fluorescence yield (Fm), initial leaf fluorescence yield (F0), fluorescence yield (F’), maximum fluorescence yield (F’m) was measured under light adaptation; the maximum photochemical efficiency (Fv/Fm), PSII potential activity (Fv/F0), Conversion efficiency of PS IIopen reaction center(F’v/F’m), photochemical quenching coefficient (qp), non-photochemical quenching coefficient (NPQ), actual photochemical efficiency (Y(II)).
| Parameter | Pn | F0 | Fm | Fv/Fm | Fv/F0 | F’v/F’m | qp | NPQ | Y(II) |
|---|
| Pn | 1.00 | −0.79 | 0.90 * | 0.88 * | 0.84 * | 0.79 | 0.94 ** | 0.95 ** | 0.89 * |
| F0 | | 1.00 | −0.79 | −0.67 | −0.83 * | −0.96 * | −0.76 | −0.75 | −0.78 |
| Fm | | | 1.00 | 0.87 * | 0.83 * | 0.87 * | 0.82 * | 0.97 ** | 0.99 ** |
| Fv/Fm | | | | 1.00 | 0.87 * | 0.72 | 0.68 | 0.92 ** | −0.85 * |
| Fv/F0 | | | | | 1.00 | 0.81 | 0.77 | 0.79 | −0.82 * |
| F’v/F’m | | | | | | 1.00 | 0.89 * | 0.84 * | −0.87 * |
| qp | | | | | | | 1.00 | 0.77 | −0.82 * |
| NPQ | | | | | | | | 1.00 | −0.96 ** |
| Y(II) | | | | | | | | | 1.00 |
Table 5.
Yield and yield components of rice under different water treatments. Different letter in the same column indicate significant differences at p < 0.05.
Table 5.
Yield and yield components of rice under different water treatments. Different letter in the same column indicate significant differences at p < 0.05.
| Years | Treatment | Effective Panicles (No m−2) | Spikelets Per Panicle | Earing Rate (%) | Seed Setting Rate (%) | Grain Weight(g) | Grain Yield (kg ha−1) | Water Consumption (m3 ha−1) | Water-Use Efficiency (kg m−3) |
|---|
| 2018 | CK | 629.84 a | 148.65 a | 68.83 c | 87.43 b | 27.01 a | 8563.35 a | 34,415.22 a | 0.25 c |
| W1 | 590.56 b | 145.36 ab | 73.21 b | 85.31 a | 25.26 b | 6426.23 b | 16,223.93 b | 0.40 a |
| W2 | 565.30 c | 157.52 a | 78.95 b | 80.26 b | 25.47 b | 6498.69 b | 15,241.19 c | 0.43 a |
| W3 | 362.22 d | 134.22 b | 65.55 a | 78.67 b | 23.56 c | 4932.12 c | 14,185.78 d | 0.35 b |
| 2019 | CK | 649.90 a | 156.35 a | 75.82 a | 79.55 a | 25.97 a | 8393.36 a | 33,126.79 a | 0.25 c |
| W1 | 579.25 b | 166.23 a | 73.66 a | 80.54 a | 24.75 b | 6536.55 b | 16,003.23 b | 0.41 a |
| W2 | 545.60 c | 140.41 b | 76.12 a | 83.25 a | 24.10 b | 6388.19 b | 14,987.46 c | 0.43 a |
| W3 | 404.41 d | 142.43 b | 68.47 b | 81.45 a | 23.82 b | 5339.55 c | 13,887.90 d | 0.38 b |
Table 6.
Correlation matrix between yield components and water consumption of drip irrigated rice where * indicates significant correlation at p < 0.05 and ** indicates significant correlation at p < 0.01, sample size (N = 24).
Table 6.
Correlation matrix between yield components and water consumption of drip irrigated rice where * indicates significant correlation at p < 0.05 and ** indicates significant correlation at p < 0.01, sample size (N = 24).
| Parameter | Grain Yield | Effective Panicles | Spikelets per Panicle | Earing Rate | Seed Setting Rate | 1000-Grain Weight | Water Consumption |
|---|
| Grain yield | 1 | 0.90 ** | 0.42 | 0.34 | 0.71 * | 0.92 ** | 0.92 ** |
| Effective panicles | | 1 | 0.61 | 0.63 | 0.57 | 0.84 ** | 0.85 ** |
| Spikelets per panicle | | | 1 | 0.62 | −0.04 | 0.42 | 0.19 |
| Earing rate | | | | 1 | 0.02 | 0.28 | −0.01 |
| Seed setting rate | | | | | 1 | 0.63 | 0.72 * |
| 1000-grain weight | | | | | | 1 | 0.84 ** |
| Water consumption | | | | | | | 1 |


