Article

Investigating an Innovative Sea-Based Strategy to Mitigate Coastal City Flood Disasters and Its Feasibility Study for Brisbane, Australia

1
School of Civil, Mining and Environmental Engineering, University of Wollongong, Wollongong, NSW 2522, Australia
2
School of Mechanical, Materials, Mechatronic and Biomedical Engineering, University of Wollongong, Wollongong, NSW 2522, Australia
3
School of Architecture and Design, University of Engineering and Technology Lahore, Lahore 54890, Pakistan
*
Author to whom correspondence should be addressed.
Water 2020, 12(10), 2744; https://doi.org/10.3390/w12102744
Submission received: 16 September 2020 / Revised: 27 September 2020 / Accepted: 28 September 2020 / Published: 30 September 2020
(This article belongs to the Special Issue Hydrodynamics in Estuaries and Coast: Analysis and Modeling)

Abstract

:
This study examines an innovative Coastal Reservoir (CR) technique as a feasible solution for flood adaptation and mitigation in the Brisbane River Estuary (BRE), Australia, which is vulnerable to coastal flooding. The study analysed the operation of a CR by using the MIKE 21 hydrodynamic modelling package. The 2D hydrodynamic model was calibrated and validated for the 2013 and 2011 flood events respectively, with a Nash-Sutcliffe coefficient (Ens) between 0.87 to 0.97 at all gauges. River right branch widening and dredging produced a 0.16 m reduction in water level at the Brisbane city gauge. The results show that by suitable gate operation of CR, the 2011 flood normal observed level of 4.46 m, with reference to the Australian Height Datum (AHD) at Brisbane city, could have been reduced to 3.88 m AHD, while under the improved management operation of the Wivenhoe Dam, the flood level could be lowered to 4 m AHD at Brisbane city, which could have been reduced with CR to 2.87 m AHD with an overall water level reduction below the maximum flood level. The results demonstrated that the innovative use of a CR could considerably decrease the overall flood peak and lessen flood severity in the coastal city of Brisbane.

1. Introduction

Worldwide many people are presently exposed to the effects of coastal floods [1]. Coastal flooding is likely to become more common globally in the future [2] due to runoff generated by significant rainfall events [3,4], raised ocean levels, or a combination of both, and other aspects such as urban development, increase in population and land subsidence [5,6], which are causing a substantial risk to life in coastal areas [7,8]. Furthermore, economic losses and fatalities due to floods have substantially increased globally over recent decades [9,10,11,12,13,14] and it is anticipated that the global cost of flood damages will hit USD one trillion in 2050 [15]. For example, Thailand experienced its worst flooding in 2011, when more than 800 people lost their lives and an economic loss of at least USD45 billion was caused [16]. In Australia, more than 85% of the population lives in coastal regions. In South East Queensland (SEQ), the 2011 flood affected more than 2.5 million people and around 29,000 homes in the Brisbane River Valley [17,18]. The flooding led to 35 deaths and AUD 2.55 billion economic loss [19]. Analysis and adaptation of future flooding risks are essential for coastal planning and management [20]. Therefore, coastal cities need to mitigate probable damage caused by coastal inundation for sustainable living [21].
Many studies have analysed coastal flood mitigation. Dams that are used for flood mitigation in the upper reaches of rivers, e.g., Three Gorges Dam, China [22], Wivenhoe Dam, Australia [19] and Hoover Dam, United States of America [23], can significantly reduce downstream flooding [24]. However, these dams cannot regulate flooding generated in the downstream catchment. For instance, Three Gorges Dam regulates only 56% of the catchment of the Yangtze River [24]. The downstream river basins have a greater population mass and infrastructure so that any flood can lead to enormous damage. Sadler, et al. [2] studied Norfolk, Virginia, a USA coastal city that is exposed to flooding, and proposed that the installation of a tide gate and the use of actuators operated by real-time data sensors could considerably reduce overall flood volumes in coastal cities. Syme, et al. [17] studied Brisbane, Australia, and proposed structural works such as flood mitigation dams, floodgates, levees, detention basins, and temporary barriers, to mitigate risk by modifying the behaviour of floodwater to be less hazardous. Ralston, et al. [25] studied the Hudson River in New York, USA for flood reduction and found that channel deepening in the estuary led to a decrease in friction, which decreased the tidally averaged water level during discharge events and reduced the whole threat of extreme water levels in the upper tidal river. Athanasopoulou [26] studied commonly used flood measures like surge barriers, storage, diversion, conveyance, rainfall interception, and pumping to make Hoboken and Jersey City (New Jersey, USA) more resilient to flooding. Zheng, et al. [27], Hawkes and Svensson [28], and Svensson and Jones [29] concluded that storm surge and extreme rainfall processes are statistically dependent and were in the joint probability zone, the dependence between the ocean and riverine processes has a possible influence on the flood level, and as a result, the tidally influenced part of a river is likely to reach upstream due to effects of sea-level rise. Therefore, if the sea level is lower, or tidal influence is controlled, then flood levels in the river will be reduced and the point of confluence between river and sea will be drawn downstream which will help in the amelioration of flooding.
The existing studies have mainly considered dams on the upstream catchments, channel deepening and tidal gates or barriers for flood adaptation. However, these measures do not suffice for flood adaptation in the coastal city of Brisbane. For instance, the Brisbane River upper catchment has two large dams, Wivenhoe and Somerset [30], however, Brisbane city which is on the river delta, was flooded three times in the recent past (viz. 1974, 2011 and 2013). Floodwater originating from the downstream catchment area of the Brisbane River cannot be controlled by upstream dams and has caused flooding in cities like Brisbane and Ipswich situated downstream of the dams. For instance, during the 2011 floods in Queensland, when flooding occurred in the downstream area of the Brisbane River it was influenced by tide at the mouth of the Brisbane River Estuary (BRE) in addition to significant rainfall events over the entire basin [31]. The Wivenhoe dam could not efficiently control the floodwater for catastrophe mitigation, as occurred in Brisbane in 2011. Hence, it is worth exploring alternate flood control strategies for the area downstream of the dam. The lower Brisbane River requires innovative flood mitigation options downstream of the Wivenhoe Dam to avoid flooding and damage to life and property. The existing studies proposed options which would involve large construction costs or would require significant community resettlement. The Brisbane River requires some innovative solutions for flood control and adaptation and this study has investigated a Coastal Reservoir (CR) for downstream storage with dredging and widening of the river’s right branch, and control gates for flood mitigation.
The idea of a CR as projected [32,33,34] is for a reservoir (off-stream storage) in seawater near a river mouth to capture the river flow, which could be used to mitigate flood disasters and to reduce the losses from flooding. Its location can be at the inner or outer side of a river mouth. The CR concept can be applied to lower river water levels elevated due to storm surge or tide and sea-level rise, and therefore can be used for flood adaptability in the estuary. Existing CRs are mainly used for fresh water supply, controlling seawater intrusion, and tidal energy [35]. For instance, Marina Barrage is used for both water supply and flood control. The barrage gates separate the reservoir from the sea. During heavy rain, the hydraulic gates are operated, as required, to discharge extra stormwater to the sea during low tides. However, during high tides, the drainage pumping station will pump out extra stormwater into the sea [36].
While the application of the CR concept (e.g., by suitable design according to the hydrodynamic and geographic requirements) could help coastal cities globally, the geographical consideration of this study is limited to the coastal city of Brisbane. Brisbane is part of an area that has a low-lying topography, urban development, and occasional extreme weather events making it particularly vulnerable to flooding. Therefore, the application of a CR in Brisbane could provide a model for coastal cities globally. This study investigates a CR at the mouth of the BRE for flood adaptation. The study models flood hydrodynamics in the BRE with and without a CR by using the MIKE 21 (by Danish Hydraulic Institute (DHI), Hørsholm, Denmark) flow model, hydrodynamic module. In the model, the water levels inside the BRE and Moreton Bay are calibrated and validated for 2013 and 2011 floods, respectively. Further, dikes and gates are added to characterize the CR in the validated model to simulate water level changes. The effect of intake dredging and widening on estuarine flooding were analysed to assess flood adaptation. Two scenarios of CR operation were simulated in the MIKE 21 model, i.e., operations of a CR under normal release from Wivenhoe dam and releases under the improved management of Wivenhoe dam. The optimization of gates for flood control showed flood modification in the BRE. The simulated flood water levels with and without a CR were compared to see how much the flood level would be reduced in the BRE. Therefore, the research will provide critical information for water resource engineers and planners on the feasibility of the CR (downstream storage) technique for floodwater storage and adaptation.
This paper is structured as follows: Section 2 describes the case study area, the Brisbane River estuary; Section 3 explains the Brisbane flooding, the hydrodynamic model, the data requirements and methods, and includes a brief explanation of a CR and gates; Section 4 describes and discusses the results of the hydrodynamic model calibration and validation along with the CR simulations; and Section 5 discusses conclusions drawn from this research, its relevance to Brisbane, and its wider applicability.

2. Study Area

The study area is the lower Brisbane River and Moreton Bay, Australia. The Brisbane River has the longest course in sub-tropical SEQ, having a length of 344 km to the Port Office Gauge which is located in the heart of Brisbane City and a catchment area of 13,600 km2 [37]. The catchment is diverse, covering rural and urban land, dams for flood mitigation (Wivenhoe and Somerset) (Figure 1), tidal impacts, and various tributaries with the prospect of flooding. The river system itself contains the Brisbane River and numerous main tributaries and has a tidal influence up to 90 km from its mouth. The BRE is a tidal estuary, with a mean spring and neap tidal range of 1.8 and 1.0 m respectively [38]. The Oxley Creek and Bremer Rivers are the main tributaries joining the lower Brisbane River at 34 and 73 km respectively, from the river mouth. Estuary depth varies, from 15 m at the river mouth to about 4 m at the Bremer River junction at Moggill point.
Moreton Bay is semi-closed coastal water situated at the mouth of the Brisbane River. The bay ranges from 27.05° to 27.5° S and 153.1° to 153.3° E and covers an area of 1500 km2, with a depth of water ranging from 2 to 27 m and an average water depth of 6.8 m, and is further described as having semi-diurnal tides, with a range of 1–2 m [39]. It is categorized as a bay with several islands (e.g., from north to south next to the river mouth is Mud Island, St, Helena Island, and Green Island).

3. Materials and Methods

The flood adaptation measures of the BRE by a CR technique is explored using a MIKE 21 model. The MIKE 21 FM was used to investigate the 2011 and 2013 flood hydrodynamics in the BRE. The CR and gates were applied to the model to investigate the effects of a CR on flood adaptation and the hydrodynamic behaviour of the BRE.

3.1. Brisbane Flooding and Rain

The Brisbane River has a well-documented flood history, with records dating back to 1824, to the early exploration of the river by John Oxley. Several major floods were recorded for the Brisbane River in the 19th century, particularly in 1841 and two main events in 1893 [40]. After the 1890s, the subsequent major floods were in 1974, 2011, and 2013 as shown in Table 1. Since the construction of the Wivenhoe Dam in 1984, the 2011 flood was the most significant flood event occurred in the Brisbane River, which is why this study chooses it to evaluate the performance of a CR for flood mitigation.
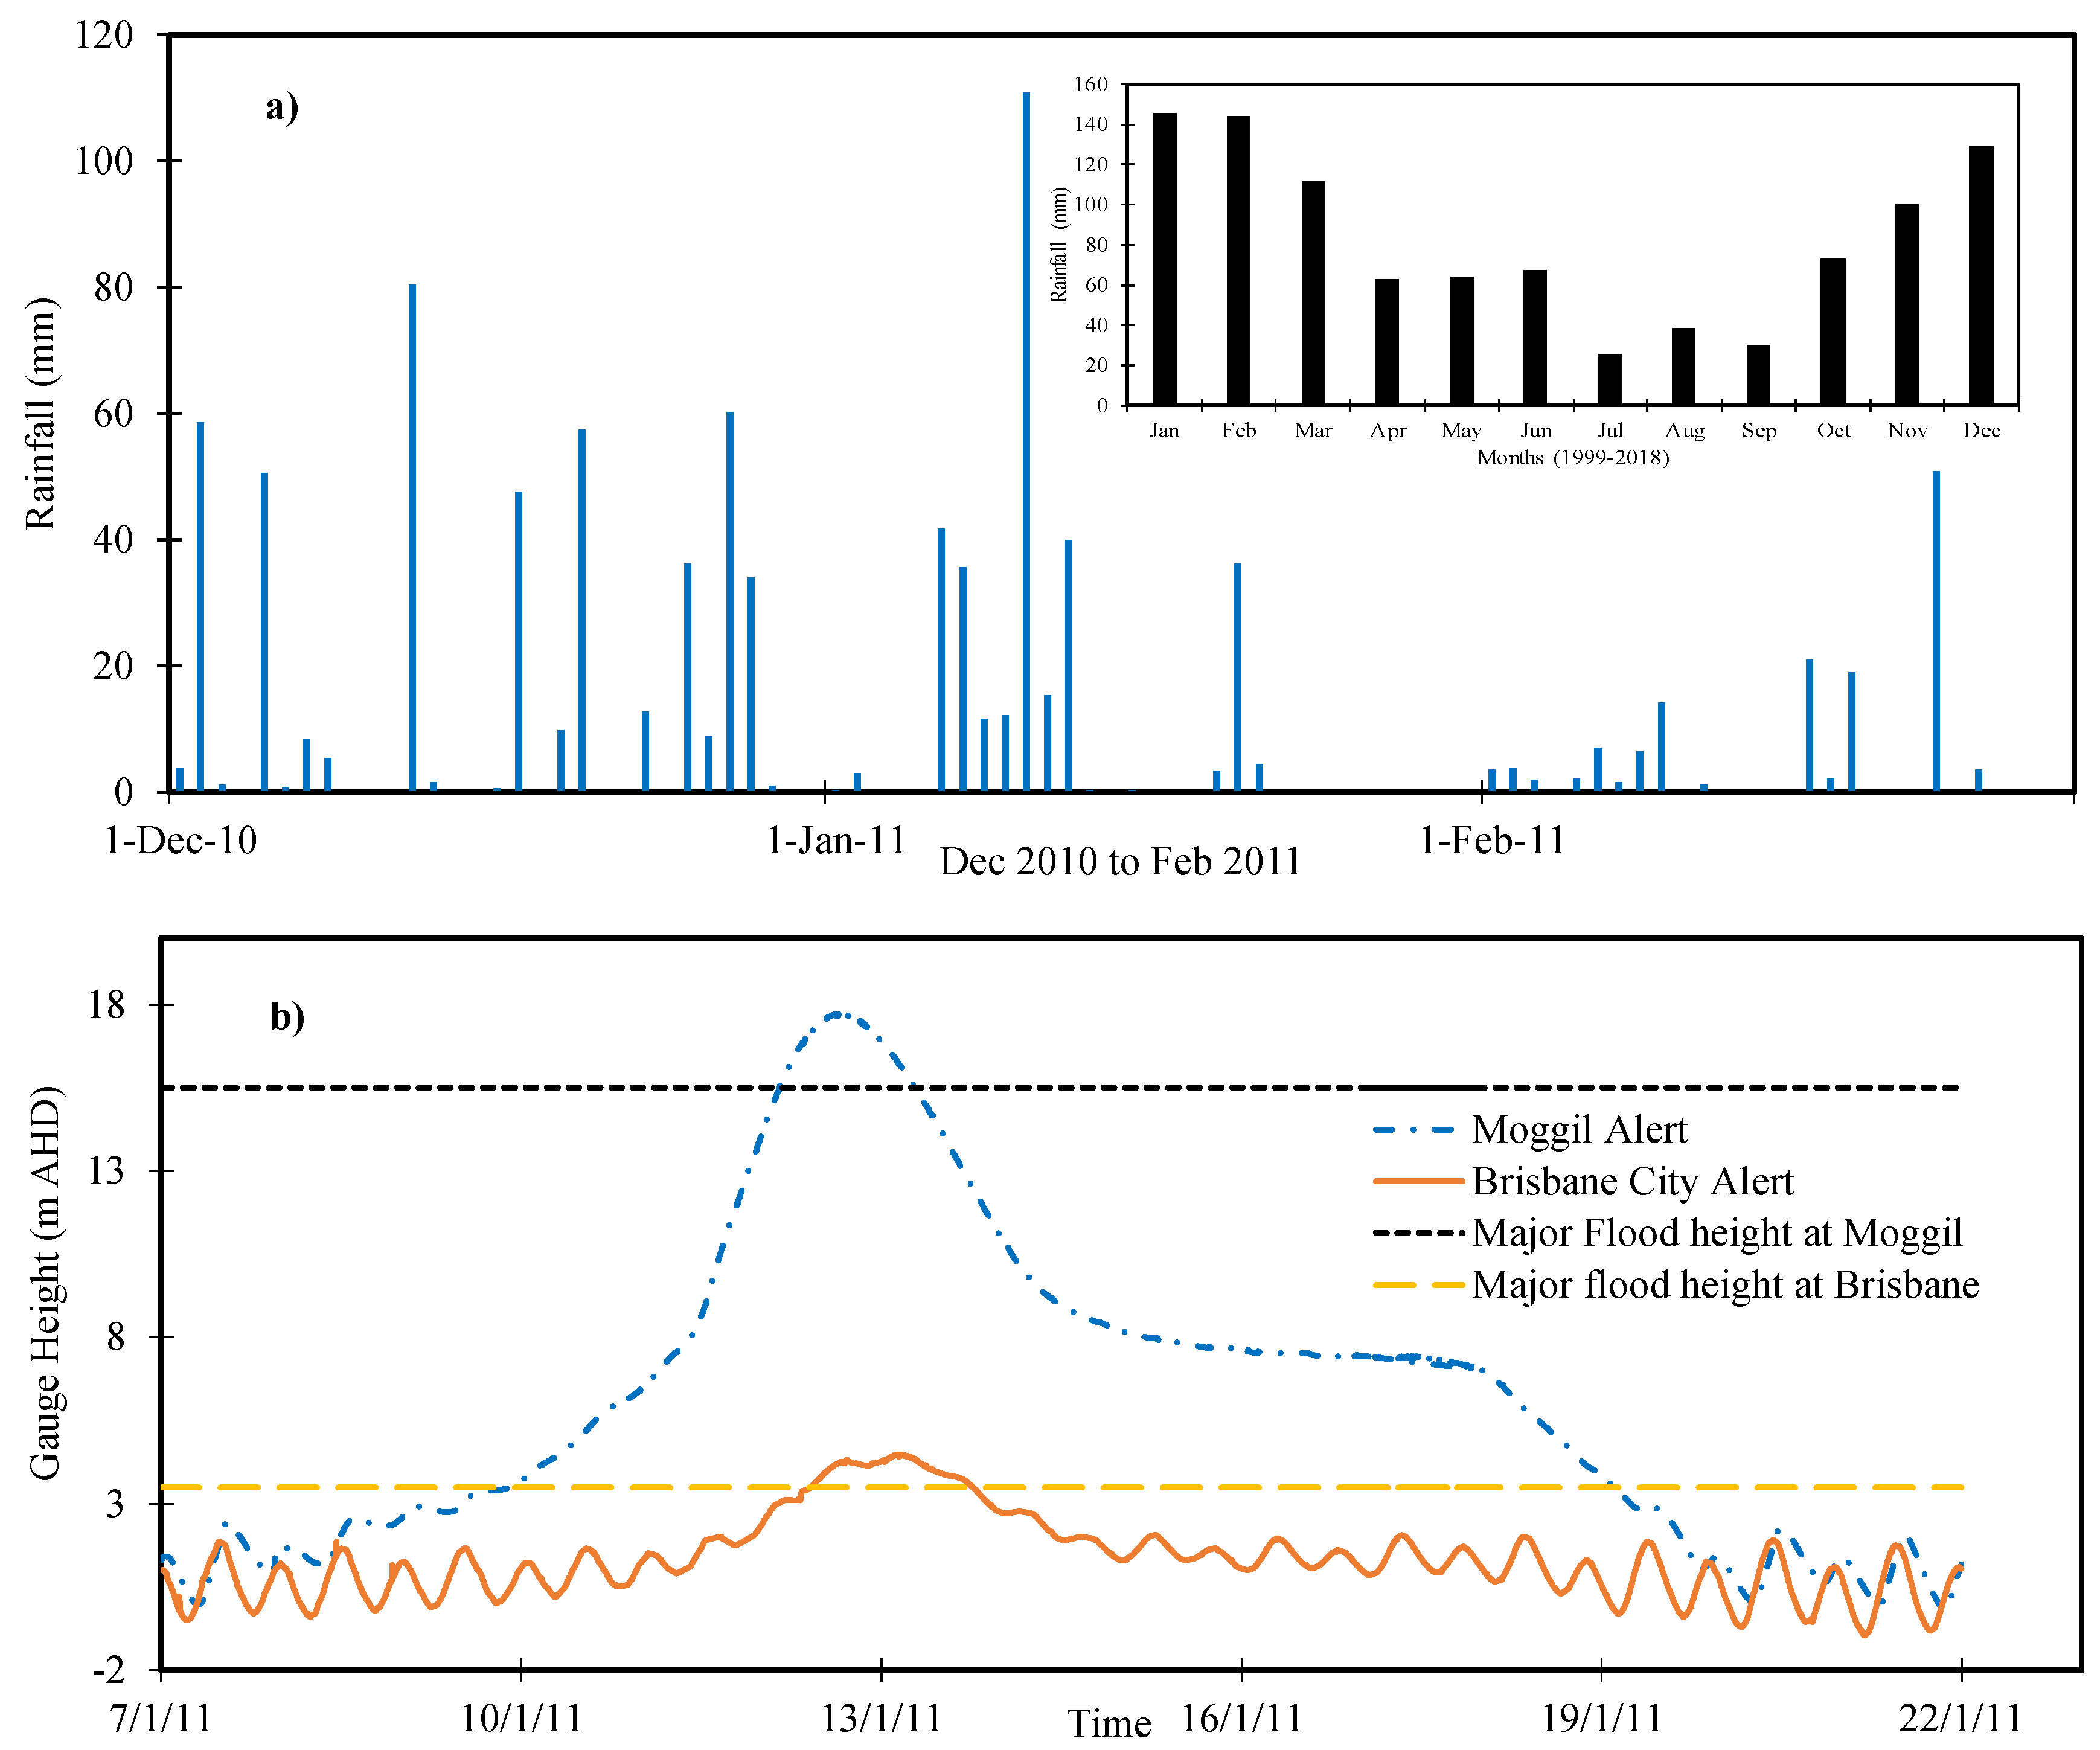
The recorded flood history illustrates that floods can happen at any time of year due to rainfall variability. However, in the summer season monsoon and cyclones generate the highest chance of floods. Moreover, substantial floods have also happened in winter, autumn, and spring often related to East Coast Lows. Mean monthly rainfall records at Brisbane city office from 1999–2018, demonstrate that maximum rainfall occurs in January, February, and December, respectively as shown in Figure 2a.
For instance, during the 2011 flood, SEQ after a decade of drought experienced an exceptionally wet period from December 2010 to January 2011. The six-day rainfall at the Brisbane gauge was 267 mm, which is approximately 25% of the 2011 annual rainfall of 1175 mm. The December 2011 rainfall of 480 mm was three times more than the average December rainfall (129 mm) from 1999–2018. Similarly, in January, the percentage increase in the rainfall was 117%. After the rainfall on Thursday 13th January 2011, Brisbane experienced its 2nd maximum flood since the start of the 20th century. The 2011 flood had a peak level of 17.72 m AHD at Moggill exceeding the major flood height of 15.5 m AHD and at Brisbane City a flood peak of 4.46 m AHD exceeding the major flood height of 3.5 m AHD as shown in Figure 2b. In this study, the 2013 and 2011 floods were used for calibration and validation respectively, and the 2011 flood is also used for CR analysis.

3.2. Data Collection

3.2.1. Bathymetric Data

The bathymetric data were used to define the topographic features of the BRE and Moreton Bay in the hydrodynamic model. Brisbane River bathymetry data were purchased from the Queensland Government under the Brisbane River Catchment Flood Study (BRCFS) in the form of a 5 m resolution digital elevation model (DEM). This bathymetry data is spatial, and Brisbane River bed elevations are created on Australian Height Datum (AHD). The DEM data are incorporated with the LIDAR and sonar bathymetric data. The Moreton Bay bathymetric data were provided by Dr Robin Beaman, School of Earth and Environmental Sciences, James Cook University (JCU) under the Project 3DGBR: GBR100 High-resolution bathymetry for the Great Barrier Reef and Coral Sea (JCU) in the form of 30 m DEM. This DEM has a grid pixel size of 0.03-arc degrees (~30 m) with a vertical datum of Mean Sea Level (MSL) and horizontal datum of WGS84.

3.2.2. Boundary Conditions Data

For the setup of the MIKE 21 hydrodynamic model and calibration and validation, an adequate amount of water level and tidal data is required. The mandatory data is divided into two groups, i.e., that used for model setup and that used for calibration/validation. For the model setup, the upstream boundary condition is taken as the water level at the Moggill gauge station, while the downstream boundary is the tidal level at three stations (i.e., Amity Point, Runaway Bay Point, and at Beacon M2 Point) as shown in Figure 1. Continuous water level data are obtained from the Bureau of Meteorology, and tidal gauge data are obtained from Maritime Queensland as shown in Table 2. All gauge data are set to AHD, and gauge zero is adjusted accordingly.

3.3. Hydrodynamic Model

The MIKE 21 hydrodynamic module simulates the depth-averaged flow features for the years 2011 and 2013, and CR effects on the 2011 floods of the Brisbane River and Moreton Bay. MIKE 21 is a 2D, depth-averaged hydrodynamic model; its numerical solution is based on the incompressible Reynolds averaged Navier-Stokes equations, while using the finite volume method to solve the shallow water equations [42]. The Flow Model of MIKE 21 is the basic hydrodynamic module; it provides the hydrodynamic basis for the computations of environmental hydraulics. It models the flows and variations of water level in response to a range of forcing functions on floodplains, lakes, estuaries, and coastal areas. Many researchers have successfully used the MIKE 21 model to explore the hydrodynamic process of a large river and coastal bay, like Dongting Lake, China [24], the Poyang Lake, China [43], Vembanad Lake, India [44], and Lake Alexandrina [45].
In the current MIKE 21 model, the element sizes around ~2000 km2 study area were adjusted by trial and error and range from 34 m2 to 100,000 m2, with a total of 288,415 unstructured elements and 148,697 nodes to recreate the bathymetry. The observed water level was used as the upstream boundary to the hydrodynamic model, and the tidal levels at three stations (Amity Point, Runaway Bay Point, and Beacon M2 Point) (Figure 1) were used to set the model lower boundary condition. Bathymetric data, 2013 flood and tidal data were used as boundary conditions for the initial set of the model and then validated for the 2011 flood and tidal data. Currently, the MIKE 21 model has not considered evaporation, precipitation, wind direction, and wind speed. The initial water surface elevation of 0.1 m was used, though the initial velocities of water flow were fixed to zero across the model area. The time step is limited to a minimum of 0.1 s to keep the target Courant-Friedrichs-Lewy (CFL) number below 1.0. The thresholds hdry (drying depth = 0.005 m) < hflood (flooding depth = 0.05 m) < hwet (wetting depth = 0.1 m) were used to describe the change of wetting and drying in the model [43].
In a hydrodynamic model, bed resistance is an important factor that controls river flow behaviour. While calibrating the model, Manning’s n is changed within an acceptable limit to bridge the gap between observed and simulated water levels. Manning’s M (reciprocal to Manning’s n) is used in the model to specify the bed resistance. In the present study, the Manning number for the Brisbane River floodplains and Moreton bay is used as (n = 0.022–0.1 Table 3) and were based from earlier studies of modelling calibrations of the Brisbane River [46] and Moreton Bay [47]. The Smagorinsky factor of eddy viscosity (Cs = 0.28) based on the literature review [43,48] was used to make the hydrodynamic simulation and model validation.
The Brisbane River and its floodplain hydrodynamic model have been calibrated in many previous studies with various numerical models. However, previous studies have not calibrated the Brisbane River floodplain and Moreton bay together. This study has calibrated Brisbane River and floodplains in combination with the Moreton Bay area while using MIKE 21. The preceding calibration process revealed that the model is appropriate for simulating the BRE flood dynamics and is commonly used to explore the hydrodynamics and various other applications of the BRE [47]. Model calibration and validation results are described in detail in Section 4.

3.4. Conceptualization of CR Parameters

The proposed CR will be used to minimize the flood levels in the Brisbane River during the high flood period, meaning that it would need enough size to store excess floodwater routed into it. In extreme flood events and during high tide, the CR intake and tidal gate would be operated to control floodwater in the BRE. For the design of the CR, the following key parameters need to be considered: site selection and arrangement of the dike alignment; area and shape of the CR; intake gate size and position; and the operation of a gate [50].

3.4.1. CR Site Selection and Arrangement of the Dike

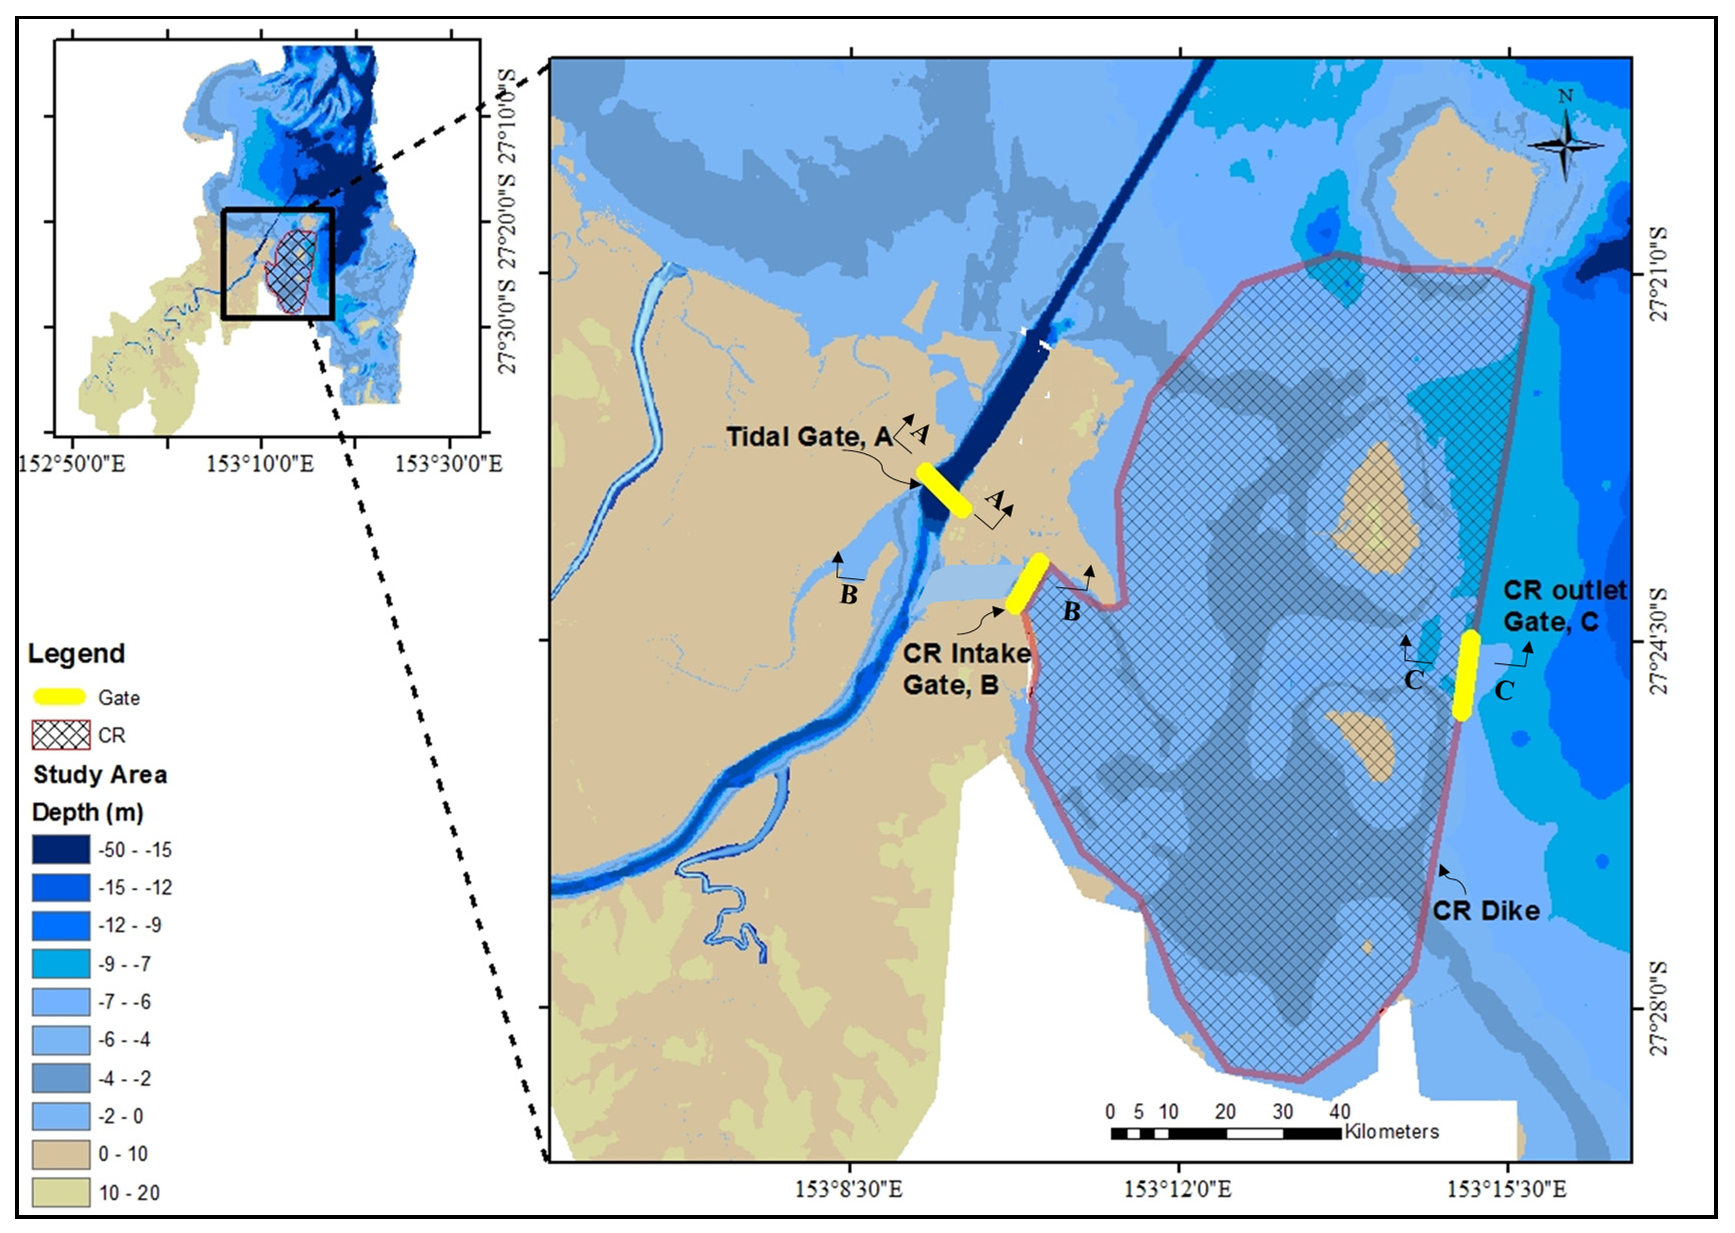
The proposed location of the reservoir should have negligible impacts on estuarine fluvial dynamics, regime changes, and the environment. Further, the reservoir and dike site should have a stable bed [50]. The CR is proposed at the right side of the Brisbane River estuary mouth in Moreton Bay (Figure 3), having no direct influence on estuarine dynamics and influence by river flow. For comparison, the site of the Marina Barrage, in Singapore and the Qingcaosha reservoir in Shanghai are along the main river channel, forming reservoirs in line with the river and directly influenced by the main river flood [36,50]. The proposed CR site would allow less sedimentation inside CR and would not hinder fish migration and navigation paths.
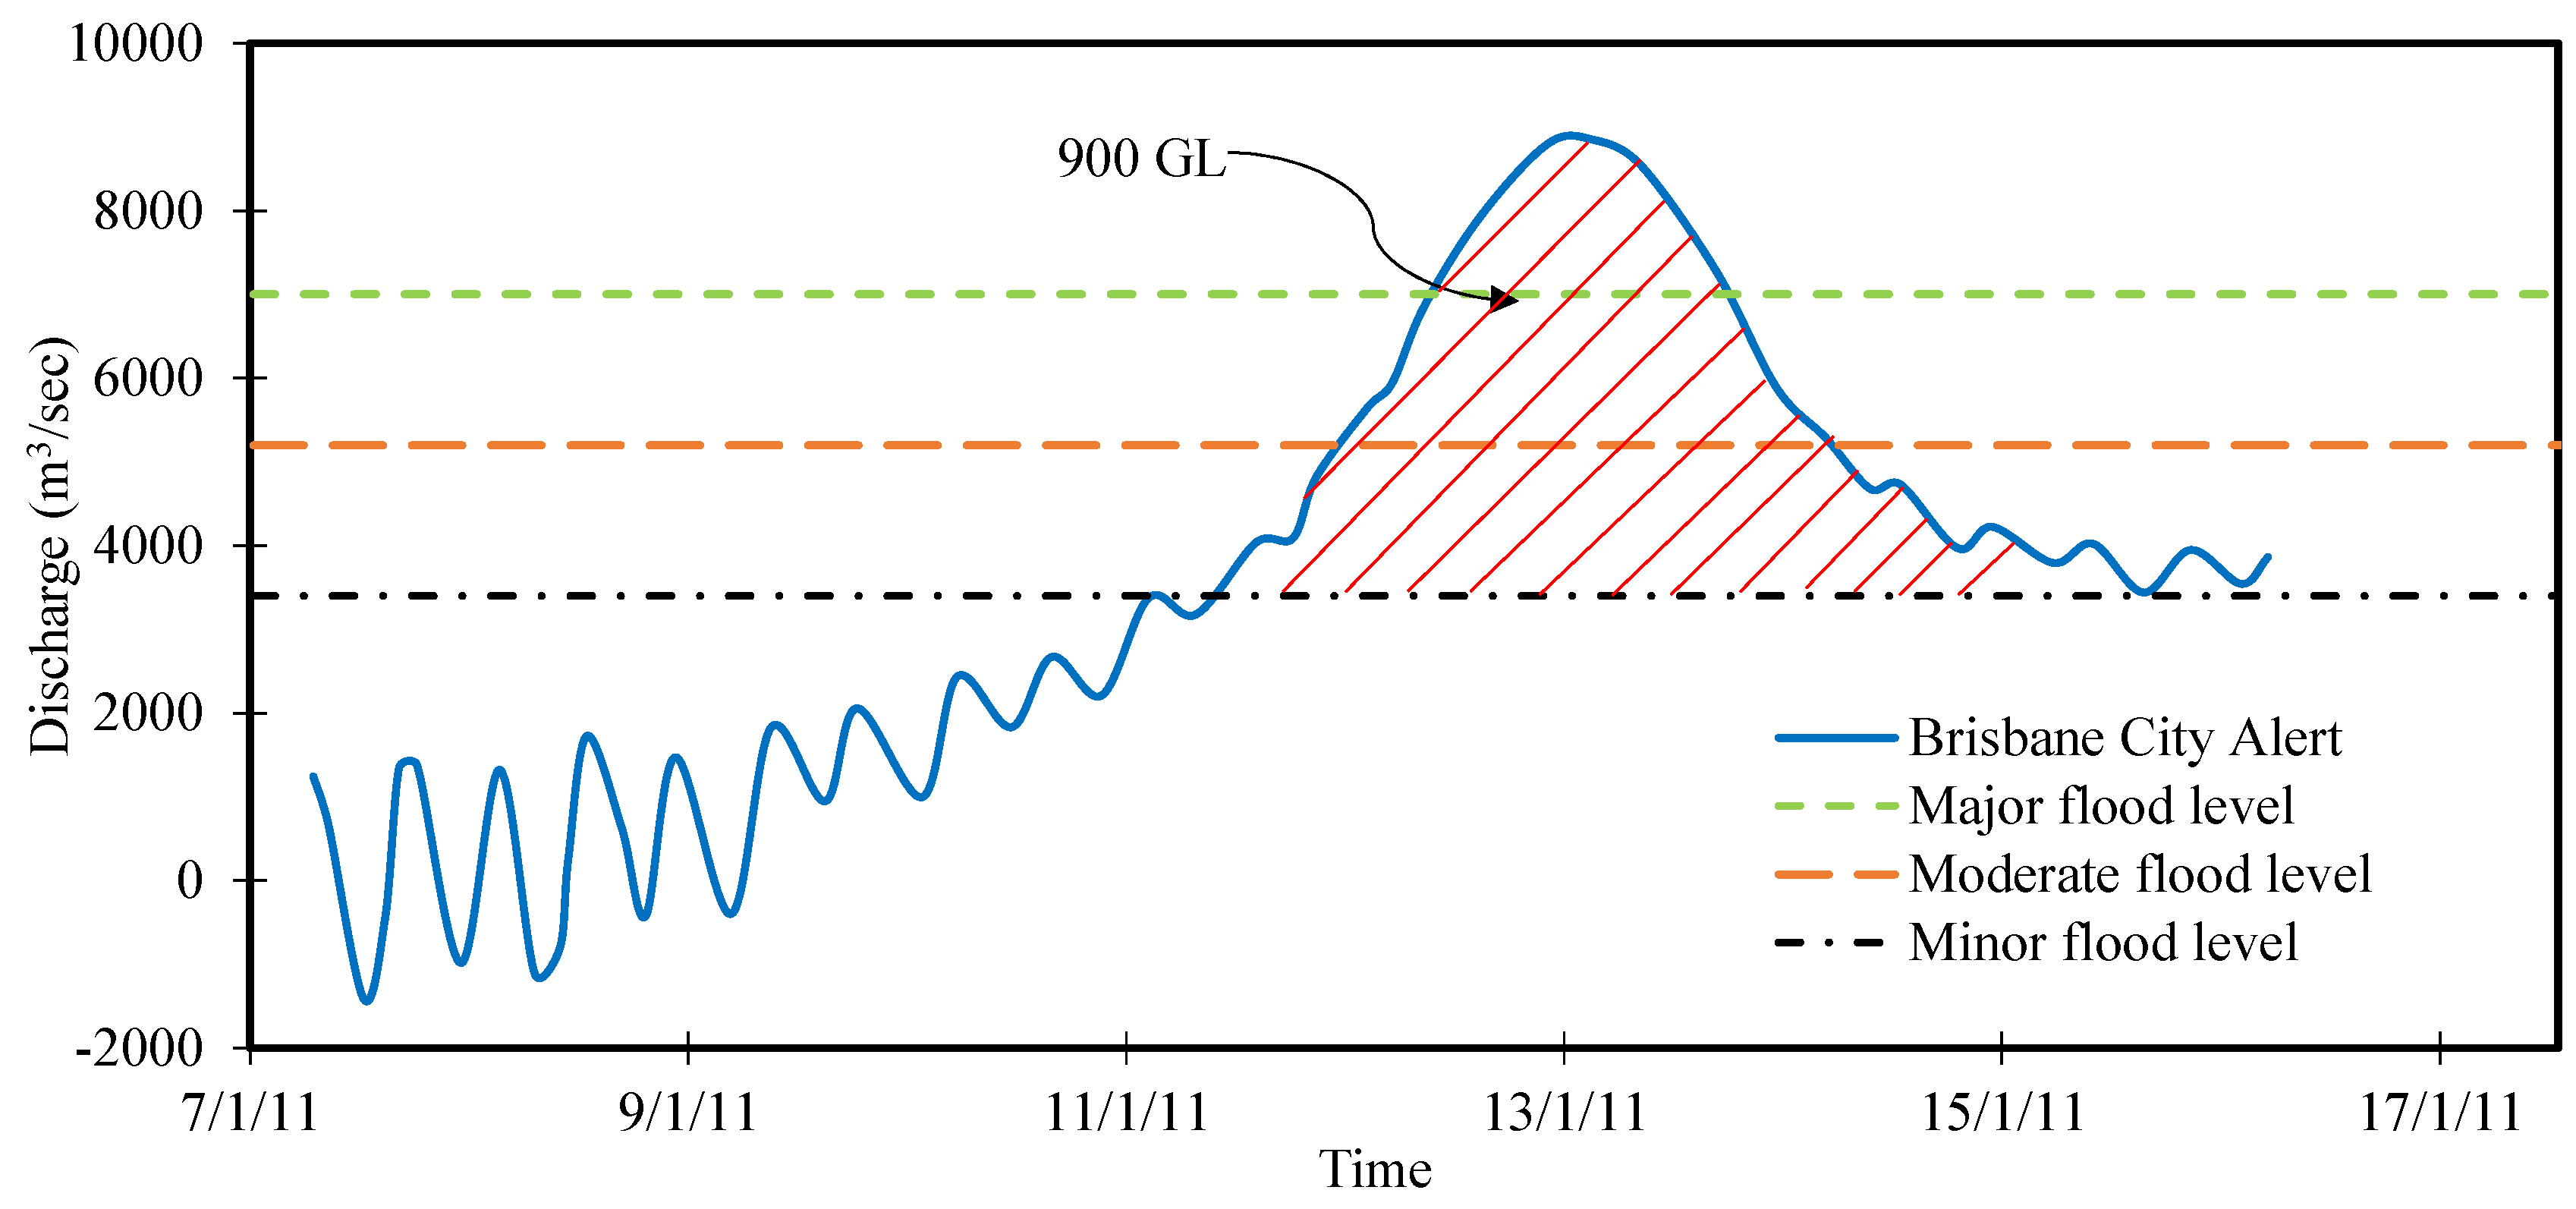
The size of the proposed CR was based on the flood water and available bathymetric data. The 2011 flood hydrograph analysis from 7th January to 16th January shows a total flood volume of 2832 GL, while the excess water level above minor (1.7 m AHD), medium (2.6 m AHD), and major flood (3.5 m AHD) levels are calculated as 900, 419, and 144 GL respectively (Figure 4). The size of the CR for floodwater storage was calculated according to the excessive flood volume of 900 GL. Bathymetric data show the variability of depth, with shallow depths at the mouth and the deepwater further away from the mouth, For CR simulation bathymetry of -10 m were used. While the intake bathymetry of the CR is quite shallow and narrow, it is suggested to dredge to −4 m AHD and to widen by 500 m to safely allow excess floodwater inside the CR. Dike structure is provided inside Moreton bay to store water inside the CR (Figure 3). We have assumed a dike height of 15 m, a dike length of around 34 km and an enclosed area of the reservoir as 75 km2. A comparison of the different parameters of the BRE proposed CR and Qingcaosha Reservoir is shown in Table 4.
The design and construction of a long dike in Moreton Bay could combine a solid base dam and a flexible soft dam (e.g., rubber dam) on it [24]. Based on the assumption of the dike in Moreton Bay, the whole length of the dike is about 34 km and the average unit cost of the dike is about US $1.635 million per kilometre [51]. Hence, the total costs are about 1.633 × 34 = US $55.52 million. If we take three times as the estimated total for a conservative estimation, the total cost is about US $166.56 million, which only accounts for 10% of the direct economic losses (i.e., US $1.67 billion) in the 2011 flood in the Brisbane River catchment. The cost estimate is comparable to the CR constructed in China [32] and further, it is quite reasonable compared to the other flood mitigation options with the cost of (US$ 350 to 1000 million) in Brisbane River [52].

3.4.2. Control Gates Operation

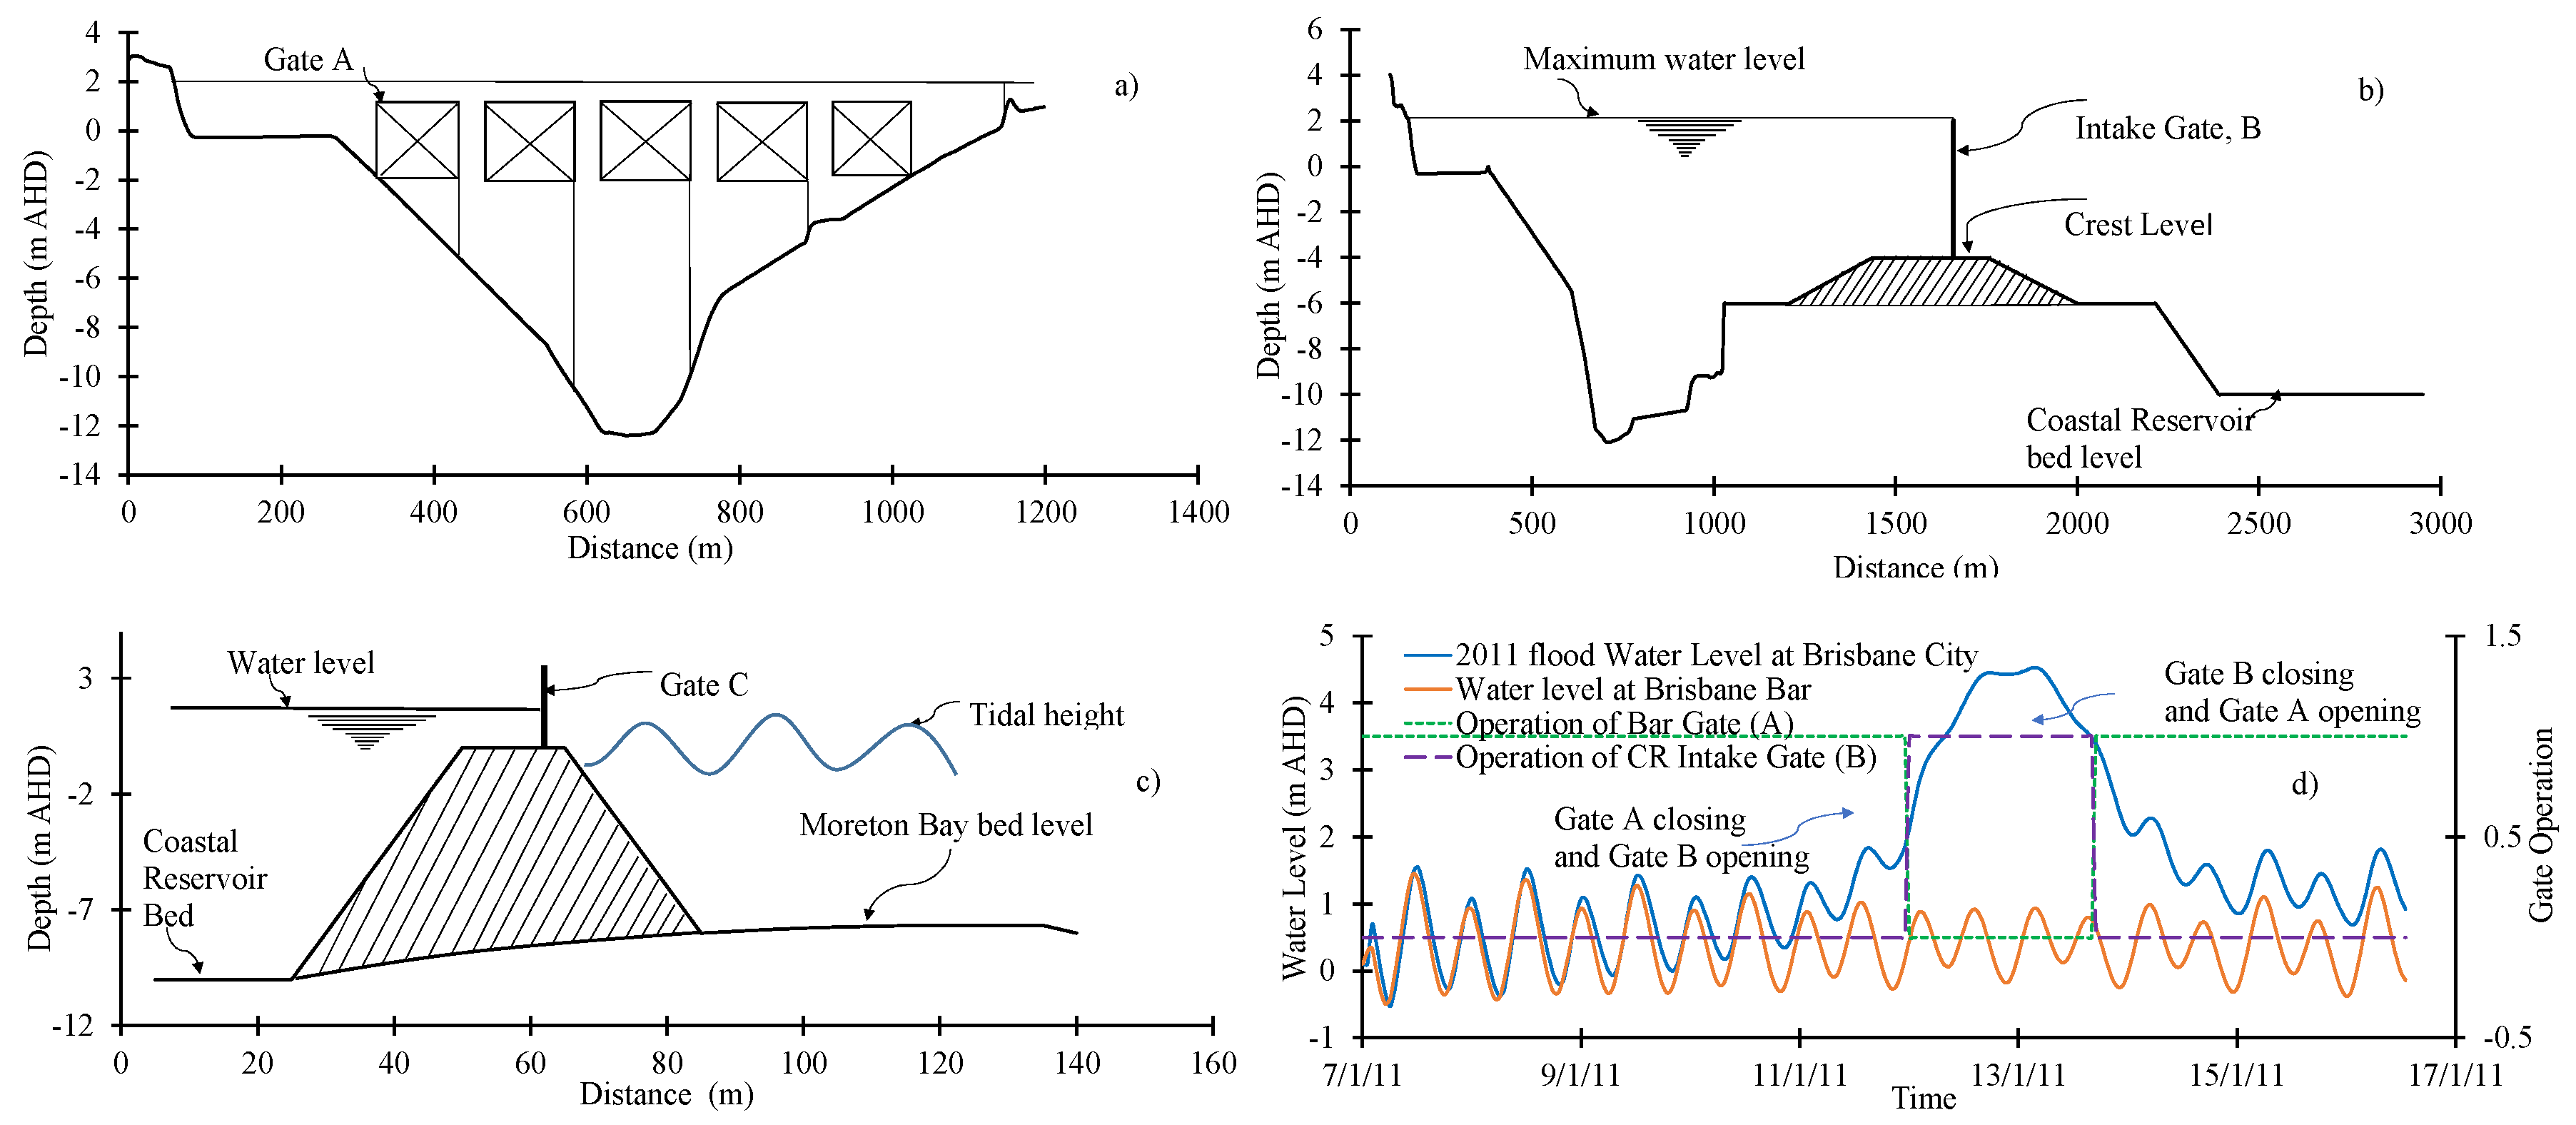
To regulate the flow of water into the CR from the BRE, control gates are provided in the model. The location of the gates and their cross-sections are shown in Figure 3 and Figure 5a–d. Gate A will control the tidal inflow and river outflow from the Brisbane Bar to Moreton Bay, while Gate B is the intake gate for the CR, which will control the flow of water into the CR. Gate C is the outlet gate, which is used for releasing the water from the CR during low tide periods. At the start of gate operation, the CR would be empty through pumping, and active storage would be used for flood mitigation like a giant flood-detention pond. We analysed different gate operations for flood modification in the BRE. Gates A and B are operated according to the combination of flood runoff and tidal cycle. For the 2011 flood, operation of the gates would be initiated after the water rises above the flood level of (2.5 m AHD) at the Brisbane city gauge station. Gate B, which controls water inside the CR, would remain closed under normal river flow conditions. Gate B would be opened when the water level at the Brisbane city gauge starts increasing, e.g., on 12 January 2011, 12:05 a.m. with a water level of 2.5 m AHD, and would be closed when the water level starts decreasing from the major flood level (3.5 m AHD), e.g., by 13 January 2011 at 05:05 p.m. Gate A would be closed while Gate B is open, which would restrict the entrance of tidal water into the CR as shown in Figure 5d. Moreover, as the BRE has a semi-diurnal tidal range, the tidal water variation has been incorporated to optimize gate operation for flood adaptation. Additionally, the CR outlet gate—Gate C—would be opened to release excess water above the tidal level.

4. Results and Discussion

4.1. Calibration of Model

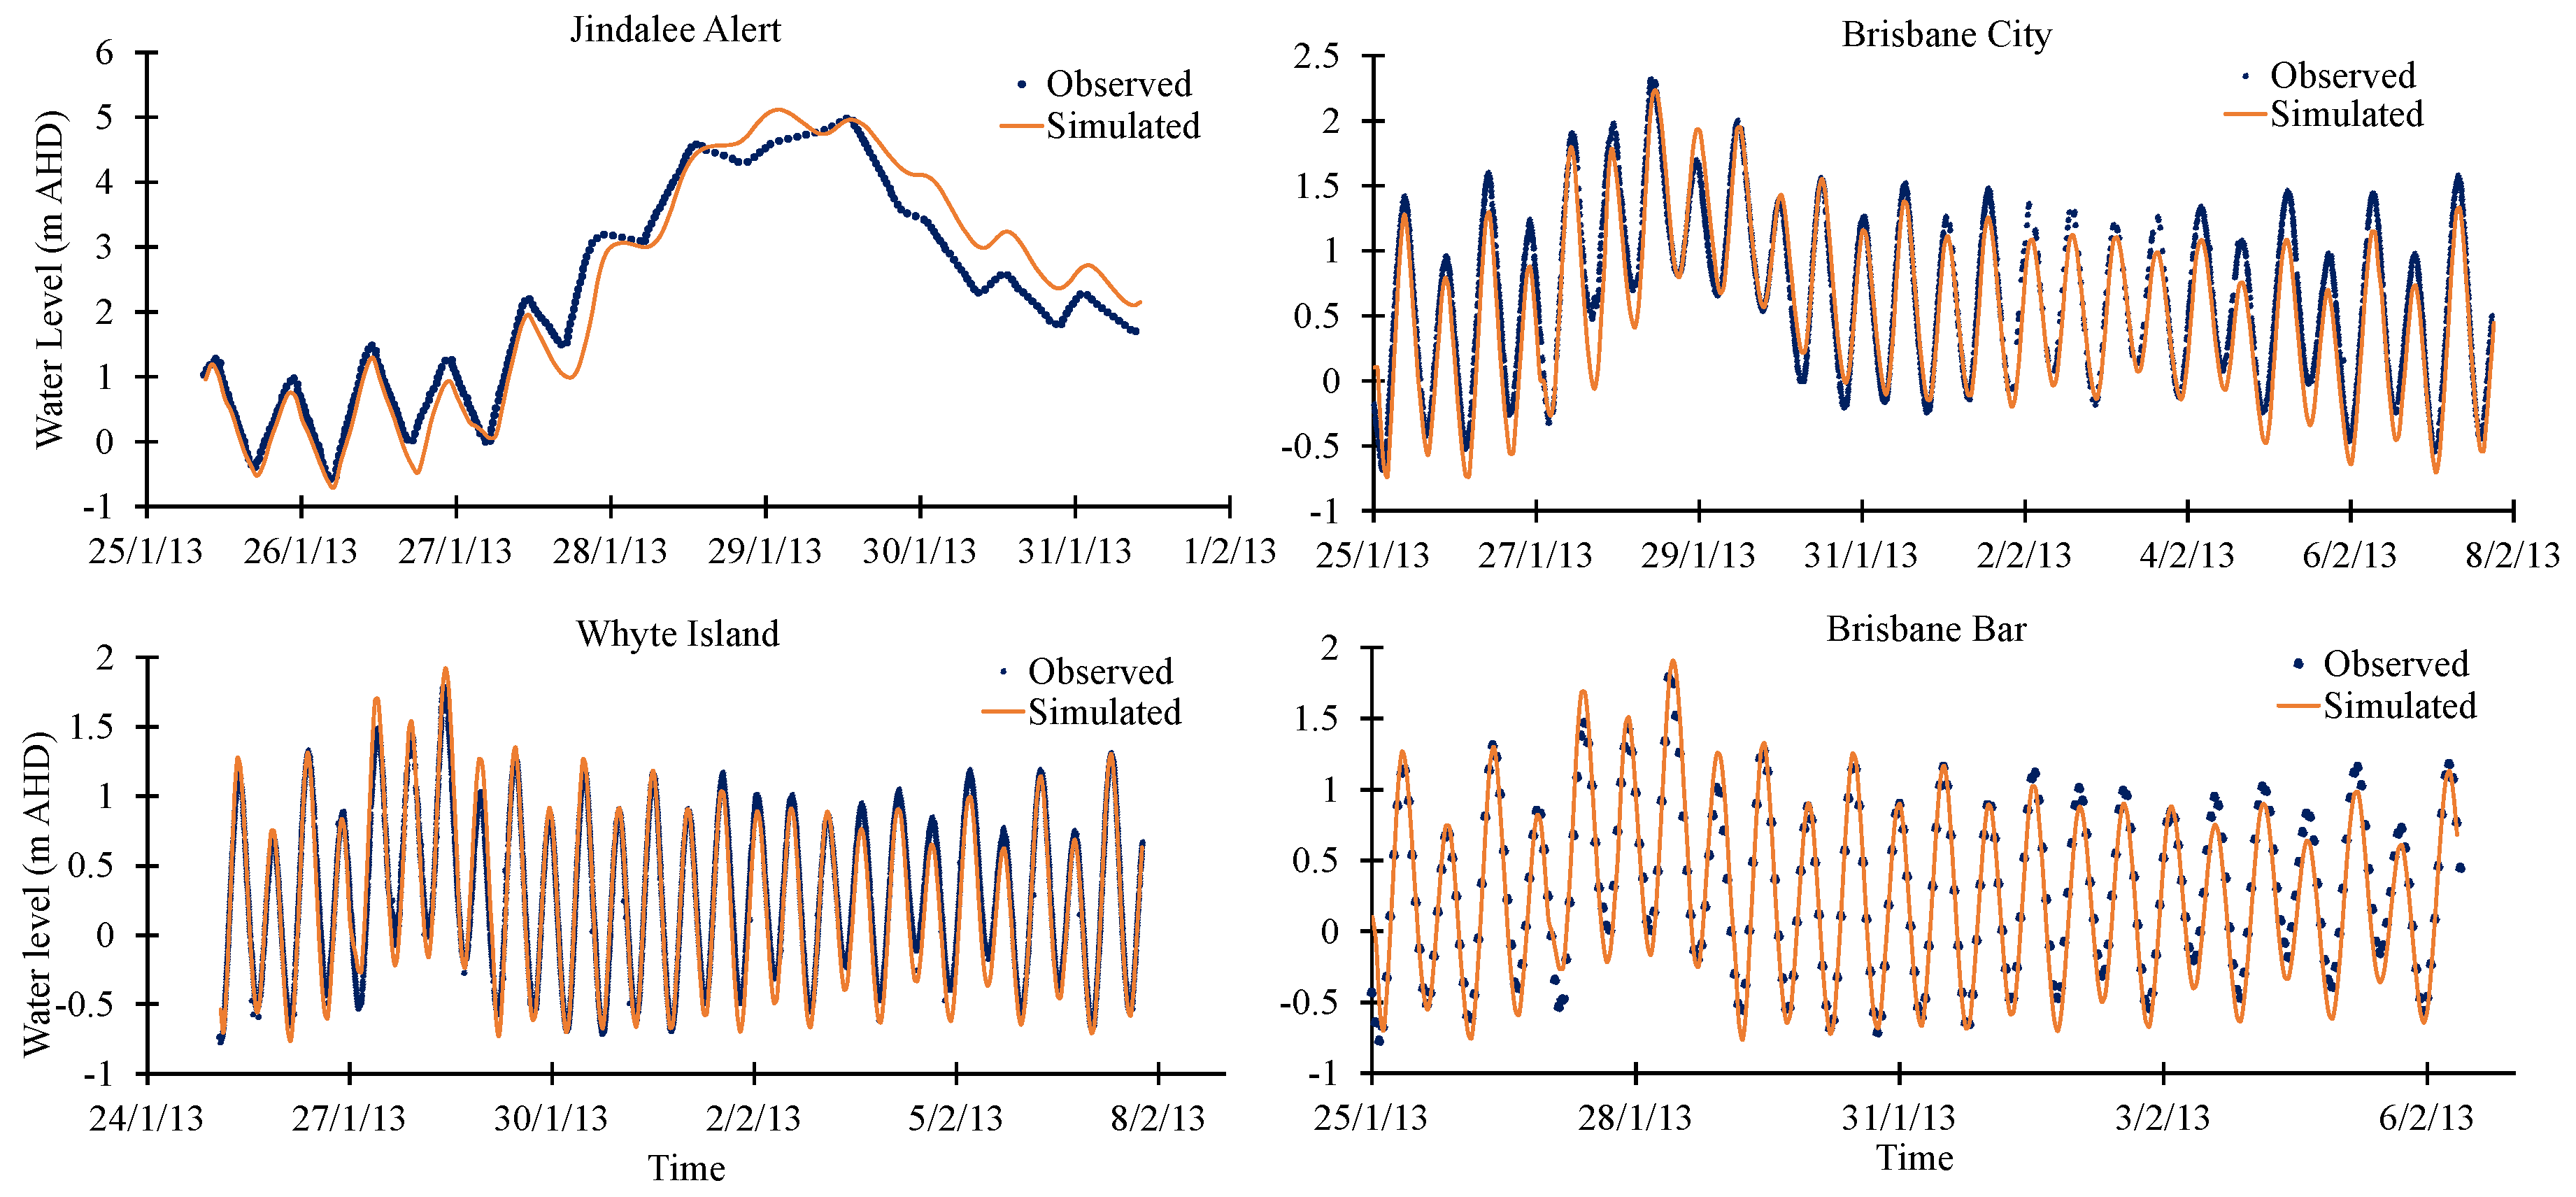
The hydrodynamic model was calibrated using the variable Manning’s n (Table 3). The observed water levels at four gauge stations (viz. Jindalee Alert, Brisbane City Alert, Brisbane Bar, and Whyte Island) for the period from 25 January to 7 February 2013 were used to calibrate the hydrodynamic model. A comparison between simulated and observed water levels is shown in Figure 6. Root-Mean-Square Error (RMSE), Nash–Sutcliffe coefficient (Ens), and percentage error in peak value were used to evaluate the performance of the model. The performance indices for calibrating gauging stations are shown in Table 5. The statistical results showed that Ens of water levels varied between 0.87 and 0.97, and RMSE values were less than 0.45, which showed a satisfactory match between the observed and simulated water levels.

4.2. Validation of the Hydrodynamic Model

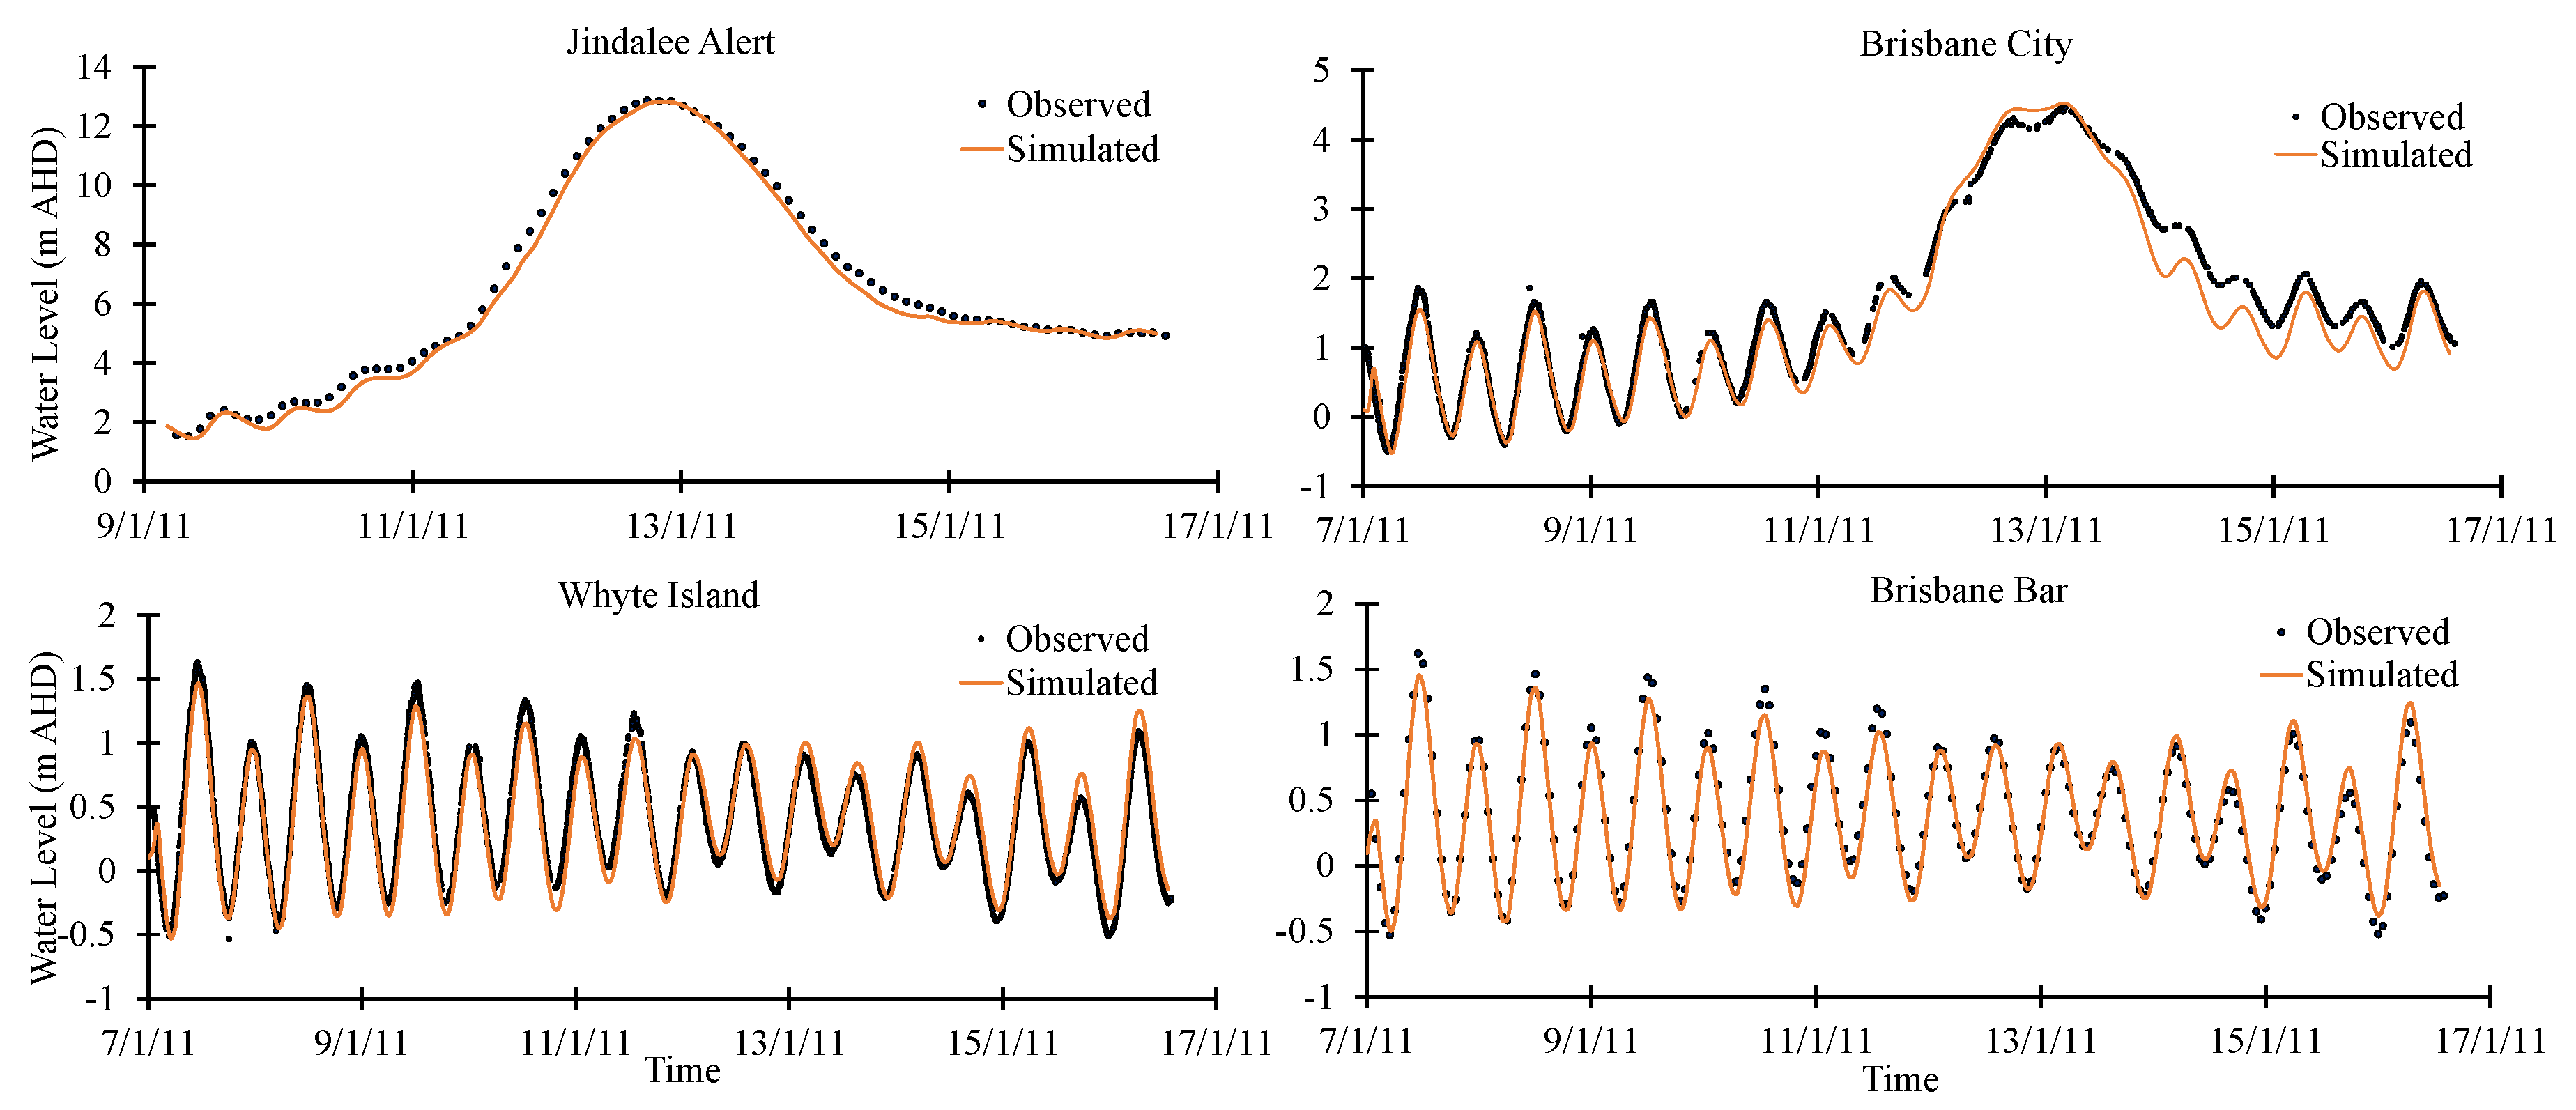
The hydrodynamic model was calibrated against the low flow event of 2013 and to increase the predictive power it was validated for the high flow event of 2011. Model validation was conducted by using the water level at four gauging stations (viz. Jindalee Alert, Brisbane City Alert, Brisbane Bar, and Whyte Island Alert) during the period from 7th to 16th of January 2011, as shown in Figure 7.
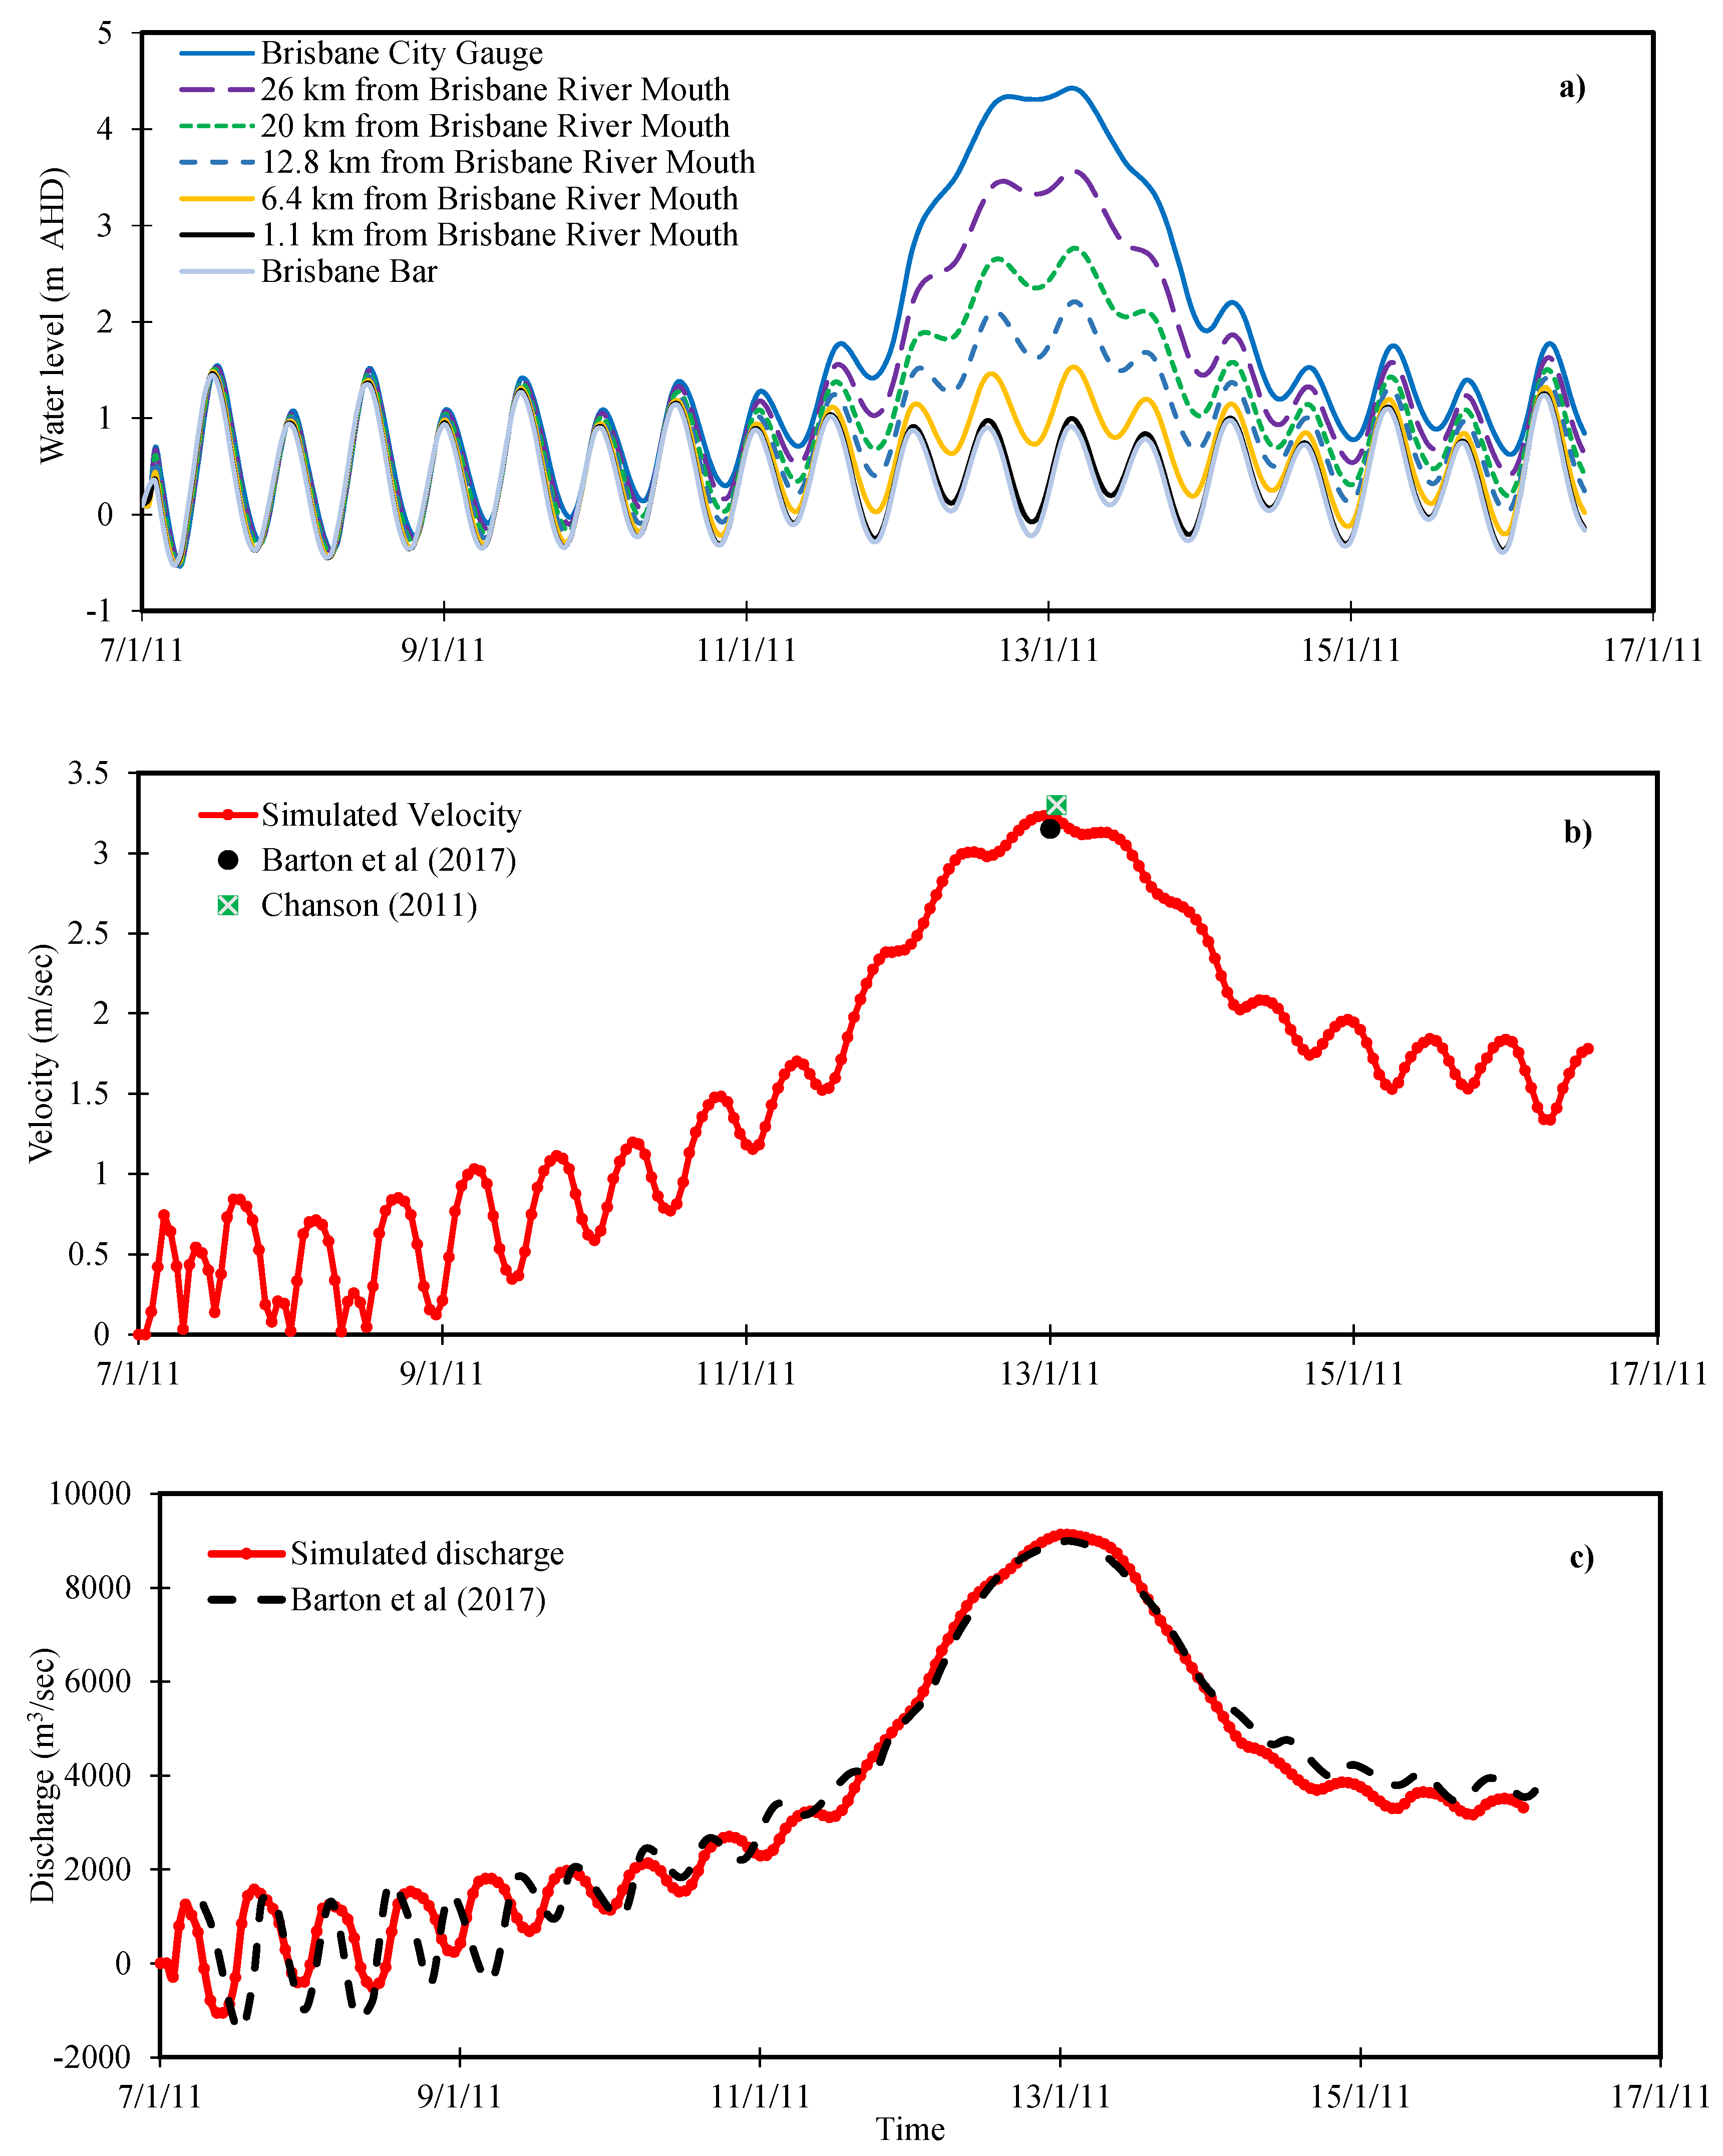
The phase and amplitude from the observed and simulated water presented reasonable agreement. The goodness of fit of validating gauging stations is shown in Table 6. The statistical parameters showed that Ens of water levels varied between 0.94 and 0.97, and RMSE values were less than 0.41, which showed an adequate match between the observed and simulated water levels. Peak flood values at Jindalee and the Brisbane city gauge for the 2011 flood were very well matched with the model’s predicted values, i.e., they showed a difference of 1.48% and 1.35% with observed values at the respective stations. The maximum water level at the Brisbane city gauge was 4.46 m AHD and it kept decreasing until it became tidal at the Brisbane Bar, which showed a complete tidally influenced lower reach of the estuary, even during a high flood. The simulated water level in the BRE from the Brisbane city gauge to the Brisbane Bar is shown in Figure 8a. Validation of flow velocities and discharge within the BRE at the Brisbane city gauge are shown in Figure 8b,c, demonstrating that the hydrodynamic model can imitate whole flow dynamics with an Ens of 0.86, while the peak velocity prediction is also well-matched with other model results [53,54] (Figure 8b). The minor disagreements between observed and simulated results could be due to the model mesh size for topography representation. Since the results indicate that the MIKE 21 model is suitable for simulating BRE hydrodynamic, the model has permitted us to simulate CR and gate operation with confidence.

4.3. Effect of Channel Deepening on Water Level Reduction in the BRE

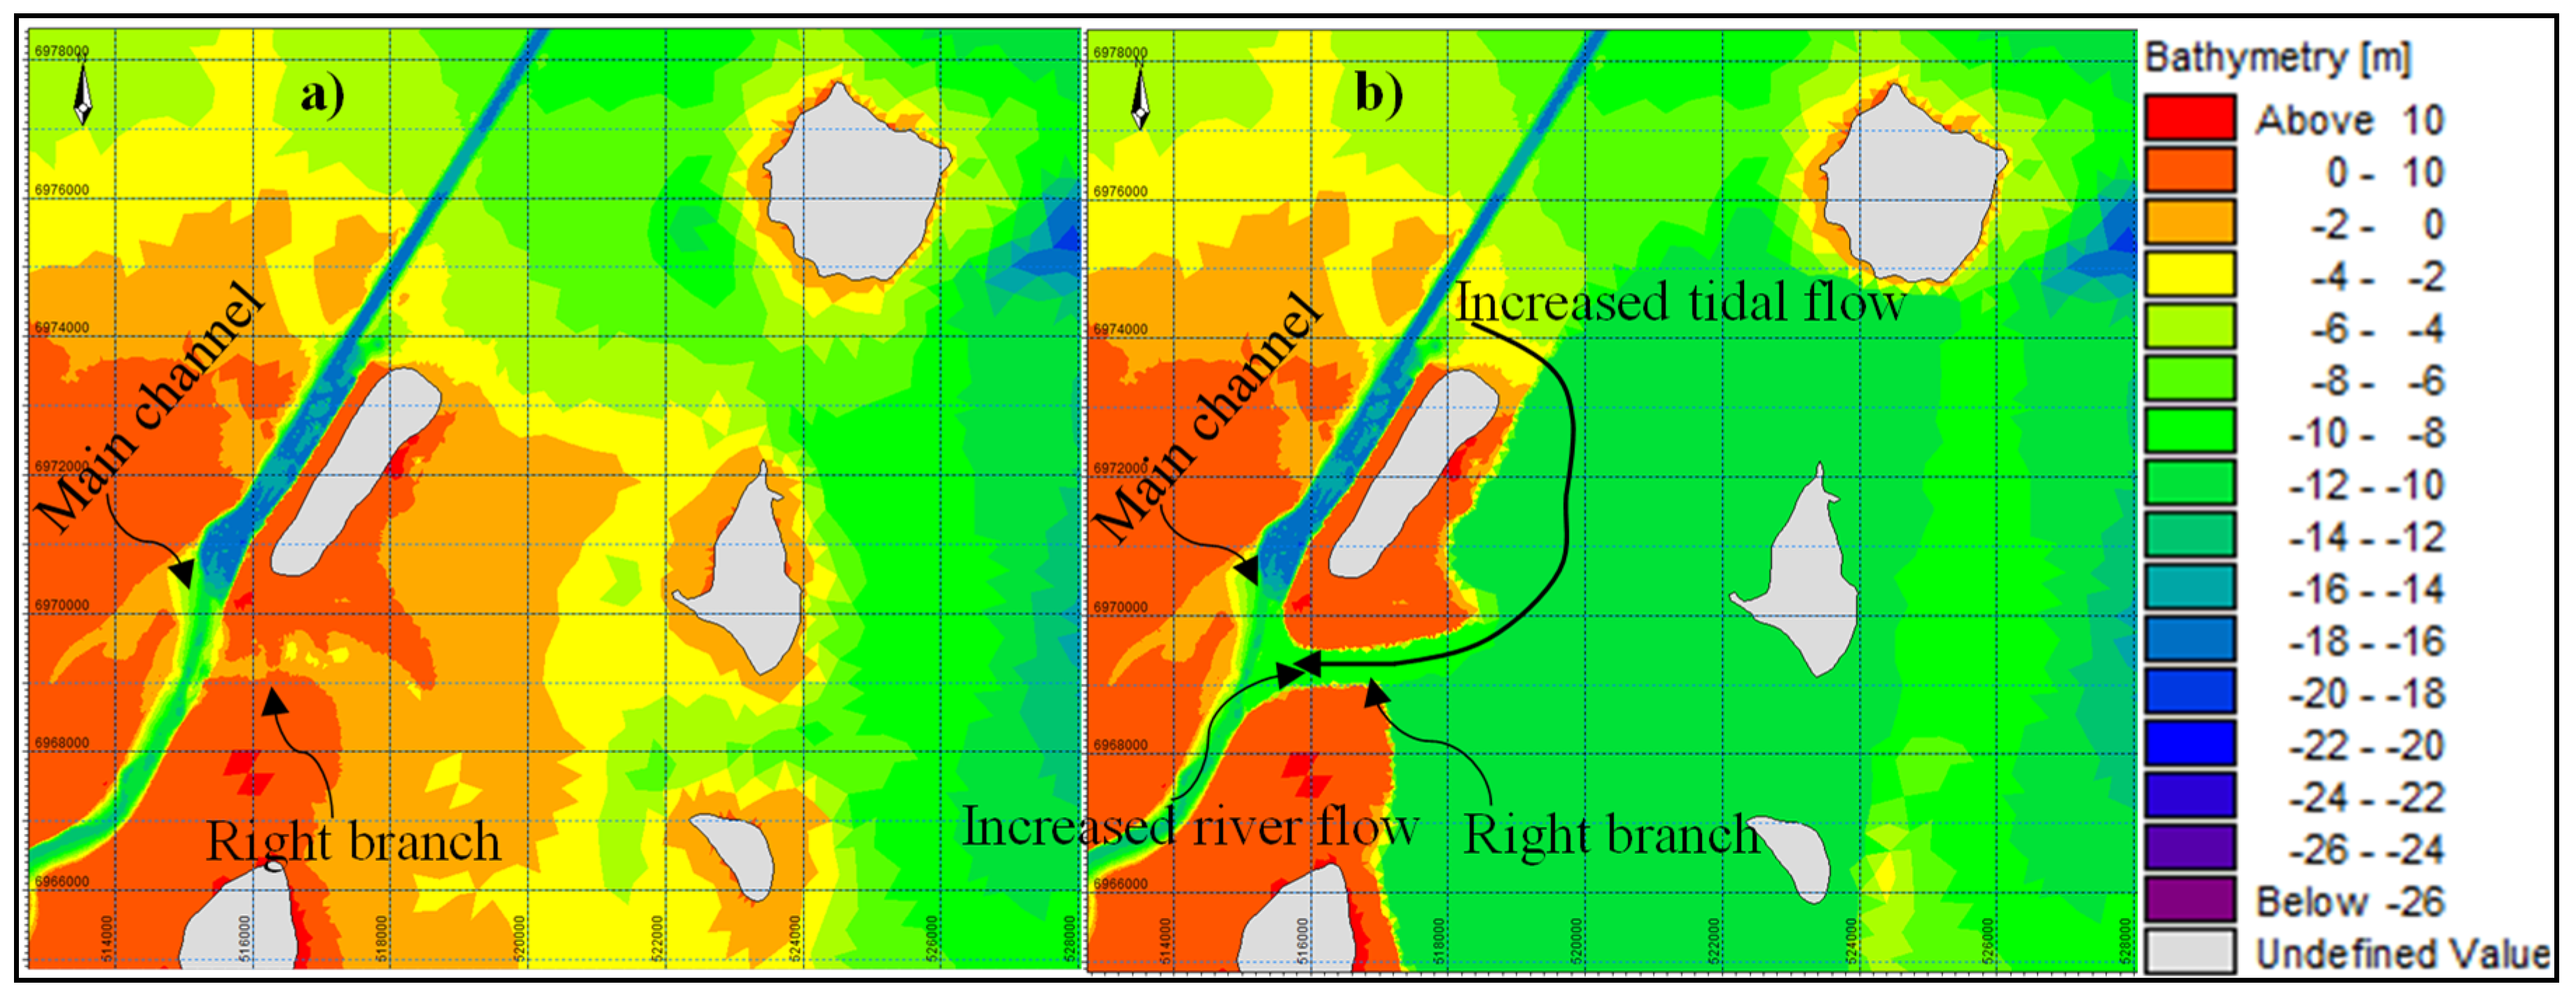
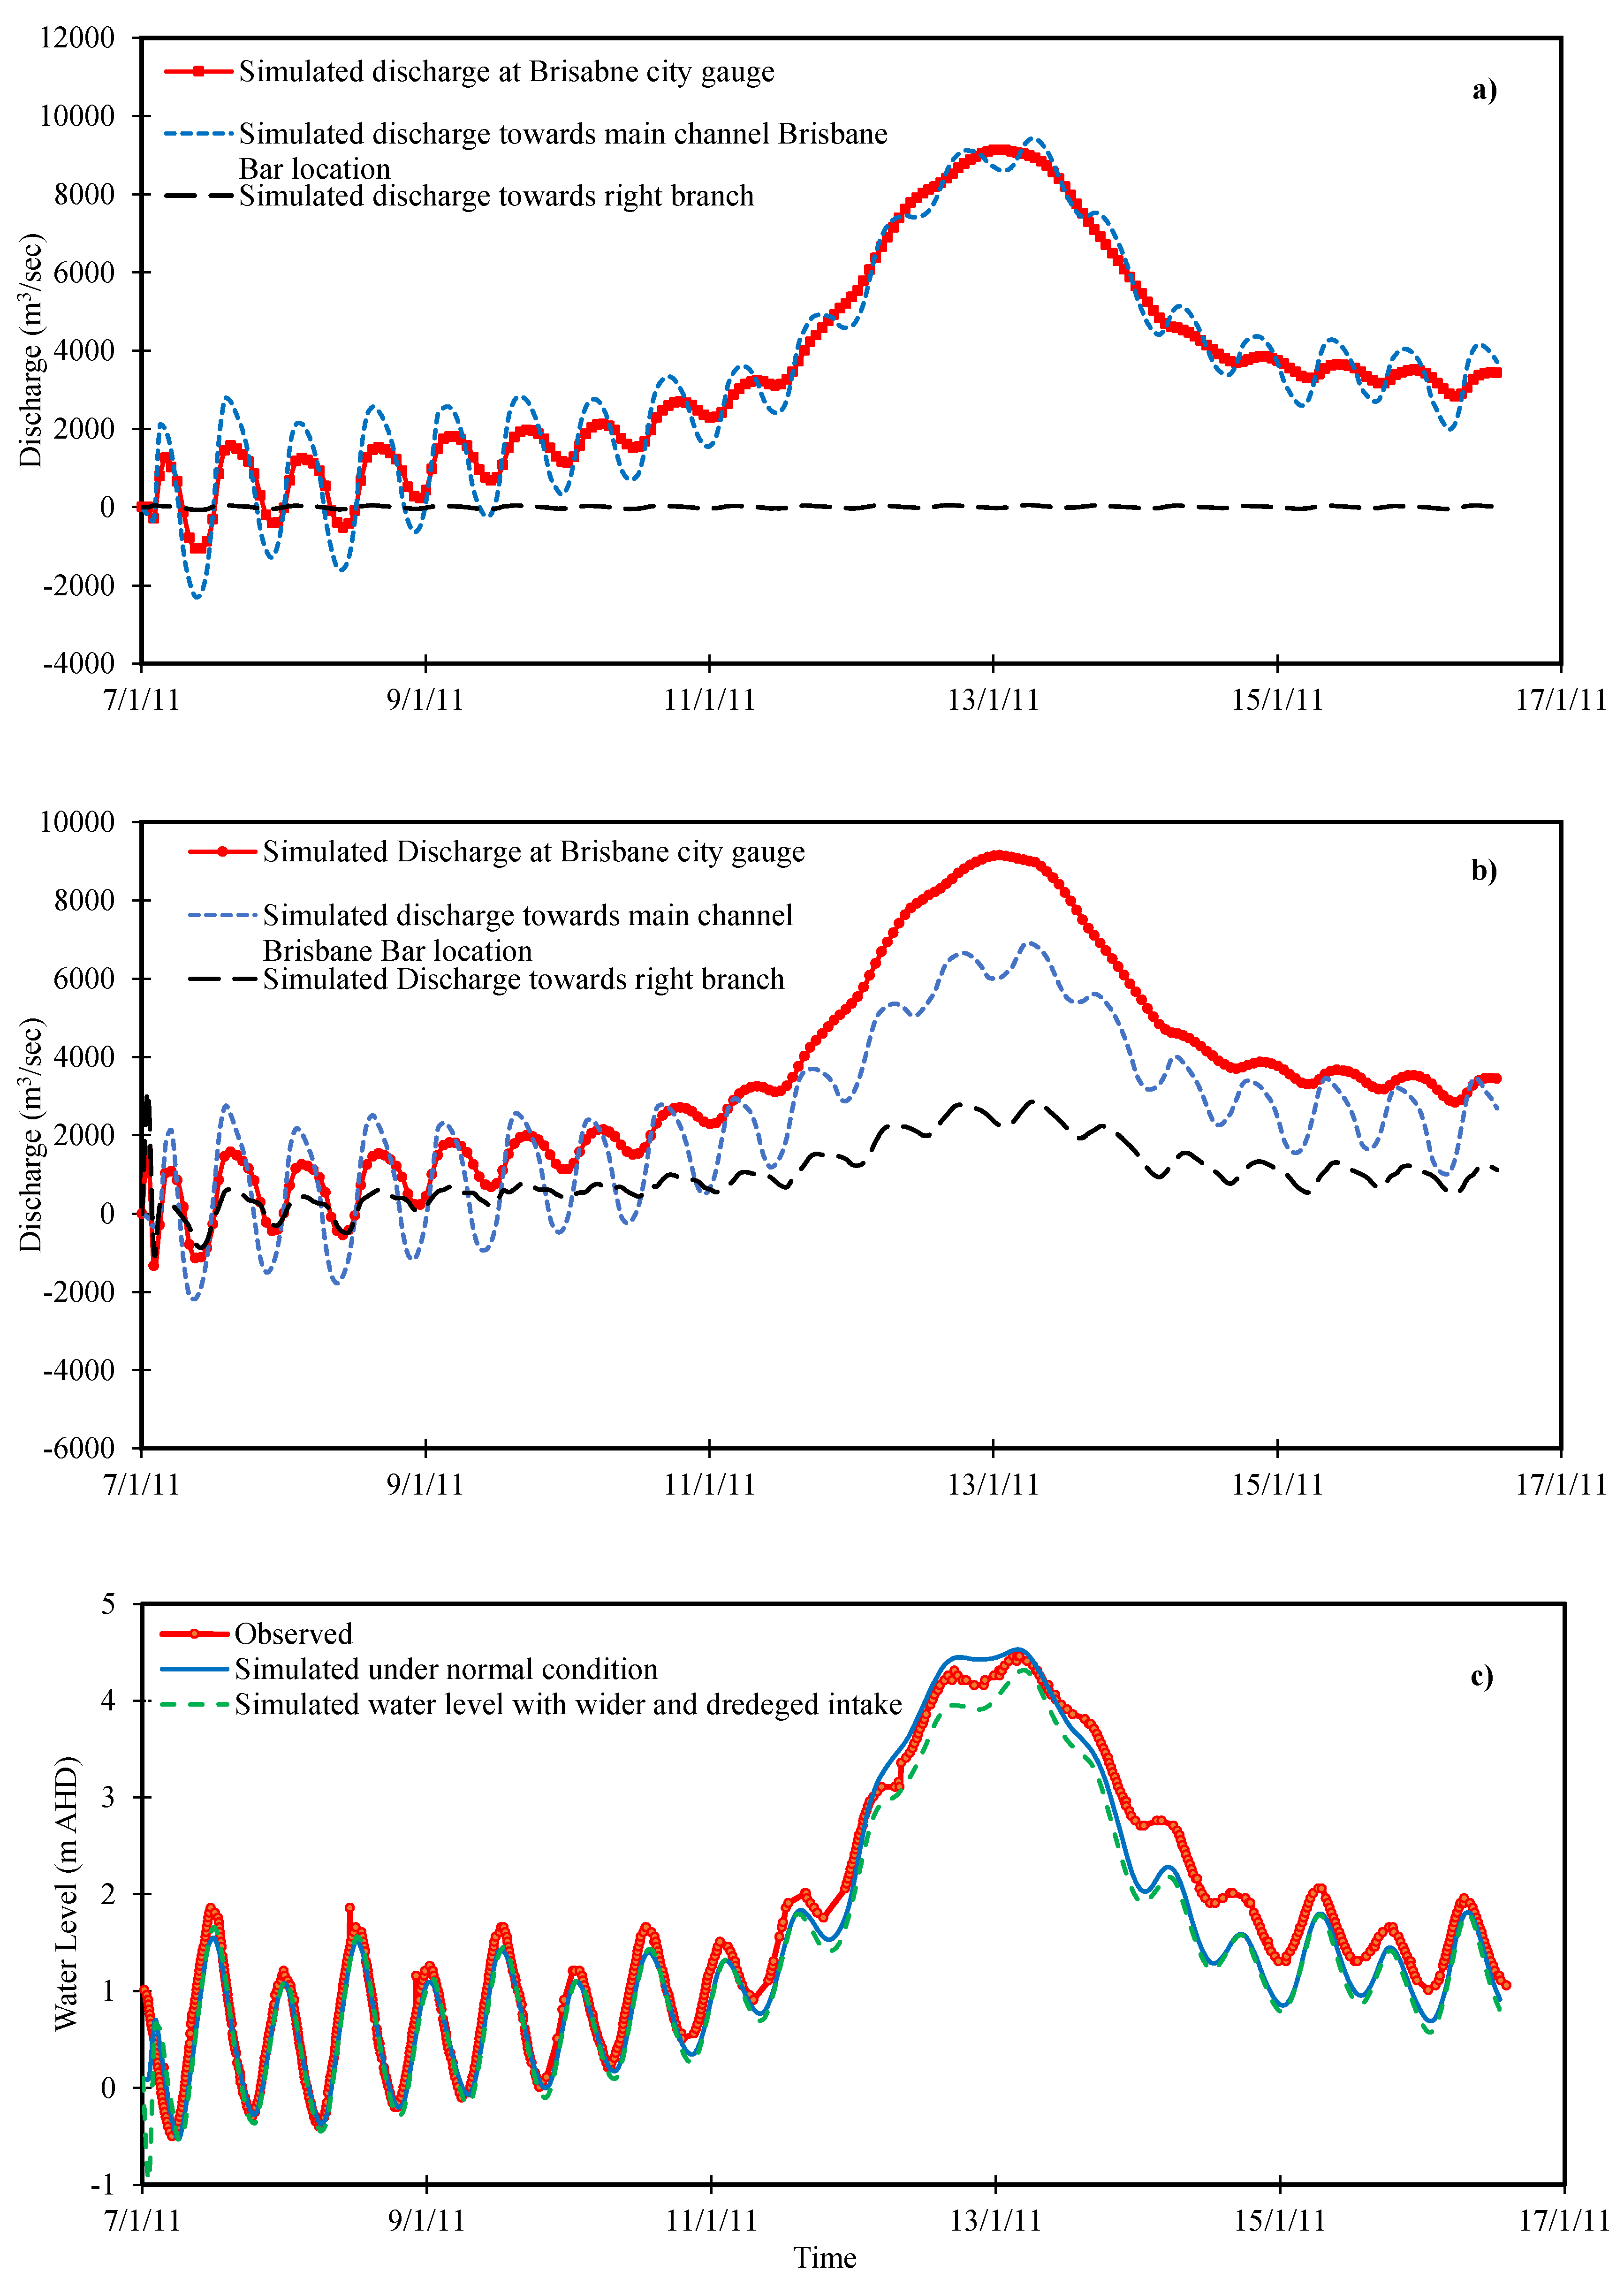
Under normal conditions, the flow distribution in the BRE is such that almost 99% of water goes straight into the Moreton Bay, while the right branch of the Brisbane River contributes only 1% of water towards the Moreton bay (Figure 9 and Figure 10a,b). When the right branch of the Brisbane River was widened by 500 m and dredged to −4 m (Figure 9), the flow towards the right branch increased by approximately 30% (Figure 10a,b). The acceleration in discharge could be due to enlarged frictional damping of the tide wave as suggested by others [55,56].
The tidal water inflow increased in the BRE, as the right branch intake was dredged and widened, however, the water level in the estuary upstream area reduced (peak water level reduced from 4.46 to 4.30 m AHD) as shown in Figure 10c. Ralston, et al. [25] found a similar response in the Hudson River, where channel deepening in the estuary leading to a decrease in friction also increased conveyance of river discharge in the tidal river, such that the overall risk of flooding decreased. However, there are numerous reasons for the reduction in flood danger. During riverine flood events in the BRE, water levels would be reduced due to the decrease in effective drag and the greater hydraulic conveyance initiated by the deeper channel, decreasing the tidally averaged water surface slope and increasing velocity between the Brisbane River and Moreton Bay. A similar response was found in the Columbia River, USA [57,58].

4.4. Influence of CR on the BRE Flood Adaptation

The modelled ability of the CR to modify flood water levels in the BRE for the 2011 floods is analysed in the following section. Two different cases of the Brisbane River flow were considered for the operation of the CR. In the first case, the existing flow releases from the Wivenhoe dam during the 2011 flood were considered and analysed under three different gate operation scenarios. In the 2nd case, the flow releases from the Wivenhoe dam under improved flood management were considered.

4.4.1. CR Influence on BRE Hydrodynamics under the Current Operation of Wivenhoe Dam

The operation of a reservoir system for flood mitigation is a complex decision-making process, comprising many variables as well as substantial uncertainty and risk. Most reservoir systems are operated on fixed rule curves. However, operators also apply personal judgements to adopt the target value [59].
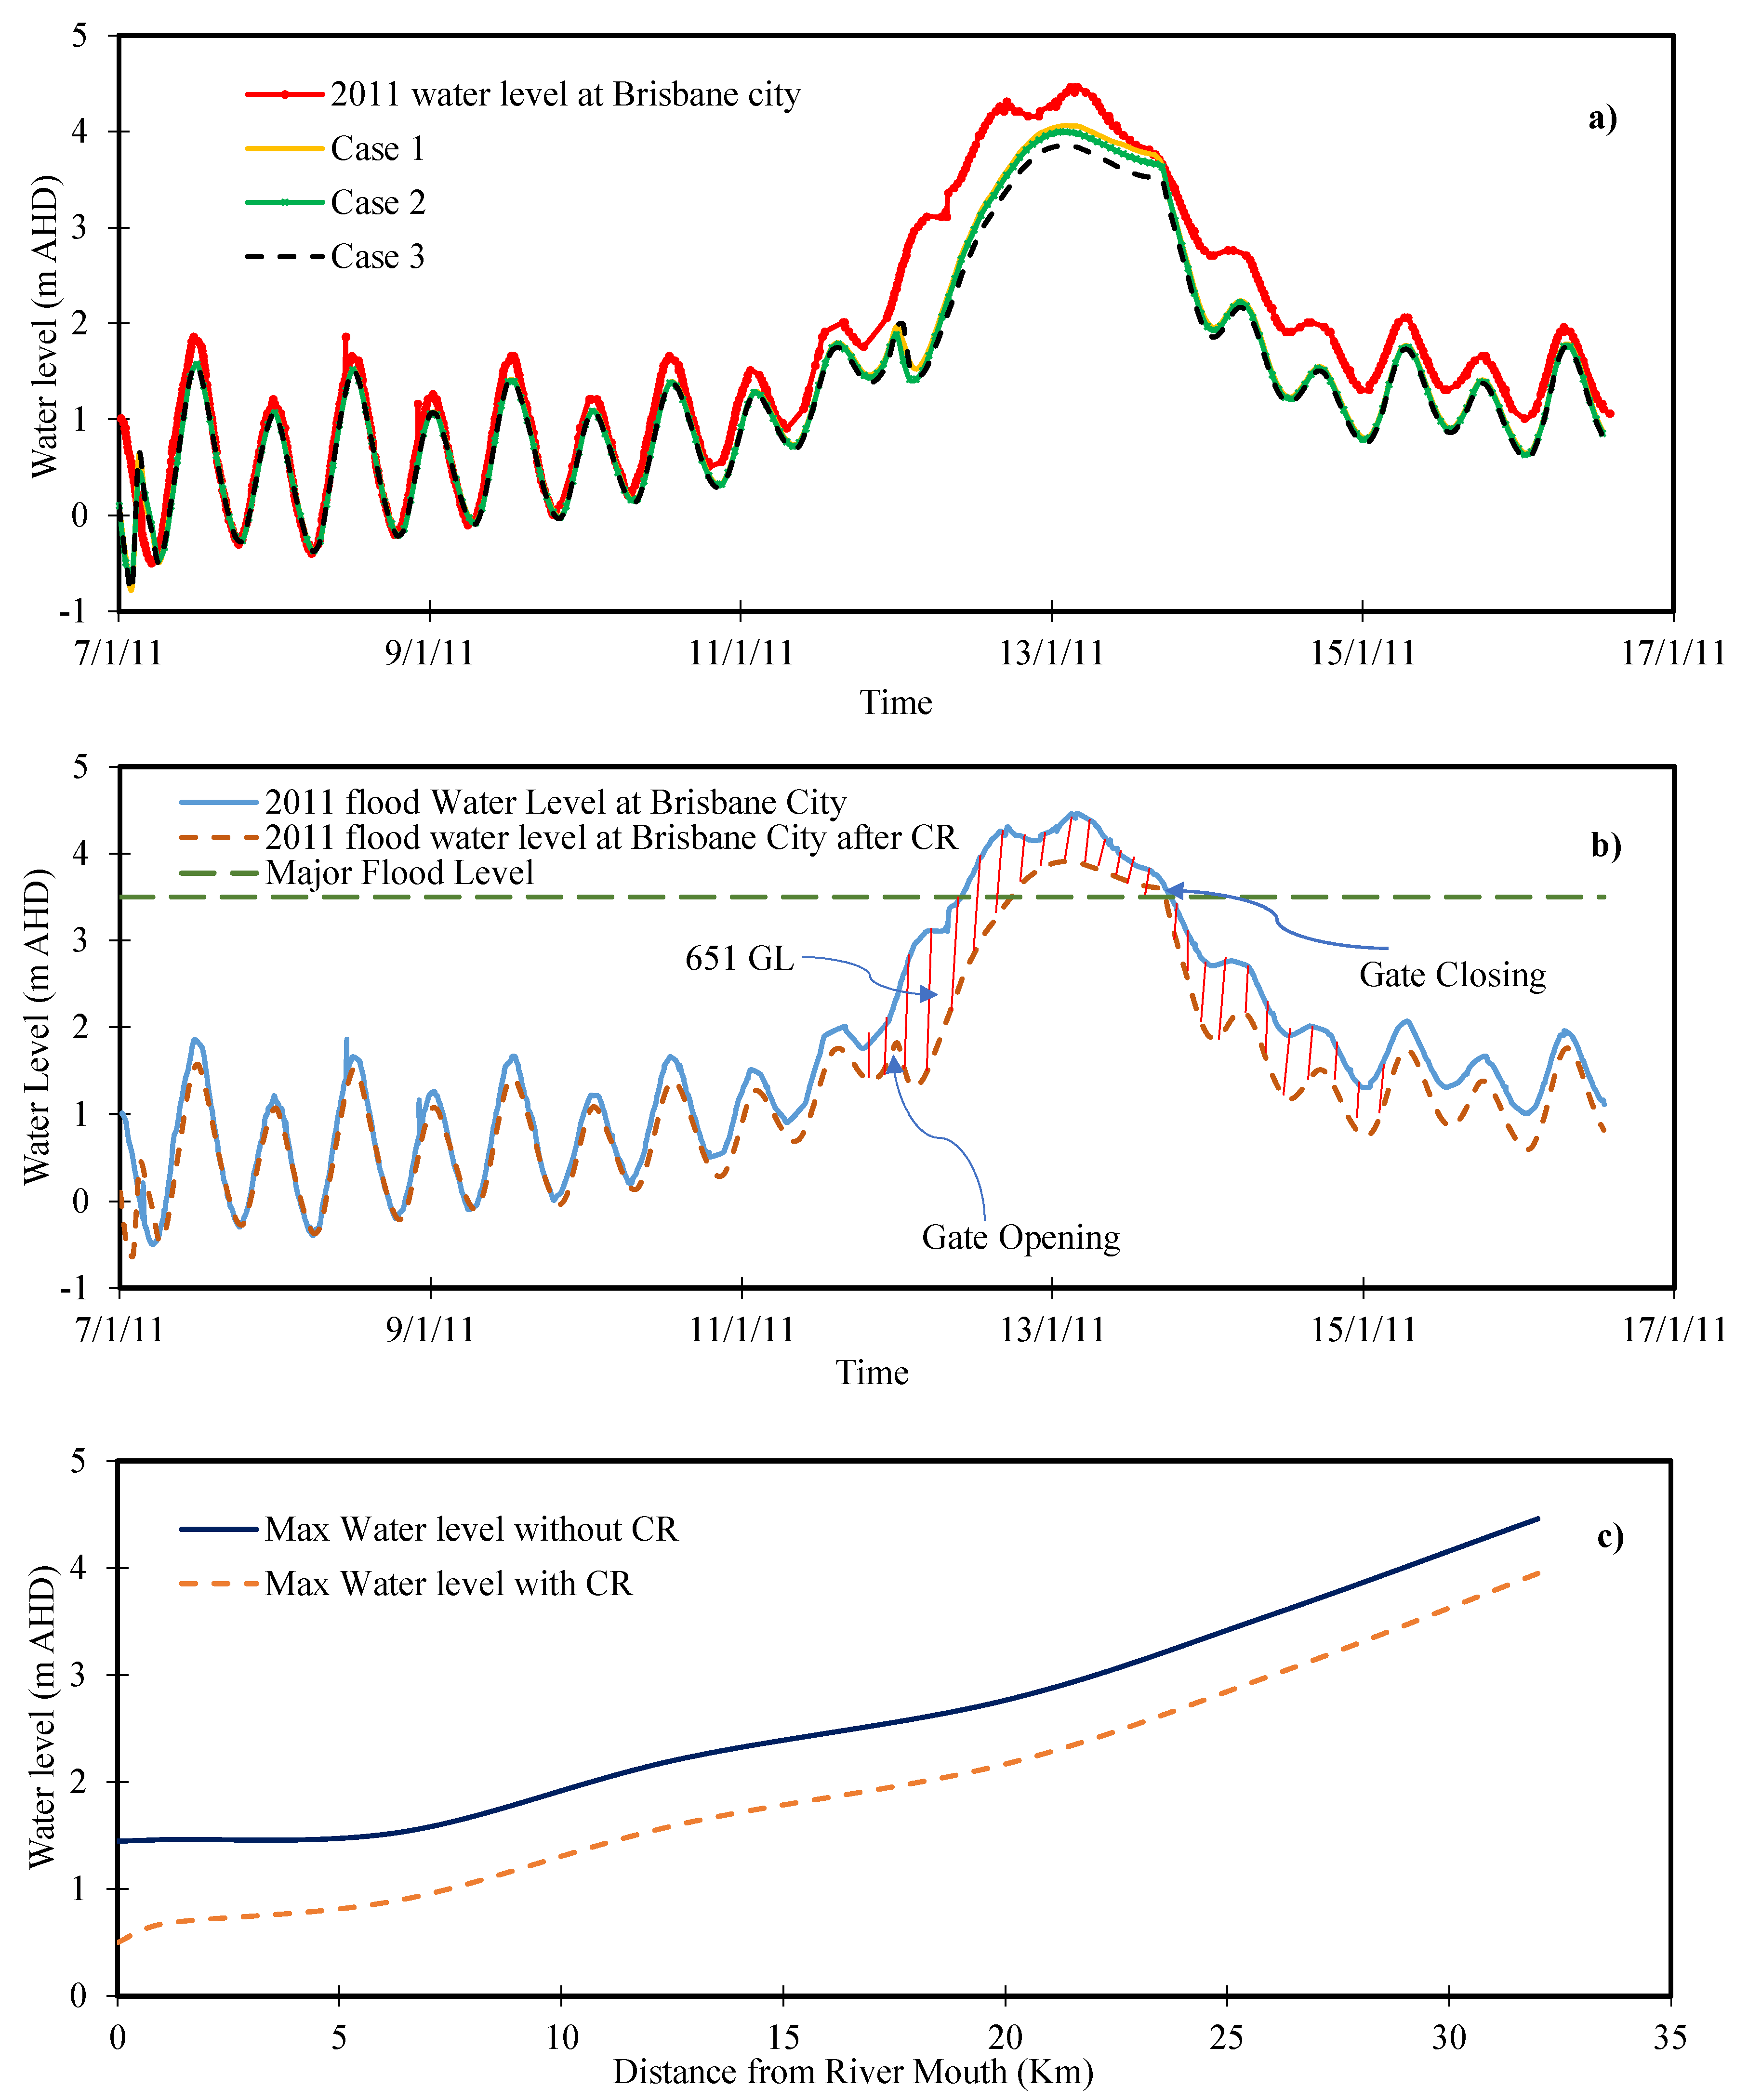
One of the most important concerns of flood control from a CR operation strategies perspective is the peak flood level reduction. It is attained by designating a storage volume in the reservoir and by optimising gate operation. The BRE has a semi-diurnal tidal range, i.e., with two approximately equal high and low tides every 24 h and 50 min. High tides and low tides occur 12 h and 25 min apart. It, therefore, takes 6 h and 12.5 min for the water levels to go from high to low and vice versa, so the water levels keep fluctuating from −0.5 m AHD (low tide) to 1.5 m AHD (high tide) every 6 h and 12.5 min. Considering the tidal range, three gate operation cases were considered viz the CR reservoir system starts its operation when the water level at Brisbane city exceeds 2.5 m, 2.4 m, and 2.3 m AHD, respectively. The floodwater level variation between the three cases was used to compute the effects of a CR operation in the BRE during the 2011 flood (Figure 11a). The model simulations projected that the gate operation effects of the CR on water levels during the 2011 flood high peak would have been substantial across the BRE, with a significant reduction in water level at the Brisbane city gauge. This could be attributable to the complex interfaces between the operation of gates A and B and flood hydrodynamics (e.g., tidally influenced surface gradient and water depth) [43].
Three different gate operation scenarios showed water level reductions of 10, 11, and 13% respectively, as shown in Figure 11a. For example in case 3, at the start of the simulation, with gate A opened and gate B closed, the water level remained almost unaffected in the BRE. This changed on 12 January 2011 at 12:05 am as the gate operation changed. The water level started decreasing due to the increase in flow velocity and reduced friction from tidal water in the BRE. It reduced the peak water level from 4.46 m AHD to 3.88 m AHD, with an overall 0.58 m (13%) reduction in peak water level, while 716 GL of volume adaptation occurred due to the reduction in water level at the Brisbane city gauge as shown in Figure 11b. After opening the CR intake gate, there was a sudden reduction of water at the mouth of the river and a greater mass of water entered the CR. However, after the first drawdown, the flow inside the CR became quite stable and followed a steady pattern. Figure 11c shows the comparison of water levels in the BRE with and without the CR from the Brisbane city gauge to the river mouth. The water level started to converge with a normal water level profile as it moved upstream in the estuary. At the mouth, the water level reduction was 0.95 m AHD while at the Brisbane city gauge it reduced by up to 0.58 m.
During the 2013 flood event, the water level at the Brisbane city gauge was 2.32 m AHD, The analyses of a CR with gate operations show that the 2013 normal flood event would have been reduced to 1.5 m AHD at the Brisbane city gauge. Furthermore, the proposed CR could be used to mitigate future flood events with a magnitude less than or equal to the 2011 flood event.

4.4.2. CR Influence on BRE hydrodynamics under the Improved Operation of Wivenhoe Dam

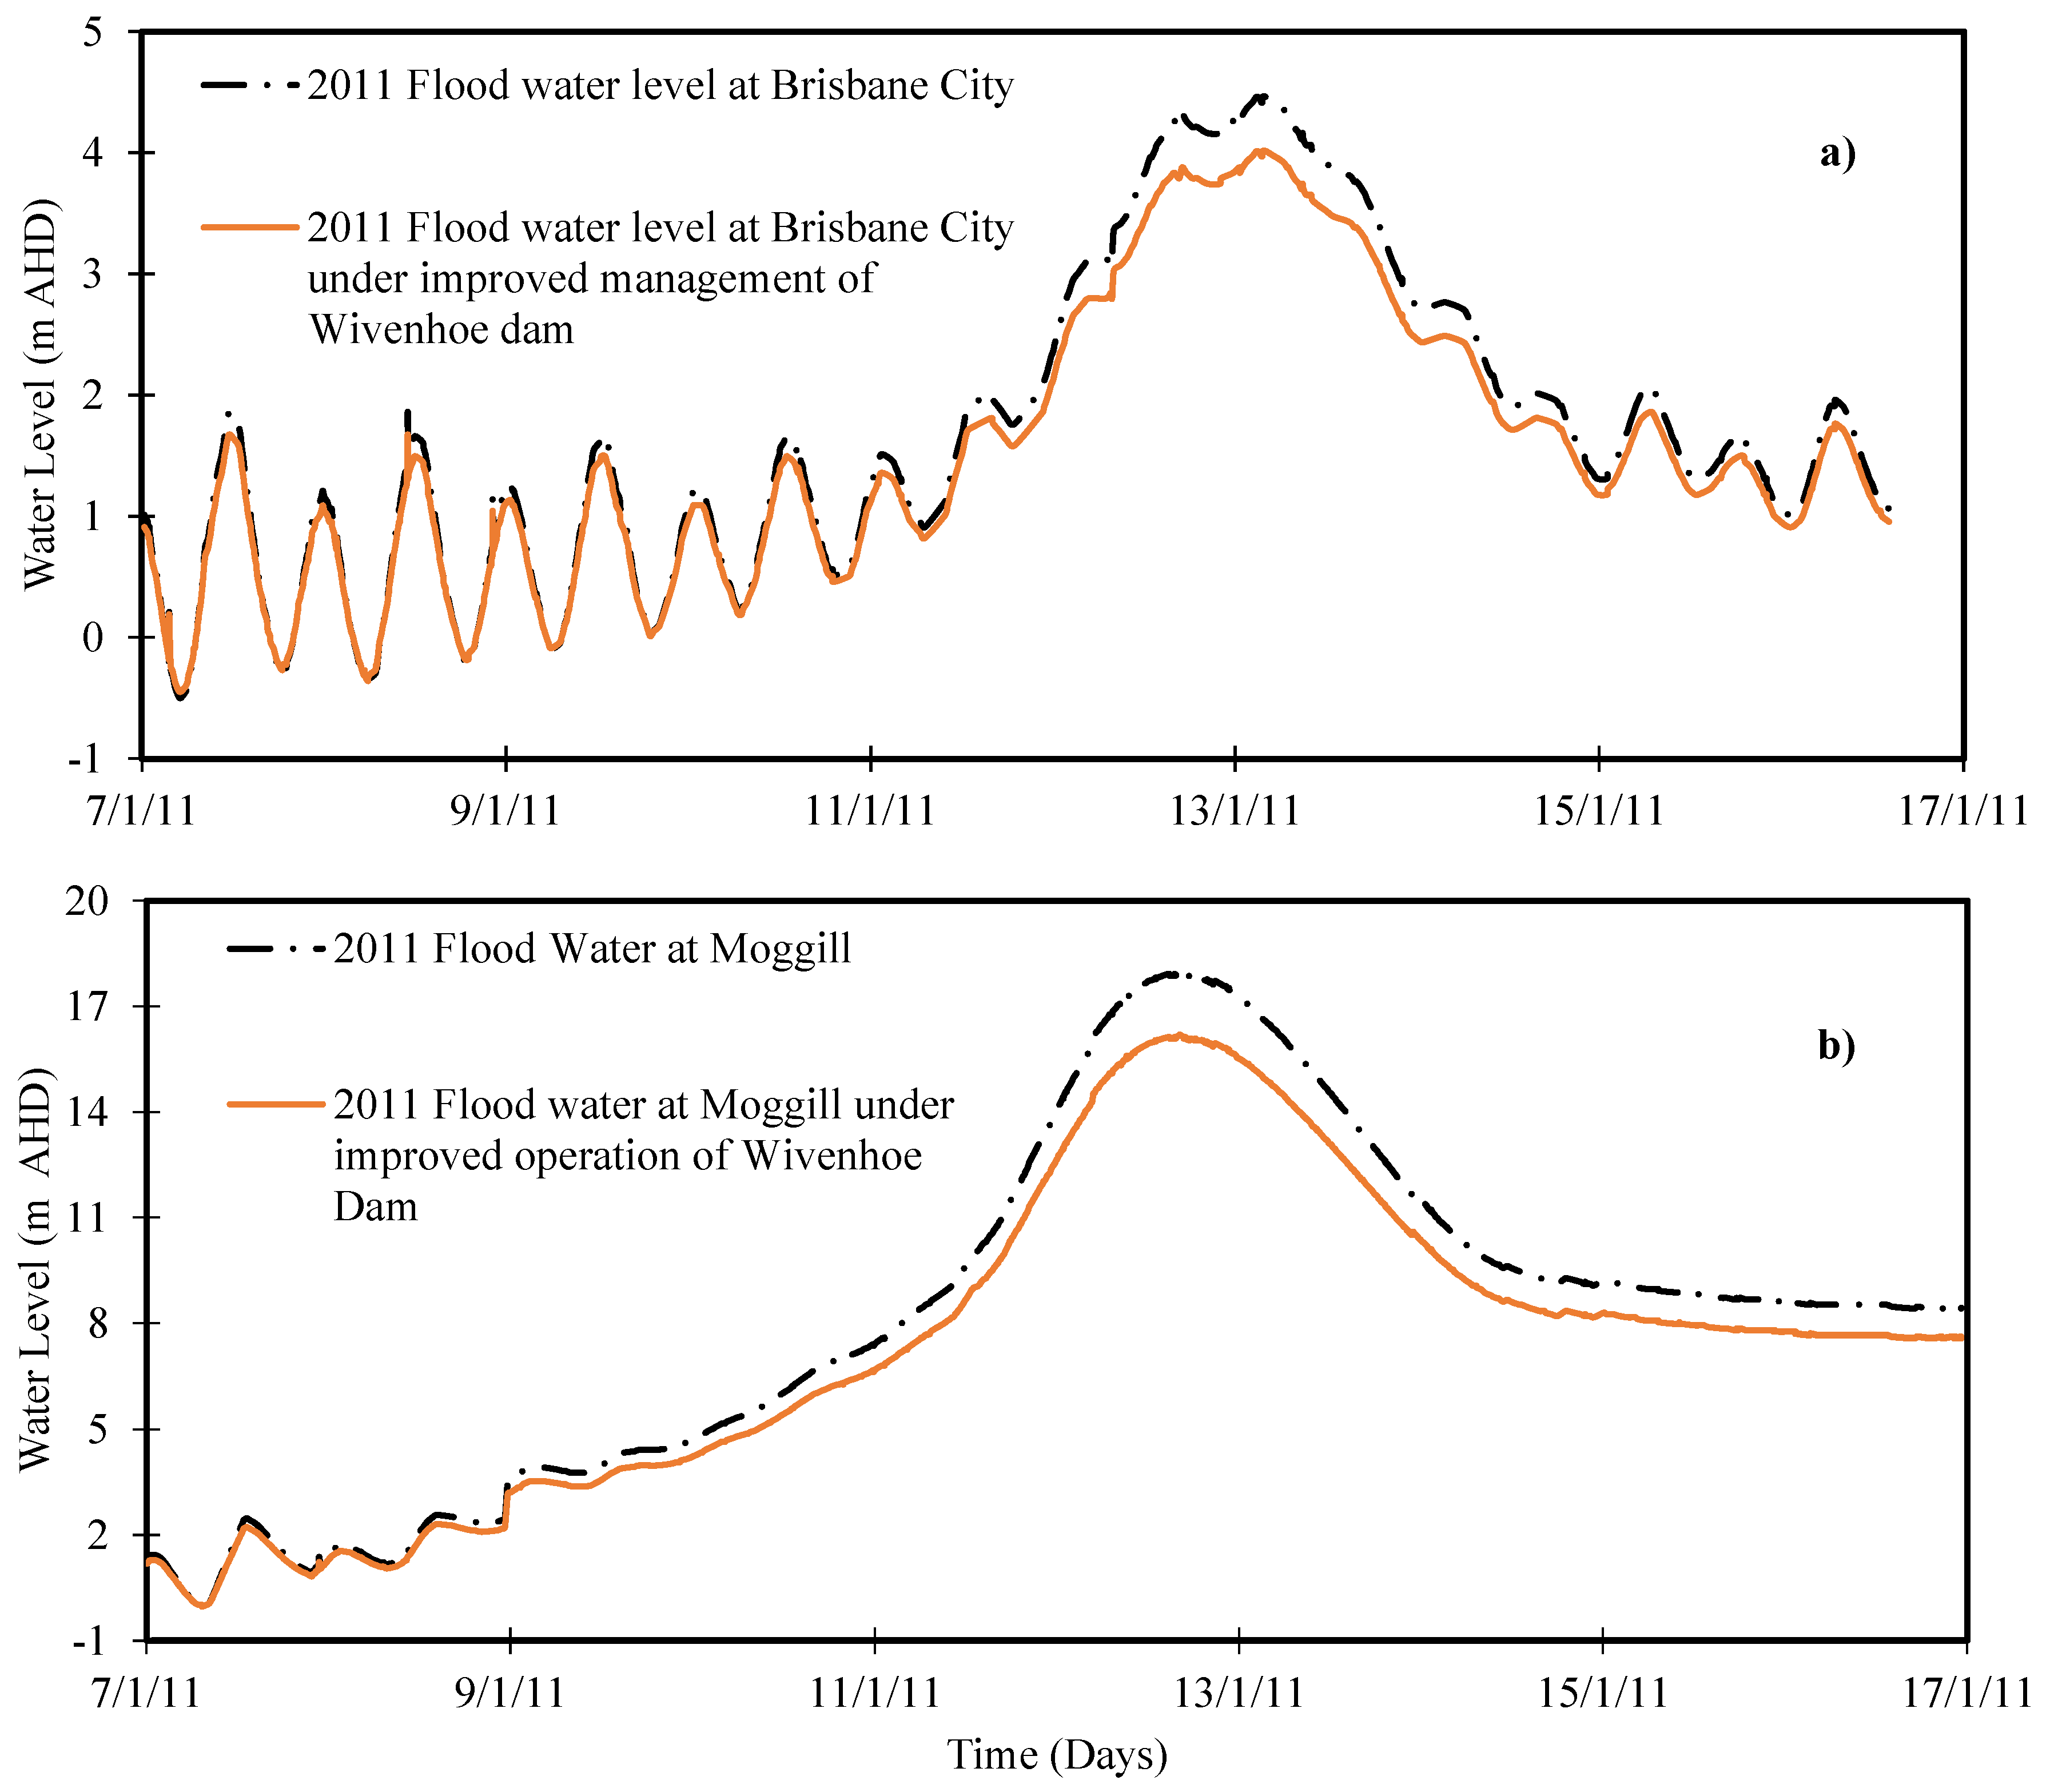
Managing a flood downstream of the Wivenhoe dam involves control of dam releases and downstream catchment flows. The dam operator operates the dam in such a way that the combined flow at Moggill should not be more than 4000 m3/s [52]. Under an improved flood mitigation strategy for the dam, the 2011 flood could have been reduced by 5 to 10%. With the installation of another spillway, the 2011 flood could be reduced up to 12.4%. Taking into account the improved flood management scenario of the Wivenhoe Dam, the flood peak at the Brisbane city gauge for the 2011 flood peak could have been reduced from 4.46 m AHD to approximately 4 m AHD [52], as shown in Figure 12a,b.
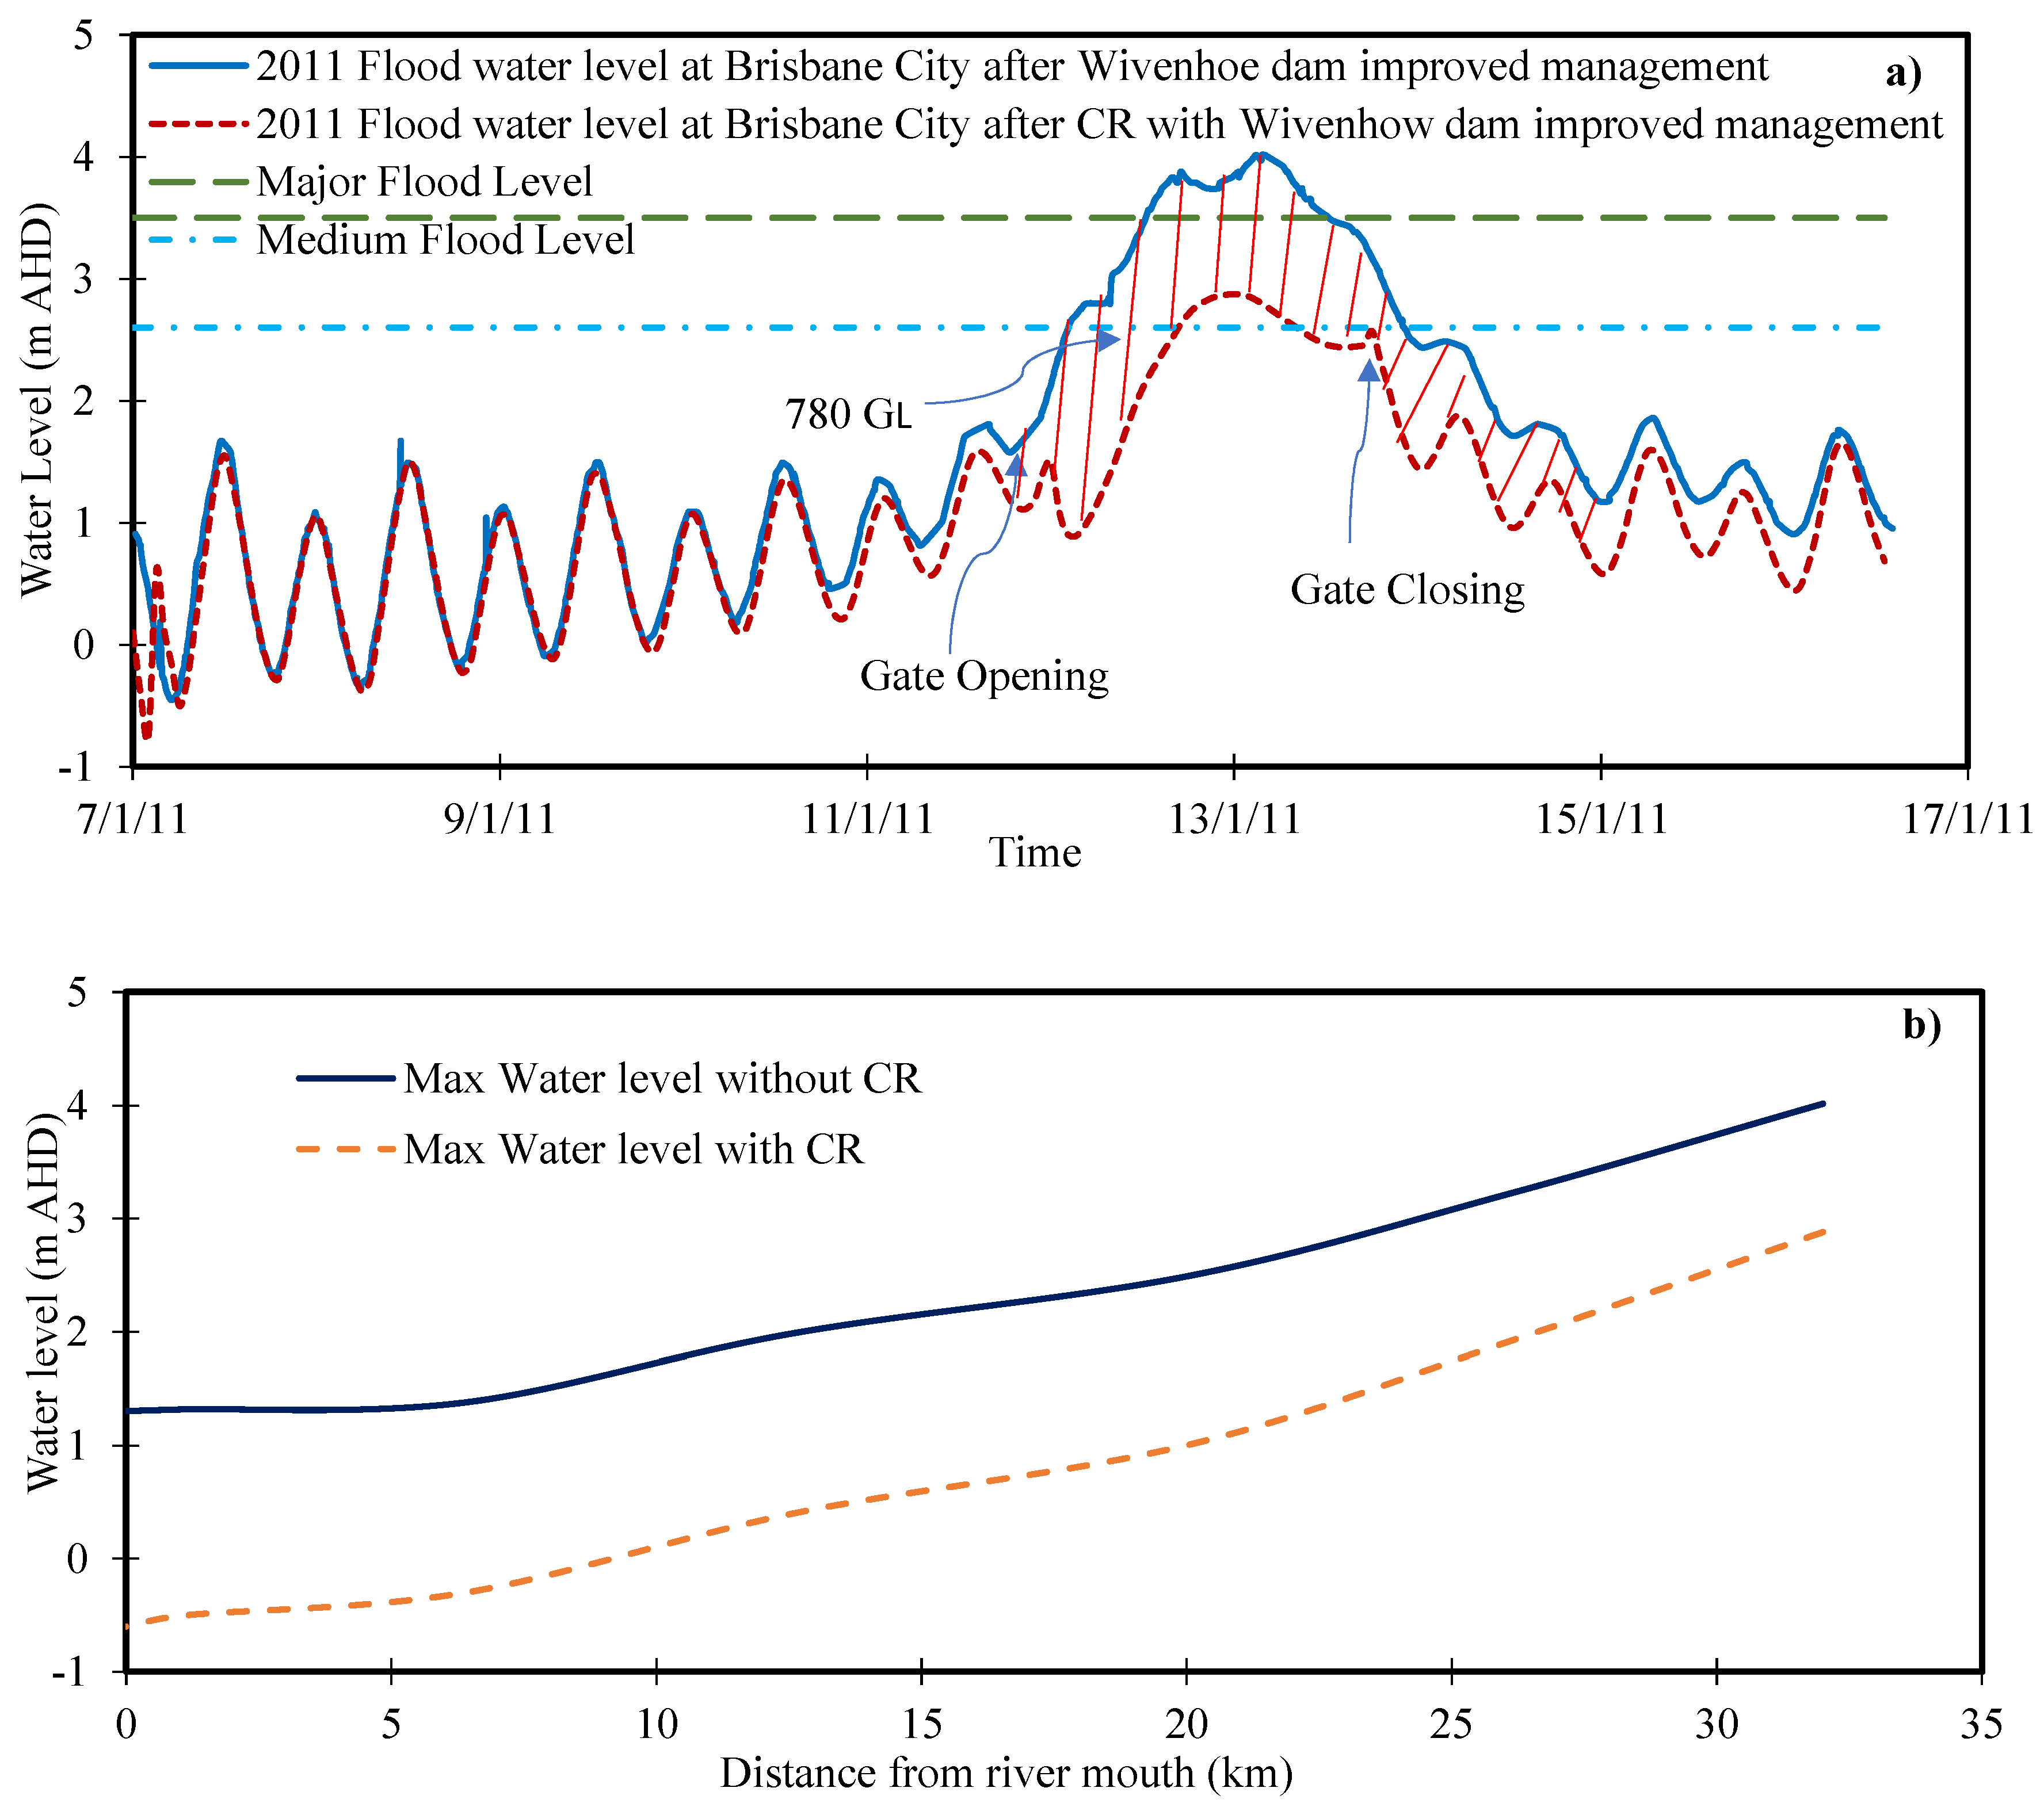
CR operation under the improved flood management regime was analysed with changing upstream boundary conditions at Moggill. Simulation results showed that the peak water level of 4 m at the Brisbane city gauge would have been reduced to 2.87 m AHD (approximately 28.3%) with CR operation, which is substantially below the maximum flood water level (3.5 m AHD), and 780 GL of volume adaptation would have occurred at the Brisbane city gauge due to lowering of the water level there, as shown in Figure 13a. The comparison of water levels in the BRE is shown in Figure 13b, where the negative levels indicate the water level to be below the datum height. At the mouth, the water level reduction was 2 m AHD while at the Brisbane city gauge it reduced up to 1.58 m. It is therefore clear that the operation of a CR under the improved flood management scenario of the Wivenhoe dam would have reduced the flood peak for the 2011 flood to well below the maximum flood water level, which would have significantly reduced infrastructure damage and lives lost.

4.5. Limitation of the Current Model

This study presents Brisbane River hydrodynamics and a conceptual model for CR simulation for flood adaptation in the BRE. The study will be required for detail design of CR parameters and location. This study has not considered environmental and social effects. Further, the model has provided only a few scenarios of gate operations for flow routing into the reservoir due to simulation time constraints. The behaviour of the CR gate operations for a sudden drawdown at the river mouth and outlet gates for pumping water out of the CR would require detailed simulation. Therefore a further study is planned to consider these aspects in a more precise simulation of the hydrodynamic process.

5. Conclusions

To mitigate coastal city’s flood disaster, it is essential to control the downstream flood, as upstream dams can only regulate the flood upstream from the dam. In this study, we analysed the feasibility of a proposed CR at the river mouth in Moreton Bay to mitigate the excess floodwater in the BRE. The major flood of 2011 was simulated and a CR operation was analysed under two scenarios using MIKE 21 software.
  • The 2D hydrodynamic model was calibrated and validated for the 2013 and 2011 flood events respectively, with a Nash–Sutcliffe coefficient (Ens) between 0.87 and 0.97 at all gauges; and the maximum water level variance between the measured and simulated data within 0.06 m at the Brisbane city gauge and well-matched at all other stations. This confirmed that the current MIKE 21 model can dynamically simulate the flooding process in the BRE.
  • The simulation of the river mouth right branch widening and dredging showed a 0.16 m reduction in water level at the Brisbane city gauge.
  • The operation of the tidal and CR intake gates showed that the 2011 normal observed flood level (4.46 m AHD) could have been reduced to 3.88 m AHD.
  • Under the improved management regime of the Wivenhoe Dam, the flood level would have been 4 m AHD, but with the suitable operation of the CR gates, the flood level could have been reduced to 2.87 m AHD at the Brisbane city gauge, which is well below the maximum allowable flood water level of 3.5 m AHD.
  • The simulation results showed that during a high flood, the operation of the CR gates would accelerate water flow towards the CR due to the enlarged frictional damping of the tidal wave and an increase in flow velocity. The regulation of the CR could play a significant part in floodwater adaptation. This preliminary investigation provides a promising way for other coastal cities to mitigate the flood disasters that are threatened by climate change and sea-level rise. However, further study is required to achieve the optimization of gate operations for water level reduction in such a complex system. A CR has great potential to modify the flood of the Brisbane catchment and thus to mitigate BRE flood disasters.

Author Contributions

U.K.: Conceptualization, methodology, writing—original draft, review editing and investigation. S.-Q.Y.: Conceptualization, review, editing, and supervision. M.S. (Muttucumaru Sivakumar). Review editing and supervision. K.E.: Review, editing and supervision. M.S. (Mariam Sajid): Investigation, writing, review and editing. M.Z.B.R.: Review and editing. All authors have read and agreed to the published version of the manuscript.

Funding

This research received no external funding.

Acknowledgments

The authors would like to thank the Queensland Government Departments for providing all necessary input data. Special thanks are to Daryl Metters (Department of Environment and Science), Jim Fear (SEQ Water), Paul Boswood (Department of Environment and Science), Paul Birch (Bureau of Meteorology) and Paul Finger (Maritime Safety Queensland). We are thankful to DHI for providing the MIKE 21 license. The authors would also like to thank Caroline Lai and Méven Robin Huiban for providing the technical support for MIKE 21 and Lou Madjeric for reviewing the paper.

Conflicts of Interest

The authors declare no conflict of interest.

References

  1. Wadey, M.; Brown, S.; Nicholls, R.J.; Haigh, I. Coastal flooding in the Maldives: An assessment of historic events and their implications. Nat. Hazards 2017, 89, 131–159. [Google Scholar] [CrossRef] [Green Version]
  2. Sadler, J.M.; Goodall, J.L.; Behl, M.; Bowes, B.D.; Morsy, M.M. Exploring real-time control of stormwater systems for mitigating flood risk due to sea level rise. J. Hydrol. 2020, 583, 124571. [Google Scholar] [CrossRef]
  3. Neumann, J.E.; Price, J.; Chinowsky, P.; Wright, L.; Ludwig, L.; Streeter, R.; Jones, R.; Smith, J.B.; Perkins, W.; Jantarasami, L.; et al. Climate change risks to US infrastructure: Impacts on roads, bridges, coastal development, and urban drainage. Clim. Chang. 2014, 131, 97–109. [Google Scholar] [CrossRef] [Green Version]
  4. Gao, C.; He, Z.; Pan, S.; Xuan, W.; Xu, Y.-P. Effects of climate change on peak runoff and flood levels in Qu River Basin, East China. J. Hydro-Environ. Res. 2020, 28, 34–47. [Google Scholar] [CrossRef]
  5. Esteban, M.; Takagi, H.; Mikami, T.; Aprilia, A.; Fujii, D.; Kurobe, S.; Utama, N.A. Awareness of coastal floods in impoverished subsiding coastal communities in Jakarta: Tsunamis, typhoon storm surges and dyke-induced tsunamis. Int. J. Disaster Risk Reduct. 2017, 23, 70–79. [Google Scholar] [CrossRef]
  6. Van Coppenolle, R.; Temmerman, S. A global exploration of tidal wetland creation for nature-based flood risk mitigation in coastal cities. Estuar. Coast. Shelf Sci. 2019, 226, 106262. [Google Scholar] [CrossRef]
  7. Ghozali, A.; Sukmara, R.B.; Aulia, B.U. A comparative study of climate change mitigation and adaptation on flood management between Ayutthaya City (Thailand) and Samarinda City (Indonesia). Procedia Soc. Behav. Sci. 2016, 227, 424–429. [Google Scholar] [CrossRef] [Green Version]
  8. Vo, N.D.; Gourbesville, P.; Vu, M.T.; Raghavan, S.V.; Liong, S.-Y. A deterministic hydrological approach to estimate climate change impact on river flow: Vu Gia–Thu Bon catchment, Vietnam. J. Hydro Environ. Res. 2016, 11, 59–74. [Google Scholar] [CrossRef]
  9. Tsoukala, V.K.; Chondros, M.; Kapelonis, Z.G.; Martzikos, N.; Lykou, A.; Belibassakis, K.; Makropoulos, C. An integrated wave modelling framework for extreme and rare events for climate change in coastal areas–the case of Rethymno, Crete. Oceanologia 2016, 58, 71–89. [Google Scholar] [CrossRef] [Green Version]
  10. McCallum, I.; Liu, W.; See, L.; Mechler, R.; Keating, A.; Hochrainer-Stigler, S.; Mochizuki, J.; Fritz, S.; Dugar, S.; Arestegui, M. Technologies to support community flood disaster risk reduction. Int. J. Disaster Risk Sci. 2016, 7, 198–204. [Google Scholar] [CrossRef] [Green Version]
  11. UNISDR. Global Assessment Report on Disaster Risk Reduction 2015: Making Development Sustainable: The Future of Disaster Risk Management; United Nations International Strategy for Disaster Reduction 2015; UNDRR: Geneva, Switzerland, 2015. [Google Scholar]
  12. Lee, E.H.; Kim, J.H. Development of a flood-damage-based flood forecasting technique. J. Hydrol. 2018, 563, 181–194. [Google Scholar] [CrossRef]
  13. Vu, T.T.; Ranzi, R. Flood risk assessment and coping capacity of floods in central Vietnam. J. Hydro Environ. Res. 2017, 14, 44–60. [Google Scholar] [CrossRef]
  14. Sulis, A.; Frongia, S.; Liberatore, S.; Zucca, R.; Sechi, G.M. Combining water supply and flood control purposes in the Coghinas Basin (Sardinia, Italy). Int. J. River Basin Manag. 2020, 18, 13–22. [Google Scholar] [CrossRef]
  15. Hallegatte, S.; Green, C.; Nicholls, R.J.; Corfee-Morlot, J. Future flood losses in major coastal cities. Nat. Clim. Chang. 2013, 3, 802. [Google Scholar] [CrossRef]
  16. Marks, D.; Thomalla, F. Responses to the 2011 floods in Central Thailand: Perpetuating the vulnerability of small and medium enterprises? Nat. Hazards 2017, 87, 1147–1165. [Google Scholar] [CrossRef]
  17. Syme, B.; Wallace, S.; Rodgers, B.; Jensen, R.; Barton, C. Executive Summary and Recommendations Brisbane River Strategic Floodplain Management Plan; BMT WBM: Brisbane, QLD, Australia, 2019. [Google Scholar]
  18. Barton, C.; Wallace, S.; Syme, B.; Wong, W.T.; Onta, P. Brisbane River Catchment Flood Study: Comprehensive Hydraulic Assessment Overview. In Proceedings of the Floodplain Management Association National Conference, Brisbane, Australia, 19–22 May 2015. [Google Scholar]
  19. Van den Honert, R.C.; McAneney, J. The 2011 Brisbane floods: Causes, impacts and implications. Water 2011, 3, 1149–1173. [Google Scholar] [CrossRef] [Green Version]
  20. Pellikka, H.; Leijala, U.; Johansson, M.M.; Leinonen, K.; Kahma, K.K. Future probabilities of coastal floods in Finland. Cont. Shelf Res. 2018, 157, 32–42. [Google Scholar] [CrossRef]
  21. Ogie, R.I.; Holderness, T.; Dunn, S.; Turpin, E. Assessing the vulnerability of hydrological infrastructure to flood damage in coastal cities of developing nations. Comput. Environ. Urban Syst. 2018, 68, 97–109. [Google Scholar] [CrossRef] [Green Version]
  22. Hayashi, S.; Murakami, S.; Xu, K.-Q.; Watanabe, M. Effect of the Three Gorges Dam Project on flood control in the Dongting Lake area, China, in a 1998-type flood. J. Hydro Environ. Res. 2008, 2, 148–163. [Google Scholar] [CrossRef]
  23. Rogers, R.A.; Schutten, J.K. The Gender of Water and the Pleasure of Alienation: A Critical Analysis of Visiting Hoover Dam. Commun. Rev. 2004, 7, 259–283. [Google Scholar] [CrossRef] [Green Version]
  24. Liu, Y.; Yang, S.-Q.; Jiang, C.; Sivakumar, M.; Enever, K.; Long, Y.; Deng, B.; Khalil, U.; Yin, L. Flood Mitigation Using an Innovative Flood Control Scheme in a Large Lake: Dongting Lake, China. Appl. Sci. 2019, 9, 2465. [Google Scholar] [CrossRef] [Green Version]
  25. Ralston, D.K.; Talke, S.; Geyer, W.R.; Al-Zubaidi, H.A.; Sommerfield, C.K. Bigger tides, less flooding: Effects of dredging on barotropic dynamics in a highly modified estuary. J. Geophys. Res. Ocean. 2019, 124, 196–211. [Google Scholar] [CrossRef] [Green Version]
  26. Athanasopoulou, E. Urban Coastal Flood Mitigation Strategies for the City of Hoboken & Jersey City, New Jersey. Ph.D. Thesis, Rutgers University-Graduate School-New Brunswick, Rutgers University, New Brunswick, NJ, USA, 2017. [Google Scholar]
  27. Zheng, F.; Westra, S.; Sisson, S.A. Quantifying the dependence between extreme rainfall and storm surge in the coastal zone. J. Hydrol. 2013, 505, 172–187. [Google Scholar] [CrossRef]
  28. Hawkes, P.; Svensson, C. Joint Probability: Dependence mapping and best practice. R&D Technical Report FD2308/T02-06-16. 2006. Available online: http://evidence.environment-agency.gov.uk/FCERM/Libraries/FCERM_Project_Documents/FD2308_3431_FRP_pdf.sflb.ashx (accessed on 16 September 2020).
  29. Svensson, C.; Jones, D.A. Dependence between sea surge, river flow and precipitation in south and west Britain. Hydrol. Earth Syst. Sci. 2004, 8, 973–992. [Google Scholar] [CrossRef] [Green Version]
  30. Ayre, R.; Diermanse, F.; Hart, P. Brisbane River Catchment Flood Study: Comprehensive Hydrologic Assessment; Aurecon Australasia: Brisbane, QLD, Australia, 2017. [Google Scholar]
  31. Queensland Floods Commission Inquiry Report. Queensland Floods Commission of Inquiry, Complete List of Final Report Recommendations; Queensland Floods Commission Inquiry: Brisbane, QLD, Australia, 2011. [Google Scholar]
  32. Yang, S.-Q. A preliminary feasibility study for a backup water supply-coastal reservoir in Southeast Queensland, Australia. J. Water Supply Res. Technol. Aqua 2015, 64, 470–485. [Google Scholar] [CrossRef]
  33. Yang, S.-Q. Coastal Reservoir-to Supply SE Queensland Sufficient Freshwater from the Sea without Desalination. In Proceedings of the Twelfth ISOPE Pacific/Asia Offshore Mechanics Symposium, Gold Coast, Australia, 4–7 October 2016. [Google Scholar]
  34. Sitharam, T.G.; Yang, S.-Q.; Falconer, R.; Sivakumar, M.; Jones, B.; Kolathayar, S.; Sinpoh, L. Sustainable Water Resource Development using Coastal Reservoirs, 1st ed.; Elsevier: Amsterdam, The Netherlands, 2020. [Google Scholar]
  35. Liu, J.; Yang, S.-Q.; Jiang, C. Coastal reservoirs strategy for water resource development—A review of future trend. J. Water Res. Prot. 2013, 5, 336–342. [Google Scholar] [CrossRef] [Green Version]
  36. Harley, B. Singapore’s Marina Barrage and Reservoir–Changing Mindsets in Urban Solutions; IWA Publishing: London, UK, 2011. [Google Scholar]
  37. Eyre, B.; Hossain, S.; McKee, L. A suspended sediment budget for the modified subtropical Brisbane River estuary, Australia. Estuar. Coast. Shelf Sci. 1998, 47, 513–522. [Google Scholar] [CrossRef]
  38. Wolanski, E. Estuaries of Australia in 2050 and Beyond; Springer: Berlin, Germany, 2014. [Google Scholar]
  39. Dennison, W.C.; Abal, E.G. Moreton Bay Study: A Scientific Basis for the Healthy Waterways Campaign; South East Qld Regional Water Quality Management Strategy Team: Brisbane, QLD, Australia, 1999. [Google Scholar]
  40. Syme, B.; Wallace, S.; Rodgers, B.; Jensen, R.; Barton, C. Milestone Report 1: Data Review and Modelling Methodology; BMT WBM: Brisbane, QLD, Australia, 2017. [Google Scholar]
  41. Babister, M.; Retallick, M. Queensland Flood Commission of Inquiry Final Report Brisbane River 2011 Flood Event—Flood Frequency Analysis; WMA Water: Sydney, NSW, Australia, 2011. [Google Scholar]
  42. DHI. MIKE 21 & MIKE 3 Flow Model FM Hydrodynamic and Transport Module Scientific Documentation; DHI: Horsholm, Denmark, 2017. [Google Scholar]
  43. Li, Y.; Zhang, Q.; Tan, Z.; Yao, J.J.J.o.H. On the hydrodynamic behavior of floodplain vegetation in a flood-pulse-influenced river-lake system (Poyang Lake, China). J. Hydrol. 2020, 585, 124852. [Google Scholar] [CrossRef]
  44. Haldar, R.; Khosa, R.; Gosain, A. Impact of Anthropogenic Interventions on the Vembanad Lake System. In Water Resources and Environmental Engineering, 1st ed.; Springer: Berlin, Germany, 2019; pp. 9–29. [Google Scholar]
  45. Liu, J.; Sivakumar, M.; Yang, S.; Jones, B.G. Salinity Modelling and Management of the Lower Lakes of the Murray–Darling Basin, Australia. Water Pollut. XIV 2018, 228, 257–268. [Google Scholar]
  46. Liu, X.; Lim, S. Flood Inundation Modelling for Mid-Lower Brisbane Estuary. River Res. Appl. 2017, 33, 415–426. [Google Scholar] [CrossRef]
  47. Barton, C.; Syme, B.; Ryan, J.; Rodgers, B.; Jensen, R. Milestone Report 2: Fast Model Development and Calibration Comprehensive Hydraulic Assessment; BMT WBM: Brisbane, QLD, Australia, 2017. [Google Scholar]
  48. DHI. MIKE 21 Flow Model FM; DHI: Horsholm, Denmark, 2017. [Google Scholar]
  49. Yu, Y. Numerical Study of Hydrodynamic and Sediment Transport Within the Brisbane River Estuary and Moreton Bay. Ph.D. Thesis, Griffith School of Engineering, Griffith University, Brisbane, QLD, Australia, 2017. [Google Scholar]
  50. Yuan, J.Z.; Wu, C.E. Shanghai Coastal Reservoirs: Their Development and Experience from Their Design. HydrolinkIahrCoast. Reserv. Number 2018, 10–13. [Google Scholar] [CrossRef] [Green Version]
  51. Yang, S.-Q.; Liu, P.-W. Strategy of water pollution prevention in Taihu Lake and its effects analysis. J. Great Lakes Res. 2010, 36, 150–158. [Google Scholar] [CrossRef] [Green Version]
  52. Queensland Government Department of Energy and Water Supply. Prefeasibility Investigation into Flood Mitigation Storage Infrastructure for Brisbane; Depertment of Energy and Water Supply: Brisbane, QLD, Australia, 2014. [Google Scholar]
  53. Barton, C.; Syme, B.; Ryan, J.; Rodgers, B.; Jensen, R. Milestone Report 3: Detailed Model Development and Calibration Comprehensive Hydraulic Assessment; BMT WBM: Brisbane, QLD, Australia, 2017. [Google Scholar]
  54. Chanson, H. The 2010–2011 Floods in Queensland (Australia): Photographic Observations, Comments and Personal Experience; The University of Queensland: Brisbane, QLD, Australia, 2011. [Google Scholar]
  55. Cai, H.; Yang, Q.; Zhang, Z.; Guo, X.; Liu, F.; Ou, S. Impact of River-Tide Dynamics on the Temporal-Spatial Distribution of Residual Water Level in the Pearl River Channel Networks. Estuaries Coasts 2018, 41, 1885–1903. [Google Scholar] [CrossRef]
  56. Vellinga, N.E.; Hoitink, A.J.F.; van der Vegt, M.; Zhang, W.; Hoekstra, P. Human impacts on tides overwhelm the effect of sea level rise on extreme water levels in the Rhine–Meuse delta. Coast. Eng. 2014, 90, 40–50. [Google Scholar] [CrossRef]
  57. Jay, D.A.; Borde, A.B.; Diefenderfer, H.L. Tidal-Fluvial and Estuarine Processes in the Lower Columbia River: II. Water Level Models, Floodplain Wetland Inundation, and System Zones. Estuaries Coasts 2016, 39, 1299–1324. [Google Scholar] [CrossRef] [Green Version]
  58. Helaire, L.T.; Talke, S.A.; Jay, D.A.; Mahedy, D. Historical Changes in Lower Columbia River and Estuary Floods: A Numerical Study. J. Geophys. Res. Ocean. 2019, 124, 7926–7946. [Google Scholar] [CrossRef]
  59. le Ngo, L.; Madsen, H.; Rosbjerg, D.; Pedersen, C.B. Application of MIKE 11 in Managing Reservoir Operation. In Proceedings of the International Conference on Reservoir Operation and River Management, Guangzhou, China, 17–23 September 2005; pp. 1–9. [Google Scholar]
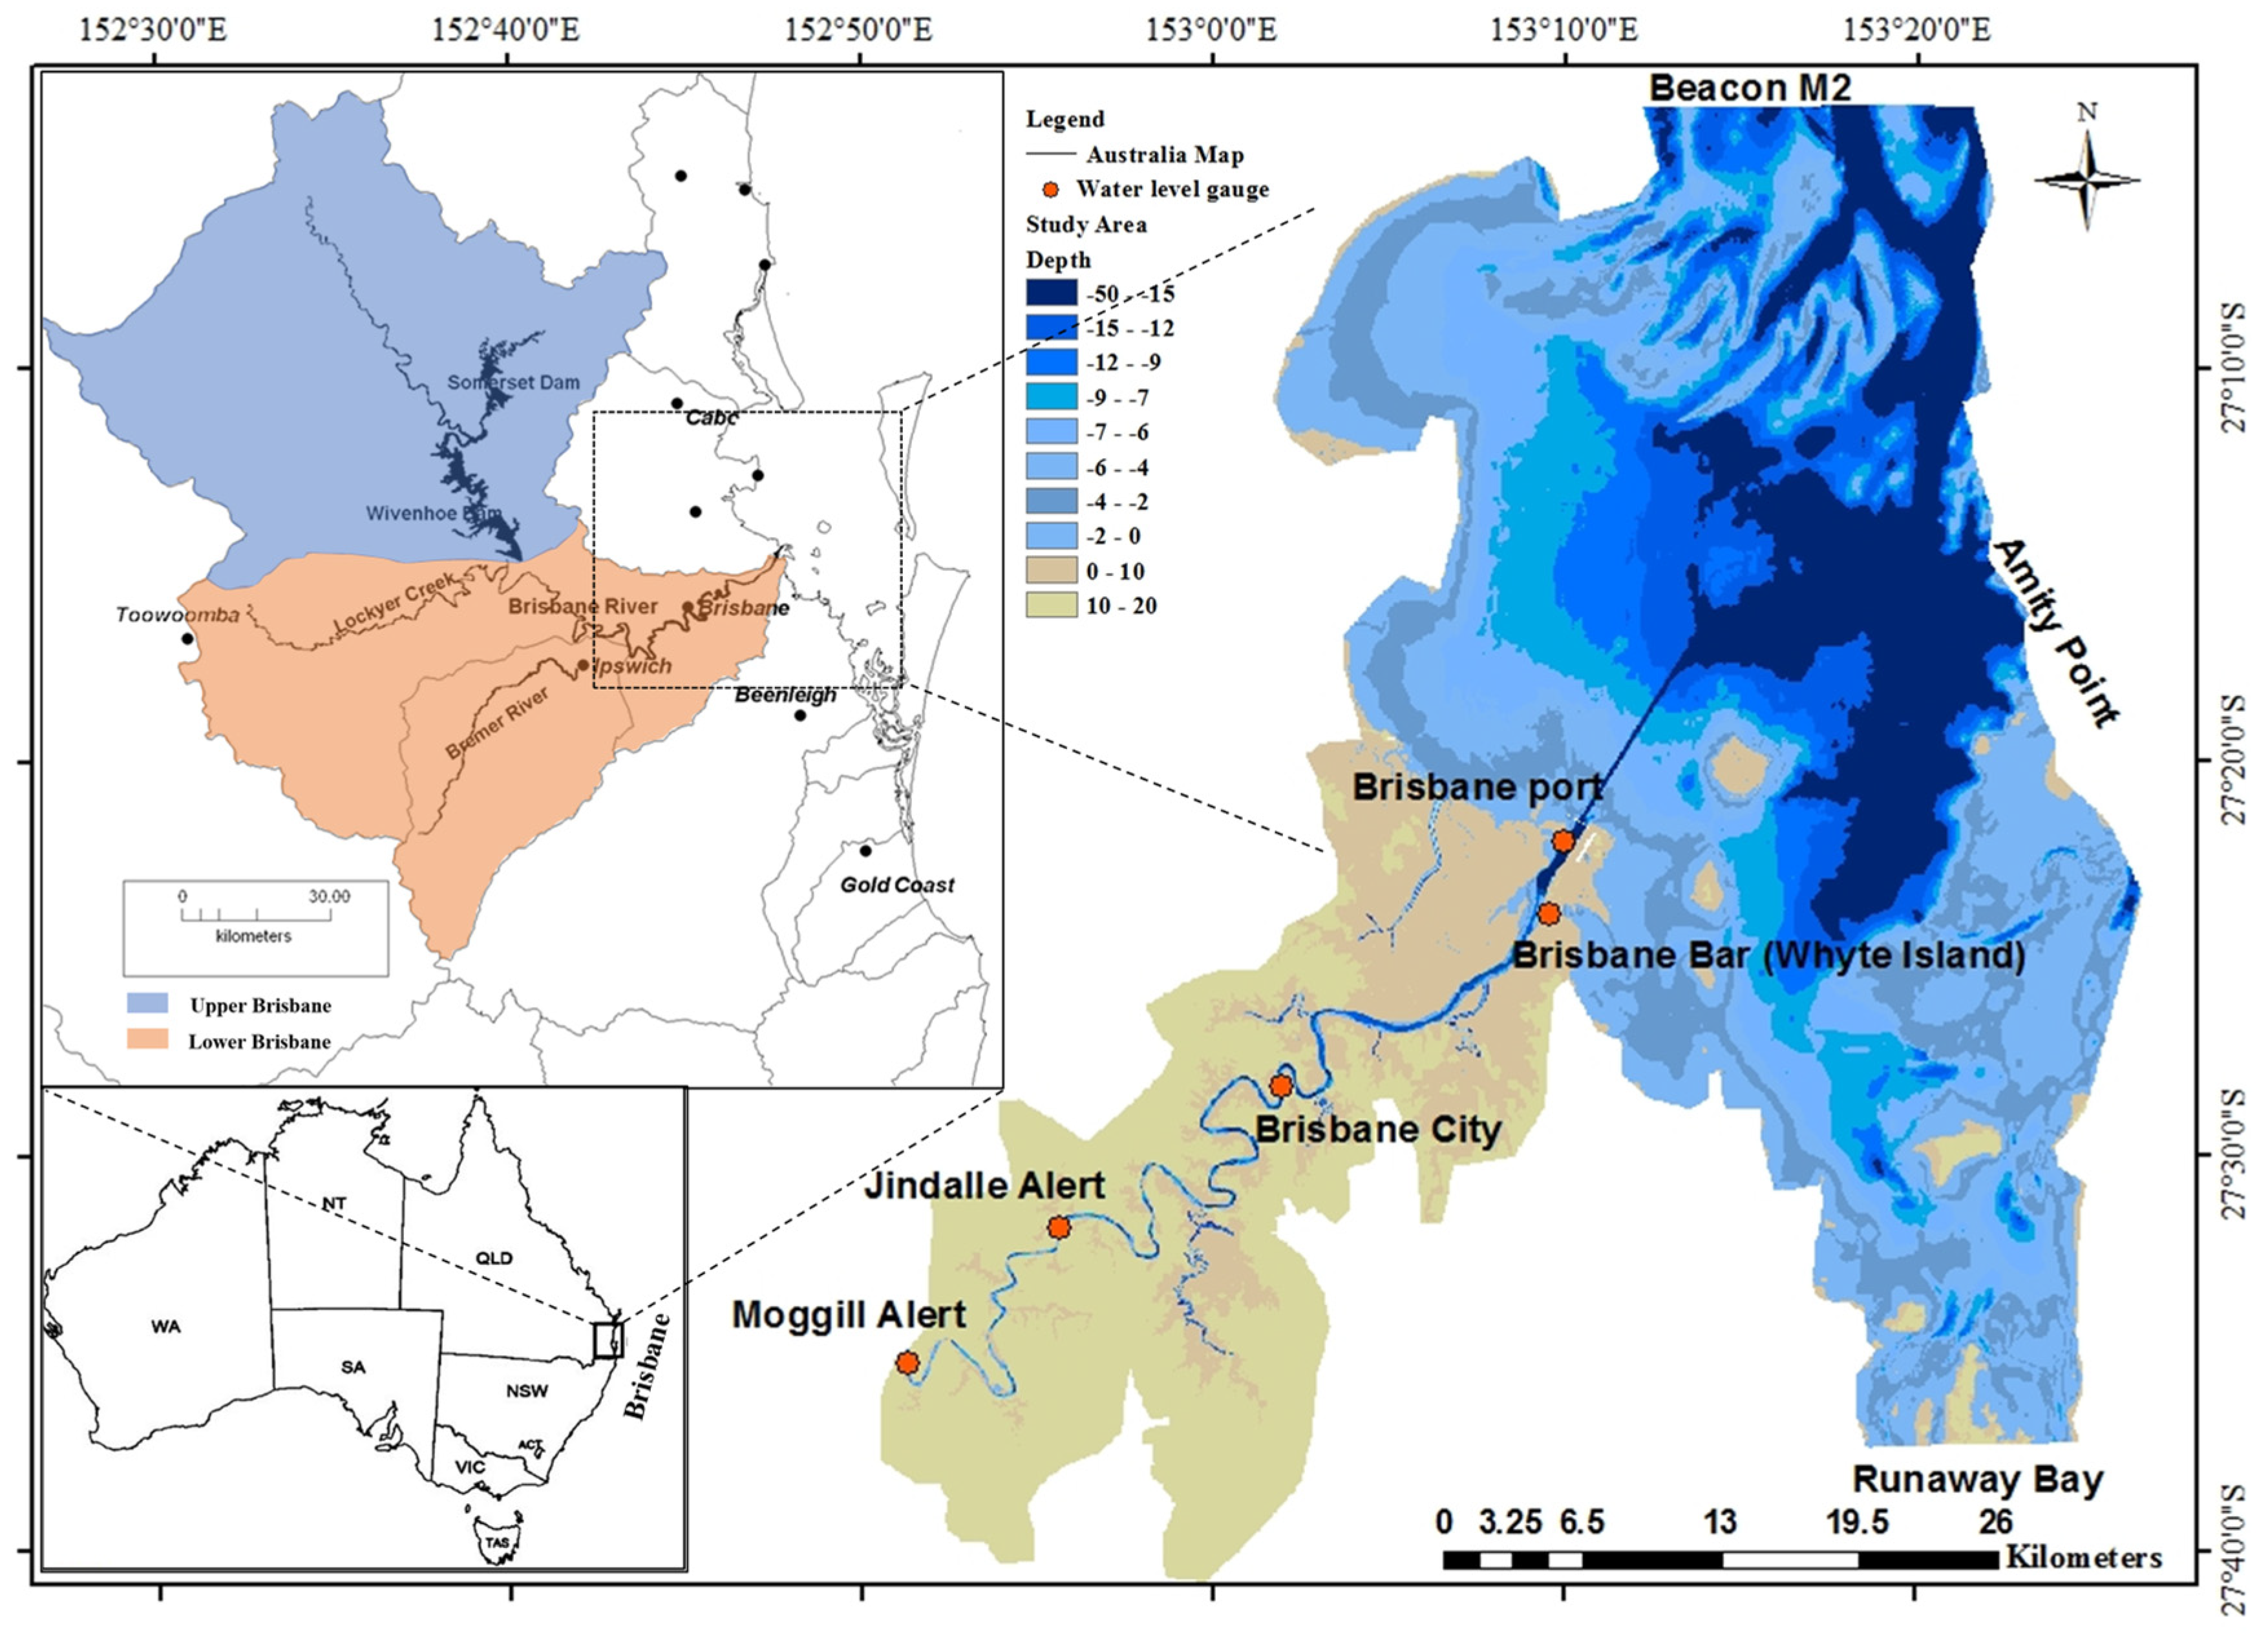
Figure 1. Brisbane River catchment and Moreton Bay.
Water 12 02744 g001
Figure 2. (a) Daily rainfall (2010–2011) and mean annual rainfall (1999–2018) at the Brisbane city office [40]; (b) Observed water level during the 2011 flood at Moggill and Brisbane city gauges, with reference to major floods.
Water 12 02744 g002
Figure 3. CR dike with intake, tidal, and outlet gate.
Water 12 02744 g003
Figure 4. Brisbane City Alert 2011 flood hydrograph, with minor, moderate, and major flood levels.
Water 12 02744 g004
Figure 5. Schematics of gates: (a) Section A-A, Brisbane bar gate, A; (b) Section B-B, River mouth and CR intake gate, B; (c) Section C-C, Dike and outlet gate, C; (d) Gates operation for the 2011 flood event.
Water 12 02744 g005
Figure 6. Observed and simulated water levels for the 2013 flood event at Jindalee Alert, Brisbane city, Whyte Island, and Brisbane Bar.
Water 12 02744 g006
Figure 7. Observed and simulated water levels for the 2011 flood event at Jindalee Alert, Brisbane city, Whyte Island, and Brisbane Bar.
Water 12 02744 g007
Figure 8. (a) Simulated water level for the 2011 flood in Brisbane River estuary from Brisbane city gauge to Brisbane Bar; (b) Simulated velocity for the 2011 flood in the BRE at Brisbane city gauge; (c) Simulated discharge for the 2011 flood in the BRE at Brisbane city gauge.
Water 12 02744 g008
Figure 9. Brisbane River intake: (a) normal intake right branch, (b) dredged and widened intake branch.
Water 12 02744 g009
Figure 10. (a) Flow distribution at BRE under normal condition; (b) after widening of the right channel; (c) Comparison of water levels at the Brisbane city gauge before and after widening of the right channel.
Water 12 02744 g010
Figure 11. (a) Comparison of water level for 2011 flood event at Brisbane City with 3 cases of gate operation; (b) Comparison of water level for 2011 flood event at Brisbane City with and without CR for optimum water level reduction; (c) Comparison of longitudinal water level profile in BRE with and without CR.
Water 12 02744 g011
Figure 12. Comparison of water levels at (a) Brisbane city gauge and (b) Moggill under improved management of Wivenhoe dam [53].
Water 12 02744 g012
Figure 13. (a) Comparison of water level for 2011 flood event at Brisbane City for optimum water level reduction under improved management of Wivenhoe dam (b). Comparison of longitudinal water level profile in BRE with and without CR after improved management of Wivenhoe dam.
Water 12 02744 g013
Table 1. Historic flood events at Brisbane City with their water level and discharge values [41].
Flood EventWater Level (m AHD)Discharge (m3/s)
18416.5112,500
18445.110,400
18903.818100
5 February 18936.8313,700
19 February 18936.5712,600
18983.57500
19745.4511,300
20114.4612,400
20132.324800
Table 2. Model boundary condition data, calibration and validation gauge name, and location.
Station NumberLatitudeLongitudeGauge Zero (m)DatumGauging Stations
540200−27.58°152.85°0AHDMoggill Alert
046206A−27.5°153.18°−1.07AHDBeacon M2 Moreton Bay
045100B−27.54°153.24°−0.62AHDRunaway Bay
046211E−27.23°153.26°−1.02AHDAmity Point
540192−27.53°152.92°0AHDJindalee
540198−27.47°153.03°0AHDBrisbane City Alert
046046A−27.36°153.17°−1.242AHDBrisbane Bar
540495−27.40°153.16°0AHDWhyte Island Alert
Table 3. Calibrated Manning’s n for the 2013 flood event.
Model AreaManning’s n Used in ModelManning’s n Range
( − ) 1
Range of Manning’s n
( − ) 2
Range of Manning’s n
( − ) 3
Moreton Bay0.0260.022-0.02–0.05
Brisbane River: Brisbane Bar—Jindalee0.0210.0220.0260.01–0.06
Brisbane River: Jindalee—Moggill 0.0220.0220.0380.01–0.06
Floodplain0.07–0.10.03–0.10.0910.02–0.05
1 Derived from Barton, et al. [47] 2 Derived from Liu and Lim [46] 3 Derived from Yu [49].
Table 4. Comparison of proposed CR parameters with Qingcaosha CR.
DescriptionProposed CR at Brisbane River MouthQingcaosha Reservoir a
Dike length (km)3448.41
Area (km2)7570
Max. dike height (m)1525
Volume (GL)900527
a Derived from Yuan [50].
Table 5. Performance indices at gauging stations during calibration of the 2013 flood event.
Gauging StationsRMSENash–Sutcliffe Coefficient
(Ens)
Maximum Water Level (m AHD)Dev.in Peak (m)Percentage Dev. in Peak
MeasuredSimulated
Jindalee Alert0.4050.9794.9764.9620.0140.281
Brisbane City0.2160.8772.292.2350.0552.402
Brisbane Bar0.3210.9111.7531.793−0.04−2.282
Whyte Island0.1620.9191.7431.816−0.073−4.188
Table 6. Performance indices at gauging stations during validation of the 2011 event.
Gauging StationsRMSENash–Sutcliffe Coefficient
(Ens)
Maximum Water Level (m AHD)Dev.in Peak (m)Percentage Dev. in Peak
MeasuredSimulated
Jindalee Alert0.450.98212.8512.660.191.48
Brisbane City0.30.9434.464.52−0.06−1.35
Brisbane Bar0.10.9521.621.450.16710.32
Whyte Island0.1150.9411.611.470.1448.95