Article

Desorption of Organic Micropollutants from Loaded Granular Activated Carbon

by
Daniela Reif
1,*,
Ernis Saracevic
1,
Monika Šabić Runjavec
2,
Julia Haslinger
1,
Heidemarie Schaar
1 and
Norbert Kreuzinger
1
1
Institute of Water Quality and Resource Management, TU Wien, Karlsplatz 13/226-1, 1040 Vienna, Austria
2
Faculty of Chemical Engineering and Technology, University of Zagreb, 10-000 Zagreb, Croatia
*
Author to whom correspondence should be addressed.
Water 2020, 12(10), 2754; https://doi.org/10.3390/w12102754
Submission received: 31 August 2020 / Revised: 25 September 2020 / Accepted: 29 September 2020 / Published: 3 October 2020
(This article belongs to the Special Issue Advanced Wastewater Treatment and Nutrient Recovery)

Abstract

:
The loading of granular activated carbon (GAC) is influenced by the amount of water treated and the concentrations of adsorbates present in the water matrix. Through extraction experiments, we aimed to investigate the total adsorbed mass of eight organic micropollutants by using ethanol as solvent and the maximum possible concentrations, due to the desorption of organic micropollutants, in water. Three different drying methods and the impact of the contact time, GAC particle size, and GAC/solvent ratio were investigated. Although no significant differences between the drying methods could be observed, the chosen contact time and particle size had a significant impact on the amount of organic micropollutants extracted. Lower GAC/solvent ratios positively affected the extraction yield. The masses extracted in ethanol were compared with the cumulated masses calculated from 72 feed and effluent samples, collected during filter operation, resulting in extraction yields between 0.5% and 30%. The composition of extracted micropollutants in ethanol reflected the concentrations in feed water of the pilot-scale filter. Desorption in water was mostly influenced by the solubility of the investigated micropollutants. The same substances found in the supernatants inf the experiments could also be identified in the backwash water of the filter.

1. Introduction

Granulated activated carbon (GAC) has been implemented in several wastewater treatment plants in an advanced step to remove organic micropollutants [1,2]. Organic micropollutants is an umbrella term encompassing endocrine-disrupting compounds, pharmaceuticals, personal care products, industrial chemicals etc.; they are present in wastewater at concentrations of ng/L to µg/L and may have adverse effects on the environment [3,4,5,6]. Activated carbon (AC) has proved to be applicable for the further removal of these substances [7,8] and is usually applied in a subsequent treatment step following conventional wastewater treatment or ozonation [3].
The removal of organic micropollutants by GAC filters mainly occurs by the physical adsorption of the organic compounds (adsorbate) on the GAC surface (adsorbent). Energy-rich sites (active centers) on the adsorbent surface are able to bind ions or molecules from the liquid phase, but the binding energies are low, and adsorption is regarded as a reversible process [9,10]. In general, the capacity of granulated activated carbon to adsorb organic micropollutants is influenced by the latter’s properties and concentrations (in relation to the adsorption equilibrium) and the wastewater treatment plant (WWTP) effluent background matrix. Dissolved organic compounds, especially those of low molecular weight, compete for adsorption sites and impede further transport into the GAC structure by blocking the pores [11,12]. Moreover, the pH, temperature, and empty-bed contact time influence the removal of organic micropollutants by GAC filters [13,14]. The adsorption capacity tends to decrease with operational time, which is generally expressed as bed volumes (BV). The adsorption capacity is initially sufficient for the removal of all compounds subject to adsorption, but with increasing bed volumes, compounds start to compete for free adsorption sites and those with lower adsorption affinity are exchanged with and replaced by more adsorbable substances [9]. To date, competitive adsorption has only been studied in lab-scale experiments with reduced degrees of freedom, focusing on the simultaneous adsorption of compounds, or simulated based on equations reflecting different adsorption kinetic models. Desorption studies in full-scale plants operated over a long period of BVs and exposed to usual matrix fluctuations in wastewater treatment with a periodical increase or decrease in the inlet concentrations are absent from the literature [15].
With higher loading, GAC filters become susceptible to the reversal of adsorption (desorption), due to changes in the concentration gradient from variations in the feed water matrix or backwashing with less-concentrated water [11,12,16]. Theoretically, desorption occurs if the inlet concentration of a substance in the filter is lower than the corresponding equilibrium concentration of the actual GAC loading. However, various studies suggest that desorption is hindered by pore blocking or even enhanced in the presence of competing compounds showing higher adsorption affinity [16,17]. The desorption of organic micropollutants in the presence of natural organic matter (NOM) during drinking-water treatment was systematically studied by Aschermann et al. They suggest that the reversibility of adsorption is increasing with the pore size the GAC and decreasing in the presence of NOM. Less reversibility in the presence of NOM was found for micro- and mesoporous activated carbons [15,18]. Desorption was found to be equally affected by differently sized fractions of natural organic matter [11]. Moreover, the loading of GAC is influenced by degradation processes in biologically activated filters (BAC), which support the removal of organic micropollutants [19,20].
The actual loading of the granular activated carbon represents a substance mixture corresponding to the average concentration of organic micropollutants in the feed water (the WWTP effluent in our case). Knowledge about the constitution of the compounds absorbed on the GAC surface may therefore provide information about the breakthrough of individual substances and general progress of competitive adsorption, without the expensive sampling and chemical analysis of the effluent at frequent intervals. Similar investigations were conducted by Kwon et al. (2017) to screen adsorbed organic micropollutants in spent carbon filters used in drinking-water purifiers. They reported higher yields for prolonged extraction times (the maximum time was 120 min), higher solvent volumes, and the use of organic solvents (methanol and acetonitrile) rather than water [21].
To our best knowledge, this is the first study focusing on the extraction of organic micropollutants from GAC used in advanced wastewater treatment. In order to maximize the extraction yields for eight organic micropollutants, representing a broad range of kinetic and adsorption constants, we focused on the impact of the (i) drying method, (ii) extraction time, (iii) GAC particle size and (iv) GAC/solvent ratio. The extracted amounts were compared with the cumulated adsorbed masses, calculated from the differences in concentration between the filter feed and effluent samples taken over the 27 months (or 25,420 BV) of pilot-scale filter operation. In order to observe and understand the desorption phenomena occurring during filter backwash with little-contaminated water (e.g., groundwater), as typically applied in full-scale operation, lab-scale experiments with water at pH = 7 were conducted, and the results were compared to the concentrations found in the backwash water of the pilot-scale filter.

2. Materials and Methods

2.1. Activated Carbon

In the lab- and pilot-scale experiments, the commercially available granular activated carbon (GAC) Epibon A 80 × 40 (Donau Carbon, Frankfurt on the Main, Germany) was used, which is based on lignite. The characteristic properties as specified by the supplier are a specific surface area (BET method) of 1100–1200 m2/g, iodine number > 1000 mg/g, particle density of 300 ± 30 kg/m3 and ash content of 12%. The particle size was 0.6–2.36 mm, with a d90 of 1.45 mm.

2.2. Analyzed Substances and Analytics

Eight organic micropollutants were monitored over 27 months of operation of the GAC filter (by grab sampling of the feed and effluent): benzotriazole, carbamazepine, acesulfame K, ibuprofen, sulfamethoxazole, diclofenac, bezafibrate, and metoprolol. The same substances were analyzed in laboratory desorption experiments. The relevant descriptive information and properties are provided in Table 1. According to Jekel and Dott [22], who described standard sets of chemical compounds suitable for assessing technologies and operating advanced wastewater technologies, benzotriazole and carbamazepine were selected as the main indicator substances for highly adsorbable compounds, and acesulfame K and ibuprofen were chosen for moderately adsorbable compounds.
The concentration of the organic micropollutants was measured by liquid chromatography coupled with mass spectrometry (LC-MS/MS) using a Luna Reversed Phase column (5 µm, 3.0 × 150 mm) with a linear gradient (0.8 mL min−1, ultrapure water with 0.1% acetic acid and acetonitrile with 0.1% acetic acid). For the detection, a mass spectrometer (3200 QTRAP LC-MS/MS System, SCIEX, Framingham, MA, USA) was used.

2.3. Pilot-Scale GAC Filter

The investigated stainless-steel pressure filter (W 1200 D) had a filter bed volume of 1.5 m3 and was situated at a full-scale activated-sludge treatment plant (two-stage process; capacity: 4 million population’s equivalent) as stand-alone post-treatment step receiving tertiary treated wastewater [24]. The average concentrations in the effluent of the wastewater treatment plant used as the feed for the filter were NH4-N = 1.29 ± 1.14 mg/L, NO3-N = 4.50 ± 2.76 mg/L, NO2-N = 0.21 ± 0.23 mg/L, and PO4-P = 0.65 ± 0.34 mg/L. The filter feed was not pre-treated because the concentration of suspended solids in the WWTP effluent was 6 mg/L on average, sufficiently low for direct application to the filter. The filter was filled with approximately 450 kg of the granulated activated carbon “Epibon A” and wetted before operation with well water for several days. The filling height was determined after the first backwash cycle and at the end of operation. The empty-bed contact time (EBCT) was 27 min. Backwashing was generally manually induced with well water if the differential pressure exceeded 0.8 bar. For backwashing (bottom fed), the flow was increased from 5 to 30 m3/h. The total amount of backwash water was approximately 20 m3 within a backwash time of 30 min, and the backwash interval was approximately 7 days. A total of 25,420 bed volumes (38,131 m3) of WWTP effluent was treated. The long hydraulic retention time in the wastewater treatment plant (24 h) and internal recirculation in the activated-sludge process resulted in hardly any fluctuations in the effluent during dry-weather conditions, so the feed and effluent samples were taken as grab samples. The organic micropollutant concentrations, pH, temperature and dissolved organic carbon (DOC) were also determined. Based on 72 samples of GAC feed and effluent, the Pearson correlation between the feed concentration (c0) of each substance and the adsorbed mass was analyzed.
The cumulated masses removed during the operation of the GAC filter were calculated according to following equation:
c u m u l a t e d   m a s s i =   k = 1 n ( c i , k c 0 , i ,   k ) × ( V k + V k + 1 )
where i describes the observed chemical compound; k , the number of samples; n , the total number of samples; c 0 , i ,   k , the concentration of compound i in the GAC feed; and c i , k , that observed in the GAC effluent during the sampling k . ( V k V k 1 ) represents the volume of wastewater treated between samples   k and k + 1 . The cumulated adsorbed mass was calculated for the DOC and the eight monitored organic micropollutants.
For the investigation of the various desorption methods in the lab experiments and to study the maximum desorption and actual loading, a second full-scale GAC filter was sampled. With the same geometry and setup as above, this filter did not directly receive tertiarily treated wastewater but was applied as a post-treatment following an ozonation step (specific nitrite-compensated ozone dose: 0.4–0.7 mg O3/mg DOC) The samples were taken after 61,880 and 69,560 bed volumes of operation.

2.4. Laboratory Adsorption Batch Tests

The equilibrium adsorption capacities of the four indicator substances (benzotriazole, carbamazepine, acesulfame K, and ibuprofen) were determined in 48-h batch tests with the same activated carbon used in the pilot-scale filters. Fresh GAC was washed with deionized water and dried at 105 °C for 48 h. Deionized water was spiked with the four indicator substances at a targeted concentration of 1000 µg/L. The experiments were performed in duplicate with shaking at 110 rpm (revolutions per minute) for applied GAC doses of 50, 150, 300, 500, 750 and 1000 mg/L. Additional blank tests were implemented to exclude errors caused by the adsorption of the tested compounds onto the glass walls. The adsorbent loading was calculated with Equation (2):
q e q = V L m A C × ( c 0 c t )
where q e q is the adsorbent loading at equilibrium in ng/g, V L is the volume of the fluid phase in L, m A C is the mass of activated carbon in g and ( c 0 c t ) is the concentration difference in ng/L.
The isotherm parameters for Langmuir (Equation (3))— q m a x (ng/g) and b in (L/ng)—and Freundlich (Equation (4)), the Freundlich constant K F [(ng1–n × Ln)/g] and exponent n [–], were obtained by “CurveFitting” with the “NonLinearLeastSquare” regression tool in MatLab R2015b (MathWorks, Natick, MA, USA). q e describes the equilibrium adsorbent loading in ng/g, and c e , the equilibrium organic trace compound concentration in the liquid phase. The model’s quality was evaluated with the coefficient of determination R2.
Langmuir :   q e = q m a x × b × c e 1 + b × c e
Freundlich :   q e = K F ×   c e n

2.5. Desorption Experiments

The desorption experiments were initially optimized to obtain the maximum concentrations in the solvent. Granulated activated carbon (post-ozonation GAC) sampled at the high bed volumes of 61,880 and 69,560 was used. Further investigations focused on the impact of the (i) drying method, (ii) extraction time, (iii) particle size and (iv) GAC/solvent ratio on substance recovery. After the optimization of the experimental conditions, samples from the monitored pilot-scale filter were used to compare the maximum possible desorption due to reversed concentration gradients in deionized water and to compare the extraction efficiency and results with the cumulated loadings on the GAC particles.

2.5.1. Drying Methods Applied

In order to optimize the determination of the adsorbent loading, three different drying methods (air drying at room temperature, drying at 105 °C in an oven, and lyophilization; see Table 2) were investigated. The time needed for complete drying varied from 7 days for the samples dried in air at room temperature (25 °C) to 48 h in the drying cabinet at 105 °C. For lyophilization, about 50 g of wet carbon sample was transferred into a 500 mL round-bottom flask and frozen at −80 °C for 24 h. Afterwards, the flask was vacuum-dried for approximately 24 h (depending on the content of water in the samples) at −30 °C. All prepared samples were stored in an exicator at room temperature. Independently of the applied drying method, the mass was reduced by a factor of 3 (from 150 to 50 g).

2.5.2. Setup for Particle-Size Experiments

Half of the dried GAC samples were ground with a lab mill and sieved through a 630 µm mesh to compare the influence of the activated carbon’s particle size on the desorption of micropollutants, simulating granular and powdered GAC. An extraction time of 3 h was applied in the desorption experiments in ethanol and water focusing on evaluating the different drying methods.

2.5.3. Solvent and Extraction Time

In the desorption experiments, deionized water at pH = 7 and ethanol were used as solvents. Deionized water (tap water treated in a mixed-bed resin with a conductivity <0.1 µS/cm) was chosen to evaluate the maximum possible desorption occurring due to a reversed concentration gradient in the backwash water or due to a decrease in the feed concentration. However, most adsorbing organic micropollutants are hydrophobic and preferentially dissolve in apolar solvents. In order to extract both polar and apolar compounds we used absolute ethanol (CAS: 64-17-5), obtained from VWR (Radnor, PA, USA). The ethanol molecule has a hydroxil (OH) group for hydrogen bonding of polar molecules and an ethyl group (C2H5) attracting non-polar molecules.
For comparing powdered and granulated activated carbon, the desorption efficiencies were determined for extraction times of 3 h. The desorption kinetics were determined in prolonged 48-h experiments in ethanol with samples taken after 1, 3, 6, 9, 18, 24 and 48 h.

2.5.4. Batch Desorption Experiments

The batch desorption experiments were conducted in cleaned and dried 250 mL Erlenmeyer flasks. The desired amount of dry activated carbon was transferred into 50 mL of solvent and shaken at 110 rpm with a horizontal agitator. Samples were taken after the selected extraction times. During the experiments, the flasks were covered with parafilm to prevent the evaporation of the solvent. Blank tests, performed without the addition of activated carbon, were implemented to assess the possible bias of adsorption to the glass walls.
All the desorption experiments were conducted for GAC doses of 10, 20, and 50 g/L, in duplicate. Extraction from the spent activated carbon obtained from the monitored pilot-scale GAC filter was performed in triplicate for AC doses of 10, 20, 30, and 50 g/L.

3. Results

3.1. Results from the Pilot-Scale GAC Filter

The activated carbon filter was operated for a period of 27 months/25,420 bed volumes. The median and average feed concentrations for the eight analyzed substances are given in Table 3. The mean DOC concentration in the filter feed was 7.44 ± 1.44 mg/L; the median concentration was 7.59 mg/L.
Since the free available adsorption sites on the AC surface are the greatest influencing factor for the adsorption of micropollutants, we defined three phases of operation, based on the bed volumes of the treated WWTP effluent:
  • Phase I (<1500 BV)
After the installation of the filter, the adsorption capacity is sufficient for the complete removal of all the analyzed micropollutants and dissolved organic matter, measured as DOC, with almost 100% removal of all the compounds.
  • Phase II (1500–12,000 BV)
The breakthrough of some less-adsorbable compounds can be observed. This means that there are insufficient adsorption sites available for the adsorptive removal of all the organic micropollutants due to competitive adsorption. The adsorption of dissolved organic matter (DOC) is also decreasing.
  • Phase III (>12,000 BV)
At the adsorbent surface, less or weakly adsorbable compounds become replaced by well-adsorbable compounds. DOC removal becomes stable at 10–20%.
Based on this graduation and the data obtained during the corresponding operational phases, correlation analyses were performed, focusing on the influence of the feed concentration on the adsorption or desorption of a substance. The level of significance was determined as α = 0.1. The adsorbed mass cumulated over time (see Equation (1)) was used to estimate the total loading of the activated carbon and to compare it to the mass extracted from the desorption experiments. Desorption during the backwashing of the filter and the biodegradation of adsorbed compounds were not taken into account. Desorption, in general, was observed for acesulfame K and ibuprofen.
The feed and effluent concentrations and cumulated mass of the selected indicator substances benzotriazole, carbamazepine, ibuprofen, and acesulfame K are shown in Figure 1. Graphs for other substances monitored can be found in Figure S1 in the Supplementary Materials. The cumulated mass of DOC, which was eliminated by the GAC filter after 25,450 BV, was 55.24 kg.
The cumulated masses of benzotriazole and carbamazepine steadily increased with the bed volumes. The average removal rates declined from complete removal (100%) in Phase I to an average removal of 36 ± 21% (BTA) and 36 ± 15% (CBZ) in Phase III. A correlation analysis of the adsorbed mass and feed concentration showed significant positive correlations for both benzotriazole (r = 0.69; α = 5.6 × 10⁻⁸) and carbamazepine (r = 0.28; α = 3.8 × 10⁻²). A graphical illustration of the concentration difference between feed and effluent of the filter as a function of the feed concentration can be found in Figure S2 in the Supplementary Material.
The feed concentration of the moderately adsorbable acesulfame K shows a strong fluctuation between 61 and 3850 ng/L. Desorption was observed during periods of lower feed concentrations—BV 6000–9000 and BV 18,000–24,000—and also occurred between 4000 and 5500 bed volumes, although the feed concentration was higher than average then. The Pearson coefficient of the correlation between the adsorbed mass and feed concentration was r = 0.65 (α = 5.8 × 10⁻⁷). The cumulated mass of ibuprofen increased to 500 mg, after approximately 14,000 bed volumes. Afterwards, the monitored feed concentrations were lower than the average and desorption occurred. The Pearson correlation coefficient was r = 0.74 (α = 2 × 10⁻⁹).
For the other substances investigated, the cumulated mass increased over the entire operational time of the GAC filter. The calculated Pearson coefficients of correlation between the feed concentration and adsorbed mass were significant (α < 0.1) for sulfamethoxazole (r = 0.65), bezafibrate (r = 0.96) and metoprolol (r = 0.57). For diclofenac, said coefficient was not statistically significant.
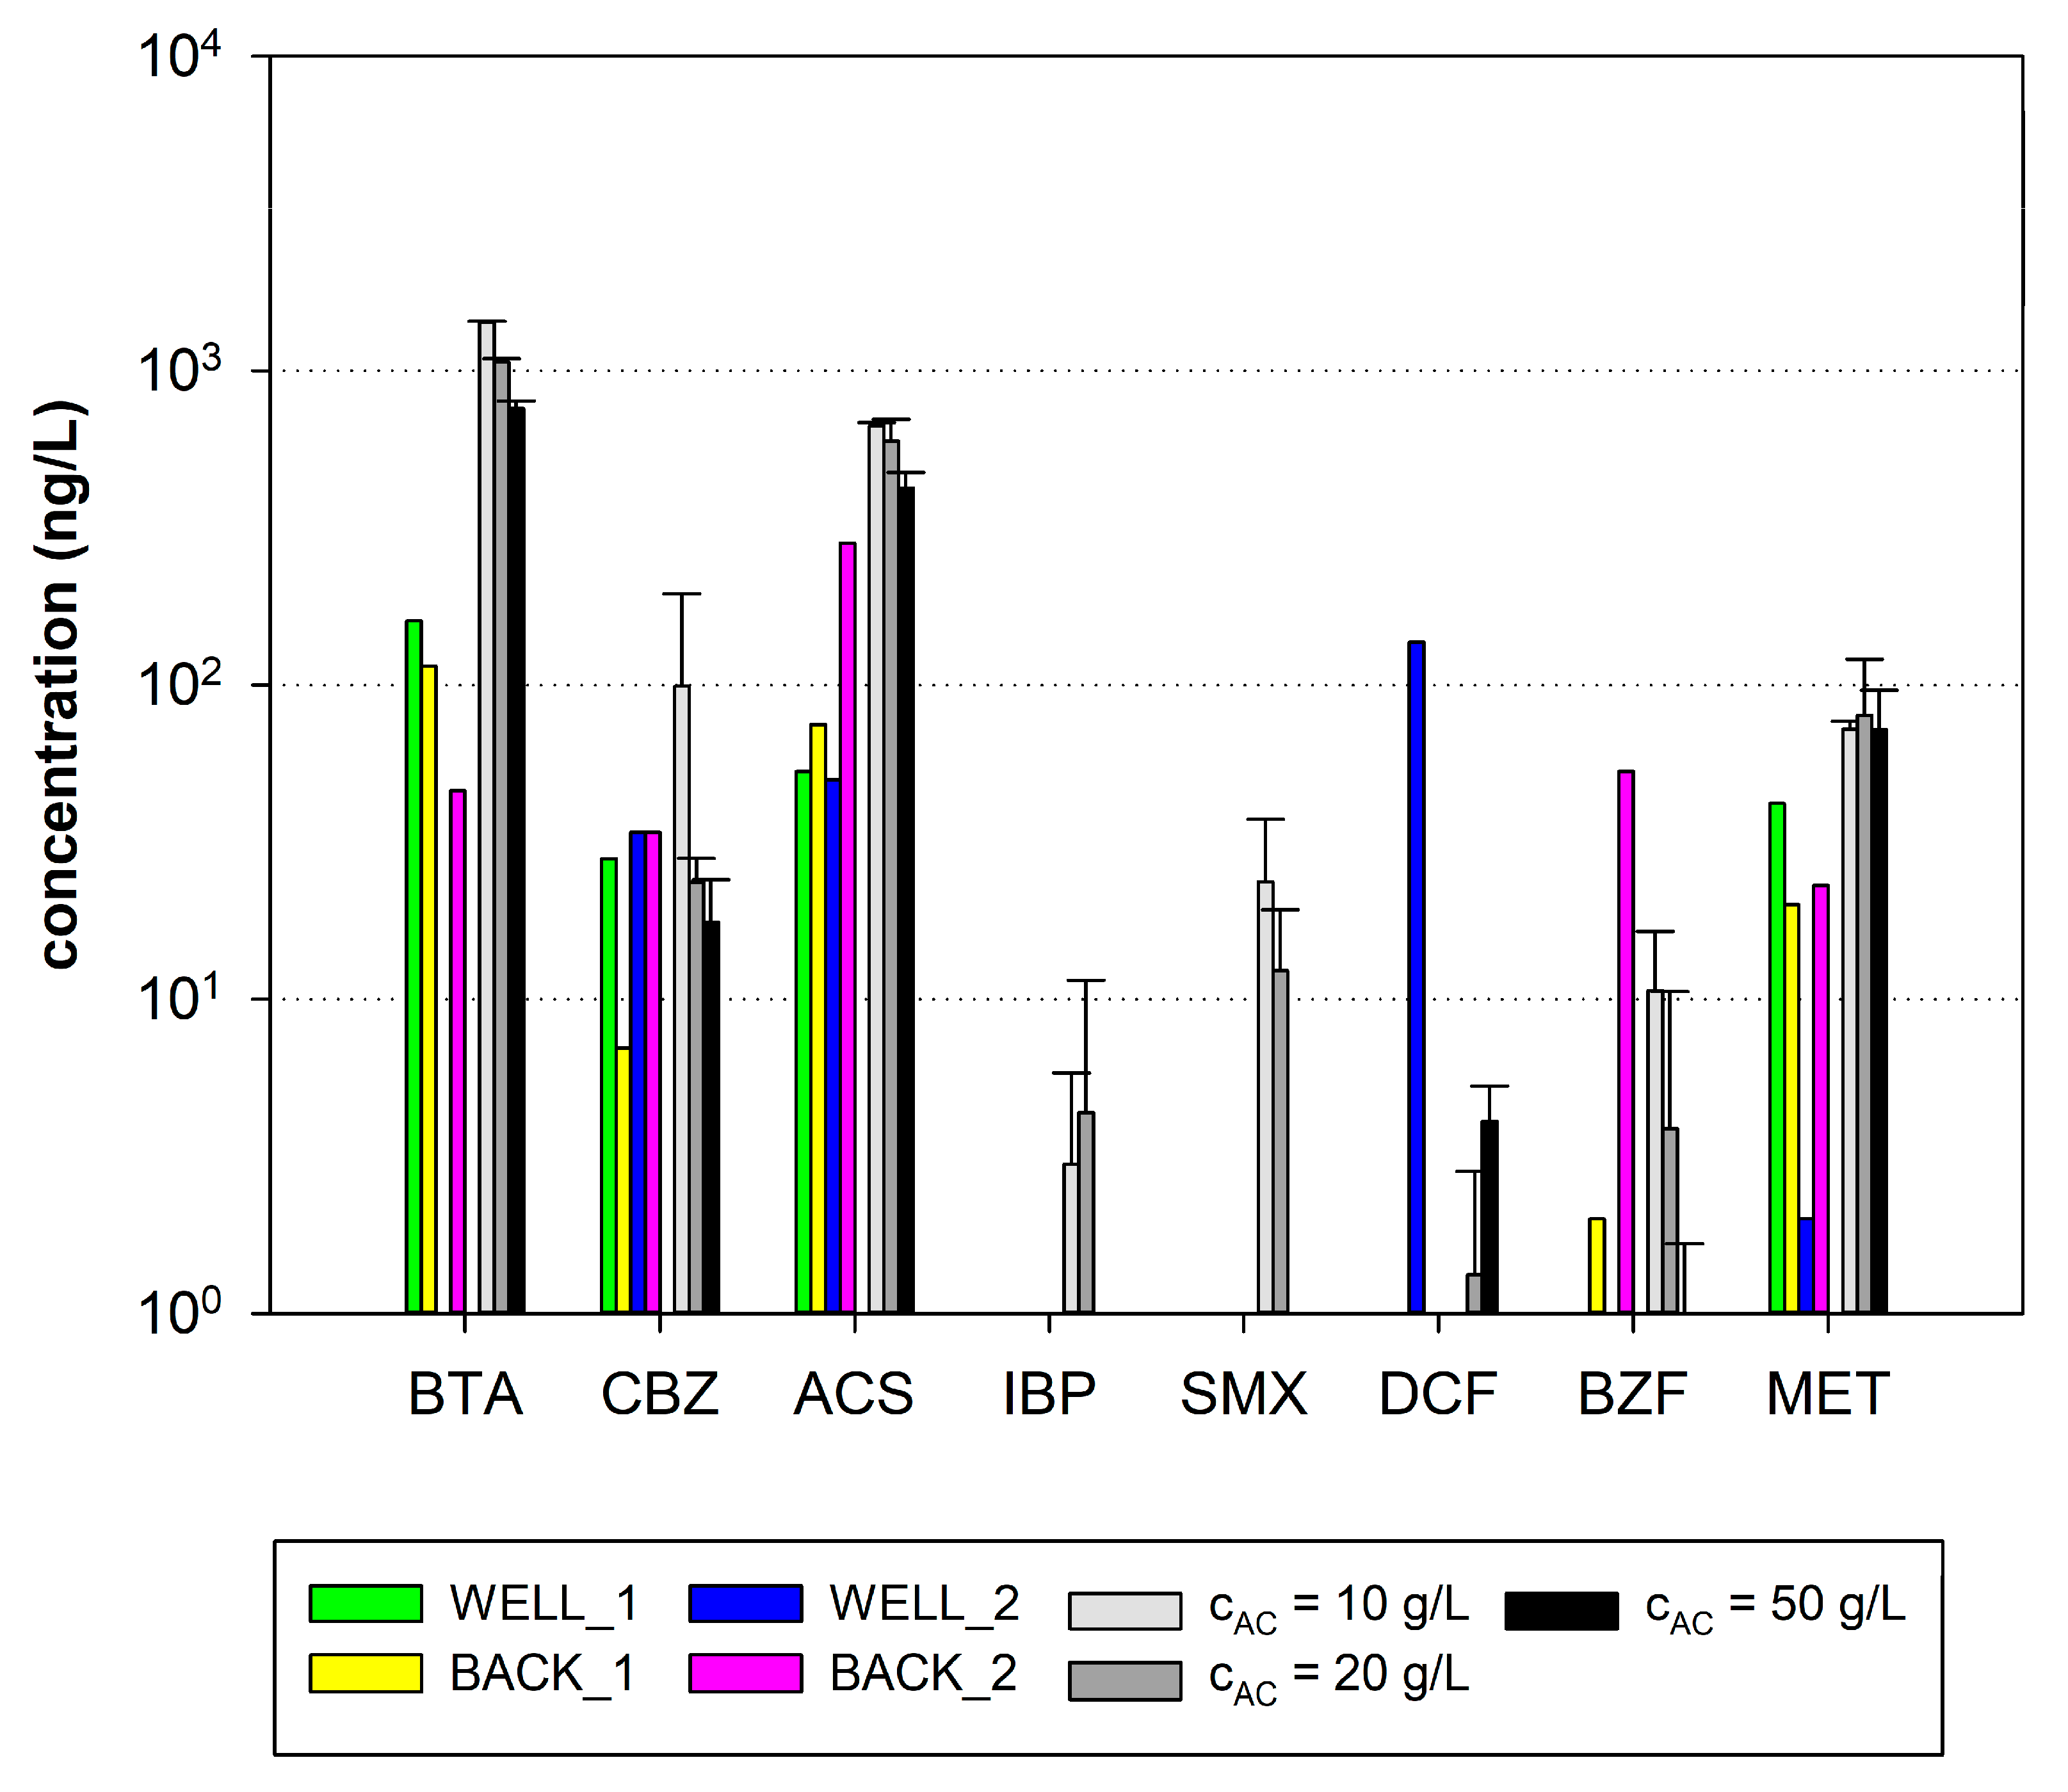
Samples were taken during the backwashing of the GAC filter to evaluate the number of organic micropollutants desorbing during the backwashing step. In order to show that desorption during backwashing had already occurred early at a comparably low BV, the obtained concentrations are depicted in Figure 2. For benzotriazole and carbamazepine, the concentrations observed at the beginning of backwashing (flow = 5 m3/h) were in the same range as those in the feed before backwashing. At the end of the backwashing period (the flow was increased to 30 m3/h), the concentrations decreased to or below the level of contamination found in the well water. For backwashing at 2860 BV, only acesulfame K could be detected at higher concentrations in the backwash water (75 ng/L at the end of backwashing, compared to 53 ng/L in the well water). However, the second backwashing, at 3960 BV, had already resulted in the desorption of benzotriazole, acesulfame K, diclofenac, bezafibrate and metoprolol. The measured concentrations were well above those in the filter feed. The concentrations of the other analyzed substances can be found in Tables S1 and S2.

3.2. Adsorption Experiments

The results for the single-solute batch adsorption tests are given in Table 4. The obtained coefficient of determination R2 was higher than 0.80 for all the investigated substances and generally higher for isotherm modeling according to Langmuir. The calculated maximum adsorption capacity of the investigated granulated activated carbon was 73,460,767 ng/g (73.5 mg/g) for benzotriazole, 23,067,576 ng/g (27.1 mg/g) for carbamazepine, 4,581,276 ng/g (4.6 mg/g) for acesulfame K and 10,066,085 ng/g (10 mg/g) for ibuprofen. A graphical illustration of the experimental data and calculated isotherms can be found in Figure S3.

3.3. Optimization of Desorption Batch Experiments

First, the methodology for the extraction of organic micropollutants in water and ethanol was optimized with regard to the activated carbon drying method, extraction time, particle size and GAC/solvent ratio. Desorption in deionized water represents the maximum possible desorption, caused by the reversal of the concentration gradient in the water matrix under real, live operation. However, most of the organic micropollutants are better soluble in ethanol, which was therefore chosen as the solvent for drawing conclusions on the actual loading of the activated carbon.

3.3.1. Impact of Drying Method

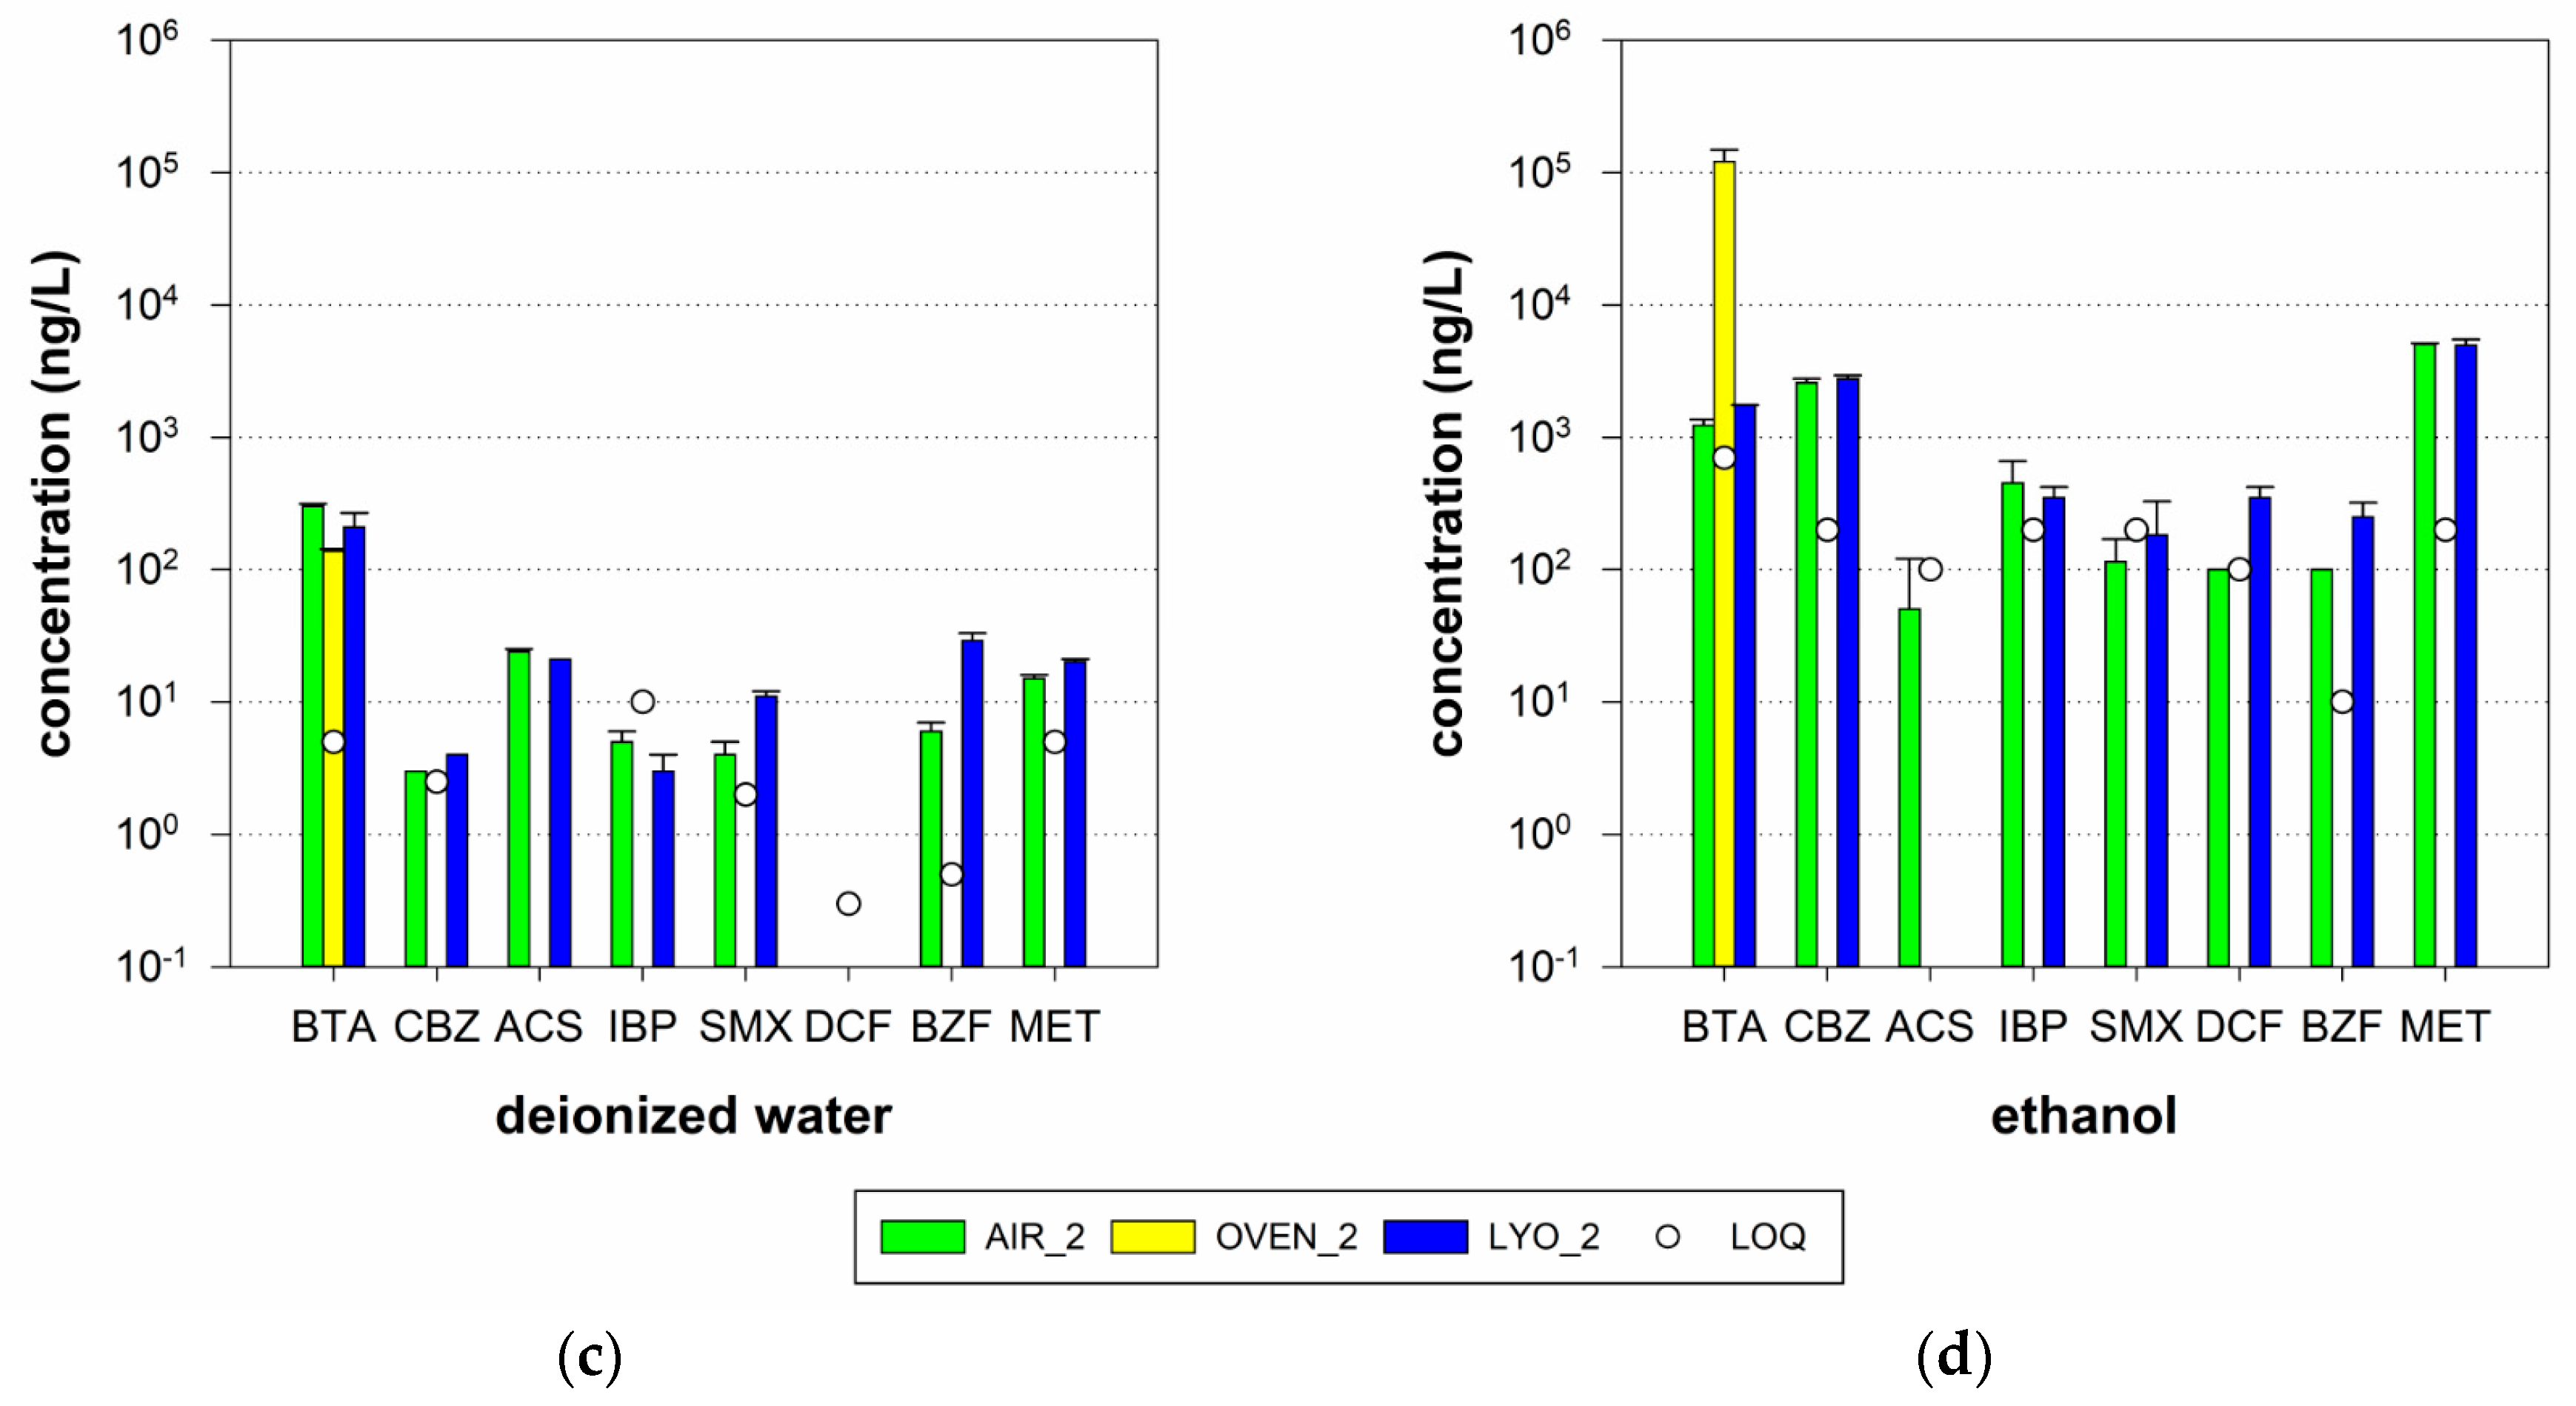
The impact of the drying method (air drying at room temperature of 25 °C, oven drying at 105 °C and lyophilization) was determined for a GAC dose of 20 g/L and extraction time of 3 h. The experiments were conducted in duplicate for samples taken from the pilot-scale GAC filter, applied as a post-treatment following ozonation. The results are illustrated in Figure 3. In general, higher concentrations were obtained in ethanol than in deionized water for all the substances except acesulfame K. For Sample 1 (taken at 61,880 BV), only benzotriazole and acesulfame K in water and benzotriazole, carbamazepine and metoprolol in ethanol could be detected at all. For benzotriazole, slightly higher concentrations were obtained for the lyophilized samples, but for the other compounds, the highest extraction efficiencies were observed for oven drying at 105 °C (acesulfame K) and air drying (carbamazepine and metoprolol). The experiments were repeated with Sample 2 (taken at 69,560 BV). For benzotriazole, the highest concentrations were observed for the air-dried samples in water and oven-dried samples in ethanol, but the other substances were not detectable from the oven-dried samples. Slightly higher concentrations of acesulfame K and ibuprofen were detected for the air-dried samples, but other organic micropollutants maximally desorbed from lyophilized samples.

3.3.2. Impact of Extraction Time

Experiments to assess the impact of the extraction time were conducted at a GAC dose of 20.6 ± 0.4 g/L in ethanol using oven-dried GAC; the concentrations obtained after 1, 3, 6, 9, 18, 24, and 48 h are given in Figure 4. For benzotriazole and metoprolol, increases in concentration in the supernatant were found up to 18 h. The maximum concentrations in supernatant were 2351 ng/L (BTA) and 4117 ng/L (MET), respectively. Afterwards, the concentration slightly decreased again. For sulfamethoxazole, the maximum concentration in supernatant of 413 ng/L was found after 6 h extraction time. However, for carbamazepine the highest concentration was measured after only 1-h (1352 ng/L), following by a decrease to 1150 ng/L. The diclofenac and bezafibrate concentrations were constant until 24 h. Elevated concentrations, however, were found for a 48-h extraction time with maximum concentrations of 550 ng/L (diclofenac) and 300 ng/L (bezafibrate). The desorption of medium-adsorbing compounds, such as ibuprofen and acesulfame K, resulted in a steady increase in supernatant concentrations. The maximum concentrations measured after 48 h were 3400 ng/L for acesulfame K and 700 ng/L for ibuprofen; the supernatant concentration of acesulfame K almost doubled between 24 and 48 h. The blank measurements at 24 and 48 h were lower than the limit of quantification, LOQ (maximum: 10 ng/L).

3.3.3. Impact of AC Particle Size and Applied Dose

Based on the previous experiments, drying in the oven at 105 °C and an extraction time of 3 h were chosen for further experiments. As the particle size of the activated carbon affects the diffusive transport of substances through the porous structure of the GAC, the experiments were conducted with original-sized GAC and after grinding it to powdered GAC (pGAC). The obtained concentrations in the supernatant for all the monitored organic micropollutants and both AC sizes are given in Figure 5. All the experiments were conducted in triplicate at four different doses: 10, 20, 30, and 50 g/L.
In water, only benzotriazole, carbamazepine, acesulfame K, and metoprolol could be detected at all the applied GAC/solvent ratios. For benzotriazole and metoprolol, higher desorption was observed with GAC than with pGAC. The supernatant concentrations of six out of eight organic micropollutants, excluding ibuprofen and bezafibrate, decreased with increasing adsorbent doses. In ethanol, the difference in supernatant concentrations between the original-sized GAC and pGAC depended on the investigated substance. For benzotriazole, acesulfame K and ibuprofen, the supernatant concentrations were higher at all four applied doses for the pGAC samples. However, for the other organic micropollutants, higher concentrations were observed for the original-sized GAC. Unlike for desorption in water, the supernatant concentrations of all the organic micropollutants increased with the GAC/solvent ratio in ethanol, but the extraction efficiencies (calculated as the desorbed concentration per applied GAC/solvent ratio) generally decreased with higher GAC/solvent ratios.

3.4. Comparing Desorption Experiments with Results from Backwashing of Pilot-Scale Filter

The supernatant concentrations in water were compared with analyses of backwash water (Figure 6). Only benzotriazole, carbamazepine; acesulfame K, and metoprolol could be detected in all the desorption experiments and backwash water of the pilot-scale filter. For benzotriazole and acesulfame K, the concentrations in the supernatant were about 10 times higher than the concentrations recorded in the backwash water. However, the difference was smaller for carbamazepine and metoprolol. Bezafibrate was found in the sample of the second backwash, taken at 3960 BV, as well as for GAC/solvent ratios of 10 and 20 g/L. Ibuprofen, sulfamethoxazole, and diclofenac could only be detected in the desorption experiments.
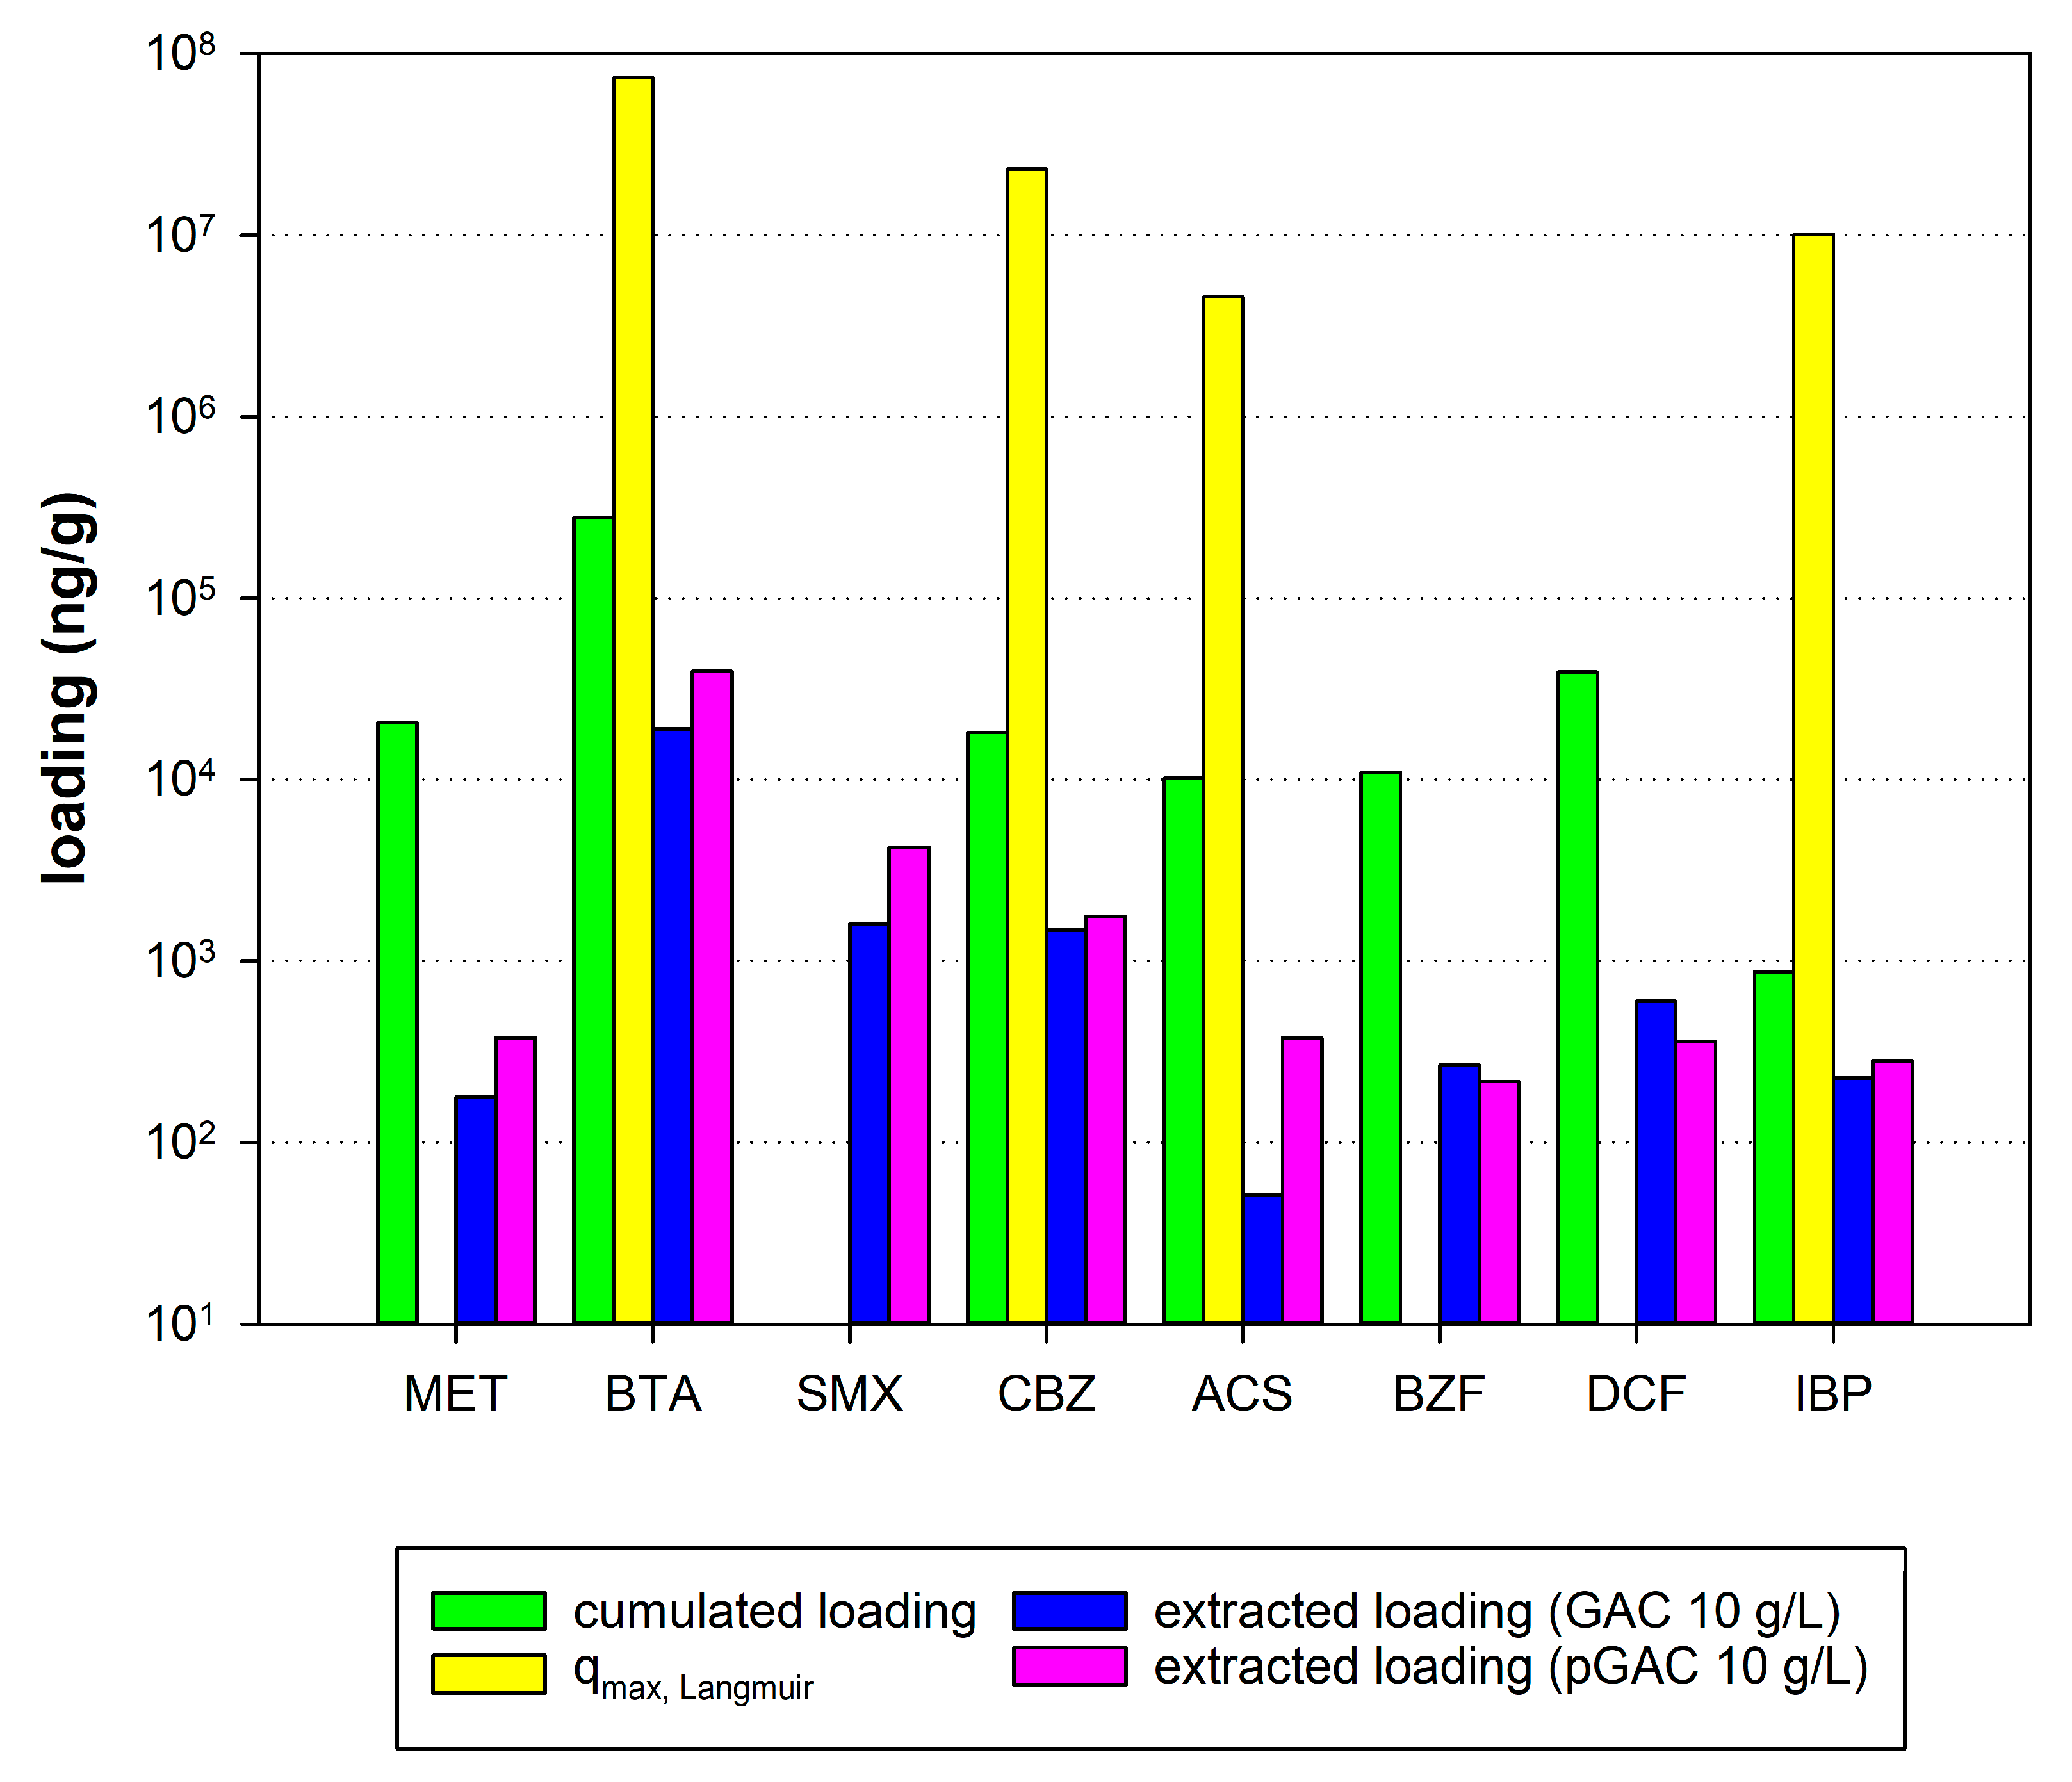
The cumulated masses, which were calculated based on sampling during filter operation, were compared with the maximum extracted masses per gram of AC (Figure 7). Since the maximum extraction efficiencies for GAC and pGAC were not consistent for all the investigated organic micropollutants, results for a GAC/solvent ratio of 10 g/L, representing the highest extraction efficiencies, were considered for further discussion. The maximum adsorption capacities obtained in the single-solute adsorption experiments are also shown to check the plausibility of the obtained extraction results. Comparing the maximum adsorption capacity (Langmuir model) of the organic micropollutants and cumulated masses indicates that less than 1% of the adsorption capacity, as determined in the single-solute experiments for virgin AC, is available for the adsorption of organic micropollutants under real matrix conditions. The theoretical extraction yields, relating extracted mass per AC to cumulated loadings, were between 0.5% (ACS) and 26.17% (IBP) for GAC and 0.92% (DCF) and 32.30% (IBP) for pGAC. All the theoretical extraction efficiencies are given in Table S3 in the Supplementary Material. For sulfamethoxazole, the desorbed loadings obtained from the filter material were higher than the calculated ones. The constitution of the desorbed masses (expressed as percent mass fraction per total mass of the monitored organic micropollutants) varied for the different compounds. Benzotriazole represents the organic micropollutant fraction with the highest observed mass adsorbed in the pilot-scale filter, representing 80% of the total detected organic micropollutant mass. It was also found in the highest concentrations during the desorption experiment. The correlation between the feed concentration and desorbed mass, as well as that between the cumulated and desorbed mass from GAC and pGAC, was analyzed. The results for sulfamethoxazole were excluded from this analysis. A strong positive Pearson correlation coefficient was found for the obtained loadings with feed concentrations (GAC: r = 0.97, α = 0.36; pGAC: r = 0.97, α = 0.36) and cumulated masses (GAC: r = 0.99, α = 0.33; pGAC: r = 0.99, α = 0.35).

4. Discussion

4.1. Optimization of Desorption Batch Experiments

To optimize the extraction of organic micropollutants from spent GAC, several experiments were conducted with activated carbon obtained from a post-treatment GAC filter, which was applied after ozonation. The experiments focused on the impact of the (i) drying method, (ii) extraction time, (iii) particle size and (iv) adsorbent/solvent ratio.
The impact of the applied drying method was evaluated in two desorption experiments, conducted in duplicate. The maximum equilibrium concentrations, dependent on the applied drying method, varied for the different organic micropollutants. No clear recommendation for any one of the tested methods can thus be made, and the most appropriate depends on the research question to be answered. All three drying methods are characterized by several advantages and disadvantages:
  • Air-drying at room temperature: Drying at room temperature in the exicator is the easiest method but takes the longest because the water must completely evaporate. Room temperatures may vary, and the method might therefore be less reproducible than thermal drying in an oven or lyophilization.
  • Oven drying at 105 °C: The equilibrium between activated carbon and organic micropollutants depends on the adsorption capacity, temperature applied, and concentration of the substances in the liquid phase [9,25]. Therefore, an increase in temperature might influence the desorption behavior of some substances, leading to a change in the adsorbent load. Another aspect to consider is the thermal stability of different organic micropollutants, although the boiling point of the targeted substances always was well above 105 °C in our case.
  • Lyophilization: During the desorption experiments, we observed the physical destruction of the grain structure of the tested GAC samples, which resulted in a reduction in the AC particle size. Since adsorption and desorption are influenced by the diffusive transport of organic micropollutants in the GAC structure, a reduction in grain size strongly influences the obtained adsorbed or desorbed masses [26]. In particular, for desorption experiments focusing on organic micropollutant desorption in water due to a reversal of the concentration gradient, drying with lyophilization might not be the best choice.
The effect of extraction time was only evaluated for the extraction of organic micropollutants in ethanol. The results suggest a major impact of the desorption time on the concentrations of the organic micropollutants in the supernatant. For moderately adsorbable compounds such as acesulfame K and ibuprofen, the supernatant concentrations increased over the whole contact period. However, for well-adsorbable compounds, such as benzotriazole, the concentrations initially increased but later decreased again. This might be the result of competitive adsorption taking place during the desorption experiments, where the initially desorbed compounds replace moderately adsorbable ones [27]. Additionally, the blockage of pores due to adsorbed dissolved organic matter strongly influences the time to equilibrium between the adsorbent, adsorbed compounds, and solvent [11,15,18].
Although we can assume that equilibrium conditions were not reached after 48 h, we selected a significantly lower extraction time of 3 h for further experiments. This was based on the assumption that the distribution of the different organic compounds adsorbed on the GAC outer and inner surface was homogenous. A short extraction time of 3 h might better represent the composition of the different organic micropollutants desorbing from the surface and reduce bias due to competitive adsorption between the different investigated organic micropollutants as observed for higher extraction times. The desorption of organic micropollutants in water mostly occurs due to changes in the feed water matrix or during the backwashing of the filter. The calculated hydraulic retention time of the water in our pilot-scale filter was approximately 8 min (EBCT = 27 min), while the residence time during backwashing is even lower (the minimum calculated time for a flow of 30 m3/h is about 2 min). With respect to the possible prolonged contact time of organic micropollutants, which adsorb to the outer surface of the particle and then diffuse into the pores, and for better comparability of the desorption experiments, we decided to use the same extraction time of 3 h in the desorption experiments with water.
The influence of the activated carbon particle size on the desorption of organic micropollutants, as well as the applied GAC/solvent ratio, was investigated. The obtained results again depended on the substance. For benzotriazole, acesulfame K and sulfamethoxazole, the equilibrium concentrations obtained in ethanol were higher for ground pGAC than for GAC. For, carbamazepine, ibuprofen, bezafibrate, diclofenac, and metoprolol, however, higher supernatant concentrations were found for original-sized GAC. These are surprising results, as diclofenac and bezafibrate have the highest molecular weights among the compounds, so the intra-particular diffusion of these compounds should be more affected by steric hindrance, which increases with pore length [28]. Nevertheless, a reduction in particle size normally leads to an enhanced adsorption capacity and faster kinetics [26,29]. The grinding of the spent GAC from the pilot-scale filter might therefore provide free adsorption sites that were formerly not accessible due to the blocking of the pores by NOM, for example. Another point to consider is the competition between the organic compounds, as we observed in the extraction time experiments, which is also influenced by changes in particle size and the kinetics of adsorption and desorption.
The impact on the GAC/solvent ratio was examined. The results obtained for extraction in ethanol agreed with similar experiments by Kwon et al. (2017), who reported enhanced extraction efficiencies at lower GAC/solvent ratios, which was also found in our experiments [21]. Although the obtained concentration increased with the amount of spent AC, the normalized desorbed mass per applied dose decreased. However, in deionized water, we observed decreasing or stable concentrations of benzotriazole, carbamazepine (only GAC) and metoprolol at higher AC/solvent volume ratios. The other investigated compounds could only be detected when GAC was applied at a ratio of 10 or 20 g/L. This might be explained by a decrease in the concentration gradient between the liquid phase and the activated carbon surface, which decreases with higher AC/solvent ratios and is the main driving force for desorption in water.

4.2. Pilot-Scale Results

The adsorption of organic micropollutants in the investigated GAC pilot-scale filter was found to be mostly influenced by the treated volumes (bed volumes) and the concentration of the substance in the feed water. A significant correlation between the adsorbed mass and feed concentration of the organic micropollutant could be observed for all the monitored substances except diclofenac, over the three different phases of the operation (Phase I: <1500 BV; Phase II: 1500–12,000 BV; and Phase III: >12,000 BV). Nevertheless, since the absolute adsorption capacity decreases with increasing bed volumes, the slopes of the correlations were lower for Phases II and III due to the reduced available adsorption sites. This is supported by the investigations of Zietzschmann et al. (2016) on the adsorption behavior of different organic micropollutants in drinking water and WWTP effluent in lab-scale columns. He reported a direct relationship between the feed concentration and adsorbed organic micropollutant mass [30]. This effect can also be seen in the increase in the cumulated mass, which was lower after approximately 12,000 bed volumes, where feed concentrations fell over longer periods (except for diclofenac). In Phase III (12,000 to 26,000 BV) an average removal of 36% could still be recorded for well-adsorbable compounds, such as benzotriazole and carbamazepine. Other moderately adsorbable substances such as acesulfame K and ibuprofen started to breakthrough after only 4000 and 10,000 BV, respectively.
Despite there being different approaches, common criteria for the removal of organic micropollutants require at least 80% removal of a set of defined indicator substances (e.g., in Switzerland and in Baden-Württemberg and Northrhein-Westfalia in Germany). Among these substances are carbamazepine, diclofenac, metoprolol, and benzotriazole. With the standalone GAC filter, these requirements could only be fulfilled until 4000 bed volumes of treated WWTP effluent. Using CBZ, DCF, and SMX as indicator substances, Benstoem et al. (2017) compared various pilot- and full-scale GAC filter studies and reported a broad range of treated bed volumes until breakthrough criteria were reached, mainly depending on the background matrix, especially DOC and operational parameters such as the empty-bed extraction time [1].
The desorption of the organic micropollutants at pilot scale due to variation of the feed concentration, however, could only be observed for moderately adsorbable compounds such as acesulfame K and ibuprofen. However, benzotriazole, carbamazepine, bezafibrate and metoprolol could be detected in the backwashing water. The results show that desorption during backwashing occurs even at low bed volumes. The backwash water must therefore not be discharged but recirculated in the activated-sludge process of the wastewater treatment plant.

4.3. Maximum Desorption of Organic Micropollutants in Water

Desorption tests for organic micropollutants from spent GAC were performed under optimized conditions (with oven-drying for better reproducibility, an extraction time of 3 h and originally sized GAC), and the obtained results were compared with the concentrations of the micropollutants found in the backwash water during the field operation of the filter. The experiments were conducted for four different AC/solvent ratios. Only benzotriazole, carbamazepine, acesulfame K, and metoprolol could be detected in the desorption experiments as well as in the backwash samples. The solubility of these compounds is between one and three magnitudes higher than the solubility of the other investigated organic micropollutants. Analyzing the correlation of the solubility of the individual substances with the concentrations found in the desorption experiments showed positive Pearson correlation coefficients, between 0.34 and 0.40 (calculated for the individual AC/solvent ratios). However, the levels of significance were between α = 0.68 and α = 0.75 and therefore higher than the chosen α = 0.5.
For carbamazepine and metoprolol, the obtained equilibrium concentrations were in the same range as the supernatant concentrations found in the desorption experiments. However, the concentrations of the other detectable compounds were about one order of magnitude lower. This can be explained by the different sampling times of the GAC filter. Backwashing was sampled at 2860 and 3960 bed volumes, whereas the desorption experiments were conducted with fully loaded carbon, after operation for more than 25,000 bed volumes. If the actual loading of the filter (calculated from the cumulated masses) is taken into account, the obtained concentrations are in the same range. Moreover, desorption may also be influenced by the GAC/water ratio. Our results suggest a decrease in concentrations at higher doses. However, the highest investigated GAC/water ratio was 50 g/L and therefore approximately 10 times lower than the actual ratio in the GAC filter.
Due to these uncertainties (different loading of GAC, GAC/water ratio and contact time, which has been discussed in Section 4.1.) the sampling of backwashing and the desorption experiments conducted in deionized water are not directly comparable. Though, desorption of the same substances, which have the highest solubilities in water, from loaded GAC could be identified in both backwash water and the supernatant of the desorption experiments.

4.4. Comparison of Maximum Adsorption Capacities and Extracted and Cumulated Masses

In general, the Langmuir and Freundlich isotherm models are based on different assumptions. The Langmuir model assumes the formation of a monomolecular layer and the energetic homogeneity of adsorption sites. However, the Freundlich model considers the formation of a multimolecular layer in heterogeneous surface energy systems [9]. For our data, all the obtained coefficients of determination were slightly higher for modeling according to Langmuir. Nevertheless, both fits resulted in high coefficients of determination (higher than 0.8), and therefore, it cannot be concluded whether mono- or multilayer adsorption was occurring.
The maximum adsorption capacities (according to Langmuir) were obtained from the adsorption experiments. The highest adsorption capacity (qmax, based on Langmuir modeling) was found for benzotriazole; the lowest, for acesulfame K. This is in accordance with the assessment of adsorbability by Jekel et al. [22], who rated benzotriazole and carbamazepine as well-adsorbable and ibuprofen and acesulfame K as moderately adsorbable compounds. A comparison with cumulated loadings and extracted loadings shows that under realistic conditions (with a complex organic matrix such as treated wastewater), only a fraction of the theoretically available capacity determined in single-substance adsorption experiments is used for the adsorption of organic micropollutants. Most of the surface is used for the adsorption of dissolved organic matter, which is present in concentrations 10 to 100 times higher than that of the organic micropollutants. This was reported by various studies [9,31] and confirmed by our pilot-scale investigations under realistic conditions.
It must be kept in mind that short-term fluctuation in the feed concentrations between sampling, desorption during backwashing and biodegradation were not considered in our calculations of the cumulated masses and may have a significant influence on the GAC loading. The theoretical extraction yields (desorbed mass per mass of GAC) related to cumulated substance-specific loadings were calculated in a range between 0.5% (ACS) and 32.0% (IBP). Comparable studies focusing on the extraction of organic micropollutants from drinking water purifiers reported extraction yields up to 30% (the highest yield was obtained for sulfamethoxazole in acetonitrile) [21]. However, due to the different experimental conditions, these results are not transferable. Higher extraction efficiencies were generally obtained for hydrophobic compounds, such as ibuprofen, benzotriazole and bezafibrate, in our investigations. This was also reported by Larasati et al. (2020), who investigated desorption of pesticides in the context of the in situ regeneration of GAC, applied for drinking-water treatment [32].

4.5. Recommendations and Final Findings

Three different drying methods and the impact of the contact time, GAC particle size and GAC/solvent ratio were investigated. Although no significant differences between the drying methods could be observed, the chosen contact time and particle size had a significant impact on the amount of organic micropollutants extracted. Lower GAC/solvent ratios positively affected the extraction yield. Based on the experimental results, the following recommendations for the further development and improvement of the extraction of organic micropollutants from activated carbon can be made:
  • The extraction time for the loaded GAC and solvent has a major impact on the distribution of the organic compounds between liquid and solid phases. We observed that well-adsorbable compounds, such as benzotriazole or metoprolol, desorb first but then replace other moderate adsorbates that show slower desorption kinetics, as they re-adsorb on the then-available sites previously occupied by the moderate adsorbates. For further experiments, we recommend an extensive study of the desorption process over an even longer time period. Comparable studies conducted for GAC samples from drinking-water treatment plants for water purifiers used extraction times between 2 and 120 h. Since the amount of dissolved organic matter in WWTP effluent is generally many times higher than that in drinking water, resulting in a higher number of blocked pores, even 120 h might not be sufficient to reach equilibrium. Additionally, the kinetics of organic micropollutant adsorption are strongly influenced by the properties of the applied GAC and are therefore not directly transferable.
  • A change in particle size might provide free adsorption sites that were initially not accessible and may lead to uncontrollable bias in the extraction result. We therefore recommend carrying out future experiments with original-sized activated carbon particles only.
  • A lower GAC/solvent ratio leads to higher extraction efficiencies and is therefore recommended. Additionally, replacement of some of the organic micropollutant-enriched solvent may increase the concentration gradient and extraction efficiency, and it would provide several points of the desorption isotherm of the very same sample.
  • Although desorption in ethanol was observed to be about 10 times higher than that in water, and the application is easy, harmless and environmentally friendly, other organic solvents might be more suitable for the complete desorption of organic micropollutants from GAC. Kwon et al. (2017) reported the better extraction of organic micropollutants from GAC in acetonitrile, a solvent typically used in liquid chromatography for the analytical determination of the very same compounds, than in water or methanol [21]. The application of acetonitrile was considered at an early stage of our experiments but decided against due to toxicity and handling issues in the experimental setup. Studies focusing on the in situ regeneration of GAC filters have reported the high removal of adsorbed pesticides by the application of sodium ethoxide as a solvent [32].
Desorption experiments with loaded GAC in deionized water helped with the identification of organic micropollutants that have a tendency to desorb during backwashing or due to changes in the feed water matrix. Although results of backwashing and desorption experiments are not directly comparable, due to the different loading of the GAC, the same substances could be identified in both. Additionally, the results obtained in this study suggest that the solubility of a compound in water is an important parameter influencing the desorption of organic micropollutants caused by the reversal of the concentration gradient due to feed variations or backwashing.
Moreover, the masses extracted in ethanol were compared with the cumulated masses calculated from 72 feed and effluent samples collected during filter operation, showing extraction yields between 0.5% and 30%. The composition of micropollutants extracted in ethanol reflected the concentrations in the feed water of the pilot-scale filter. Extraction might therefore be an interesting tool for further investigations of the competitive behavior or degradation of organic micropollutants in GAC filters. An increase in well-adsorbable substances, such as benzotriazole, and a decrease in moderately adsorbable substances, such as acesulfame K, indicates competitive adsorption. This would mean that the adsorption capacity would be insufficient for the simultaneous adsorption of moderately adsorbable compounds and that the applied GAC should be replaced. However, a major advantage of the method compared to the conventional grab sampling of the feed and effluent of the filter is that compounds that may be present only occasionally are accumulated on the adsorbent surface and can therefore be detected in the supernatants of the extracted samples.

Supplementary Materials

The following are available online at https://www.mdpi.com/2073-4441/12/10/2754/s1. Figure S1: Cumulated mass (mg) and feed and effluent concentrations (ng/L) of (a) sulfamethoxazole, (b) diclofenac, (c) bezafibrate and (d) metoprolol, Figure S2: Relation between the ∆concentrations (adsorbed concentrations) and feed concentrations of the substances (a) benzotriazole, (b) carbamazepine, (c) acesulfame K, (d) ibuprofen, (e) sulfamethoxazole, (f) bezafibrate, (g) diclofenac and (h) metoprolol during the 27-month operation of the pilot-scale filter, Figure S3: Results of adsorption batch experiments for the determination of Freundlich and Langmuir isotherm parameters of (a) benzotriazole, (b) carbamazepine, (c) acesulfame K, (d) ibuprofen, Table S1: Concentrations of all analyzed substances during backwashing at 2860 bed volumes. IN represents the feed concentration at the time of backwashing; OUT, the outlet concentration before backwashing. BACK_1 was measured at the beginning of backwashing (flow, 5 m3/h), and BACK_2, after 30 min of backwashing (flow, 30 m3/h). The organic micropollutant concentrations in the WELL WATER used for backwashing were measured, Table S2: Concentrations of all analyzed substances during backwashing at 3960 bed volumes. IN represents the feed concentration at the time of backwashing; OUT, the outlet concentration before backwashing. BACK_1 was measured at the beginning of backwashing (flow, 5 m3/h), and BACK_2, after 30 min of backwashing (flow, 30 m3/h). The organic micropollutant concentrations in the WELL WATER used for backwashing were measured, Table S3: Theoretical extraction efficiencies for GAC and powdered GAC (ground with a lab mill), representing the ratio between desorbed loadings at an AC/solvent ratio of 10 g/L and the cumulated loadings.

Author Contributions

Conceptualization: D.R. and N.K.; methodology, E.S., M.Š.R. and J.H.; formal analysis, D.R.; investigation, D.R.; resources, E.S.; data curation, D.R.; Writing—Original draft preparation, D.R.; Writing—Review and editing, H.S. and N.K.; visualization, D.R.; supervision, E.S. and J.H.; project administration, H.S. and N.K.; funding acquisition, H.S., J.H. and N.K. All authors have read and agreed to the published version of the manuscript.

Funding

Parts of this research were funded by Federal Ministry of Agriculture, Regions and Tourism, grant number B202770/100927, and by the “Austrian Agency for International Cooperation in Education and Research (OeAD) CEEPUS network, CIII-SI-0708-07-1920 (Umbrella)—Chemistry and Chemical Engineering” grant.

Acknowledgments

The authors acknowledge TU Wien Bibliothek for financial support through its Open Access Funding Program.

Conflicts of Interest

The authors declare no conflict of interest.

References

  1. Benstoem, F.; Nahrstedt, A.; Boehler, M.; Knopp, G.; Montag, D.; Siegrist, H.; Pinnekamp, J. Performance of granular activated carbon to remove micropollutants from municipal wastewater—A meta-analysis of pilot-and large-scale studies. Chemosphere 2017, 185, 105–118. [Google Scholar] [CrossRef] [PubMed]
  2. Bourgin, M.; Beck, B.; Boehler, M.; Borowska, E.; Fleiner, J.; Salhi, E.; Teichler, R.; Von Gunten, U.; Siegrist, H.; McArdell, C.S. Evaluation of a full-scale wastewater treatment plant upgraded with ozonation and biological post-treatments: Abatement of micropollutants, formation of transformation products and oxidation by-products. Water Res. 2018, 129, 486–498. [Google Scholar] [CrossRef] [PubMed] [Green Version]
  3. Rizzo, L.; Malato, S.; Antakyali, D.; Beretsou, V.G.; Đolić, M.B.; Gernjak, W.; Heath, E.; Ivancev-Tumbas, I.; Karaolia, P.; Ribeiro, A.R.L.J.S.O.T.T.E. Consolidated vs new advanced treatment methods for the removal of contaminants of emerging concern from urban wastewater. Sci. Total Environ. 2019, 655, 986–1008. [Google Scholar] [CrossRef] [PubMed]
  4. Luo, Y.; Guo, W.; Ngo, H.H.; Nghiem, L.D.; Hai, F.I.; Zhang, J.; Liang, S.; Wang, X.C.J.S.O.T.T.E. A review on the occurrence of micropollutants in the aquatic environment and their fate and removal during wastewater treatment. Sci. Total Environ. 2014, 473, 619–641. [Google Scholar] [CrossRef] [PubMed]
  5. Michael, I.; Rizzo, L.; McArdell, C.; Manaia, C.; Merlin, C.; Schwartz, T.; Dagot, C.; Fatta-Kassinos, D.J.W.R. Urban wastewater treatment plants as hotspots for the release of antibiotics in the environment: A review. Water Res. 2013, 47, 957–995. [Google Scholar] [CrossRef] [PubMed] [Green Version]
  6. Rizzo, L.; Manaia, C.; Merlin, C.; Schwartz, T.; Dagot, C.; Ploy, M.; Michael, I.; Fatta-Kassinos, D. Urban wastewater treatment plants as hotspots for antibiotic resistant bacteria and genes spread into the environment: A review. Sci. Total Environ. 2013, 447, 345–360. [Google Scholar] [CrossRef]
  7. Snyder, S.A.; Adham, S.; Redding, A.M.; Cannon, F.S.; DeCarolis, J.; Oppenheimer, J.; Wert, E.C.; Yoon, Y. Role of membranes and activated carbon in the removal of endocrine disruptors and pharmaceuticals. Desalination 2007, 202, 156–181. [Google Scholar] [CrossRef]
  8. Rossner, A.; Snyder, S.A.; Knappe, D.R. Removal of emerging contaminants of concern by alternative adsorbents. Water Res. 2009, 43, 3787–3796. [Google Scholar] [CrossRef]
  9. Worch, E. Adsorption Technology in Water Treatment: Fundamentals, Processes, and Modeling; Walter de Gruyter: Berlin, Germany, 2012. [Google Scholar]
  10. Crittenden, J.; Trusell, R.; Hand, D.; Howe, K.; Techobanoglous, G. Water Treatment Principle and Design; John Wiley & Sons: New Jersey, NJ, USA, 2005. [Google Scholar]
  11. Aschermann, G.; Neubert, L.; Zietzschmann, F.; Jekel, M.J.W.R. Impact of different DOM size fractions on the desorption of organic micropollutants from activated carbon. Water Res. 2019, 161, 161–170. [Google Scholar] [CrossRef]
  12. Zietzschmann, F.; Worch, E.; Altmann, J.; Ruhl, A.S.; Sperlich, A.; Meinel, F.; Jekel, M.J.W.R. Impact of EfOM size on competition in activated carbon adsorption of organic micro-pollutants from treated wastewater. Water Res. 2014, 65, 297–306. [Google Scholar] [CrossRef]
  13. De Ridder, D.J.; Verliefde, A.R.D.; Heijman, S.G.J.; Verberk, J.Q.J.C.; Rietveld, L.C.; Van Der Aa, L.T.J.; Amy, G.L.; Van Dijk, J.C. Influence of natural organic matter on equilibrium adsorption of neutral and charged pharmaceuticals onto activated carbon. Water Sci. Technol. 2011, 63, 416–423. [Google Scholar] [CrossRef] [PubMed]
  14. Hu, J.; Shang, R.; Heijman, B.; Rietveld, L.J.C. Influence of activated carbon preloading by EfOM fractions from treated wastewater on adsorption of pharmaceutically active compounds. Chemosphere 2016, 150, 49–56. [Google Scholar] [CrossRef]
  15. Aschermann, G.; Zietzschmann, F.; Jekel, M. Influence of dissolved organic matter and activated carbon pore characteristics on organic micropollutant desorption. Water Res. 2018, 133, 123–131. [Google Scholar] [CrossRef]
  16. Corwin, C.J.; Summers, R.S. Adsorption and desorption of trace organic contaminants from granular activated carbon adsorbers after intermittent loading and throughout backwash cycles. Water Res. 2011, 45, 417–426. [Google Scholar] [CrossRef] [PubMed]
  17. To, P.C.; Mariñas, B.J.; Snoeyink, V.L.; Ng, W.J. Effect of pore-blocking background compounds on the kinetics of trace organic contaminant desorption from activated carbon. Environ. Sci. Technol. 2008, 42, 4825–4830. [Google Scholar] [CrossRef] [PubMed]
  18. Aschermann, G.; Schröder, C.; Zietzschmann, F.; Jekel, M. Organic micropollutant desorption in various water matrices-Activated carbon pore characteristics determine the reversibility of adsorption. Chemosphere 2019, 237, 124415. [Google Scholar] [CrossRef]
  19. Rattier, M.; Reungoat, J.; Keller, J.; Gernjak, W. Removal of micropollutants during tertiary wastewater treatment by biofiltration: Role of nitrifiers and removal mechanisms. Water Res. 2014, 54, 89–99. [Google Scholar] [CrossRef]
  20. Sbardella, L.; Comas, J.; Fenu, A.; Rodriguez-Roda, I.; Weemaes, M. Advanced biological activated carbon filter for removing pharmaceutically active compounds from treated wastewater. Sci. Total Environ. 2018, 636, 519–529. [Google Scholar] [CrossRef]
  21. Kwon, D.-S.; Tak, S.-Y.; Lee, J.-E.; Kim, M.-K.; Lee, Y.H.; Han, D.W.; Kang, S.; Zoh, K.-D. Desorption of micropollutant from spent carbon filters used for water purifier. Environ. Sci. Pollut. Res. 2017, 24, 17606–17615. [Google Scholar] [CrossRef]
  22. Jekel, M.; Dott, W. Leitfaden Polare organische Spurenstoffe als Indikatoren im anthropogen beeinflussten Wasserkreislauf, Ergebnisse des Querschnittsthemas “Indikatorsubstanzen”. Vom Wasser 2013, 111, 67–114. [Google Scholar]
  23. Kim, S.; Chen, J.; Cheng, T.; Gindulyte, A.; He, J.; He, S.; Li, Q.; Shoemaker, B.A.; Thiessen, P.A.; Yu, B.; et al. PubChem 2019 update: Improved access to chemical data. Nucleic Acids Res. 2018, 47, D1102–D1109. [Google Scholar] [CrossRef] [PubMed] [Green Version]
  24. Schaar, H.; Clara, M.; Gans, O.; Kreuzinger, N. Micropollutant removal during biological wastewater treatment and a subsequent ozonation step. Environ. Pollut. 2010, 158, 1399–1404. [Google Scholar] [CrossRef] [PubMed]
  25. Aumeier, B.M.; Dang, A.H.; Ohs, B.; Yüce, S.l.; Wessling, M. Aqueous-phase temperature swing adsorption for pesticide removal. Environ. Sci. Technol. 2018, 53, 919–927. [Google Scholar] [CrossRef] [PubMed]
  26. Freihardt, J.; Jekel, M.; Ruhl, A.S. Comparing test methods for granular activated carbon for organic micropollutant elimination. J. Environ. Chem. Eng. 2017, 5, 2542–2551. [Google Scholar] [CrossRef]
  27. Sontheimer, H.; Crittenden, J.C.; Summers, R.S. Activated Carbon for Water Treatment; DVGW-Forschungsstelle, Engler-Bunte-Institut, Universitat Karlsruhe TH: Karlsruhe, Germany, 1988; Volume 90. [Google Scholar]
  28. Piai, L.; Dykstra, J.E.; Adishakti, M.G.; Blokland, M.; Langenhoff, A.A.; van der Wal, A. Diffusion of hydrophilic organic micropollutants in granular activated carbon with different pore sizes. Water Res. 2019, 162, 518–527. [Google Scholar] [CrossRef]
  29. Nowotny, N.; Epp, B.; von Sonntag, C.; Fahlenkamp, H. Quantification and modeling of the elimination behavior of ecologically problematic wastewater micropollutants by adsorption on powdered and granulated activated carbon. Environ. Sci. Technol. 2007, 41, 2050–2055. [Google Scholar] [CrossRef]
  30. Zietzschmann, F.; Stützer, C.; Jekel, M. Granular activated carbon adsorption of organic micro-pollutants in drinking water and treated wastewater–aligning breakthrough curves and capacities. Water Res. 2016, 92, 180–187. [Google Scholar] [CrossRef]
  31. Bunmahotama, W.; Hung, W.-N.; Lin, T.-F. Prediction of the adsorption capacities for four typical organic pollutants on activated carbons in natural waters. Water Res. 2017, 111, 28–40. [Google Scholar] [CrossRef]
  32. Larasati, A.; Fowler, G.D.; Graham, N.J. Chemical regeneration of granular activated carbon: Preliminary evaluation of alternative regenerant solutions. Environ. Sci. Water Res. Technol. 2020, 6, 2043–2056. [Google Scholar] [CrossRef]
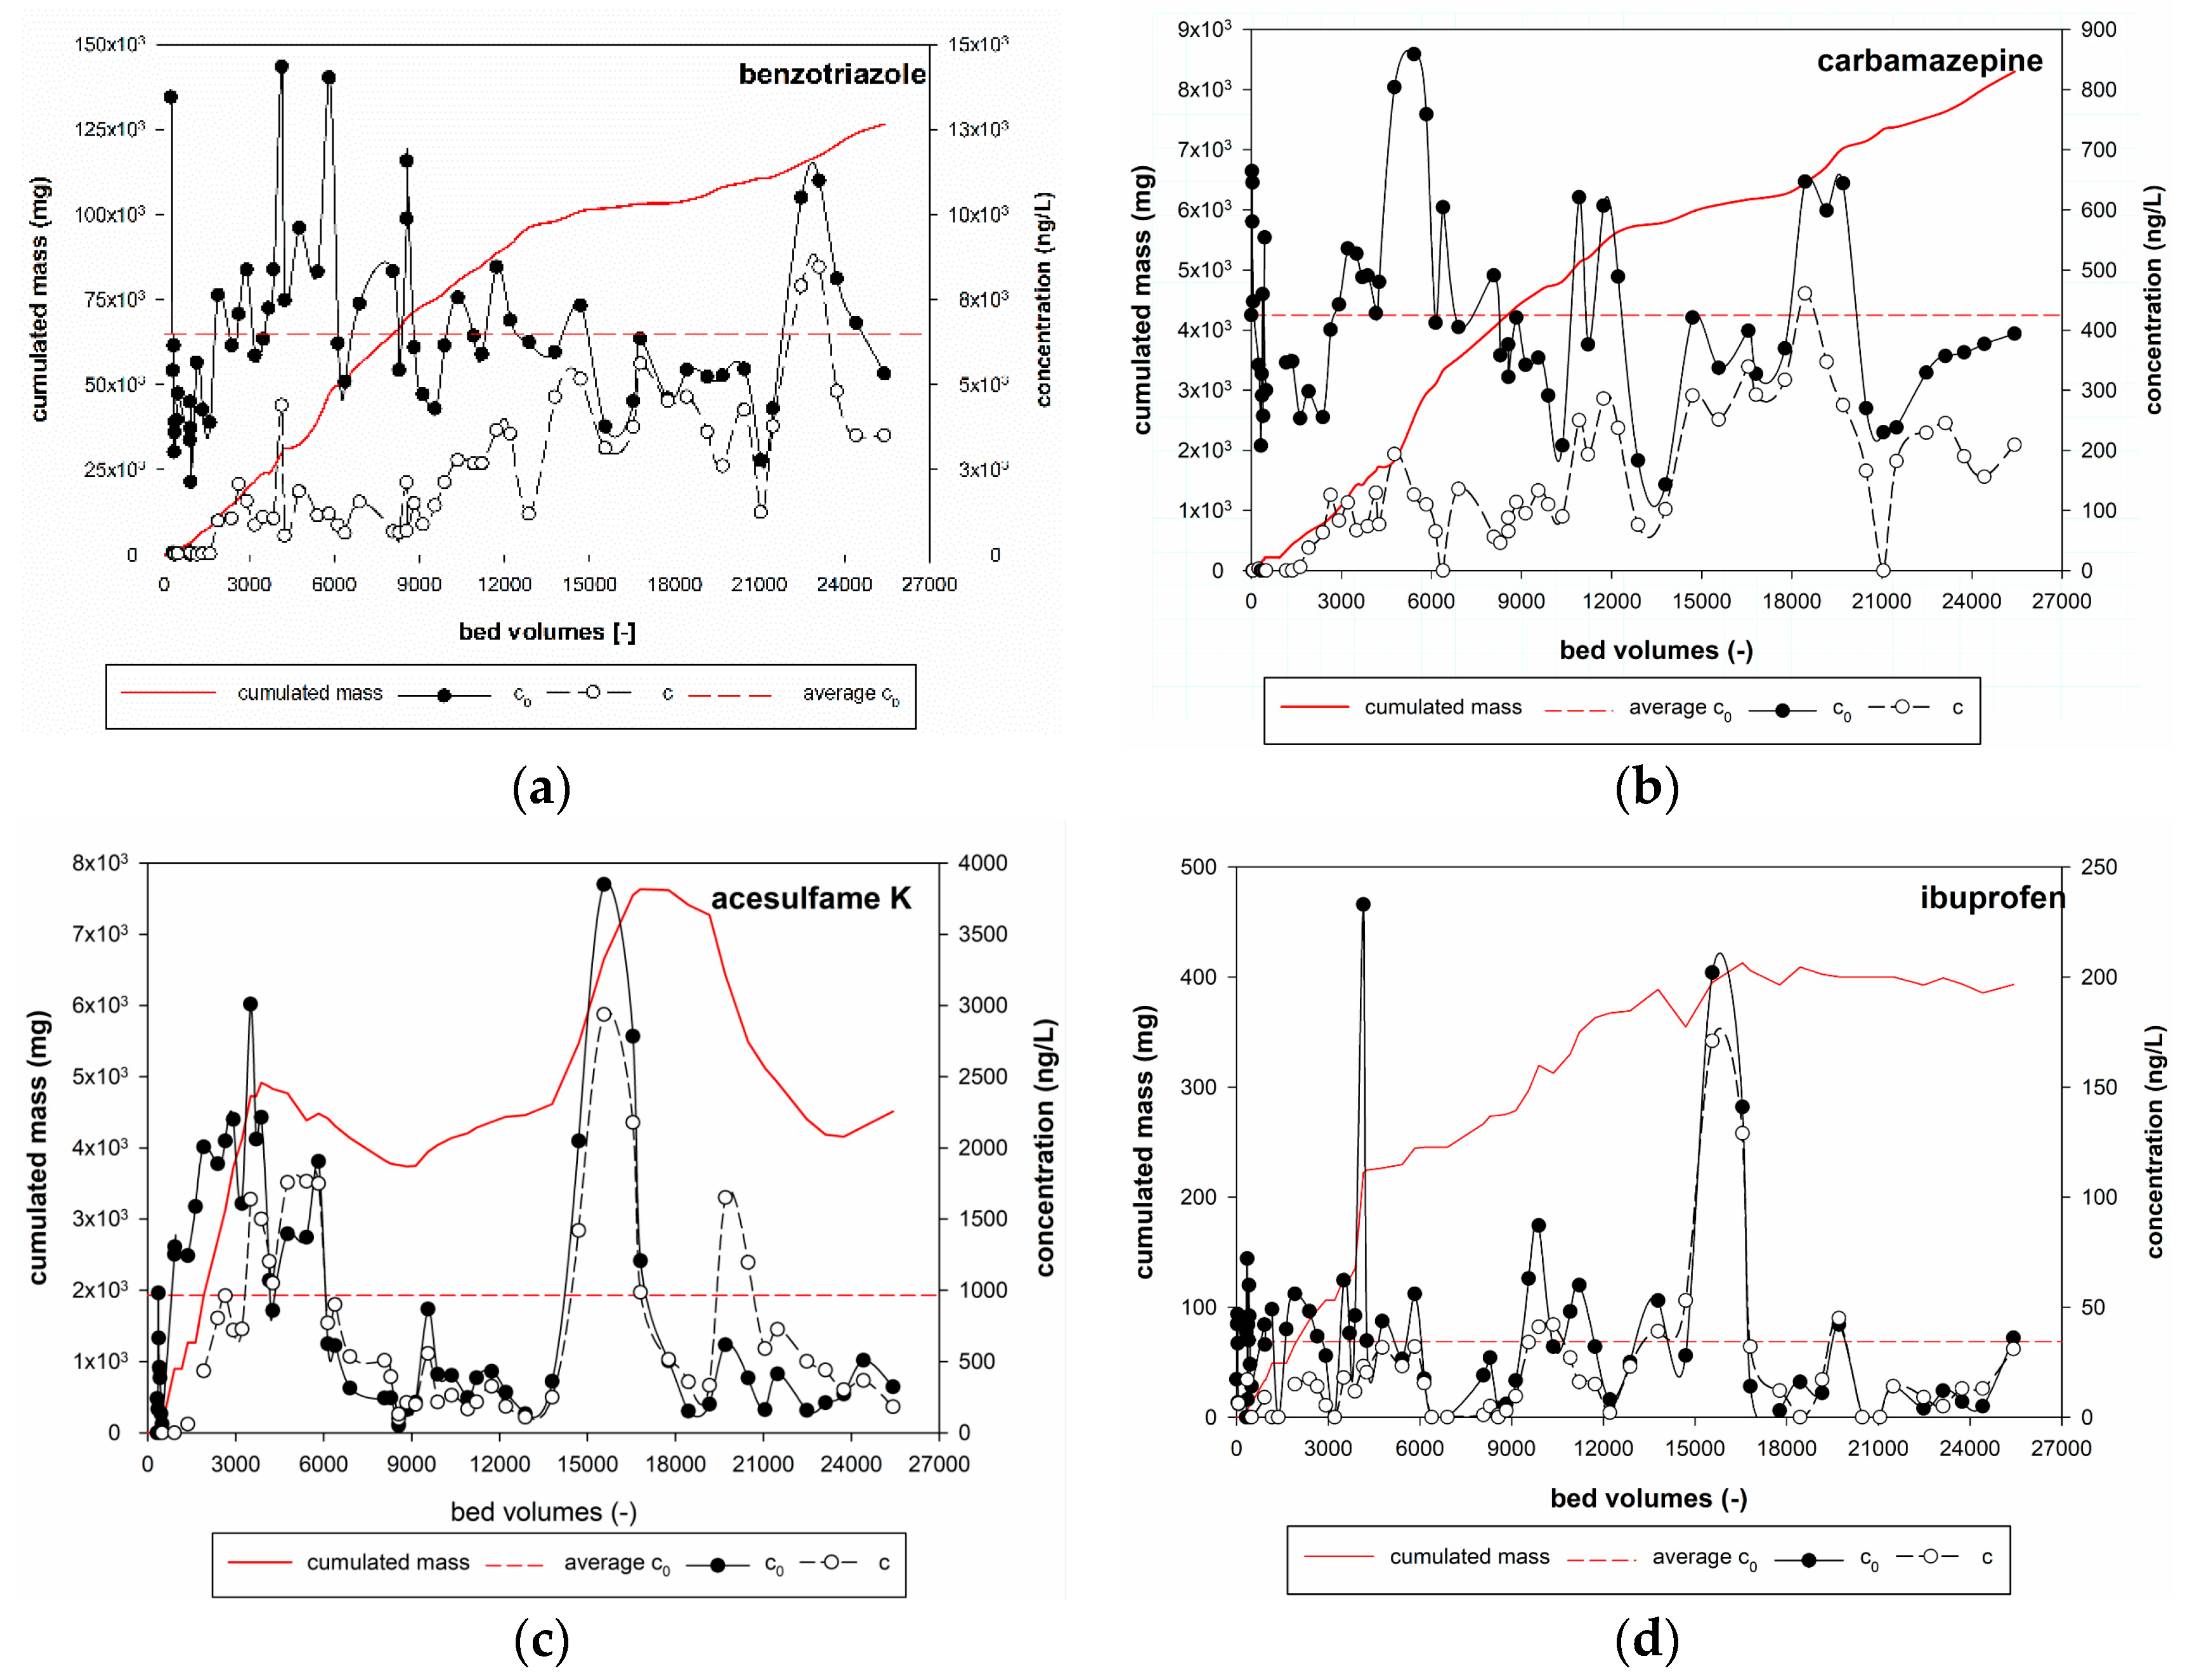
Figure 1. Cumulated mass (mg) and feed and effluent concentrations (ng/L) of the well-adsorbing compounds (a) benzotriazole and (b) carbamazepine and moderately adsorbing compounds (c) acesulfame K and (d) ibuprofen.
Water 12 02754 g001
Figure 2. Concentrations of indicator substances during backwashing. IN represents the feed concentration at time of backwashing; OUT, the outlet concentration before backwashing. BACK_1 was measured at the beginning of backwashing (flow, 5 m3/h) and BACK_2, after 30 min of backwashing (flow, 30 m3/h). The organic micropollutants concentrations in the WELL WATER, used for backwashing, were measured. Measurements were conducted two times at 2860 (a) and 3960 bed volumes (b).
Water 12 02754 g002
Figure 3. Comparison of the investigated drying methods (AIR_1&2: air-drying at room temperature of 25 °C, OVEN_1&2: oven-drying at 105 °C, and LYO_1&2: lyophilization) for extraction of organic micropollutants in (a) deionized water (Sample 1), (b) ethanol (Sample 1), (c) deionized water (Sample 2) and (d) ethanol (Sample 2).
Water 12 02754 g003aWater 12 02754 g003b
Figure 4. Concentrations of monitored organic micropollutants after 1, 3, 6, 9, 18, 24 and 48 h of extraction time in desorption experiments with oven-dried (105 °C) granulated activated carbon. The chosen indicator substances are given in (a), and the other analyzed organic micropollutants, in (b).
Water 12 02754 g004
Figure 5. Impact of particle size and GAC/solvent ratio on desorption of the analyzed organic micropollutants in (a) deionized water GAC, (b) deionized water pGAC, (c) ethanol GAC and (d) ethanol pGAC after an extraction time of 3 h.
Water 12 02754 g005
Figure 6. Comparison of concentrations of organic micropollutants found in backwash water and in desorption experiments conducted in deionized water.
Water 12 02754 g006
Figure 7. Comparison of calculated adsorbed masses, based on sampling during the operation of the pilot-scale filter with maximum adsorption capacities, modeled according to Langmuir (only available for the indicator substances BTA, CBZ, ACS, and IBP), as well as with the maximum extracted masses for GAC and pGAC in ethanol.
Water 12 02754 g007
Table 1. Analyzed organic micropollutants in the feed and effluent of the pilot-scale filter and the desorption experiments.
SubstanceAbbreviationCAS NumberCompound ClassAdsorptive RemovalMolecular Weight (g/mol)Log KOW (-)
benzotriazoleBTA95-14-7complexing agenthigh (1)119.13 (2)1.44 (2)
carbamazepineCBZ298-46-4antiepileptichigh (1)236.27 (2)2.77 (2)
acesulfame KACS55589-62-3sweetenermedium (1)201.24 (2)−1.33 (3)
ibuprofenIBP15687-27-1analgesicmedium (1)206.29 (2)3.97 (2)
sulfamethoxazoleSMX723-46-6antibioticmedium (1)253.28 (2)0.89 (2)
diclofenacDCF15307-79-6analgesichigh (1)296.15 (2)0.70 (2)
bezafibrateBZF41859-67-0lipid-lowering agenthigh (1)361.82 (2)4.25 (4)
metoprololMET37350-58-6beta blockerhigh (1)267.36 (2)1.88 (2)
(1) [22]; (2) [23]; (3) [new citation1]; (4) [new citation2].
Table 2. Overview of tested drying methods.
Drying MethodTemperature (°C)Time
Air-drying257 days
Oven-drying10548 h
Lyophilization−80/−3024 h/24 h
Table 3. Median and mean feed concentrations of the organic micropollutants during the 27-month operation of the granular activated carbon (GAC) filter.
ACSMETBTASMXCBZBZFDCFIBP
ng/Lng/Lng/Lng/Lng/Lng/Lng/Lng/L
Number of measurements6566677168727271
Median 5094416.141204002501.33028
Mean ± standard deviation965±476±6.468±23±425±336±1.250±34±
8972702.5292214924956340
Table 4. Freundlich and Langmuir isotherm parameters of benzotriazole, carbamazepine, acesulfame K and ibuprofen obtained in single-solute adsorption experiments in deionized water after 48 h.
Freundlich ParametersLangmuir Parameters
KFnR2qmaxbR2
(ng1–n × Ln)/g--ng/gL/ng-
BTA1.80 ± 3.28 × 1060.46 ± 0.26 × 1060.8873.46 ± 136.79 × 1061.82 ± 2.79 × 1030.88
CBZ0.77 ± 1.24 × 1060.39 ± 0.24 × 1060.9127.50 ± 51.40 × 1062.76 ± 4.22 × 1030.90
ACS0.61 ± 0.66 × 1060.27 ± 0.16 × 1060.834.58 ± 5.43 × 10611.96 ± 10.61 × 1030.90
IBP1.20 ± 1.40 × 1060.31 ± 0.18 × 1060.8610.07 ± 15.83 × 10620.61 ± 24.07 × 1030.93