1. Introduction
Under climate change, agricultural losses caused by drought have become more and more severe [
1,
2]. Droughts are generally classified into four types: agricultural drought, meteorological drought, hydrological drought, and socioeconomic drought [
3,
4]. The development and end of meteorological drought are relatively fast, while agricultural drought occurs later than meteorological drought [
5,
6,
7]. It is relatively easy to assess meteorological droughts based on current global precipitation data records [
8,
9,
10]. Therefore, investigations into the time lag for meteorological drought to agricultural drought provides an alternative method for monitoring and forecasting agricultural drought [
6].
Meteorological drought is usually defined based on the degree of dryness (in comparison to some “normal” or average amount) and the duration of the dry period [
11]. Agricultural drought links various characteristics of meteorological (or hydrological) drought to agricultural impacts including precipitation shortages, differences between actual and potential evapotranspiration, soil water deficits, and reduced groundwater or reservoir levels [
11]. The following signs of progress have been achieved in studies on meteorological drought and agricultural drought, respectively. Meteorological drought is usually investigated with the percentage of precipitation anomalies (Pa) [
12,
13], standardized precipitation index (SPI) [
14,
15,
16], relative moisture index (
M) [
7,
17], Palmer drought severity index (PDSI) [
18,
19], and comprehensive meteorological drought index (CI), etc. [
20,
21]. The agricultural drought is usually investigated using the crop water stress index (CWSI) [
22], crop water deficit index (
CWDI) [
23], and remote sensing inversion (vegetation index), etc. [
24,
25,
26]. Winter wheat drought can be characterized by the above indexes of CWSI,
CWDI, and remote sensing inversion. The time lag of agricultural drought to meteorological drought is mostly calculated based on indexes [
18,
27] and hydrological models [
28,
29,
30]. Although these models are effective tools for investigating the time lag of drought, the model requires the calculation of response time lags for agricultural drought to meteorological drought. These calculations also involve uncertainties in model structure parameterization and meteorological forcing. Regarding the factors affecting droughts, studies have mainly focused on the discrimination of influencing factors and influence degree on droughts such as calculating the correlation of the crop water stress index (CWSI), precipitation anomaly and annual precipitation, annual temperature, elevation, slope, and aspect [
31,
32,
33,
34]. Only a handful of research papers can be found that have studied the relationship between drought time lag and geographical factors [
3,
6,
27].
Climate change can change the distribution of global water and heat resources, leading to frequent extreme weather events including drought [
35,
36]. The Huaihe River Basin is one of the key agricultural production areas in China and is prone to drought. Winter wheat is an important high-quality food crop in the Huaihe River Basin and is vulnerable to drought, especially during the growing period [
37,
38]. It is therefore important to study the response mechanism of winter wheat drought to meteorological drought, and the time lag from meteorological drought to winter wheat drought in different growth stages [
6], as it will provide scientific guidance for establishing early warnings for winter wheat drought and improving the disaster prevention and mitigation capacity in the Huaihe River Basin.
At present, the research on drought based on CWDI and M mainly analyzes the spatial and temporal distribution of drought with a single index, rarely involving the correlation and time lag of CWDI and M research. As the CWDI is calculated in ten days, and M is applicable to the monitoring and assessment of drought in the scale above ten days of crop growth season, in order to ensure the relative consistency of scale, the calculation of M was also in ten days. Therefore, CWDI was used to examine winter wheat drought, and M was used to examine meteorological drought in this study. The spatiotemporal evolution characteristics of winter wheat drought and meteorological drought above the Bengbu Sluice in the Huaihe River Basin were analyzed, then cross wavelet analysis on CWDI and M was carried out by MATLAB to calculate the time lag for meteorological drought to winter wheat drought. The relationship between the time lag of winter wheat drought and underlying surface geographical factors was discussed by grey relation analysis, and the factors affecting the time lag of winter wheat drought in the study area were further analyzed.
2. Study Area
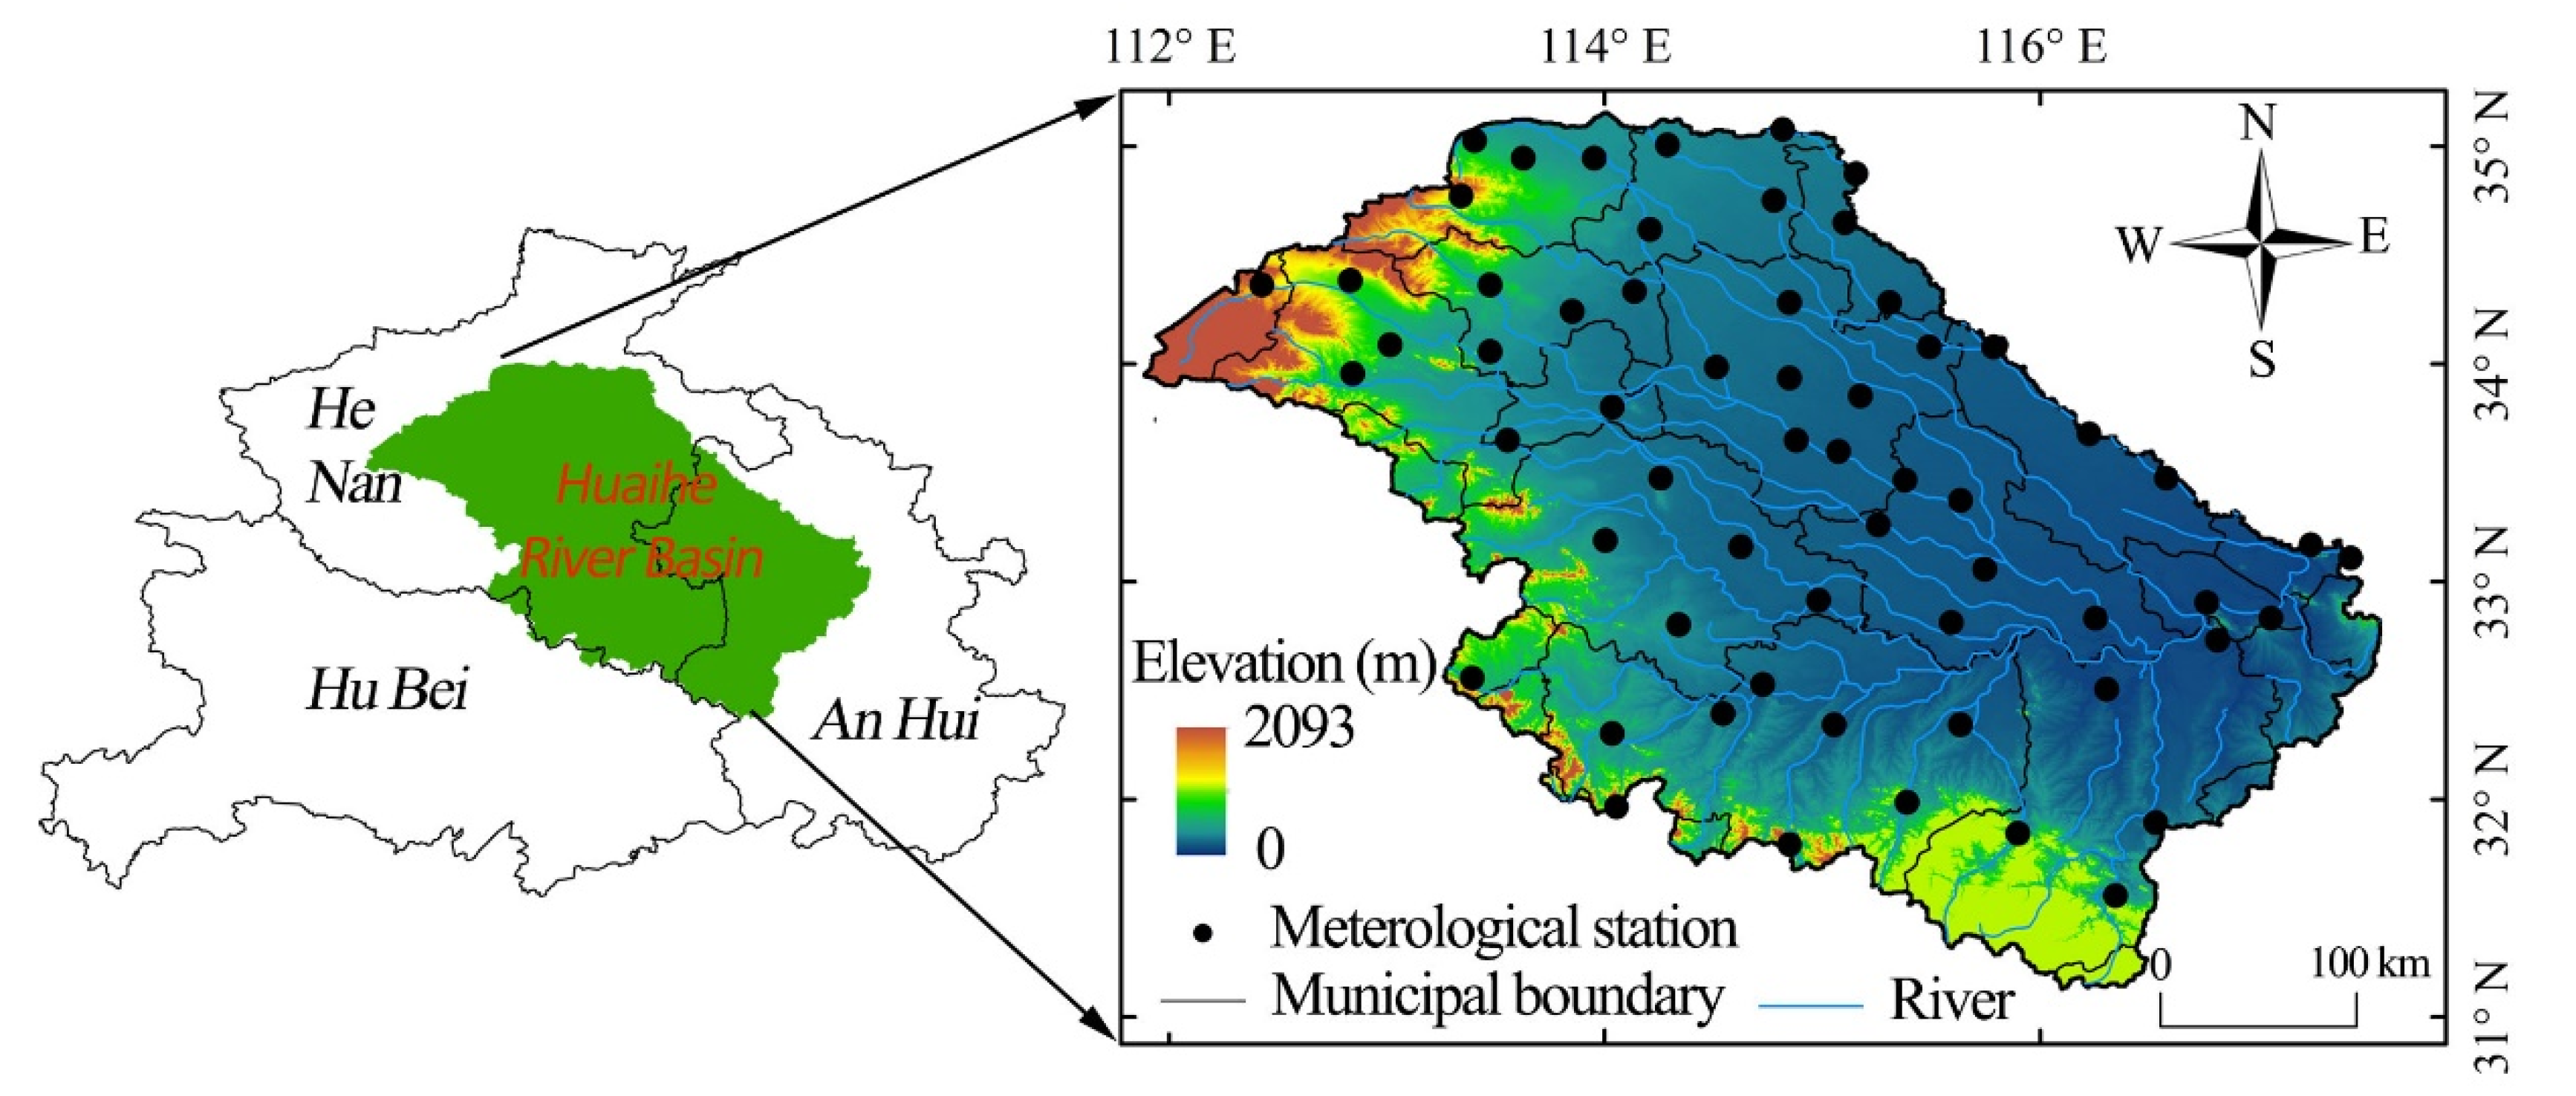
The study area is located above the Bengbu Sluice in the Huaihe River Basin, and the total area is about 121,000 km
2 (
Figure 1). The terrain of the study area is complex. The annual mean temperature ranges from 12.1 to 15.8 °C, and the mean yearly precipitation is about 861 mm. The interannual variation of precipitation is significant, which shows a peak trend, and annual mean precipitation shows the spatial distribution characteristics of high in the south and low in the north, which form typical regional drought and flood characteristics of “flooding under heavy rainfall, waterlogging under normal rainfall, and drought under no rainfall” [
39,
40,
41]. Agricultural droughts and floods have occurred once every four years in the study area from 1949 to the present, which is caused by special geographical location, climatic conditions, and underlying surface [
23].
3. Data and Methods
3.1. Data
The data of 60 meteorological stations were provided by the National Meteorological Information Center of China Meteorological Administration from 1961 to 2015 including temperature, precipitation, relative humidity, sunshine duration, wind speed, and daily radiation quantity, etc. The elevation data were obtained from the CGIAR-CSI SRTM 90 m Database via
http://srtm.csi.cgiar.org. The soil field capacity data were obtained by the National Meteorological Information Center of the China Meteorological Administration with a spatial resolution of 0.5° × 0.5°. The data of the depth of the shallow groundwater were derived from the Institute of Hydrogeology and Environmental Geology, Chinese Academy of Geological Sciences.
3.2. Methods
3.2.1. Division of the Growth Periods of Winter Wheat
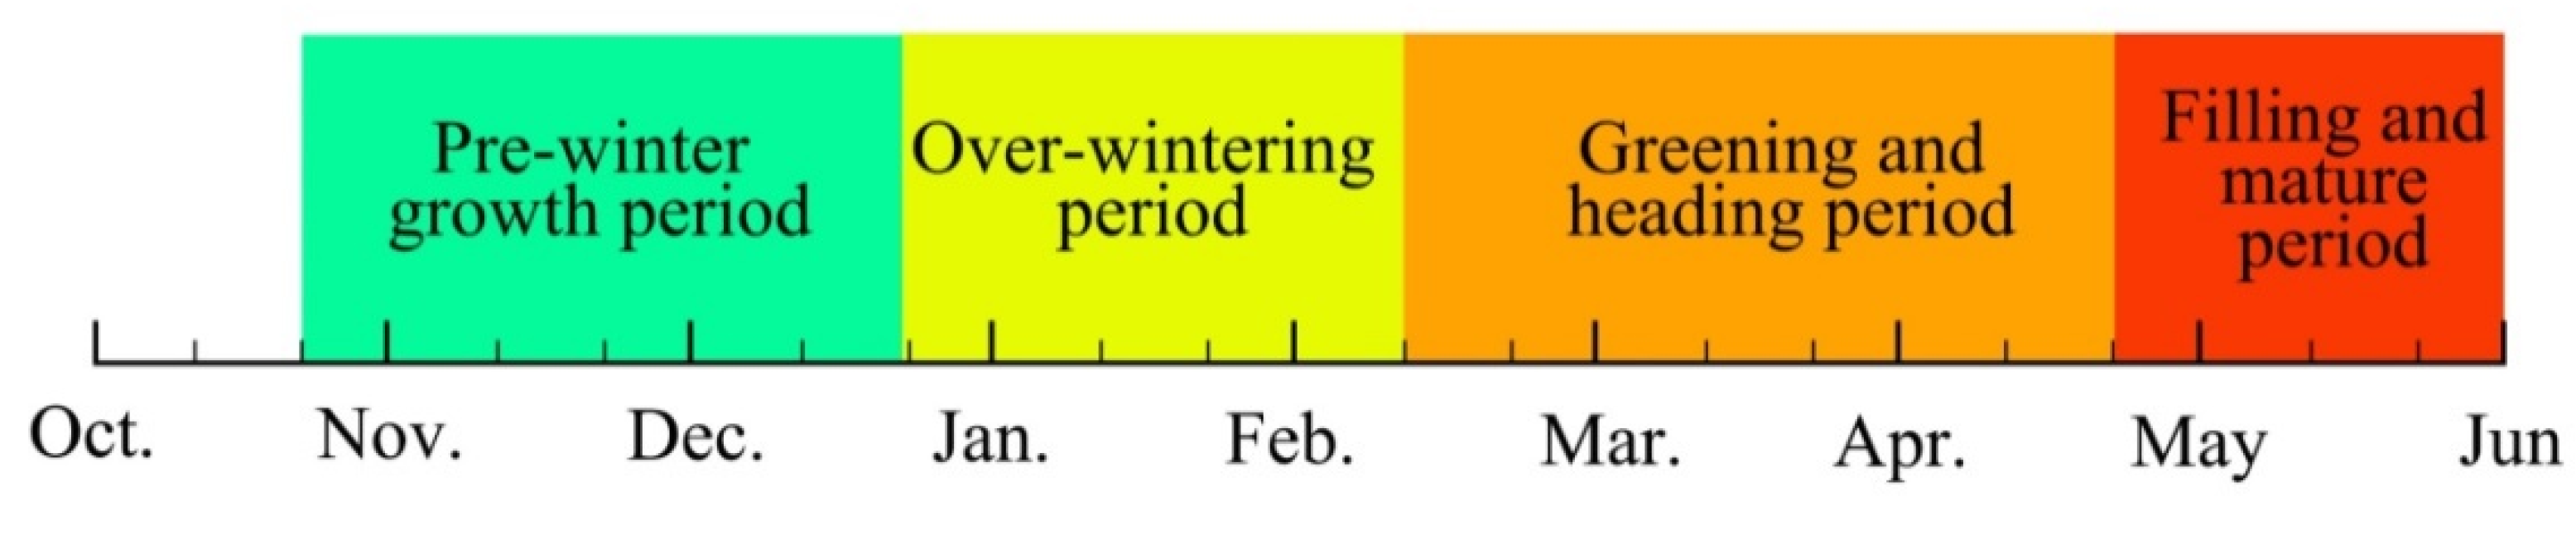
Winter wheat shows different traits in different growth periods, and the water demand is also different. Therefore, the impacts of drought on the winter wheat should be assessed for different growth periods. The determination of the growth periods of winter wheat was based on the classification of the winter wheat growth periods at the area above the Bengbu Sluice in the Huaihe River Basin reported by [
42] (
Figure 2).
3.2.2. Agriculture Drought Index
The crop water deficit index (
CWDI) was selected to characterize the impacts of drought on winter wheat.
CWDI is the ratio of crop water deficit to crop water demand. The crop water deficit is the difference between crop water demand and actual water supply and is described in the Equations (1) and (2) as follows.
where
P is the cumulative precipitation for 10 days;
,
,
,
, and
are the weighting factors of the water deficit index for different periods, where
is 0.3,
is 0.25,
is 0.2,
is 0.15, and
is 0.1; and
ETmi is the water demand of crop for ten days.
ETmi is determined by the potential evapotranspiration under the local climatic conditions and characteristics of crop (see Equation (3)).
where
Kc is the crop coefficient, and the
Kc of winter wheat in Anhui Province and Henan Province each month (
Table 1).
ET0 is the reference crop evapotranspiration in a certain ten days and is calculated by the Penman–Monteith formula recommended by the Food and Agriculture Organization of the United Nations (FAO) (see Equation (4)).
where
ET0 represents the reference crop evapotranspiration (mm·day
−1);
Rn is the surface net radiation (MJ·m
−2·day
−1); ∆ is the slope of the saturated vapor pressure curve (kPa·°C
−1);
T is the daily mean temperature (°C);
U2 is the windspeed at the height of 2m (m·s
−1);
es is the saturated vapor pressure (kPa);
ea is the actual vapor pressure (kPa); and
γ is the psychrometric constant (kPa·°C
−1). The relevant parameters in Equation (4) are mainly calculated according to meteorological factors such as temperature, average relative humidity, sunshine duration, and wind speed. Refer to GBT 20481-2017 grades of meteorological drought for specific steps.
The drought classification of crop water deficit index (
CWDI) of the winter wheat was based on the national classification criteria for winter wheat drought (
Table 2) [
43].
3.2.3. Meteorological Drought Index
The relative moisture index (
M) was selected to characterize the meteorological drought (
Table 3) [
44].
M is a standard measure for determining the balance between precipitation and evaporation over a certain period (see Equation (5)), reflecting the water balance of the crop during the growth period. It is generally used for measuring and evaluating drought above the scale of ten days in the growth period.
where
is the precipitation (mm) over a period of time; and
is the potential evapotranspiration (mm), which is calculated by the Penman–Monteith formula (see Equation (4)) recommended by the FAO.
3.2.4. Wavelet Analysis
Time-domain analysis and frequency domain analysis are common analysis methods for analyzing time-series data. It is necessary to combine the time domain and frequency domain to solve the problems in a time series. Therefore, the wavelet method with multi-resolution capability in the time-frequency domain presented in Grinsted et al. [
45] was adopted in this paper.
(1) Cross wavelet coherence spectrum
The cross-wavelet coherence spectrum can reflect the correlation between two sets of data in the time-frequency domain (see Equation (6))
where
is the smooth operator, which is calculated according to the following Equation (7).
where
refers to the smoothing along the axis of the wavelet scale (see Equation (8)) and
refers to smoothing along the time axis (see Equation (9))
where
and
are normalized constants and
is the rectangular function.
(2) Cross wavelet power spectrum
The cross-wavelet power spectrum is a new technology that combines cross-spectrum analysis and wavelet transform, which can better reflect the correlation between two time series in the time-frequency domain, so as to analyze the lag effect between two sets of data. The cross wavelet transformation of two specific time series
and
can be defined as
, where
represents their complex conjugate. Cross wavelet energy is expressed as
. The complex parameter
is the local relative phase of
and
at the time-frequency domain. The theoretical formula of cross wavelet power and their background power spectrum
and
of the two-time series are expressed as follows:
where
is the probability distribution function of
defined by the square roots of the product of two
distributions.
The phase angle of the cross wavelet is defined as:
3.2.5. Grey Relation Analysis
Grey relation analysis (GRA) [
46] was applied to analyze the relationship between the time lag of winter wheat drought and geographical factors of the underlying surface. The basic idea of grey system theory involves the grey relation of each subsystem, and the numerical relationship between the elements in the system was discussed based on a certain method. GRA is very suitable for analysis of the dynamic process. If the trends of two elements are the same, that is, the synchronization degree of change is high, it can be considered that the correlation degree between them is relatively high; otherwise, it is relatively low.
3.2.6. Mann–Kendall Test
The statistical significance of the trend in the monthly and annual series was analyzed by applying the non-parametric Mann–Kendall (MK) test. The MK test has been widely used in meteorological time series data such as temperature [
47] and precipitation [
48]. The test validates the null hypothesis of no trend, assuming that there is an increased or decreased trend.
4. Results
4.1. Spatiotemporal Characteristics of Winter Wheat Drought
4.1.1. Temporal Dynamics of Winter Wheat Drought and Meteorological Drought
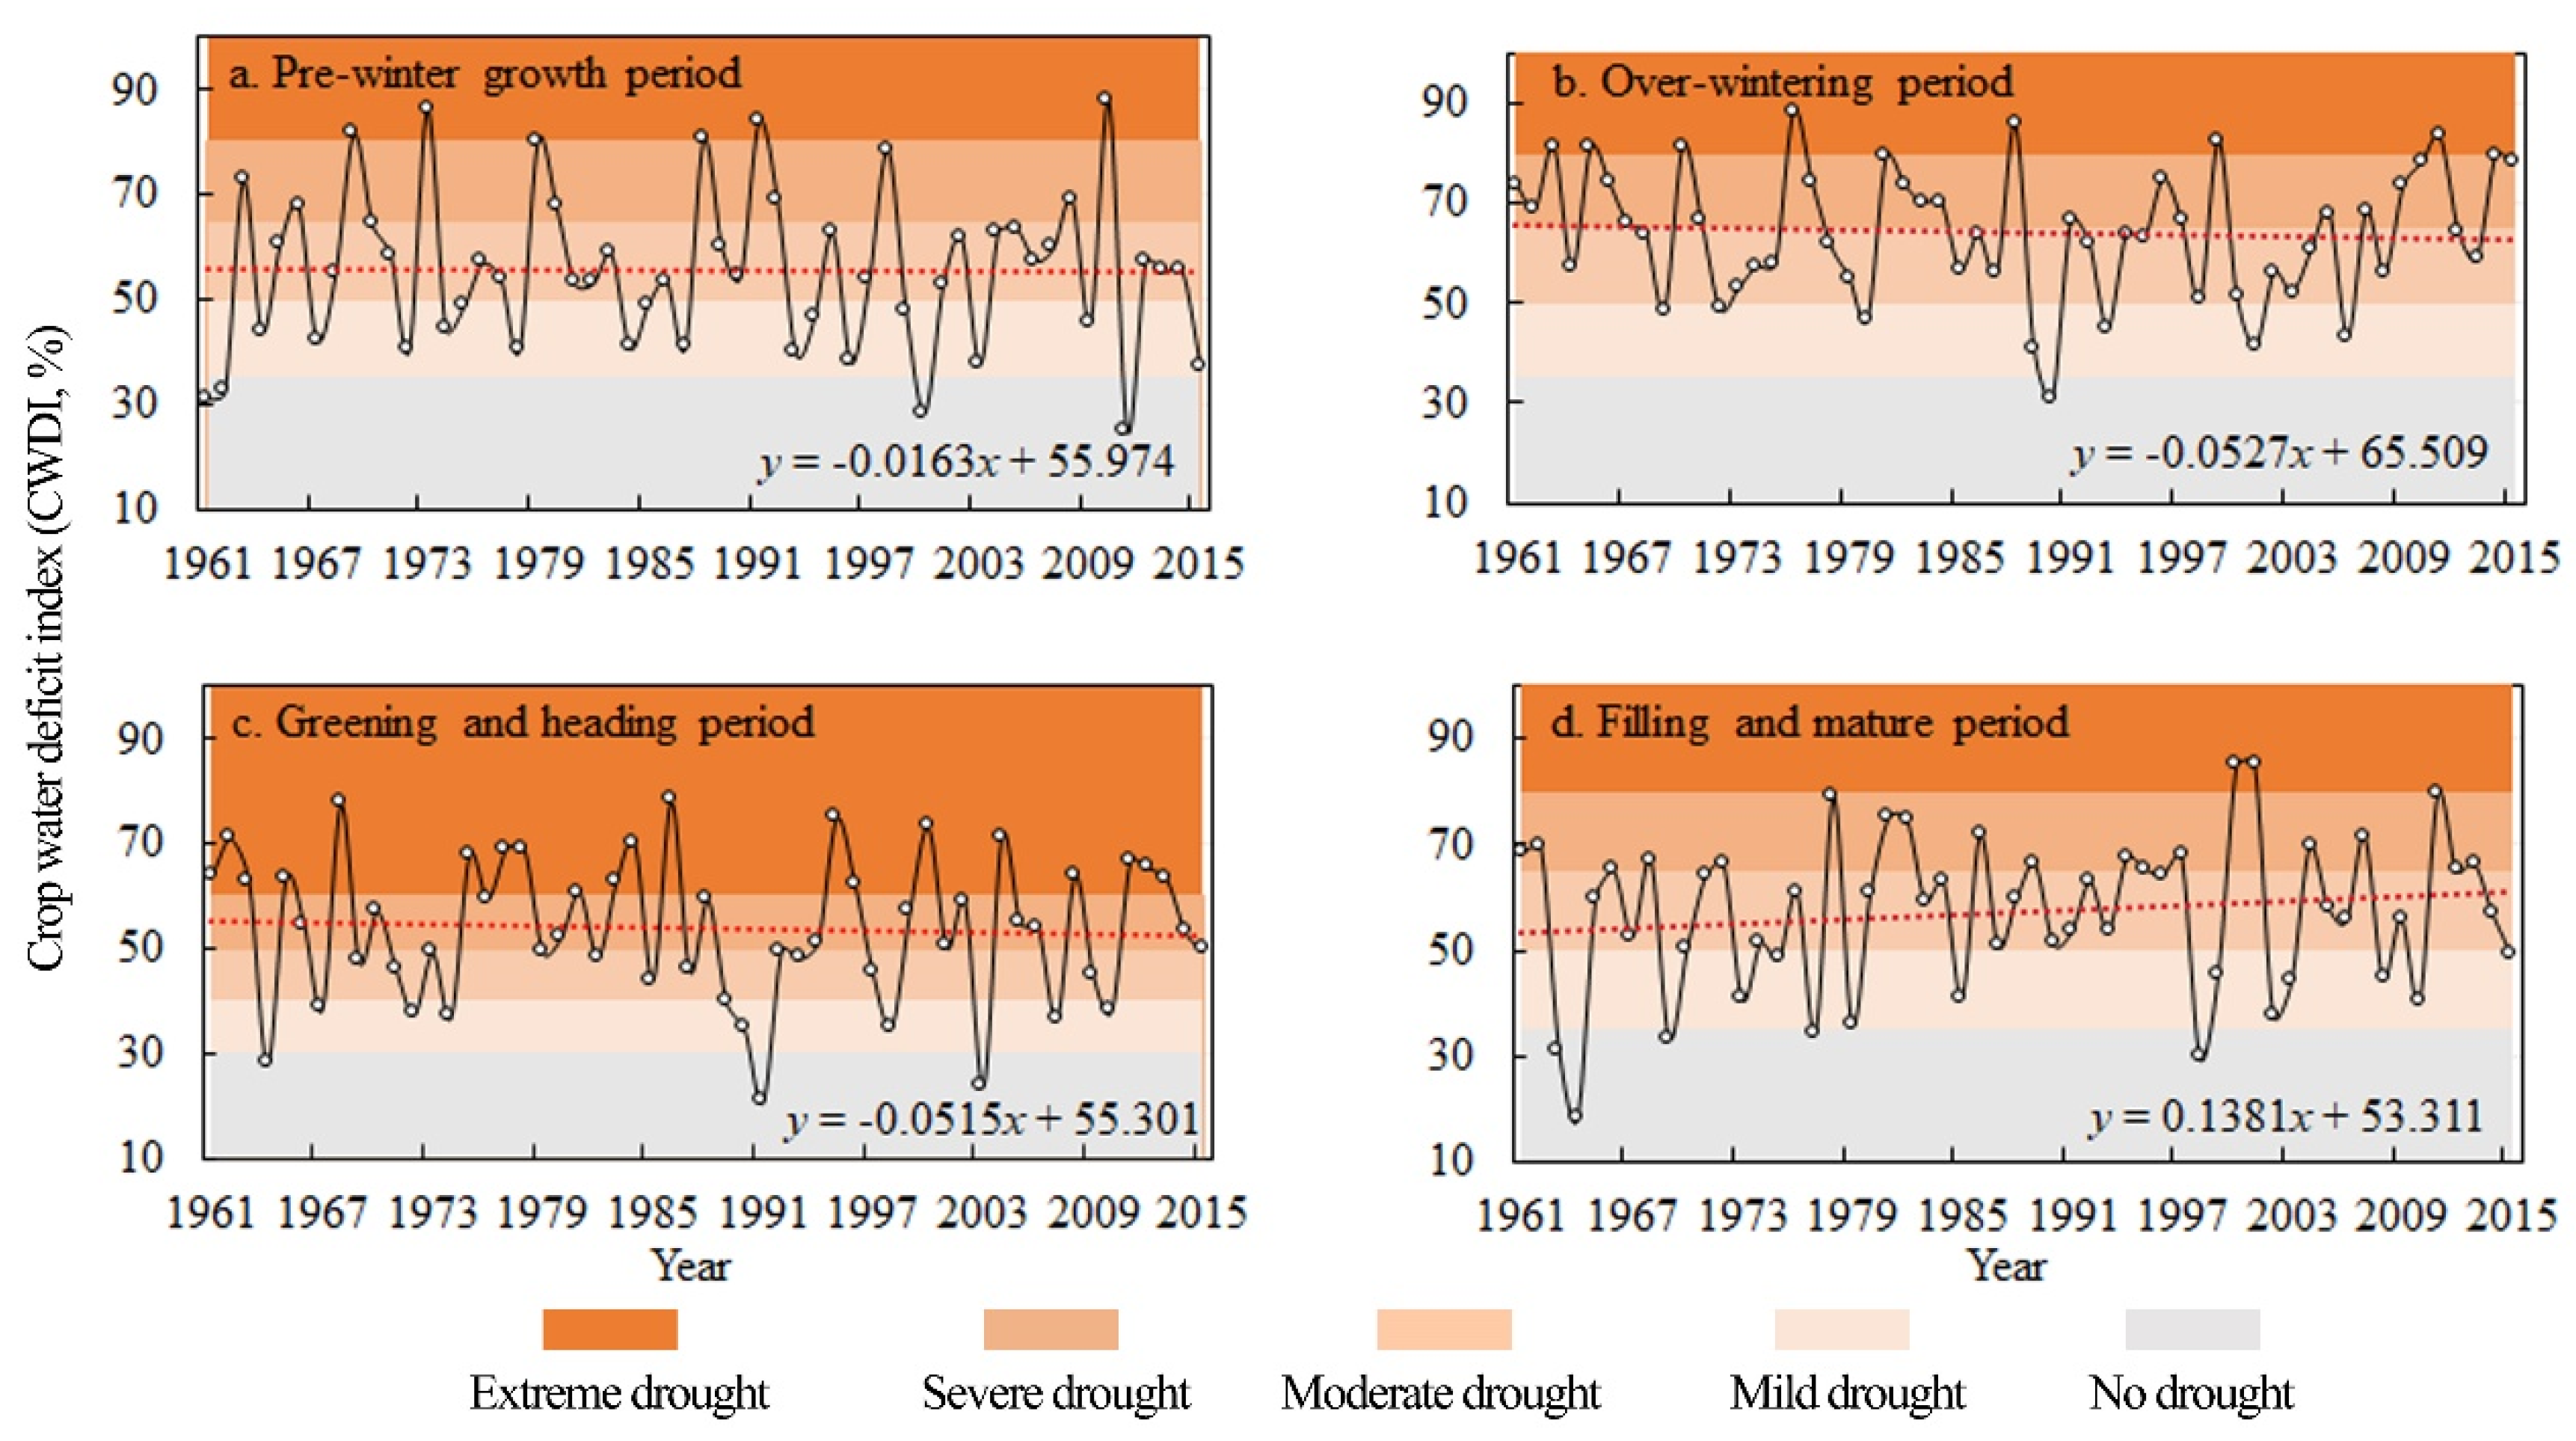
Figure 3 shows the interannual variation of the mean crop water deficit index (
CWDI) of winter wheat at each growth period in the areas above the Bengbu Sluice in the Huaihe River Basin from 1961 to 2015. The results suggest that during the pre-winter growth period,
CWDI was in the range between 25% and 88%, and excessive drought occurred in 1973, 1991, and 2010; during the over-wintering period,
CWDI was in the range between 31% and 88%, and excessive drought occurred in 1976, 1988, and 2011; during the greening and heading period,
CWDI was in the range between 21% and 78%, and excessive drought occurred in 1968, 1986, and 1995; and during the filling and mature period,
CWDI was in the range between 18% and 85%, and excessive drought occurred in 2000, 2001 and 2011. Except for during the filling and mature period,
CWDI showed a slightly decreasing trend in other growth periods, that is, the drought of winter wheat tended to be lighter.
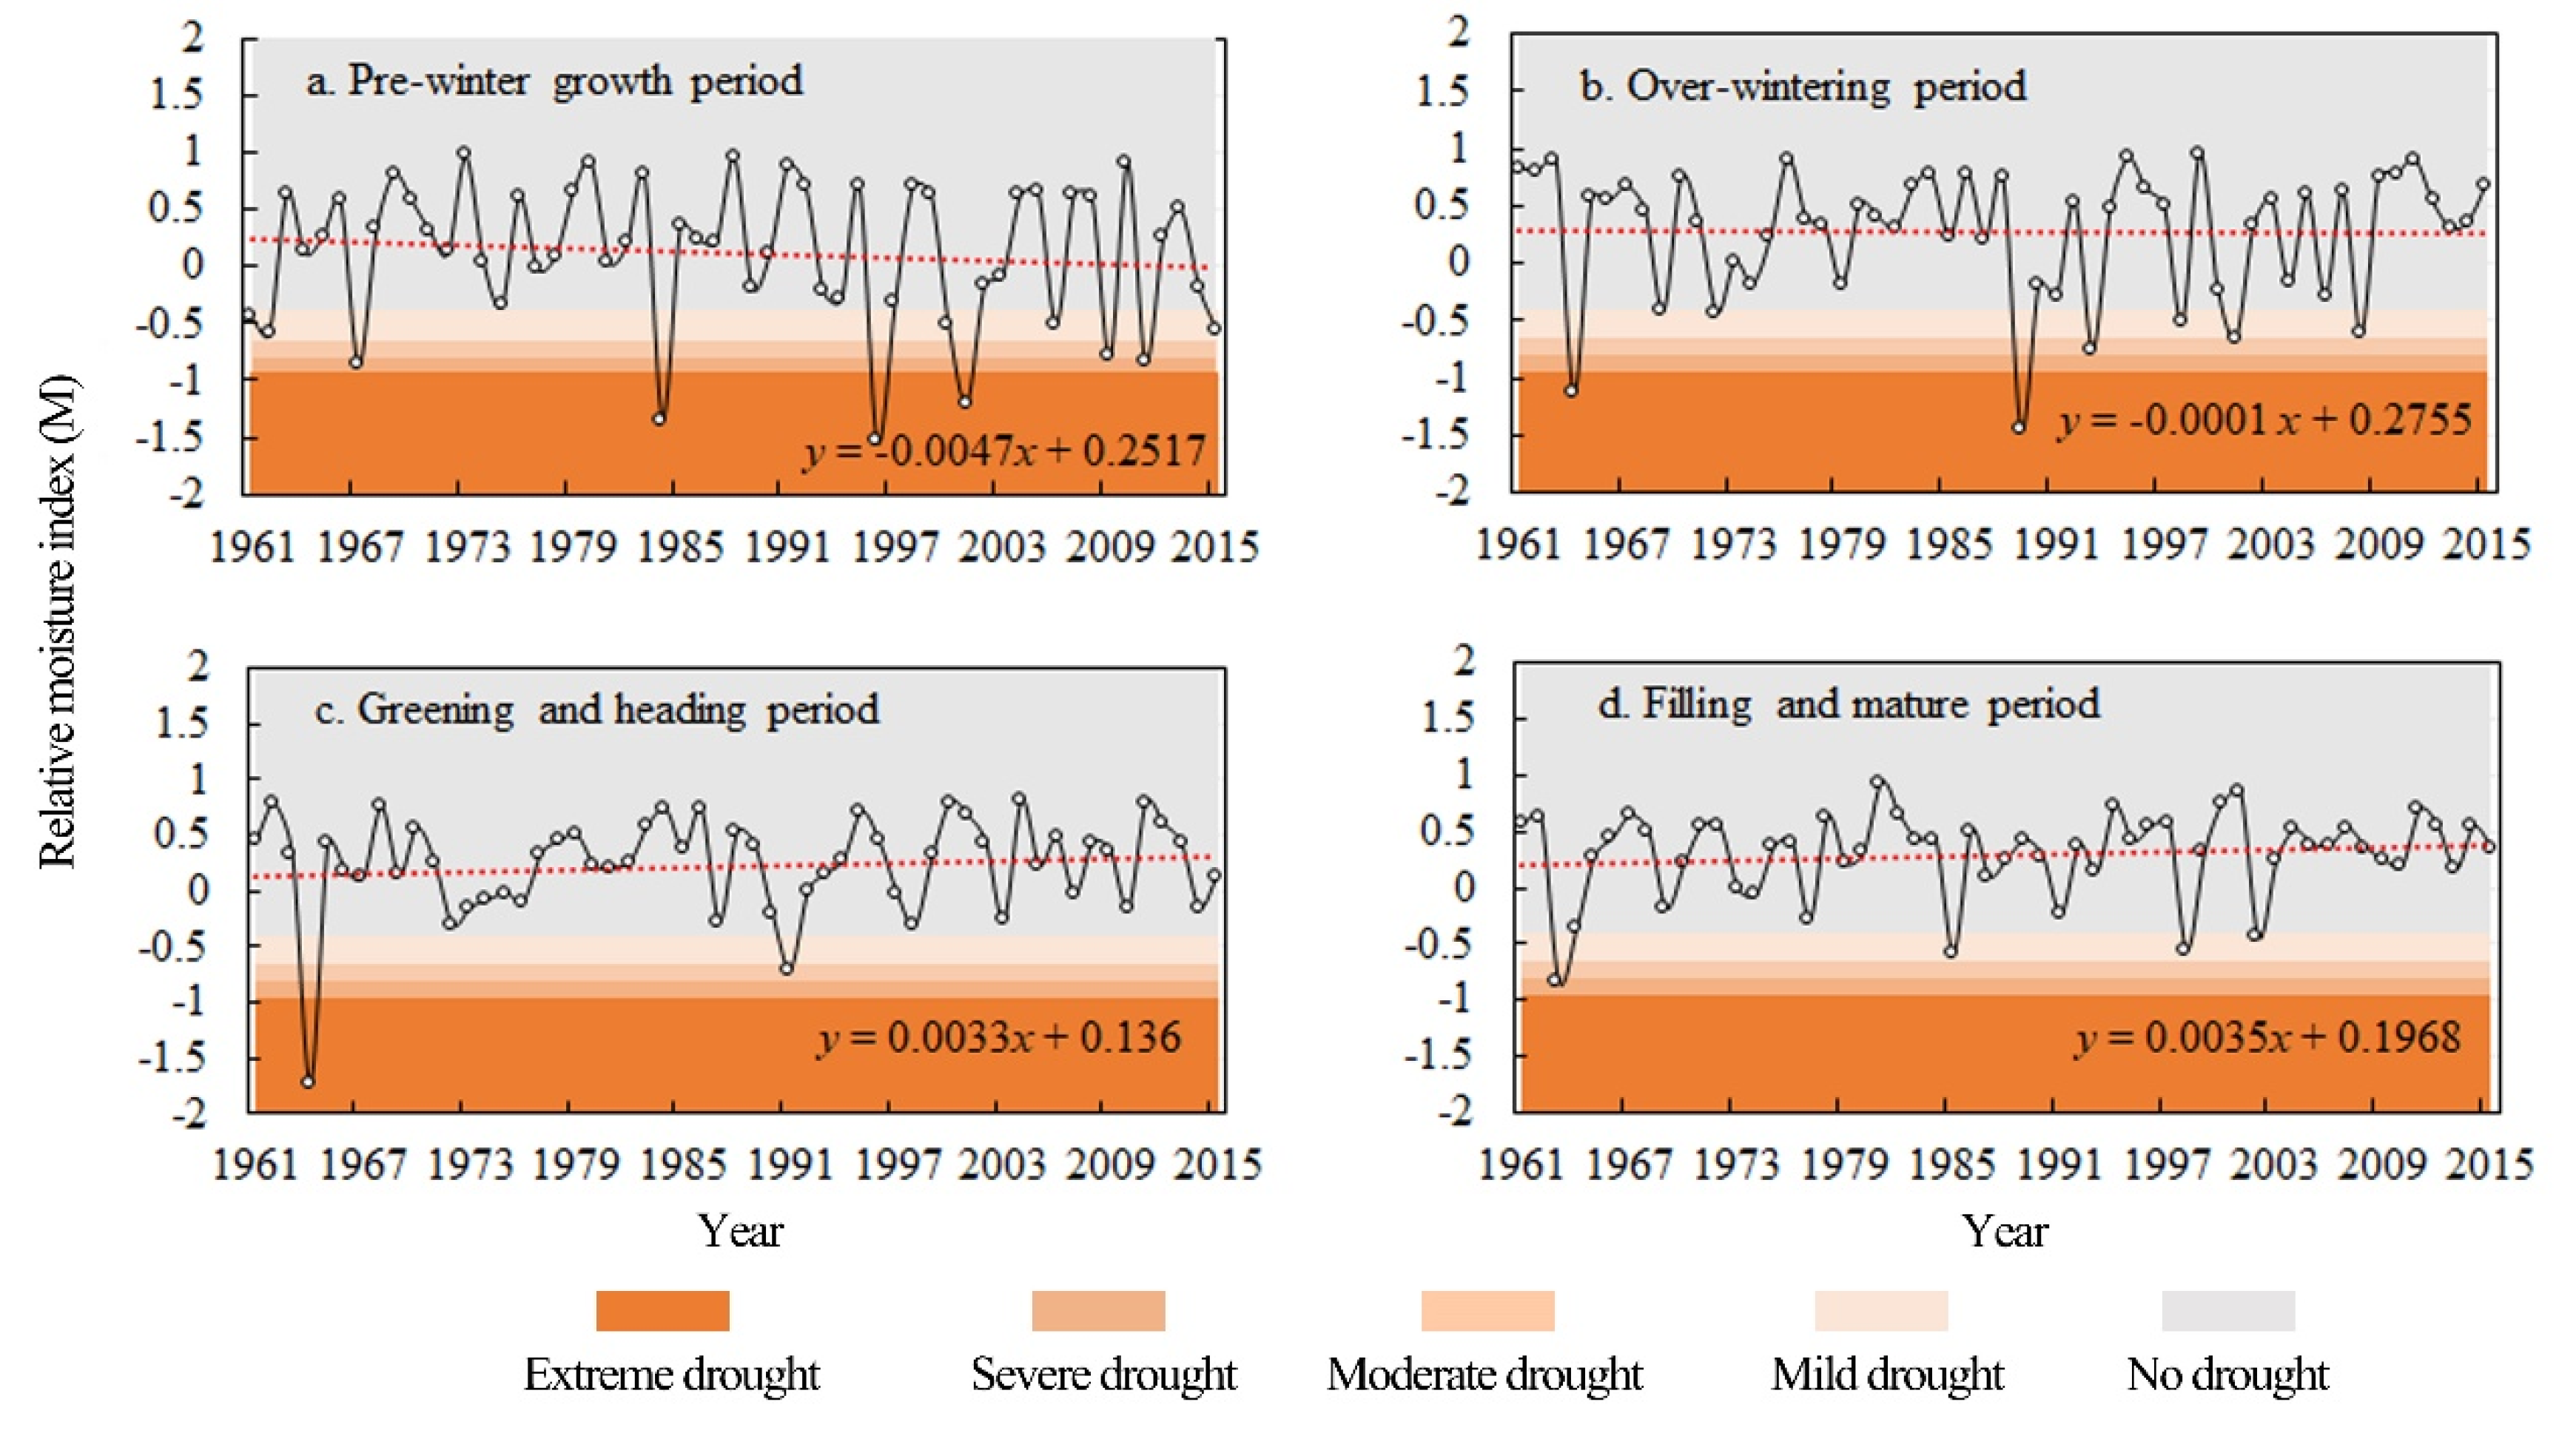
As shown in the interannual variation of the mean relative moisture index (
M) of winter wheat at each growth period in the areas above the Bengbu Sluice in the Huaihe River Basin from 1961 to 2015 (
Figure 4), there was no significant change trend in the interannual variation of
M during the 4 growth periods of winter wheat. During the pre-winter growth period,
M was in the range between −1.55 and 0.96, and excessive meteorological drought occurred in 1984, 1996, and 2001; during the over-wintering period,
M was in the range between −1.46 and 0.95, and excessive drought occurred in 1964 and 1989; during the greening and heading period,
M was in the range between −1.73 and 0.81, and excessive meteorological drought occurred in 1964; and during the filling and mature period,
M was in the range between −0.83 and 0.93, and was the least drought stage in the winter wheat growth period, so the trend of humidification was relatively significant.
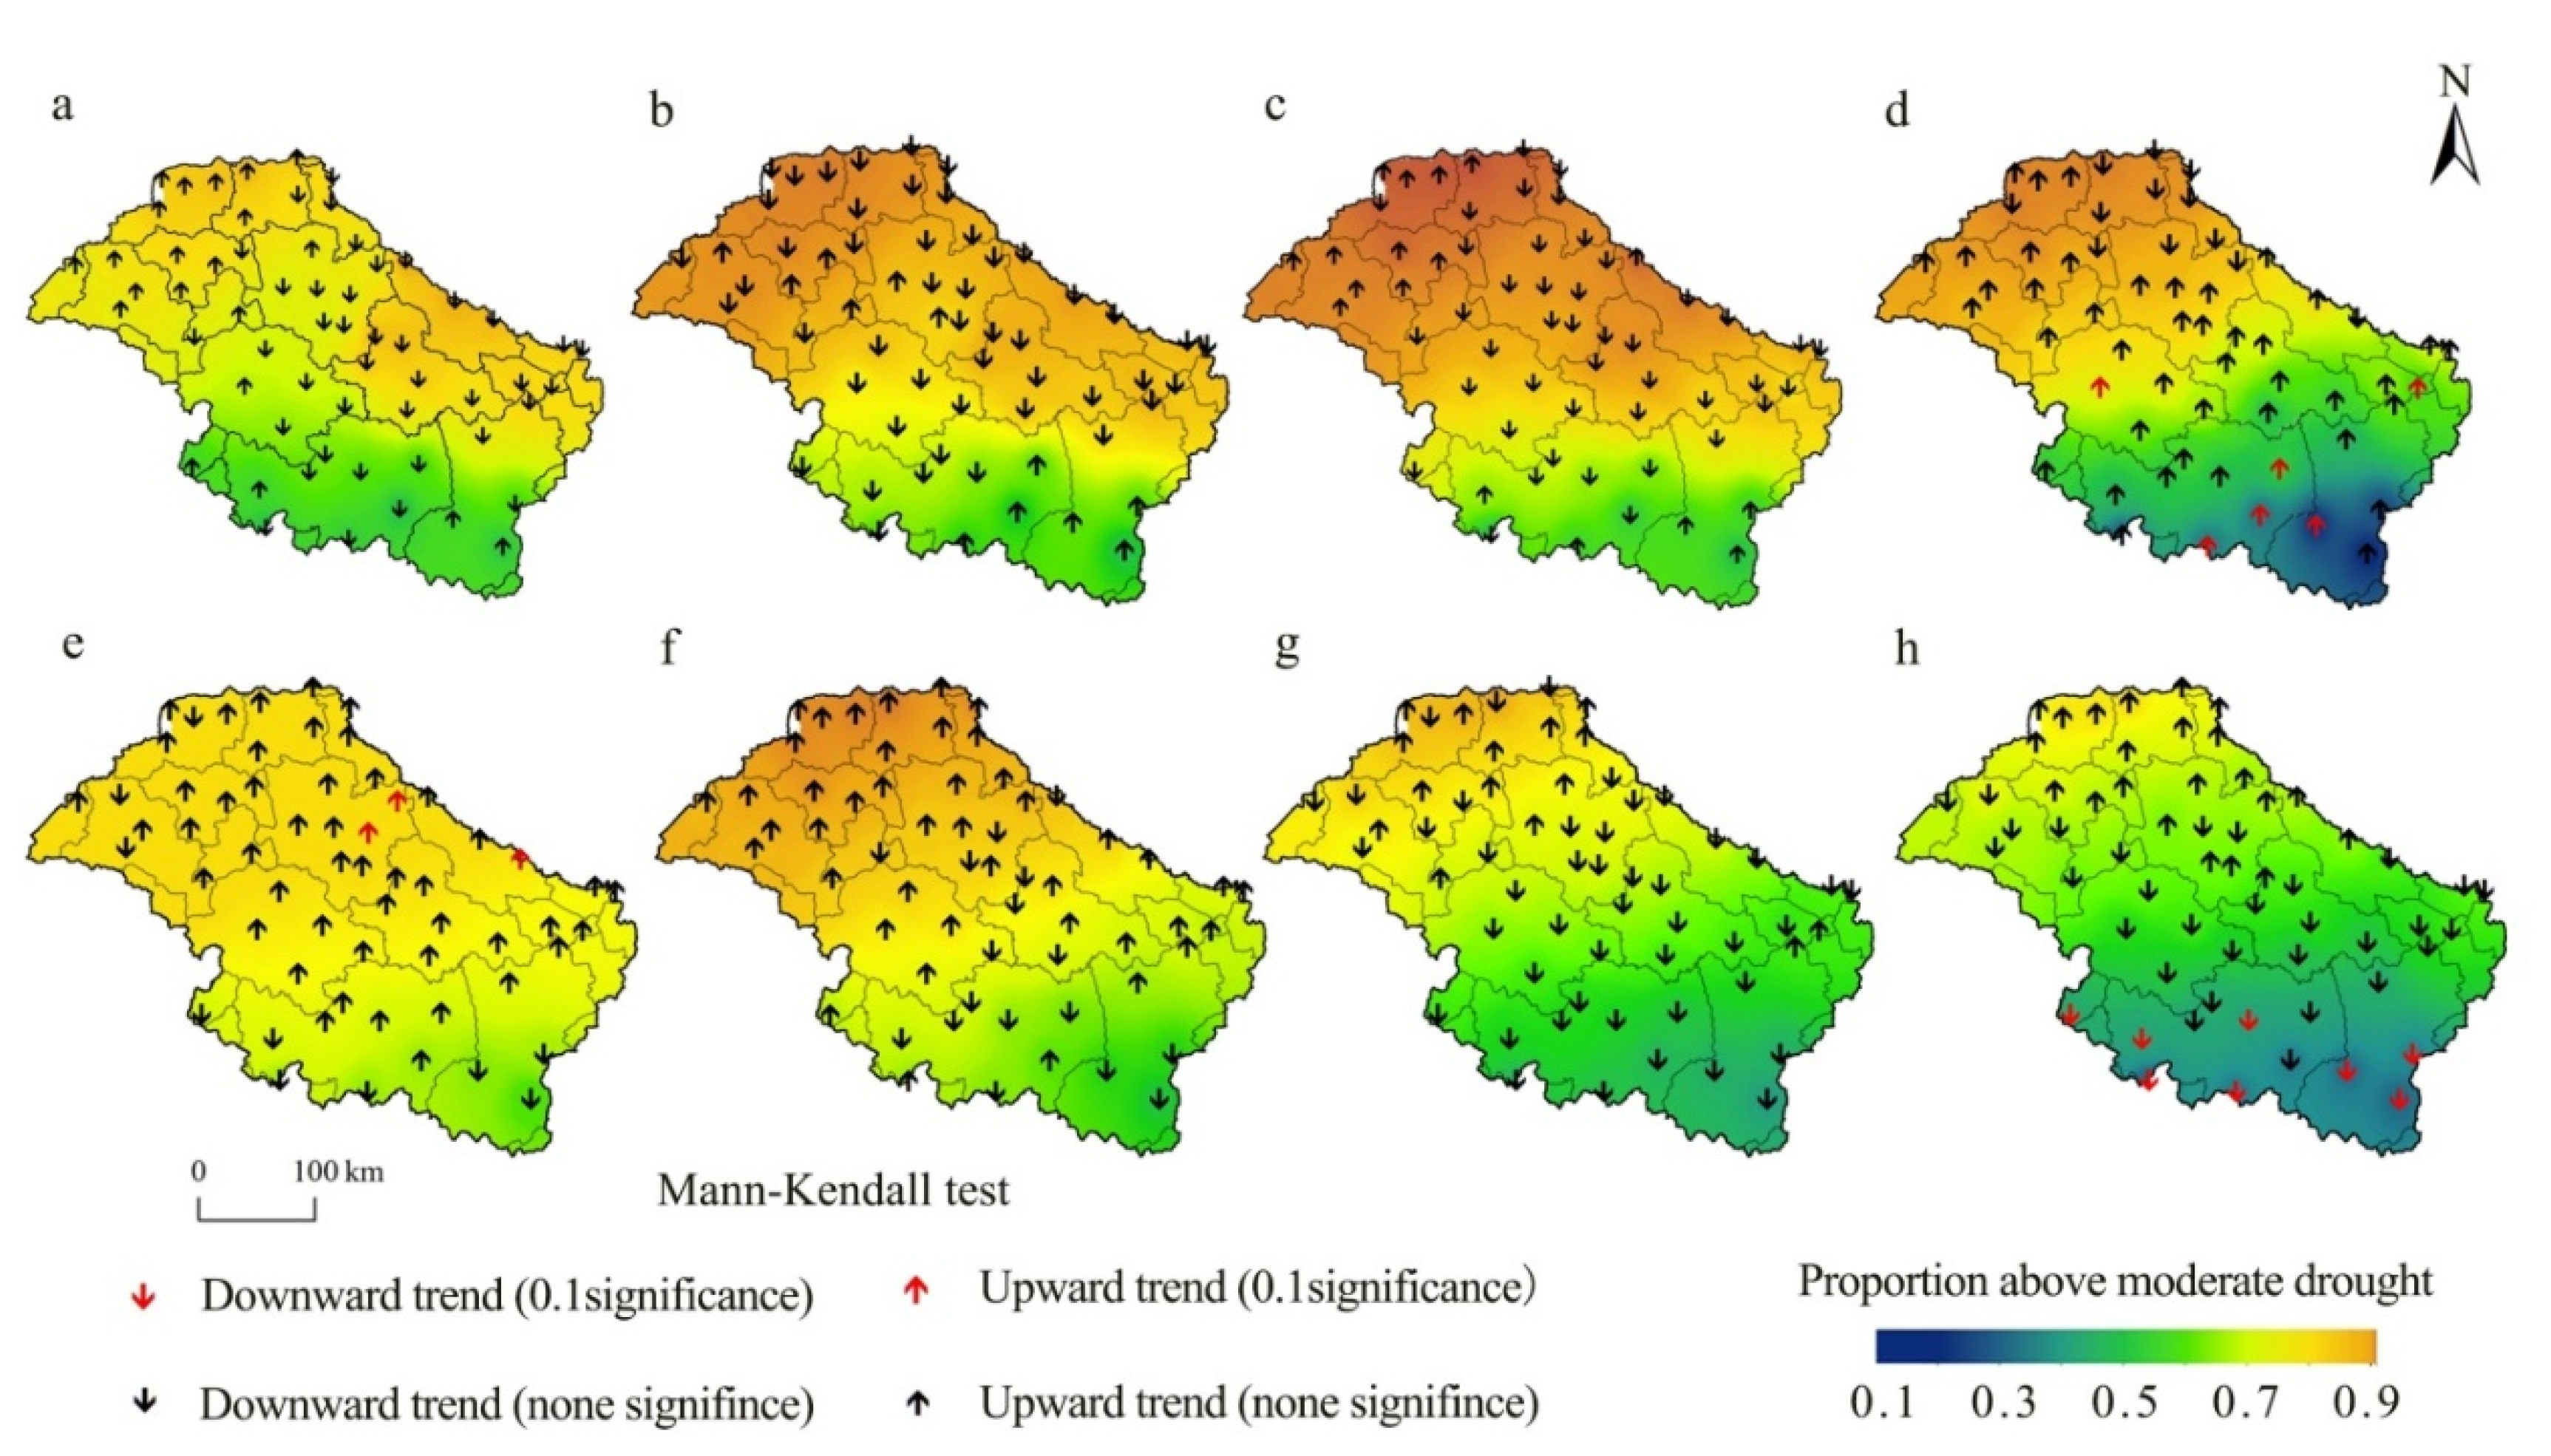
4.1.2. Spatial Distribution of Winter Wheat Drought and Meteorological Drought
Previous studies [
49] have shown that drought disaster will have an impact on agriculture only when it reaches the level above moderate drought. Inverse distance weighted (IDW) interpolation was carried out for the proportion of
CWDI and
M that was above the level of moderate drought, and the Mann–Kendall test calculated the trends of each station for the
CWDI and
M from 1961 to 2015 in the study area (
Figure 5).
The results showed that the proportion of
CWDI and
M that was above the level of moderate drought was high in the north and gradually decreased southward for all different growth periods, which indicated that winter wheat drought and meteorology drought were more severe in the north than in the south of the basin. The degrees of drought differed among the four growth periods. For
CWDI, while the drought level in the north became more severe from the pre-winter growth period to the filling and mature period, the drought level in the south gradually alleviated with the development of growth periods (
Figure 5a–d). Similar to the
CWDI, the drought level for
M in the south was better than in the north of the basin, and from the pre-winter to filling and mature period, the drought level in the south gradually alleviated, with the same trend of the
CWDI. In general, the proportion of
CWDI above the moderate drought level was greater than
M, indicating that the winter wheat drought was more severe than that of meteorological drought in the study area.
We calculated the trends of
CWDI and
M for each station over the basin for 1961–2015 and the results are shown in
Figure 5. For
CWDI, about 60% of the sites showed decreasing trends during the pre-winter growth (
Figure 5a), the percentages were higher during the greening and heading period at about 72% (
Figure 5c), and highest during the over-wintering period at around 80% (
Figure 5b). During the filling and mature period, around 80% of the sites showed increasing trends (
Figure 5d). Among these stations with increasing trends, just around 10% of them showed statistically significant trends. In general, most stations showed decreasing trends during all growth periods, except for the filling and mature period, while most stations showed increasing trends. For
M, during the pre-winter growth period, most stations (about 83%) showed increasing trends, but only 5% of them were statistically significant at the 0.01 level, indicating that the humidification trend was not significant (
Figure 5e). About 72% sites showed an increasing trend; most of the sites in the north of the basin had more severe drought with an increasing trend, while those in the south with less severe drought had a decreasing trend (
Figure 5f). About 75% and 62% of the sites showed downward trends during the greening and heading period and the filling and mature period, respectively (
Figure 5g,h). During all growth periods, most of the stations with increasing trends were located in high-level drought areas (north of the basin), and most of the stations with decreasing trends were found at low-level drought areas (south of the basin). It is likely that the results could indicate that “the wet gets wetter, and the drought gets droughtier” in the study area.
4.2. Response of Winter Wheat Drought to Meteorological Drought
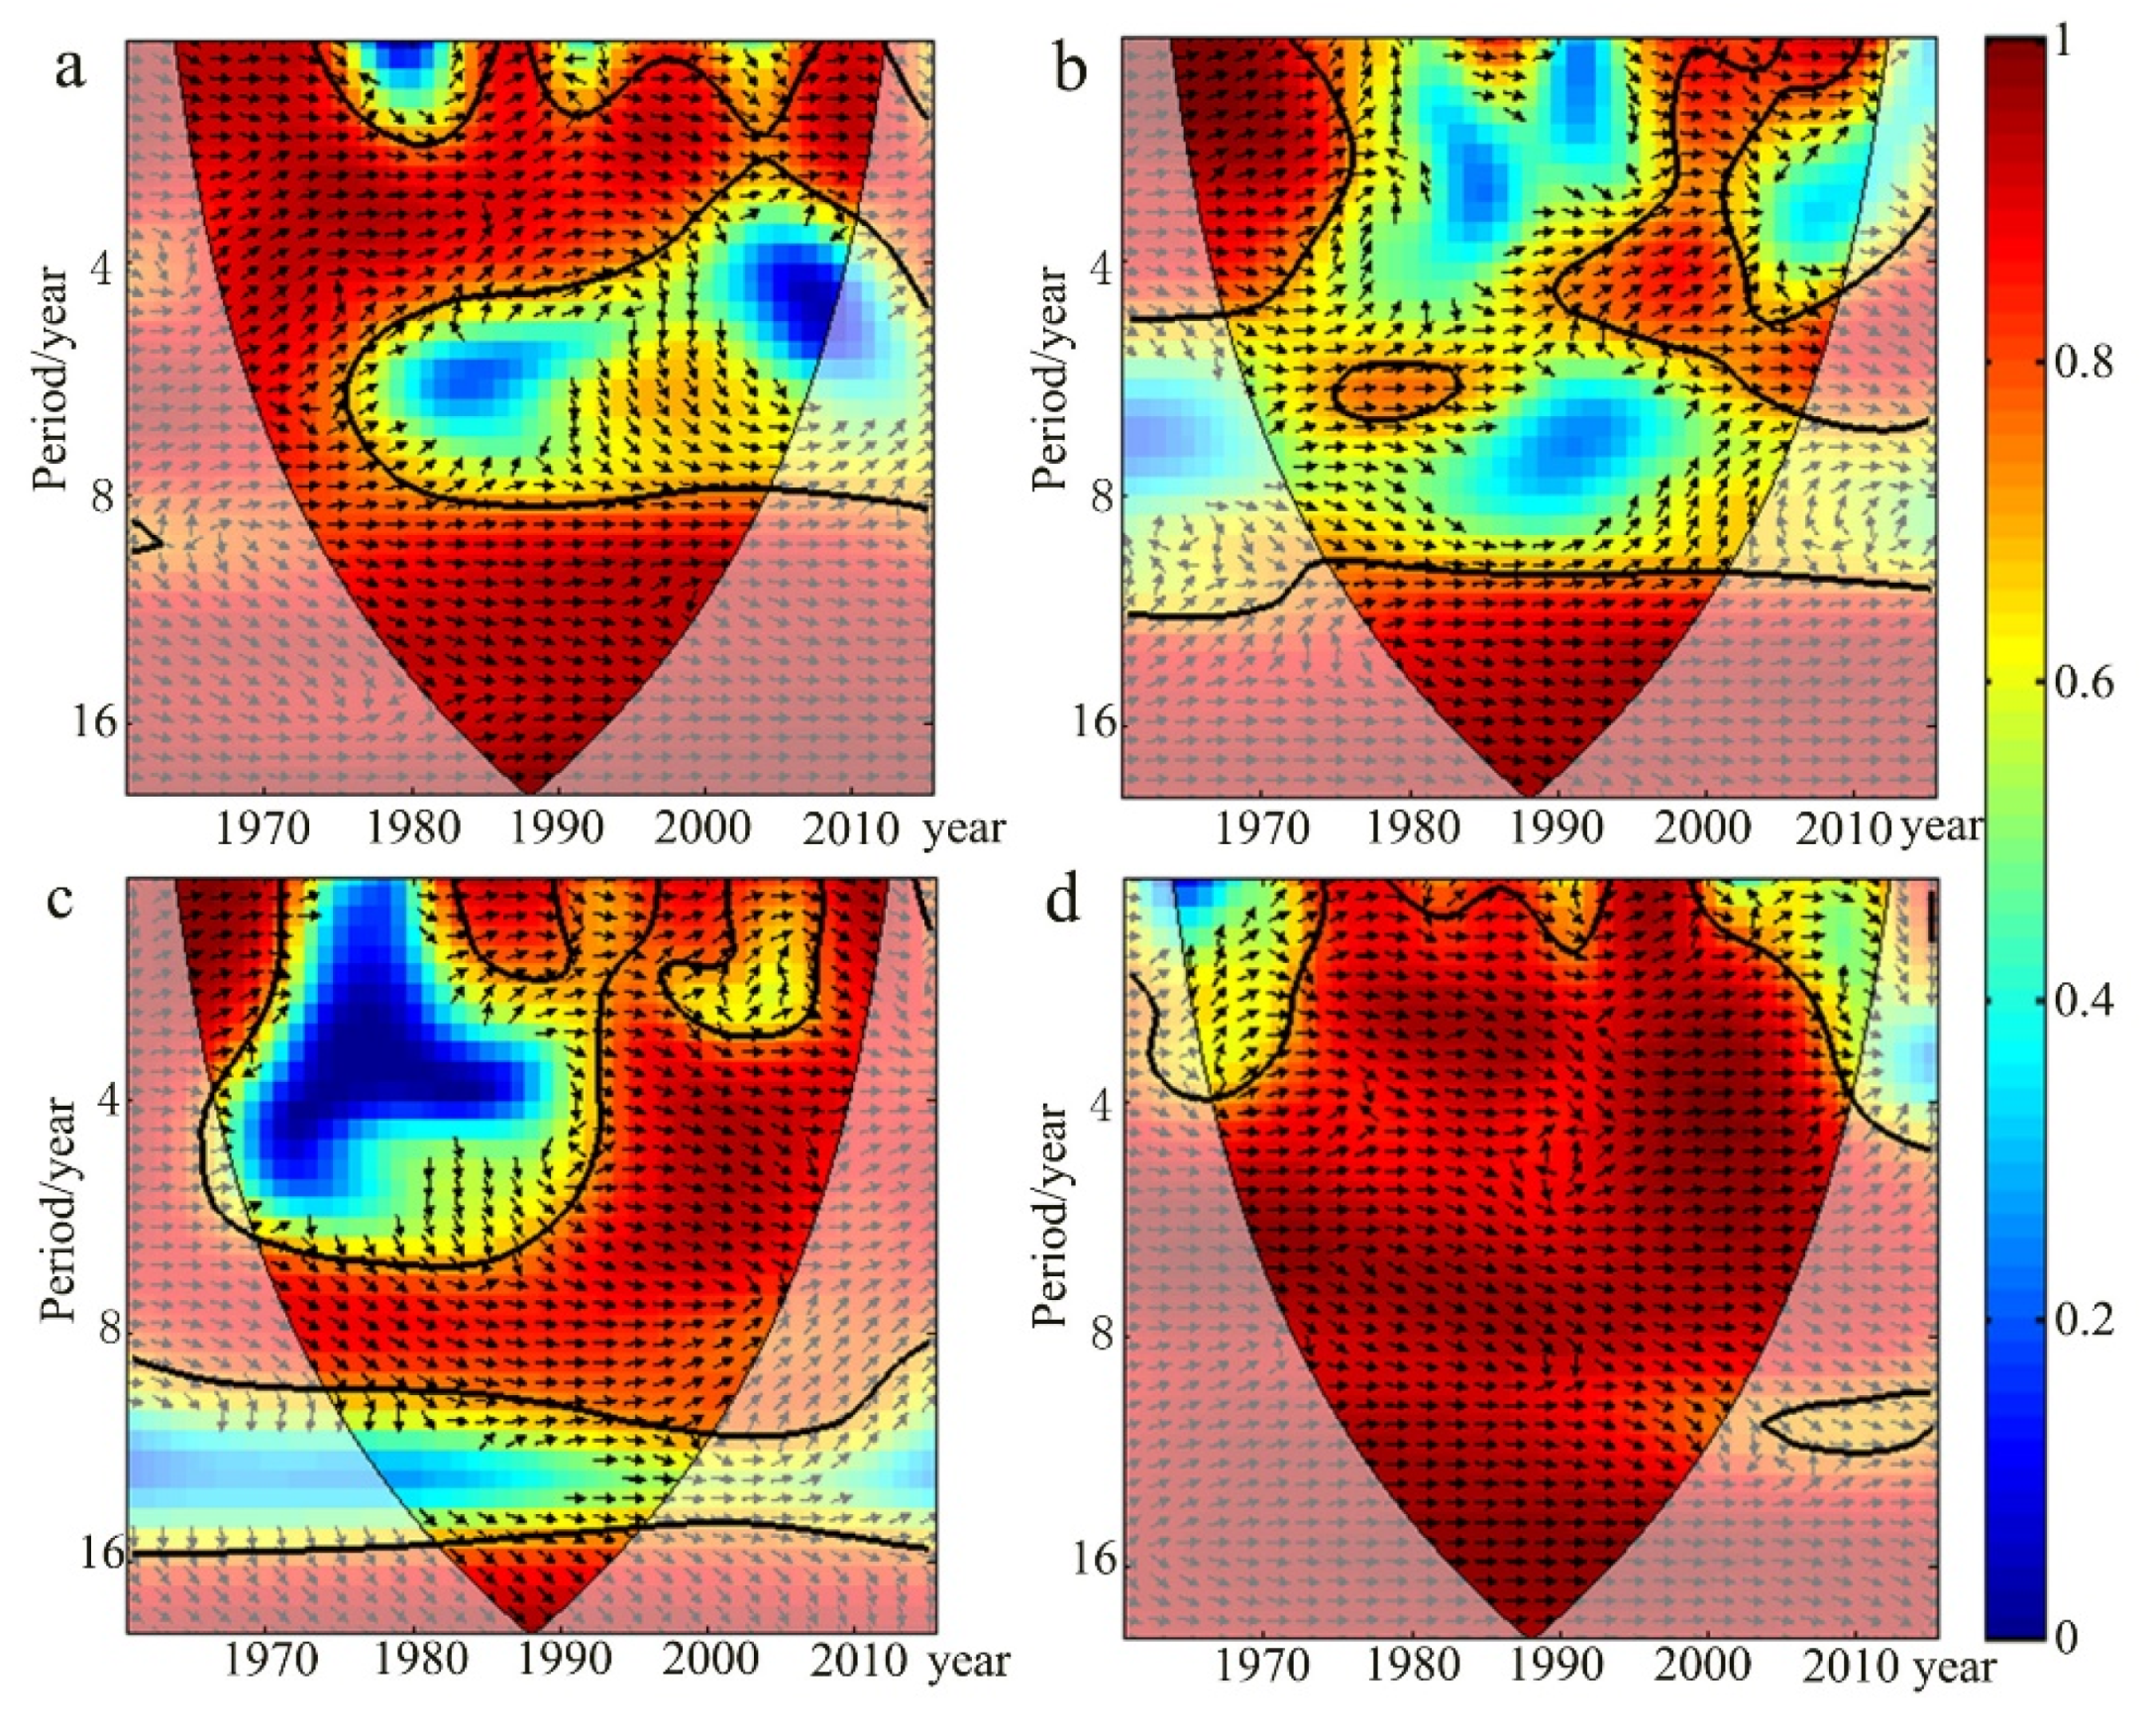
4.2.1. Analysis of Correlation between Winter Wheat Drought and Meteorological Drought
The cross-wavelet coherence spectrum was used in this study to examine the correlation between the
CWDI and
M of winter wheat in each time-frequency domain (
Figure 6). In general, the correlation between
CWDI and
M of winter wheat in the over-wintering period was poor, and the correlation in the filling and mature period was good. In the pre-winter growth period,
CWDI and
M showed a good correlation on the time scale of about 2 years, but the bandwidth around 2000 was narrow, and the correlation was poor on the time scale of 4–8 years, the correlation between
CWDI and
M was significant under the scale above 8a. During the over-wintering period, the correlation between
CWDI and
M under the time scale of 12 years was not obvious. During the greening and heading period,
CWDI and
M showed a high correlation on the time scale of 8-8 years, their band widths were wide, and both passed the significance test of 0.05. The correlation between
CWDI and
M was good at the time scale of 3–6 years. During the filling and mature period, the correlation between
CWDI and M was good at all scales, especially during 1975–2000, where the coherence spectrum of
CWDI and
M cross wavelets almost all passed the significance test of 0.05.
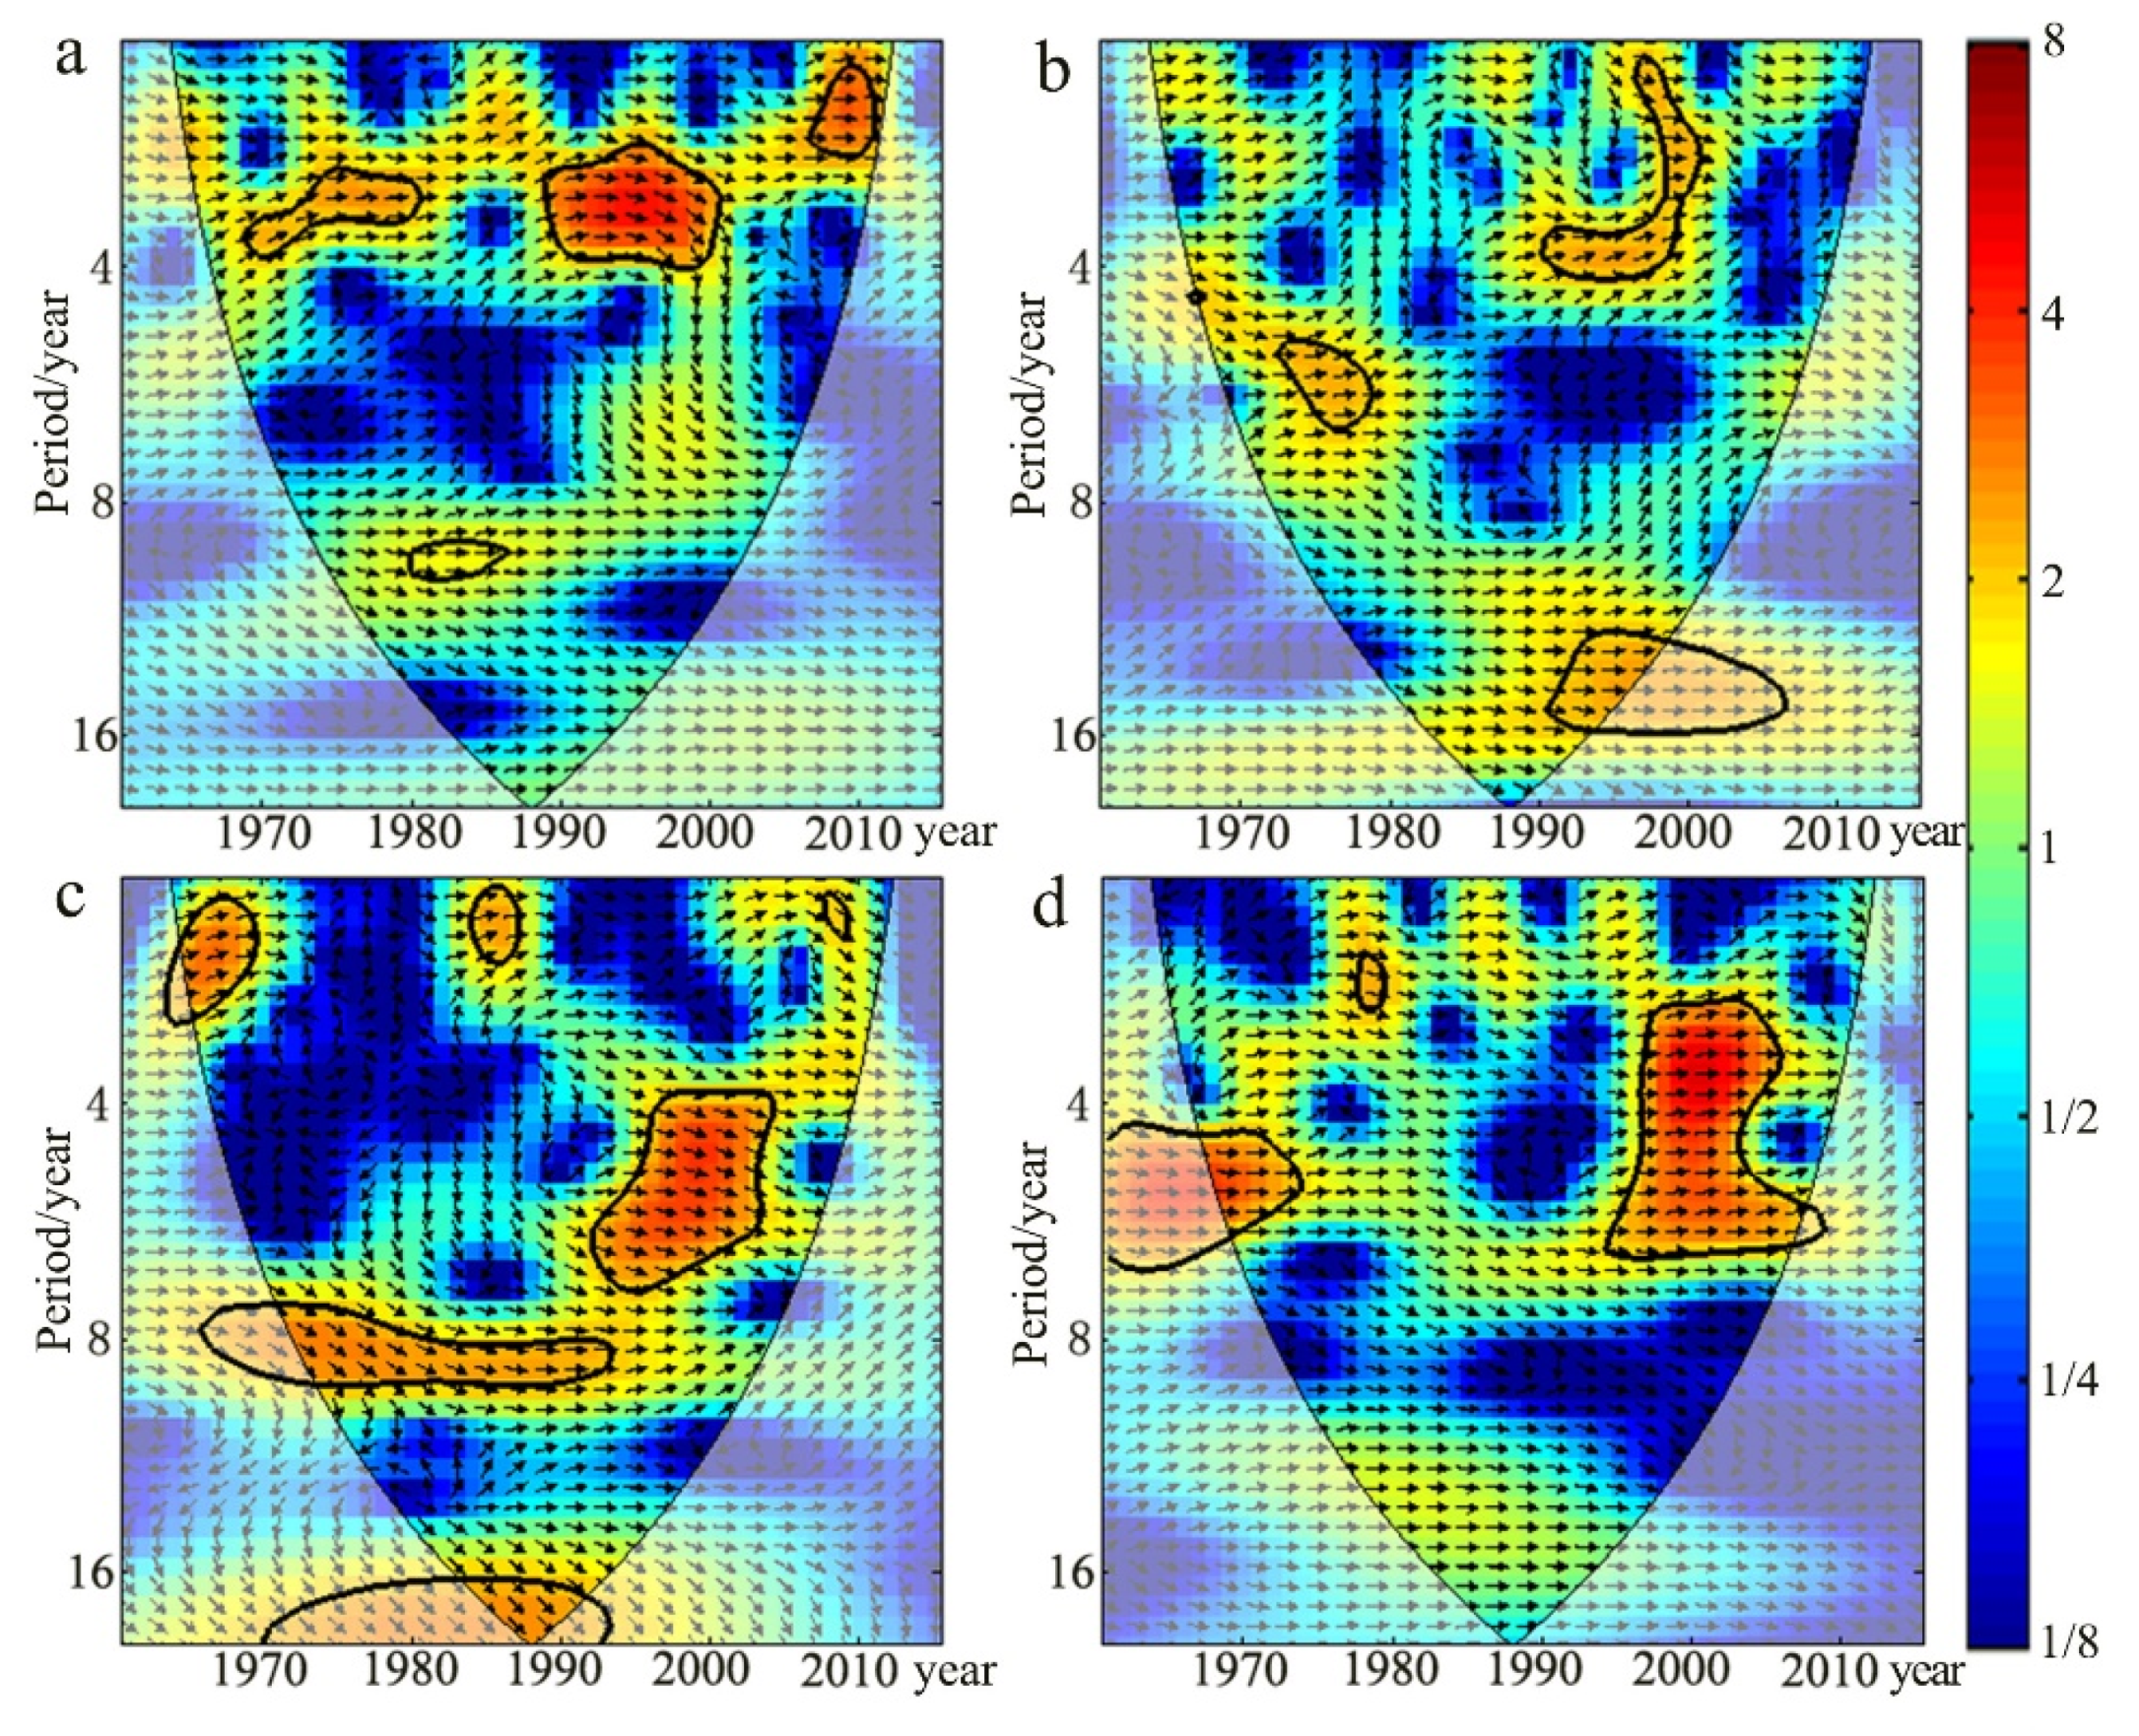
4.2.2. Time Lag for Meteorological Drought to Winter Wheat Drought
There are several reasons for the lag time to differ in each growth stage: (1) The growth characteristics of winter wheat drought, where the drought-tolerance of winter wheat at different stages of growth is different; and (2) The influence of climate factors. Differences in the lag time for meteorological drought are related to the condition of precipitation and temperature in the different growth periods. The time lag between two sets of data can be analyzed by the cross wavelet power spectrum, and the time lag between them can be calculated according to the angle indicated by the arrow. The region illustrated by the bolded black line passed the red noise test at the α = 0.05 significance level: (1) → indicates that the winter wheat drought and the meteorological drought were in the same phase, and showed a positive correlation; (2) ← indicates that the winter wheat drought and meteorological drought were the inverse phases, and showed a negative correlation; (3) ↓ indicates that the winter wheat drought was 90° ahead of the meteorological drought, and that the corresponding time scale was one quarter; and (4) ↑ indicates that the winter wheat drought lagged 90° behind the meteorological drought. In order to avoid the boundary effect and the false information of the wavelet high-frequency component, the inner area of the wavelet influence cone illustrated by the thin black line represents the effective spectrum value.
In combination with the frequency domain characteristics of the cross wavelet power spectrum (
Figure 7,
Table 4), the time interval of
CWDI and
M can be obtained by calculating the phase angle corresponding to the main oscillation period in MATLAB, where the main oscillation period of
CWDI and
M was less during the pre-winter growth period (2.06–3.90 years), and much higher during the greening and heading period at 7.80 years. There was a time lag between the winter wheat drought and meteorological drought, and the time lags in each growth period were different. In general, while the shortest time lag (3.21days) was observed during the greening and heading period, the longest (84.35 days) was seen during the over-wintering period.
4.3. Geographical Factors Affecting Time Lag from Meteorological Drought to Winter Wheat Drought
The winter wheat drought is the result of the continuous development of meteorological drought, but the root cause is the decrease in atmospheric precipitation, so the time lag between winter wheat drought and meteorological drought was observed in this study. Previous studies suggest that the time lag between them is caused by comprehensive factors such as climatic conditions, the underlying surface and physiological characteristics of winter wheat [
6]. We examined some of geographical factors in more detail.
Section 4.3 mainly discussed the influence of geographical factors of the underlying surface (e.g., soil field capacity, elevation, slope, aspect, precipitation, temperature, and depth of shallow groundwater) on time lag from meteorological drought to winter wheat drought.
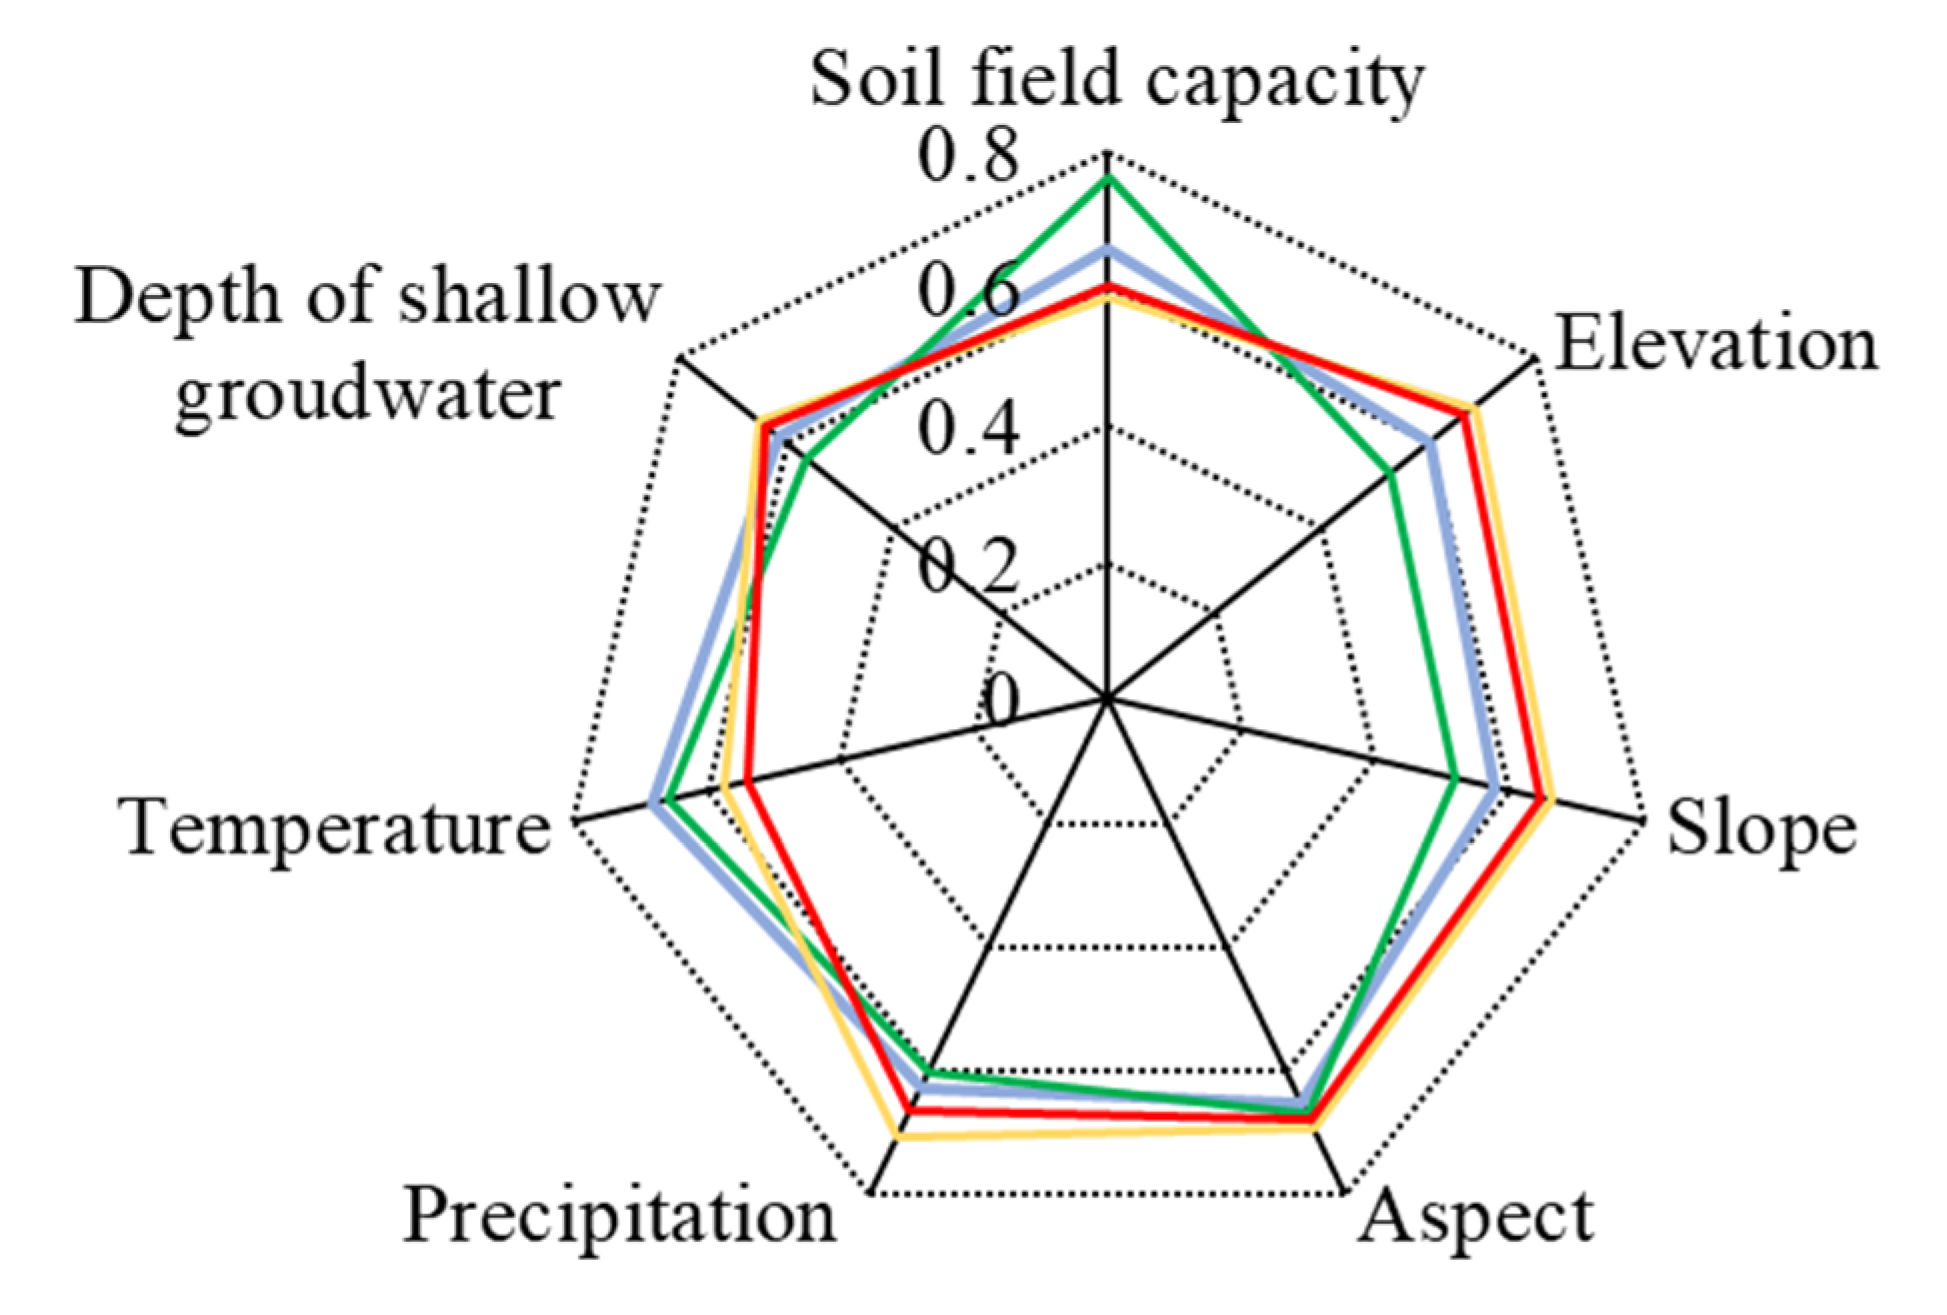
4.3.1. Grey Relation between the Time Lag of Winter Wheat Drought and Geographical Factors of Underlying Surface
The geographical factors of the underlying surface in each growth period were well correlated with the time lag of winter wheat drought, which were all above 0.5 (
Figure 8). Compared with the other growth periods, the soil field capacity during the over-wintering period showed the highest correlation with the time lag of winter wheat drought, which was up to 0.76. On the other hand, the slope factor in the over-wintering period showed the lowest correlation with the time lag of winter wheat drought, which was 0.52. Compared with other geographical factors of the underlying surface, the factor aspect showed the highest correlation with the time lag of winter wheat drought in four growth periods, which were all above 0.65, while the factor slope degree showed the lowest correlation with the time lag of winter wheat drought. With the change in growth period, the correlation between temperature and the time lag of winter wheat drought showed a downward trend. The correlations of the depth of shallow groundwater were higher in the period of greening and heading, filling, and mature.
4.3.2. Spatial Distribution of Grey Relation between the Time Lag of Winter Wheat Drought and Geographical Factors of Underlying Surface
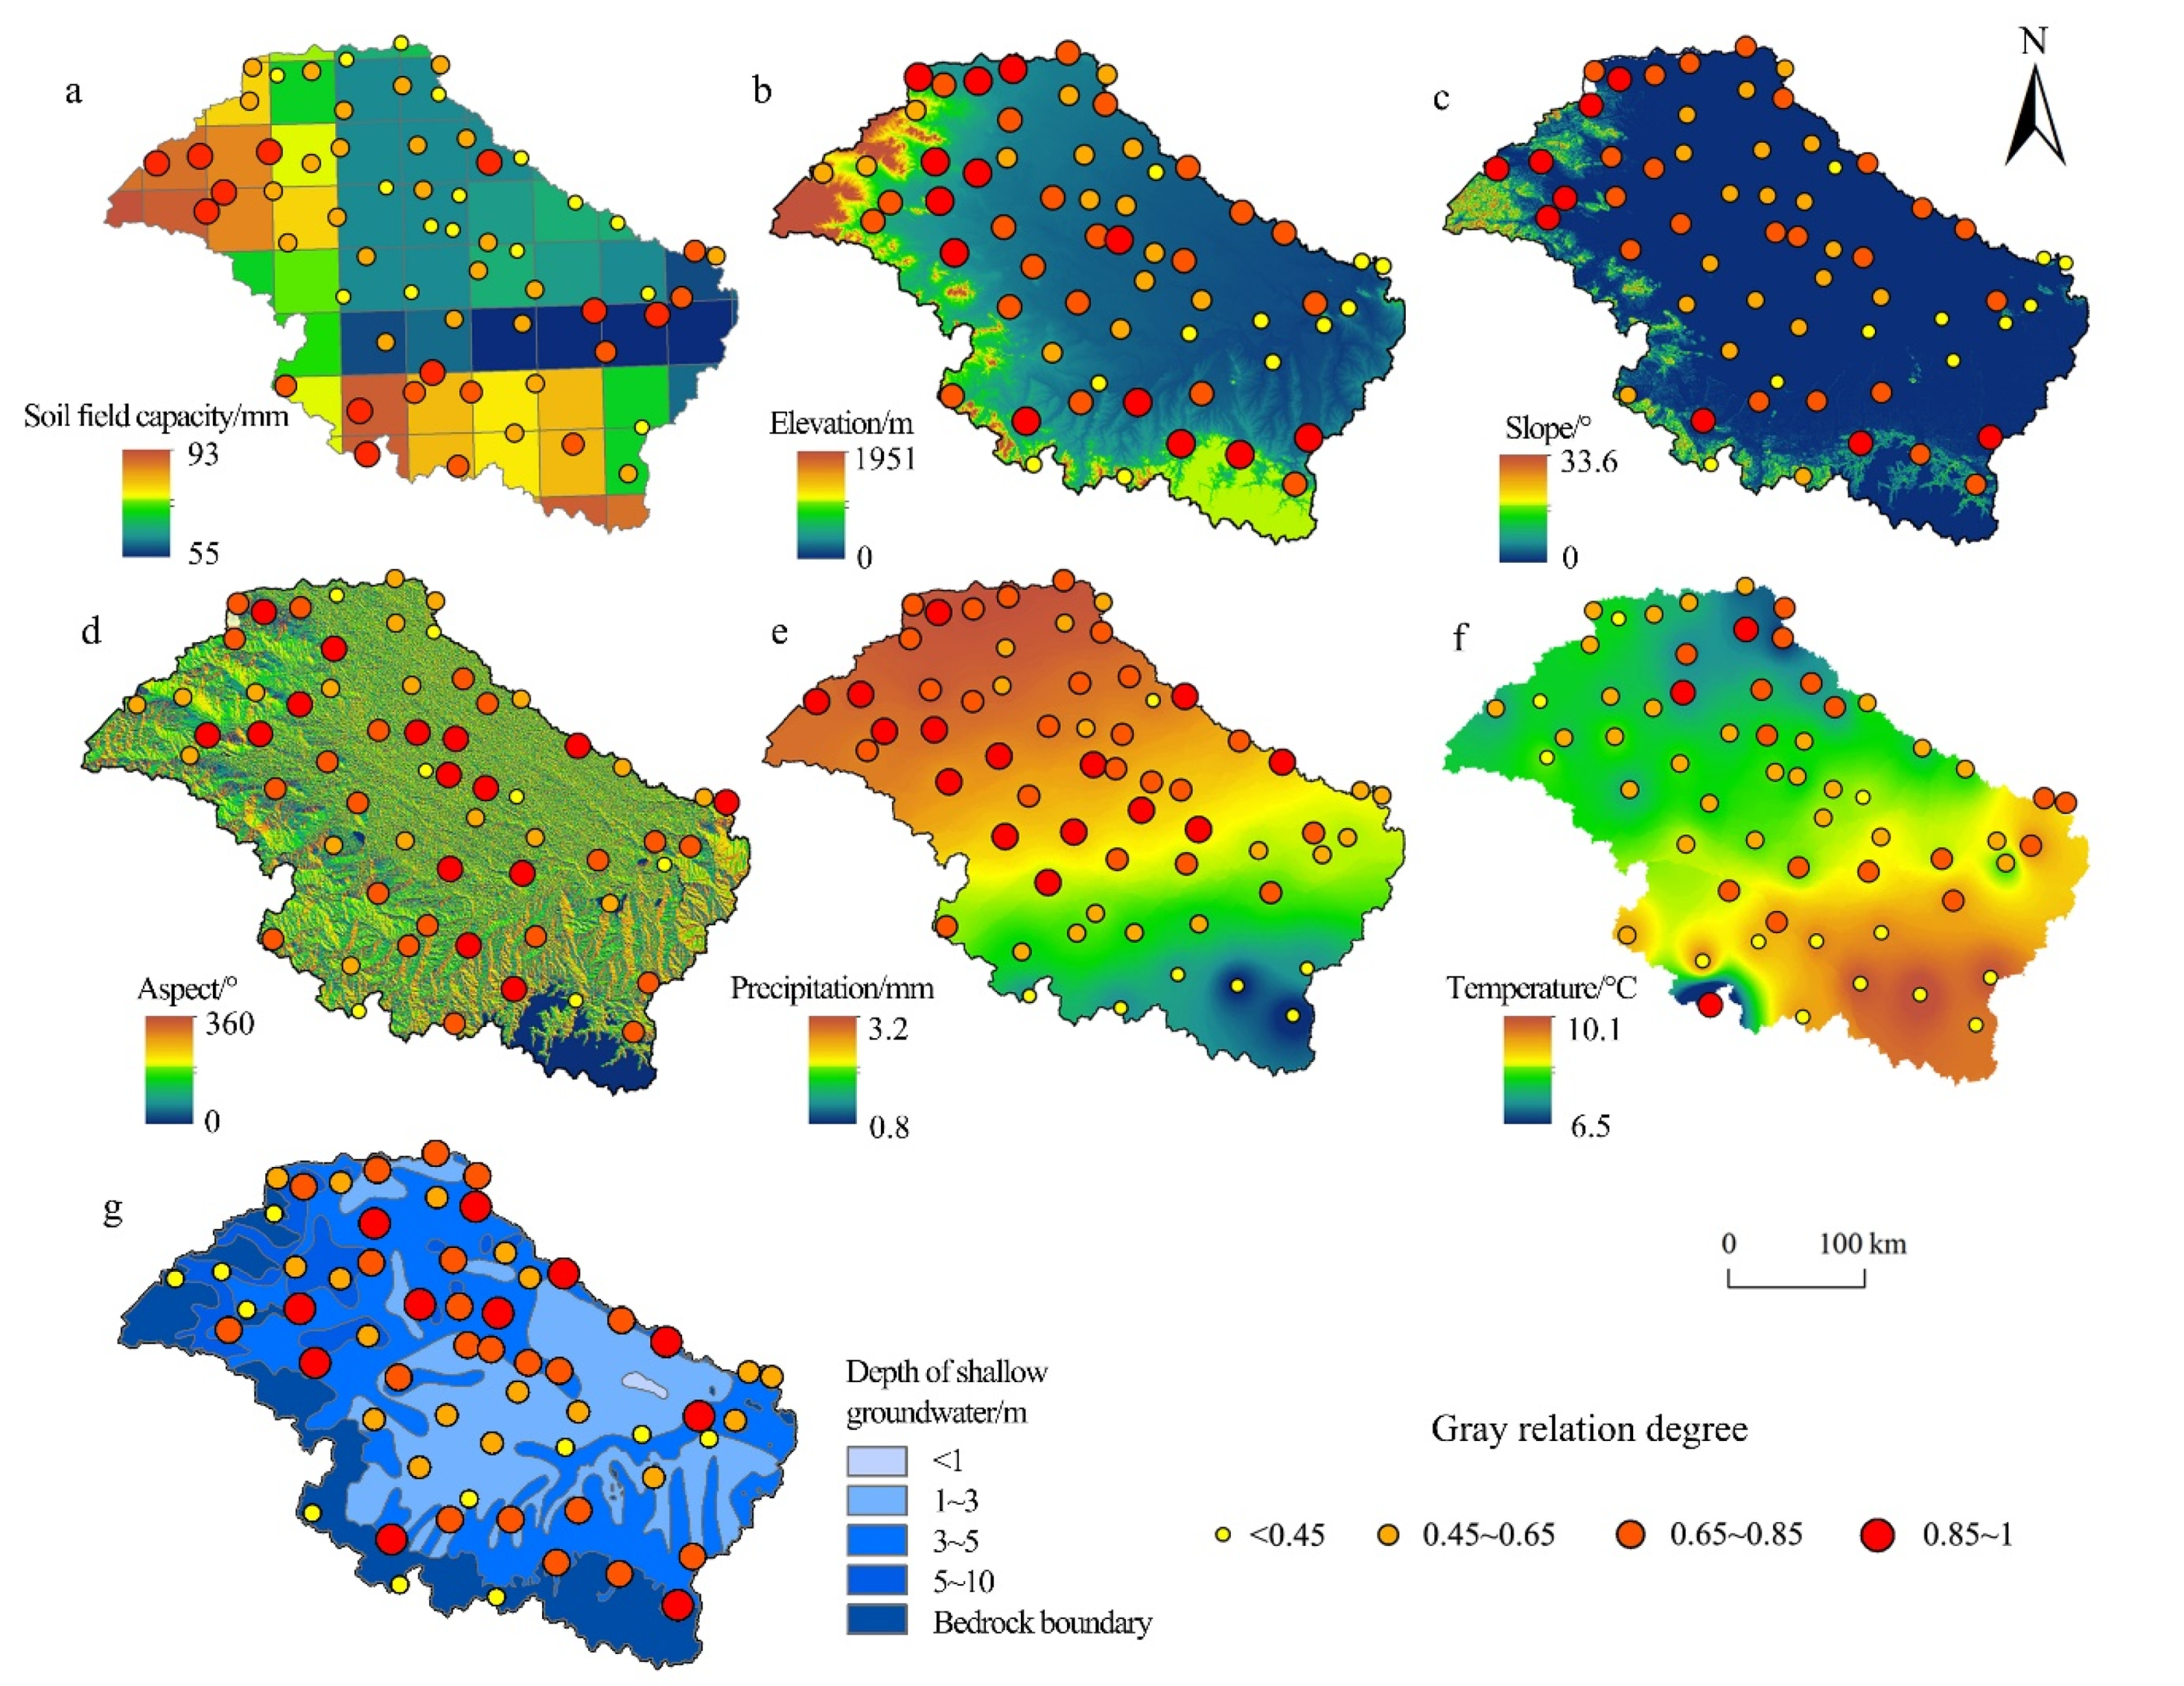
Taking the greening and heading period as an example, the spatial distribution of correlation between each geographical factor of the underlying surface and the time lag of winter wheat drought is described (
Figure 9).
Most of the sites showed a good correlation with the time lag of winter wheat drought, which was above 0.45. The sites with high correlation between the time lag of winter wheat drought and soil field capacity were mostly distributed in the mountainous areas with poor soil field capacity. The sites with high correlation between the time lag of winter wheat drought and elevation were mostly distributed in the high-altitude western and southern mountainous areas with high altitude. The sites with high correlation between the time lag of winter wheat drought and slope degree were mostly distributed in the mountains with steep slopes. The sites with high correlation between the time lag of winter wheat drought and aspect were mostly distributed in the eastern and northeast slope areas. The sites with high correlation between the time lag of winter wheat drought and precipitation were mostly distributed in the north of the central area with less precipitation. The sites with high correlation between the time lag of winter wheat drought and temperature were mostly distributed in the mainstream of the Huaihe River in the basin and the northeast area with lower temperature areas in the district and northeast. The sites with high correlation between the time lag of winter wheat drought and depth of shallow groundwater were mostly distributed in the northern and southern areas, where the deeper the depth, the longer the time lag of drought.
5. Discussion
(1) The monitoring of agricultural drought requires combinations of multiple data.
Agricultural drought and meteorological drought are characterized by instrumental data from the meteorological sites, the data source is single, and there will be an error in thee calculated time lag. Therefore, it is worth further evaluating the drought value by calculating the comprehensive index (such as the vegetation index and soil moisture index inferred from remote sensing image data) by multi-data sources.
(2) The selection of drought indicator parameters needs to be further improved.
The meteorological sites in the study were mainly distributed in Anhui and Henan Provinces. When calculating the crop water deficit index (CWDI), the Kc value was selected from the corresponding value of the province where the site was located. That is, the Kc value in Anhui Province was selected if the site was in Anhui Province, but the sites in Anhui Province in the basin are located in the northern part of Anhui Province, and the sites in Henan Province are located in the eastern and southern parts of Henan Province.
(3) The analysis of the factors that influence the time lag of winter wheat drought needs to be considered comprehensively.
When screening the main factors affecting the time lag from meteorological drought to winter wheat drought, six geographical factors (soil field capacity, elevation, slope, aspect, precipitation, and temperature) of the underlying surface were selected for grey relation analysis. However, the factors that affect drought include diverse geographical factors such as climatic meteorology, topography, soil vegetation, and human activities. The relationship between geographical factors and drought is not one-way, and it is extremely difficult to consider the mutual feedback mechanism between them. Therefore, in order to better understand the rule of drought, it is necessary to investigate the physical processes, taking into account other meteorological factors (temperature, wind speed, sunshine duration, etc.), underlying surface factors (topography, soil type, hydrological characteristics, etc.), and other factors (diseases and insect pests, field management, irrigation, etc.) to explore proven correlations between agricultural drought and meteorological drought to provide the possibility of accurate monitoring and even the prediction of agricultural drought.
(4) The suggestions for minimizing the impact of drought through appropriate measures are as follows: (a) Strengthen the construction of water conservancy facilities, the establishment of agricultural irrigation in a scientific way is necessary for the prevention of drought; (b) Strengthen the early warning systems of agricultural drought and set up response measures to ensure efficient control the drought; and (c) Spreading a scientific method for planting drought-resistant crops is worthwhile in drought areas.
6. Conclusions
Based on the meteorological observation data from 60 meteorological sites, this study characterized winter wheat drought and meteorological drought by crop water deficit index (CWDI) and relative moisture index (M), respectively. The spatial-temporal evolution of the two drought indexes was analyzed, and the time lag from meteorological drought to winter wheat drought was calculated. Finally, the relationship between the time lag from meteorological drought and major geographical factors of the underlying surface was discussed. It can be concluded that:
(1) For CWDI, the CWDI value during the over-wintering period was relatively large. Except for during the filling and mature period, CWDI in the other growth periods showed a slightly downward trend. For M, there was no significant interannual variation among the growth periods of winter wheat. The proportion of CWDI and M in the sites above the level of middle drought showed a trend of decreasing from the north to the south.
(2) The cross-wavelet coherence spectrum of CWDI and M during the filling and mature period of winter wheat almost all passed the significant test of 0.05. The time lags in each growth period were different, the time lag during the greening and heading period was the shortest at 3.21 days, and the time lag during the over-wintering period was the longest at 84.35 days. The calculation of the response time lags for agricultural drought to meteorological drought could provide the foundation for the prevention measure of drought.
(3) The geographical factors of the underlying surface in each growth period were well correlated with the time lag of winter wheat drought, which were all above 0.5. The sites with high correlation between the time lag of winter wheat drought and each geographical factor of the underlying surface was mostly distributed in the mountainous areas with poor soil field capacity, at greater depth of the shallow groundwater, high altitude, and steep slope, the area in the east and northeast slopes, and northern area with less precipitation and lower temperature. It is of great significance to understand the occurrence and development of drought in the Huaihe River Basin and clarify the response mechanism of winter wheat drought to meteorological drought.
Author Contributions
C.G., C.C., Y.H., T.R., and Y.S. conceived the research; T.R., C.C., and G.L. performed the data; C.G., C.C., Y.H., T.R., G.L., and Y.S. analyzed the data; C.G., C.C., Y.H., Y.S., T.R., and Y.S. wrote the draft. All authors contributed to the final version manuscript. All authors have read and agreed to the published version of the manuscript.
Funding
This research was funded by the National Natural Science Foundation of China grant number [41871024] and the APC was funded by [41871024].
Acknowledgments
The authors wish to express their special thanks to Yanwei Sun. The authors thank him for the useful discussions. The authors wish to thank anonymous reviewers and guest editors for their very useful comments which have helped to improve the manuscript.
Conflicts of Interest
The authors declare no conflict of interest.
References
- Beniston, M.; Stephenson, D.B. Extreme climatic events and their evolution under changing climatic conditions. Glob. Planet Chang. 2004, 44, 1–9. [Google Scholar] [CrossRef] [Green Version]
- Jiang, T.; Li, X.C.; Chao, Q.C.; Yuan, J.L.; Lin, E.D. Highlights and understanding of climate change 2014: Impacts, adaptation, and vulnerability. Clim. Chang. Res. 2014, 3, 157–166, (In Chinese with English Abstract). [Google Scholar]
- Liu, G.Y.; Shen, H.F.; Hu, J.; Shi, X.R.; Shang, Y.R. Investigation on dynamic changes of drought of winter wheat by TVDI index—Taking the Xingtai in Hebei Province as an example. Agric. Res. Arid Areas 2015, 33, 227–232, (In Chinese with English Abstract and Figures). [Google Scholar]
- Duan, K.; Mei, Y.D. Comparison of meteorological, hydrological and agricultural drought responses to climate change and uncertainty assessment. Water Resour. Manag. 2014, 28, 5039–5054. [Google Scholar] [CrossRef]
- Dhakar, R.; Sehgal, V.K.; Pradhan, S. Study on inter-seasonal and intra-seasonal relationships of meteorological and agricultural drought indices in the Rajasthan State of India. J. Arid Environ. 2013, 97, 108–119. [Google Scholar] [CrossRef]
- Huang, S.Z.; Huang, Q.; Chang, J.X.; Leng, G.Y.; Xing, L. The response of agricultural drought to meteorological drought and the influencing factors: A case study in the Wei River Basin, China. Agric. Water Manag. 2015, 159, 45–54. [Google Scholar] [CrossRef]
- Qiang, H.F.; Jin, X.Y.; Zhao, L.; Lu, Z.H. Dry-wet condition variations in Zoige wetland in recent 56 years based on relative humidity index. Res. Soil Water Conserv. 2018, 25, 172–177, 182, (In Chinese with English Abstract). [Google Scholar]
- AghaKouchak, A.; Nakhjiri, N. A near real-time satellite-based global drought climate data record. Environ. Res. Lett. 2012, 7, 044037. [Google Scholar] [CrossRef] [Green Version]
- Stachowski, P. Assessment of meteorological droughts on the postmining areas in the Koninregion. Rocz. Ochr. Sr. 2010, 12, 587–606. [Google Scholar]
- Mondol, M.A.H.; Das, S.C.; Islam, M.N. Application of standardized precipitation index to assess meteorological drought in Bangladesh. J. Dis. Risk Stud. 2016, 8, 280. [Google Scholar] [CrossRef] [Green Version]
- Mishra, A.K.; Singh, V.P. A review of drought concepts. J. Hydrol. 2010, 391, 204–216. [Google Scholar] [CrossRef]
- Chang, J.X.; Li, Y.Y.; Wang, Y.M.; Yuan, M. Copula-based drought risk assessment combined with an integrated index in the Wei River Basin, China. J. Hydrol. 2016, 540, 824–834. [Google Scholar] [CrossRef]
- Mason, S.J.; Goddard, L. Probabilistic precipitation anomalies associated with ENSO. Bull. Am. Meteorol. Soc. 2001, 82, 619–638. [Google Scholar] [CrossRef] [Green Version]
- Hayes, M.J.; Svoboda, M.D.; Wilhite, D.A.; Vanyarkho, O.V. Monitoring the 1996 drought using the standardized precipitation index. Bull. Am. Meteorol. Soc. 1999, 80, 429–438. [Google Scholar] [CrossRef] [Green Version]
- Adnan, S.; Ullah, K.; Li, S.; Gao, S.; Khan, A.H.; Mahmood, R. Comparison of various drought indices to monitor drought status in Pakistan. Clim. Dyn. 2018, 51, 1885–1899. [Google Scholar] [CrossRef]
- Jehanzaib, M.; Kim, T.W. Exploring the influence of climate change-induced drought propagation on wetlands. Ecol. Eng. 2020, 149, 105799. [Google Scholar] [CrossRef]
- Parker, A.J. The Topographic Relative Moisture Index: An Approach to Soil-Moisture Assessment in Mountain Terrain. Phys. Geogr. 2013, 3, 160–168. [Google Scholar] [CrossRef]
- Yu, H.Q.; Zhang, Q.; Sun, P.; Song, C.Q. Impacts of drought intensity and drought duration on winter wheat yield in five provinces of north China plain. Acta Geogr. Sin. 2019, 79, 87–102, (In Chinese with English Abstract). [Google Scholar]
- Shen, Z.X.; Zhang, Q.; Singh, V.P.; Sun, P.; Song, C.Q.; Yu, H.Q. Agricultural drought monitoring across Inner Mongolia, China: Development, spatiotemporal patterns and impacts. J. Hydrol. 2019, 571, 793–804. [Google Scholar] [CrossRef]
- Ji, T.; Li, G.S.; Yang, H.; Liu, R.; He, T.R. Comprehensive drought index as an indicator for use in drought monitoring integrating multi-source remote sensing data: A case study covering the Sichuan-Chongqing region. Int. J. Remote Sens. 2018, 39, 786–809. [Google Scholar] [CrossRef]
- Ren, Y.; Wang, Y.M.; Chang, J.; Huang, Q. The spatial and temporal distribution of drought in Shanxi Province. J. Nat. Res. 2017, 32, 137–151, (In Chinese with English Abstract). [Google Scholar]
- Han, M.; Zhang, H.H.; DeJonge, K.C.; Comas, L.H.; Gleason, S. Comparison of three crop water stress index models with sap flow measurements in maize. Agric. Water Manag. 2018, 203, 366–375. [Google Scholar] [CrossRef]
- Gao, C.; Li, X.W. Precipitation thresholds of drought disaster for maize in areas in front of Bengbu Sluice, Huaihe River Basin. China Water 2018, 10, 1395. [Google Scholar] [CrossRef] [Green Version]
- Yu, H.Q.; Zhang, Q.; Xu, C.Y.; Du, J.; Sun, P.; Hu, P. Modified Palmer Drought Severity Index: Model improvement and application. Environ. Int. 2019, 130. [Google Scholar] [CrossRef]
- Liu, X.F.; Zhu, X.F.; Pan, Y.D.; Li, S.S.; Liu, Y.X.; Ma, Y.Q. Agricultural drought monitor: Progress, challenges and prospect. J. Geogr. Sci. 2016, 26, 750–767. [Google Scholar] [CrossRef] [Green Version]
- Barbosa, H.A.; Kumar, T.V.L.; Paredes, F.; Elliott, S.; Ayuga, J.G. Assessment of caatinga response to drought using meteosat-SEVIRI normalized difference vegetation index (2008–2016). ISPRS J. Photogramm. 2019, 148, 235–252. [Google Scholar] [CrossRef]
- Hu, C.H.; Zhao, L.X.; Wang, Y.X.; Xue, X.S.; Wu, L.L. Analysis of the relationship between the meteorological, agriculture and hydrological drought. Meteorol. Environ. Sci. 2016, 39, 1–6, (In Chinese with English Abstract). [Google Scholar]
- Pandey, R.P.; Ramasastri, K.S. Relationship between the common climatic parameters and average drought frequency. Hydrol. Process. 2001, 15, 1019–1032. [Google Scholar] [CrossRef]
- Wang, D.B.; Hejazi, M.; Cai, X.M.; Valocchi, A.J. Climate change impact on meteorological, agricultural, and hydrological drought in central illinois. Water Resour. Res. 2011, 47, W09527. [Google Scholar] [CrossRef] [Green Version]
- Van Loon, A.F.; Van Huijgevoort, M.H.J.; Van Lanen, H.A.J. Evaluation of drought propagation in an ensemble mean of large-scale hydrological models. Hydrol. Earth Syst. Sci. 2012, 16, 4057–4078. [Google Scholar] [CrossRef] [Green Version]
- Wang, Z.; Wang, F.; Zhang, Y. Spatio-temporal distribution characteristics and influencing factors of drought in Anhui Province based on CWSI. J. Nat. Res. 2018, 33, 853–866, (In Chinese with English Abstract). [Google Scholar]
- Kundu, A.; Denis, D.M.; Patel, N.R.; Dutta, D. A Geo-spatial study for analyzing temporal responses of NDVI to rainfall. Singap. J. Trop. Geogr. 2018, 39, 107–116. [Google Scholar] [CrossRef]
- Nicholson, C.; Shinker, J.J.; Hanway, V.M.; Zavala, S. The Influence of atmospheric circulation on Abnormal snowpack melt-out events and drought in Wyoming. J. Am. Water Resour. Assoc. 2018, 54, 1355–1371. [Google Scholar] [CrossRef]
- Ozelkan, E.; Chen, G.; Ustundag, B.B. Multiscale object-based drought monitoring and comparison in rainfed and irrigated agriculture from Landsat 8 OLI imagery. Int. J. Appl. Earth Obs. 2016, 44, 159–170. [Google Scholar] [CrossRef]
- Dai, A. Increasing drought under global warming in observations and models. Nat. Clim. Chang. 2013, 3, 52–58. [Google Scholar] [CrossRef] [Green Version]
- Jehanzaib, M.; Sattar, M.N.; Lee, J.H. Investigating effect of climate change on drought propagation from meteorological to hydrological drought using multi-model ensemble projections. Stoch. Environ. Res. Risk A. 2020, 34, 7–21. [Google Scholar] [CrossRef]
- Gao, C.; Yin, Z.X.; Xu, Y. Space-time characteristics of drought and flood in main growing periods of winter wheat in Huaihe River Basin and its impact on yield. Trans. Chin. Soc. Agric. Eng. 2017, 33, 103–111, (In Chinese with English Abstract and Figures). [Google Scholar]
- Yu, H.Q.; Zhang, Q.; Sun, P.; Song, C.Q. Impact of Droughts on Winter Wheat Yield in Different Growth Stages during 2001–2016 in Eastern China. Int. J. Disaster Risk Sci. 2018, 9, 376–391. [Google Scholar] [CrossRef] [Green Version]
- Gao, C.; Li, X.W.; Sun, Y.W.; Luo, G.; Chen, C. Water requirement of summer maize at different growth stages and the spatiotemporal characteristics of agricultural drought in the Huaihe River Basin, China. Theor. Appl. Climatol. 2019, 136, 1289–1302. [Google Scholar] [CrossRef]
- Xu, X.C.; Ge, Q.S.; Zheng, J.Y.; Dai, E.F.; Liu, C.W. Drought risk assessment on regional agriculture: A case in southwest China. Prog. Geogr. 2011, 30, 883–890, (In Chinese with English Abstract). [Google Scholar]
- Liu, Z.Y.; Zhang, J.P.; Luo, H.X.; He, Y.K. Temporal and spatial distribution of maize drought in Southwest of China based on agricultural reference index for drought. Trans. Chin. Soc. Agric. Eng. 2014, 30, 105–115, (In Chinese with English Abstract and Figures). [Google Scholar]
- Xu, Y.; Ma, X.Q.; Wang, X.D.; Zhang, H. Analysis of spatial and temporal variation characteristics of winter wheat water deficiency in Huaihe River Basin. Sci. Geogr. Sin. 2013, 33, 1138–1144, (In Chinese with English Abstract). [Google Scholar]
- General Administration of Quality Supervision, Inspection and Quarantine of the People’s Republic of China; Standardization Administration of the People’s Republic of China. Drought Grade of Winter Wheat; General Administration of Quality Supervision, Inspection and Quarantine of the People’s Republic of China: Beijing, China; Standardization Administration of the People’s Republic of China: Beijing, China, 2015. (In Chinese)
- Standardization Administration of the People’s Republic of China. Classification of Meteorological Drought; General Administration of Quality Supervision, Inspection and Quarantine of the People’s Republic of China: Beijing, China; Standardization Administration of the People’s Republic of China: Beijing, China, 2006. (In Chinese)
- Grinsted, A.; Moore, J.C.; Jevrejeva, S. Application of the cross wavelet transform and wavelet coherence to geophysical time series. Nonlinear Proc. Geophys. 2004, 11, 561–566. [Google Scholar] [CrossRef]
- Wang, Y.D.; Liu, X.L.; Ren, G.X.; Yang, G.H.; Feng, Y.Z. Analysis of the spatiotemporal variability of droughts and the effects of drought on potato production in northern China. Agric. For. Meteorol. 2019, 264, 334–342. [Google Scholar] [CrossRef]
- Atta-ur-Rahman; Dawood, M. Spatio-statistical analysis of temperature fluctuation using Mann-Kendall and Sen’s slope approach. Clim. Dyn. 2016, 48, 783–797. [Google Scholar]
- Jain, S.K.; Kumar, V. Trend analysis of rainfall and temperature data for India. Curr. Sci. 2012, 102, 37–49. [Google Scholar]
- Yin, Z.X.; Gao, C.; Li, X.W.; Ruan, T. Threshold drought and flooding at critical growth period of Winter wheat in the upper reach of Huai River. J. Irrig. Drain. 2017, 36, 100–107, (In Chinese with English Abstract). [Google Scholar]
Figure 1.
Locations of the study area and meteorological stations.
Figure 1.
Locations of the study area and meteorological stations.
Figure 2.
Division of winter wheat growth periods in the study area.
Figure 2.
Division of winter wheat growth periods in the study area.
Figure 3.
Crop water deficit index (CWDI) for winter wheat from 1961 to 2015, (a) pre-winter growth period; (b) over-wintering period; (c) greening and heading period; and (d) filling and mature period.
Figure 3.
Crop water deficit index (CWDI) for winter wheat from 1961 to 2015, (a) pre-winter growth period; (b) over-wintering period; (c) greening and heading period; and (d) filling and mature period.
Figure 4.
Temporal dynamics of relative moisture index (M) for winter wheat from 1961 to 2015, (a) pre-winter growth period; (b) over-wintering period; (c) greening and heading period; and (d) filling and mature period.
Figure 4.
Temporal dynamics of relative moisture index (M) for winter wheat from 1961 to 2015, (a) pre-winter growth period; (b) over-wintering period; (c) greening and heading period; and (d) filling and mature period.
Figure 5.
The proportion of crop water deficit index (CWDI) and relative moisture index (M) of winter wheat that reached the level above moderate drought and the Mann–Kendall test result of each station for CWDI and M from 1961 to 2015 (CWDI and M in pre-winter growth period, over-wintering period, greening and heading period, filling and mature period are (a), (b), (c), (d) and (e), (f), (g), (h), respectively).
Figure 6.
Cross wavelet coherence spectrum of CWDI and M of winter wheat in four growth periods: (a) pre-winter growth period; (b) over-wintering period; (c) greening and heading period; (d) filling and mature period. Arrow shows the relative phase difference; the region illustrated by the bolded black line passed the red noise test at α = 0.05 significance level; the thin black line is the wavelet influence cone curve (COI), and the range outside the influence cone was not considered due to the influence of the boundary effect.
Figure 7.
Time-frequency domain characteristics of the cross-wavelet transform of CWDI and M in four growth periods of winter wheat: (a) pre-winter growth period; (b) over-wintering period; (c) greening and heading period; and (d) filling and mature period.
Figure 7.
Time-frequency domain characteristics of the cross-wavelet transform of CWDI and M in four growth periods of winter wheat: (a) pre-winter growth period; (b) over-wintering period; (c) greening and heading period; and (d) filling and mature period.
Figure 8.
Grey relation between the time lag of winter wheat drought and each geographical factor of the underlying surface in each growth period. The closer the grey relation to 1, the higher the correlation.
Figure 8.
Grey relation between the time lag of winter wheat drought and each geographical factor of the underlying surface in each growth period. The closer the grey relation to 1, the higher the correlation.
Figure 9.
The grey relation degree between the different geographical factors of the underlying surface and the time lag of winter wheat drought in the greening and heading period. (a) Soil field capacity; (b) elevation; (c) slope; (d) aspect; (e) precipitation; (f) temperature; (g) depth of shallow groundwater).
Table 1.
Crop coefficient Kc of winter wheat for each month.
Table 1.
Crop coefficient Kc of winter wheat for each month.
| Region | October | November | December | January | February | March | April | May | June |
|---|
| Henan Province | 0.63 | 0.83 | 0.93 | 0.31 | 0.5 | 0.91 | 1.4 | 1.29 | 0.6 |
| Anhui Province | 1.18 | 1.15 | 1.25 | 1.13 | 1.14 | 1.07 | 1.16 | 0.87 | 0.63 |
Table 2.
Drought classification of crop water deficit index (%).
Table 2.
Drought classification of crop water deficit index (%).
| Grade | Type | Crop Water Deficit Index (CWDI) |
|---|
| Water Critical Period | Other Growth Period |
|---|
| 0 | No drought | CWDI ≤ 30 | CWDI ≤ 35 |
| 1 | Mild drought | 30 < CWDI ≤ 40 | 35 < CWDI ≤ 50 |
| 2 | Moderate drought | 40 < CWDI ≤ 50 | 50 < CWDI ≤ 65 |
| 3 | Severe drought | 50 < CWDI ≤ 60 | 65 < CWDI ≤ 80 |
| 4 | Extreme drought | CWDI > 60 | CWDI > 80 |
Table 3.
Drought classification according to the relative moisture index.
Table 3.
Drought classification according to the relative moisture index.
| Degree | Type | Relative Moisture Index (M) |
|---|
| 1 | No drought | −0.40 < M |
| 2 | Mild drought | −0.65 < M ≤ −0.40 |
| 3 | Moderate drought | −0.80 < M ≤ −0.65 |
| 4 | Severe drought | −0.95 < M ≤ −0.80 |
| 5 | Extreme drought | M ≤ −0.95 |
Table 4.
Results of cross wavelet transform of CWDI and M.
Table 4.
Results of cross wavelet transform of CWDI and M.
| Growth Period | Main Oscillation Period/Year | Mean Phase Angle/Rad | Time Interval/Day |
|---|
| Pre-winter growth period | 2.06~3.90 | −0.13 | 26.6 |
| Over-wintering period | 3.9 | −0.37 | 84.35 |
| greening and heading period | 7.8 | −0.01 | 3.21 |
| filling and mature period | 4.91~5.84 | −0.07 | 25.86 |
© 2020 by the authors. Licensee MDPI, Basel, Switzerland. This article is an open access article distributed under the terms and conditions of the Creative Commons Attribution (CC BY) license (http://creativecommons.org/licenses/by/4.0/).


