Article

Experimental Study on Aeration Performance and Bubble Characteristics of Inverted Umbrella Aerator

1
School of Energy and Power Engineering, Jiangsu University, Zhenjiang 212013, China
2
Research Centre of Fluid Machinery Engineering and Technology, Jiangsu University, Zhenjiang 212013, China
*
Author to whom correspondence should be addressed.
Water 2020, 12(10), 2809; https://doi.org/10.3390/w12102809
Submission received: 14 September 2020 / Revised: 2 October 2020 / Accepted: 5 October 2020 / Published: 10 October 2020
(This article belongs to the Section Hydraulics and Hydrodynamics)

Abstract

:
In order to understand the aeration performance of inverted umbrella aerator and bubble characteristics in aeration tank under different conditions, and to reveal the internal relationship between bubble characteristics and aeration performance, an experimental bench of dissolved oxygen concentration and high-speed photography was built. Logarithmic oxygen deficit values were fitted under various conditions. The images captured by high-speed photography were processed, then the bubble characteristics were extracted accurately. It was found that the standard oxygen mass transfer coefficient increased linearly with an increase of rotational speed at a certain immersion depth, and increased firstly then decreased with a decrease of immersion depth when rotational speed was kept constant. The bubble size ranged from 0 mm to 1.59 mm under different working conditions, and the variation of the gas holdup was the same as the standard oxygen mass transfer coefficient when the rotational speed and immersion depth were changing. It was shown that bubbles play a leading role in the process of oxygen mass transfer and have a great influence on oxygen mass transfer rate.

1. Introduction

Water pollution becomes more and more serious with the rapid development of industry and economy. Sewage treatment equipment is an important part of sewage treatment, which can effectively solve the problem of water pollution and improve utilization rate of water resources. An inverted umbrella aerator is the core equipment of sewage treatment. The function is to provide oxygen for aerobe, which decomposes unstable organic compounds into inorganic matters, transforms inorganic poison into an innoxious substance, and accelerates water purification. The gas–liquid two-phase flow in the oxidation ditch directly determines the efficiency and stability of the whole sewage treatment system.
Since gas–liquid two-phase flow theory related to water treatment was first proposed in the literature [1] in 1964, many researchers have devoted themselves to the study of gas–liquid two-phase flow [2,3]. With the development of a flow apparatus, researchers began to study the flow details of gas–liquid two-phase flow (bubble shape, bubble size, bubble rising speed, gas holdup, liquid velocity, etc.). Wang et al. [4] studied gas–liquid two-phase flow in a circular tank. The important parameters (local gas holdup, liquid velocity, and Reynolds stress) were measured through a hot-film anemometer. Kitagawa et al. [5] studied the interaction between bubbles through Particle Image Velocimetry (PIV). The resistance coefficient was calculated according to the average diameter of bubbles, then the rising speed of bubble populations was obtained. Revankar et al. [6] measured the radial distribution characteristics (void fraction, bubble velocity, bubble chord length) at the phase interfaces through a fiber probe. The motion rule of bubbles under the effect of turbulence was analyzed through statistical methods, and the experimental images of bubble growth at different speeds wad obtained. Lee et al. [7] photographed the movement of bubbles in an oxidation ditch using high-speed photography, and the speed of bubbles under different aspect ratios was obtained. Loubière et al. [8] studied the influence of lateral flow on bubble formation in an oxidation ditch through high-speed photography. The variation of flow structure caused by different bubble behaviors was studied through PIV. The results showed that the rising deformation of a bubble is related to the variation of liquid viscosity.
The variation of aeration performance of an inverted umbrella aerator under different rotational speeds and immersion depths was studied [9]. The best aeration performance was found when the rotational linear velocity of impeller was 4.4 m/s. The immersion depth of the impeller should not be too deep, which should be less than 0.07 D (D is the diameter of impeller). Wang et al. [10] studied the aeration performance parameters of the inverted umbrella aerator in different dimensions. The prediction model of the inverted umbrella aerator performance was established. Guo et al. [11] studied the optimum condition for the aeration efficiency of the inverted umbrella aerator by the changing rotational speed and immersion depth. Dong [12] conducted experiments on the inverted umbrella aerator. The bubble feature extraction method for the inverted umbrella aerator was established through high-speed photography and MATLAB.
It can be seen from the above research that the micro characteristics (bubble size, trajectory, variation of liquid level) [13] and macroscopic evaluation indexes (aeration performance, aeration efficiency, mixing efficiency) [14] are the two main aspects of the current research on the inverted umbrella aerator. However, the existing research is about aeration performance or bubble characteristics individually. Therefore, it is necessary to study the aeration performance of the inverted umbrella aerator and bubble characteristics, and explore their internal relationship, so as to provide a theoretical basis and technical support for the optimization of the inverted umbrella aerator and the research of gas–liquid two-phase flow.
In this paper, an experimental bench of aeration performance and high-speed photography was built to extract the flow characteristics in the aeration tank and to measure performance indexes of the inverted umbrella aerator. The aeration performance of the aerator and bubble characteristics under different working conditions were studied, the variation of the gas–liquid flow in the aeration tank was revealed and the internal relationship between gas holdup and aeration performance was explored. The study provides a theoretical basis and technical support for the economic operation of the inverted umbrella aerator.

2. Materials and Methods

2.1. Experimental Materials

The impeller of the inverted umbrella aerator in the experiment was mainly composed of three parts: blade, plate, and plate gap [15]. A photo and detailed parameters of the impeller are shown in Figure 1. The impeller was printed in 3D with photosensitive resin as the material. The aeration tank was a plexiglass cylinder with a diameter (R) of 300 mm and the height of the tank (H) was 300 mm.
The experimental system mainly consisted of an inverted umbrella aerator, aeration tank, lifting device, portable dissolved oxygen meter, and high-speed photographic system. The schematic diagram is shown in Figure 2.
The aeration performance of the inverted umbrella aerator was collected by a portable dissolved oxygen meter. An oxygen concentration measuring point [16] was set in the aeration tank, and the probe was located at H/2 of the liquid level height of the aeration tank axially and R/2 away from the aeration impeller radially. A detailed description of the meter is shown in Table 1.
In order to ensure that the dissolved oxygen concentration was 0 before aeration, an oxygen absorbing reagent (sodium sulfite anhydrous) was needed to deoxidize the clean water. According to industry standards [17], the mass of NaSO3 was calculated as:
G = 8 kCV
where, G is the mass of sodium sulphite, g; k is the deoxidation safety factor, taken as 1.5 in this test; C is the concentration of dissolved oxygen in liquid, mg/L; V is the volume of liquid in the aeration tank, m3.
The concentration of the sodium sulphite in the test was 1.206 g.
The deoxidation reaction was too slow, and the catalyst (CoCl2·6(H2O)) was used in the experiment. The volume of the liquid in the aeration tank was less than 500 m3, and the initial concentration of catalyst was 0.10 mg/L.
The pictures of bubbles were taken by a high-speed camera. A detail description of the camera is shown in Table 2.

2.2. Experimental Scheme

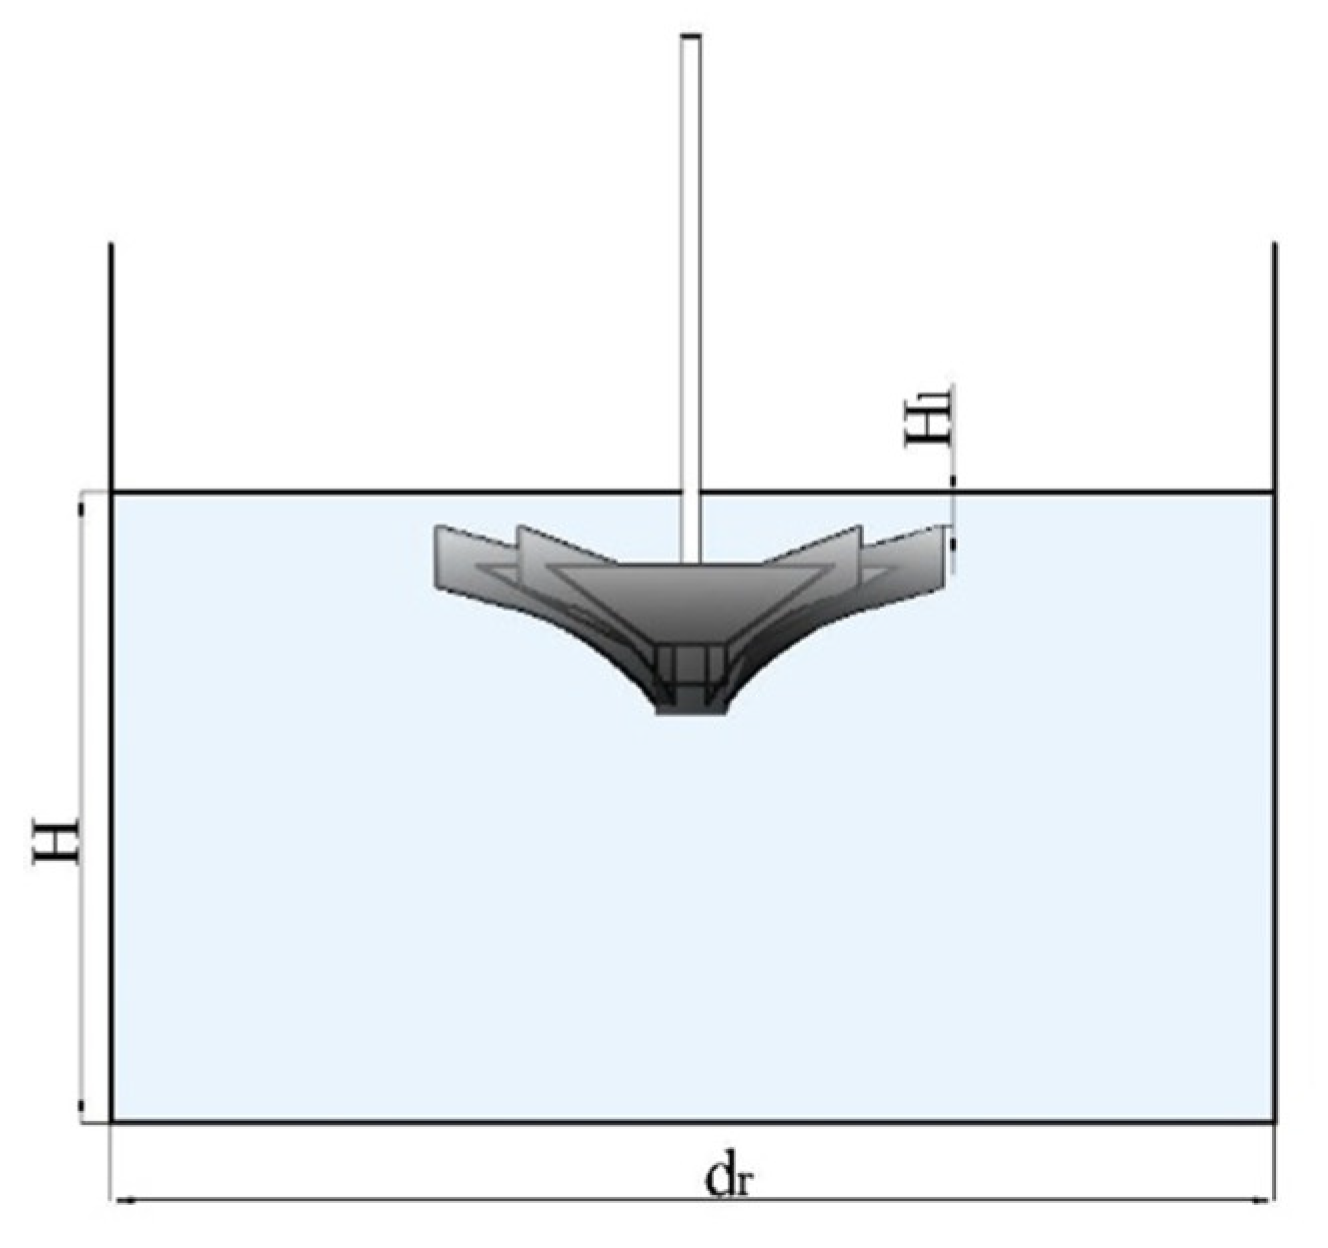
The specific experimental scheme is shown in Table 3. The dissolved oxygen concentration and bubble characteristics of six immersion depths and nine rotational speeds were studied when the liquid level height determined for static conditions was 200 mm. Immersion depth was the distance between the highest point of the impeller and free surface in the static condition. A diagram is shown in Figure 3.

3. Results and Discussion

3.1. Results and Discussion of Dissolved Oxygen Concentration

3.1.1. Variation of Dissolved Oxygen Concentration

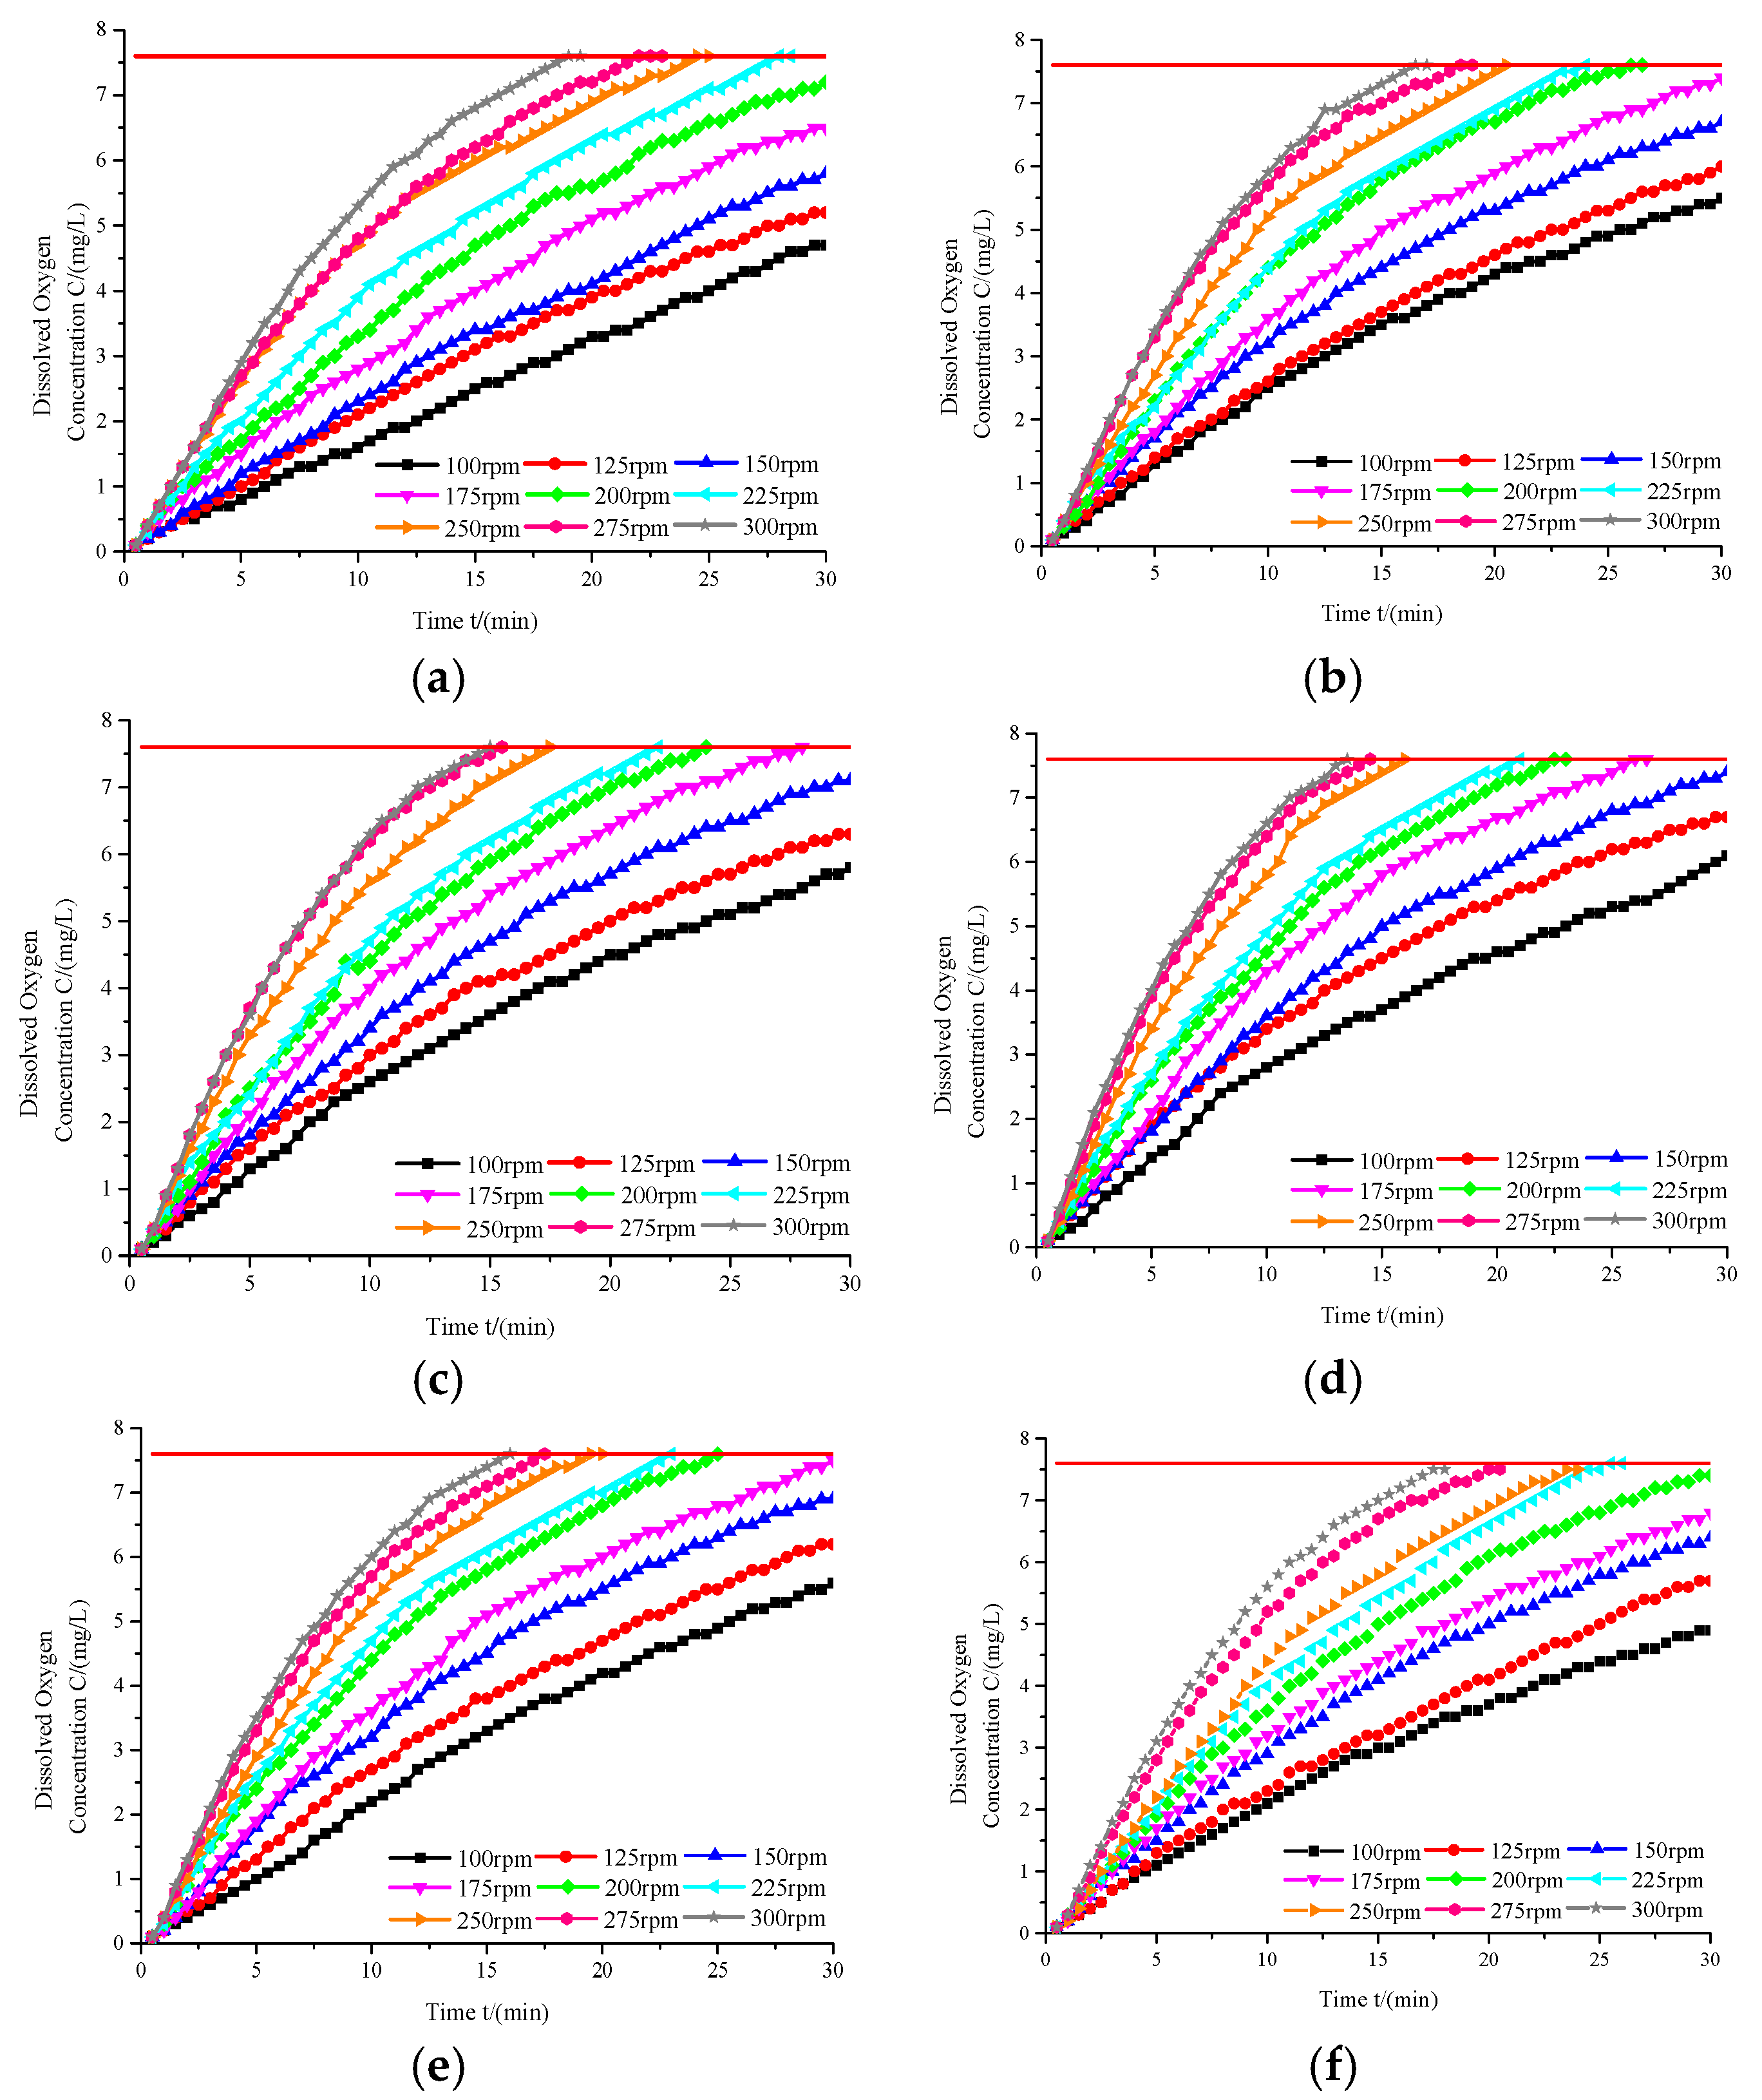
The time history plot of the dissolved oxygen concentration at different immersion depths and rotational speeds of impeller when the liquid level was 200 mm are shown in Figure 4. The red line in the figure represents the saturated dissolved oxygen concentration.
As can be seen from the figure, the dissolved oxygen concentration increased with an increase of time at any speed, while the oxygen concentration gradient decreased continuously. The diffusion rate gradually decreased, and the increase of dissolved oxygen concentration slowed down and finally stabilized at a saturated dissolved oxygen concentration. According to Fick’s law, an increase of dissolved oxygen concentration in liquid can reduce the oxygen content per unit area and concentration gradient of oxygen at the direction of mass transfer. The concentration gradient in the direction of mass transfer plays a decisive role in the diffusion rate. The decrease of concentration gradient leads to the decrease of oxygen diffusion rate, and the oxygen mass transfer rate decreases.
When the impeller was higher than the free surface (immersion depth is +10 mm and +5 mm), the contact area between the impeller and liquid was small. The hydraulic jump height was low. The radiation radius was small. The liquid stayed in the air for a short time, and the mass transfer efficiency was low at the bubble interface, which resulted in the slow growth of dissolved oxygen concentration in the aeration tank. When the impeller was equal or slightly lower than the free surface (immersion depth is 0 mm and −5 mm), the hydraulic jump was fully developed. The saturation value of dissolved oxygen concentration was reached more quickly. When the impeller was below the free surface (immersion depth is −10 mm and −15 mm), the impeller mainly played a role of stirring. Aeration and oxygenation were weakened. Therefore, the increase rate of dissolved oxygen concentration was decreased.

3.1.2. Standard Oxygen Mass Transfer Coefficient Fitting of Different Working Conditions

Oxygen mass transfer coefficient kLa was the main evaluation index of aeration performance of the inverted umbrella aerator.
According to the two-film theory, the variation of dissolved oxygen is as follows:
dC dt = k L a ( C s C )
where, dC dt is the oxygen transfer rate, mg/ (L min); kLa is the oxygen mass transfer coefficient, min−1; Cs is the oxygen saturation concentration under the experimental conditions, mg/L; and C is the dissolved oxygen concentration at time T, mg/L.
Equation (2) is integrated:
k L a = ln ( C s C t 1 ) ln ( C s C t 2 ) t 2 t 1
where, C t 1 is the dissolved oxygen concentration at time t1; and C t 2 is the dissolved oxygen concentration at time t2.
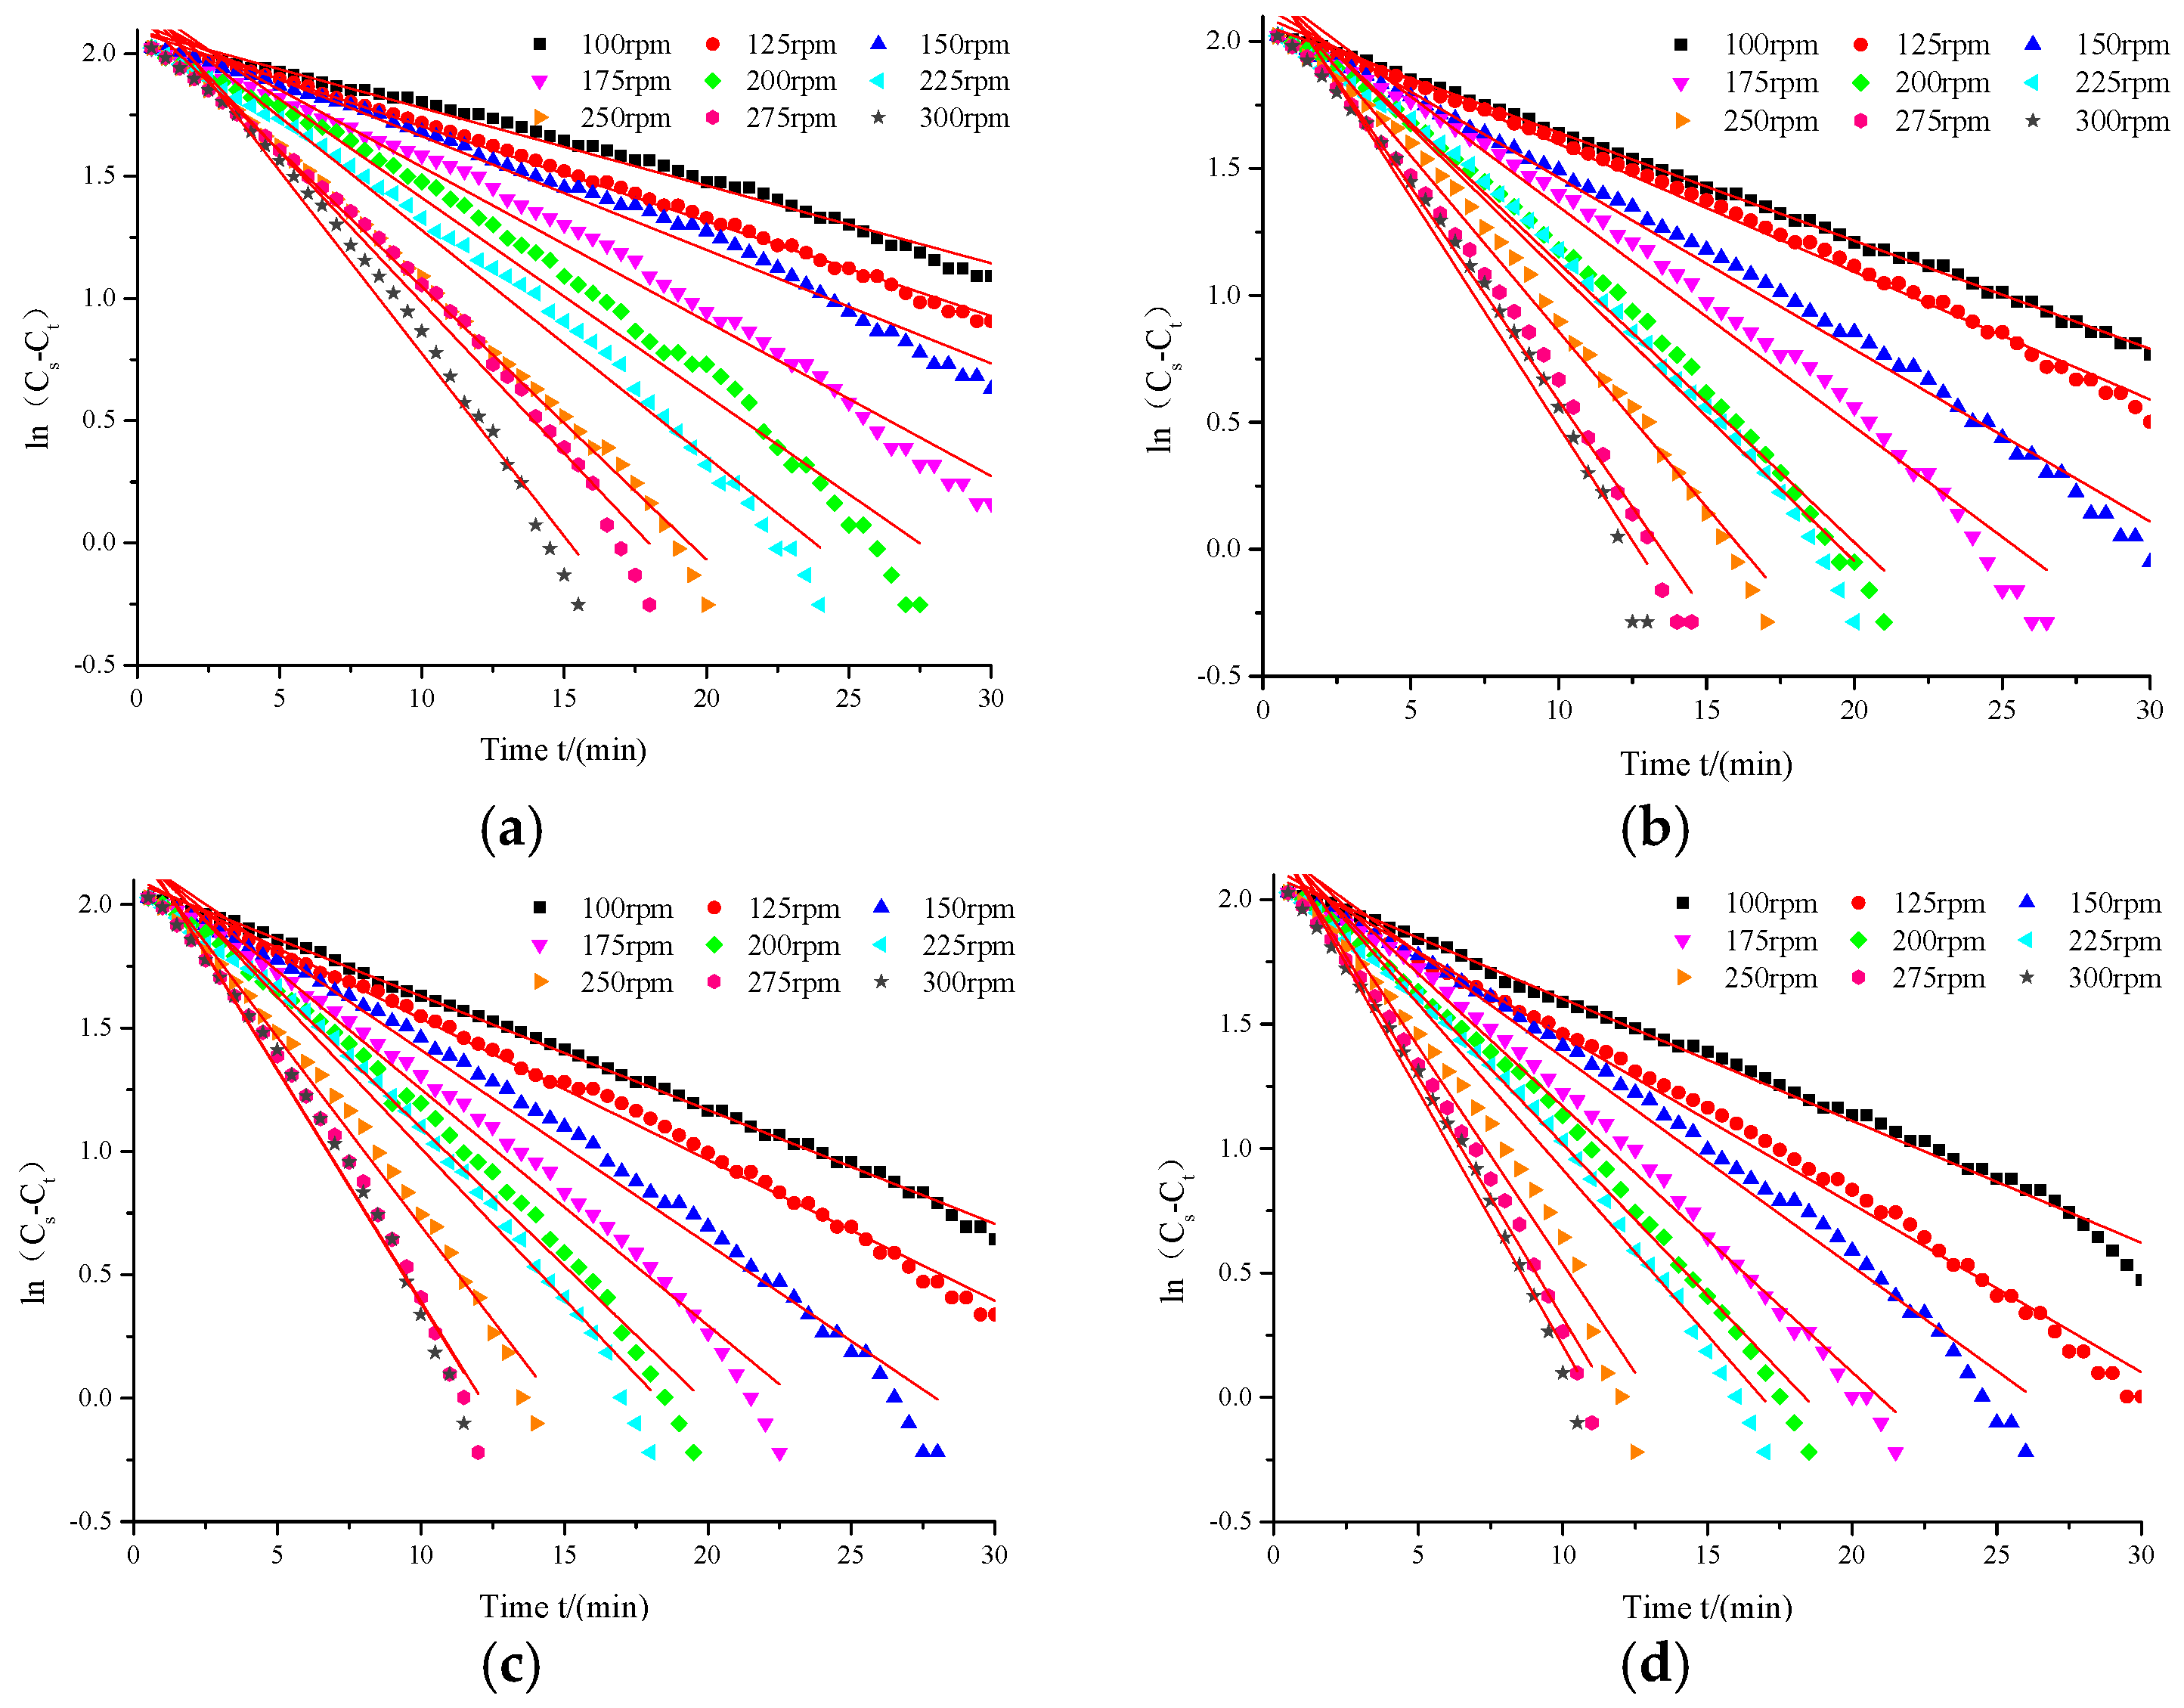
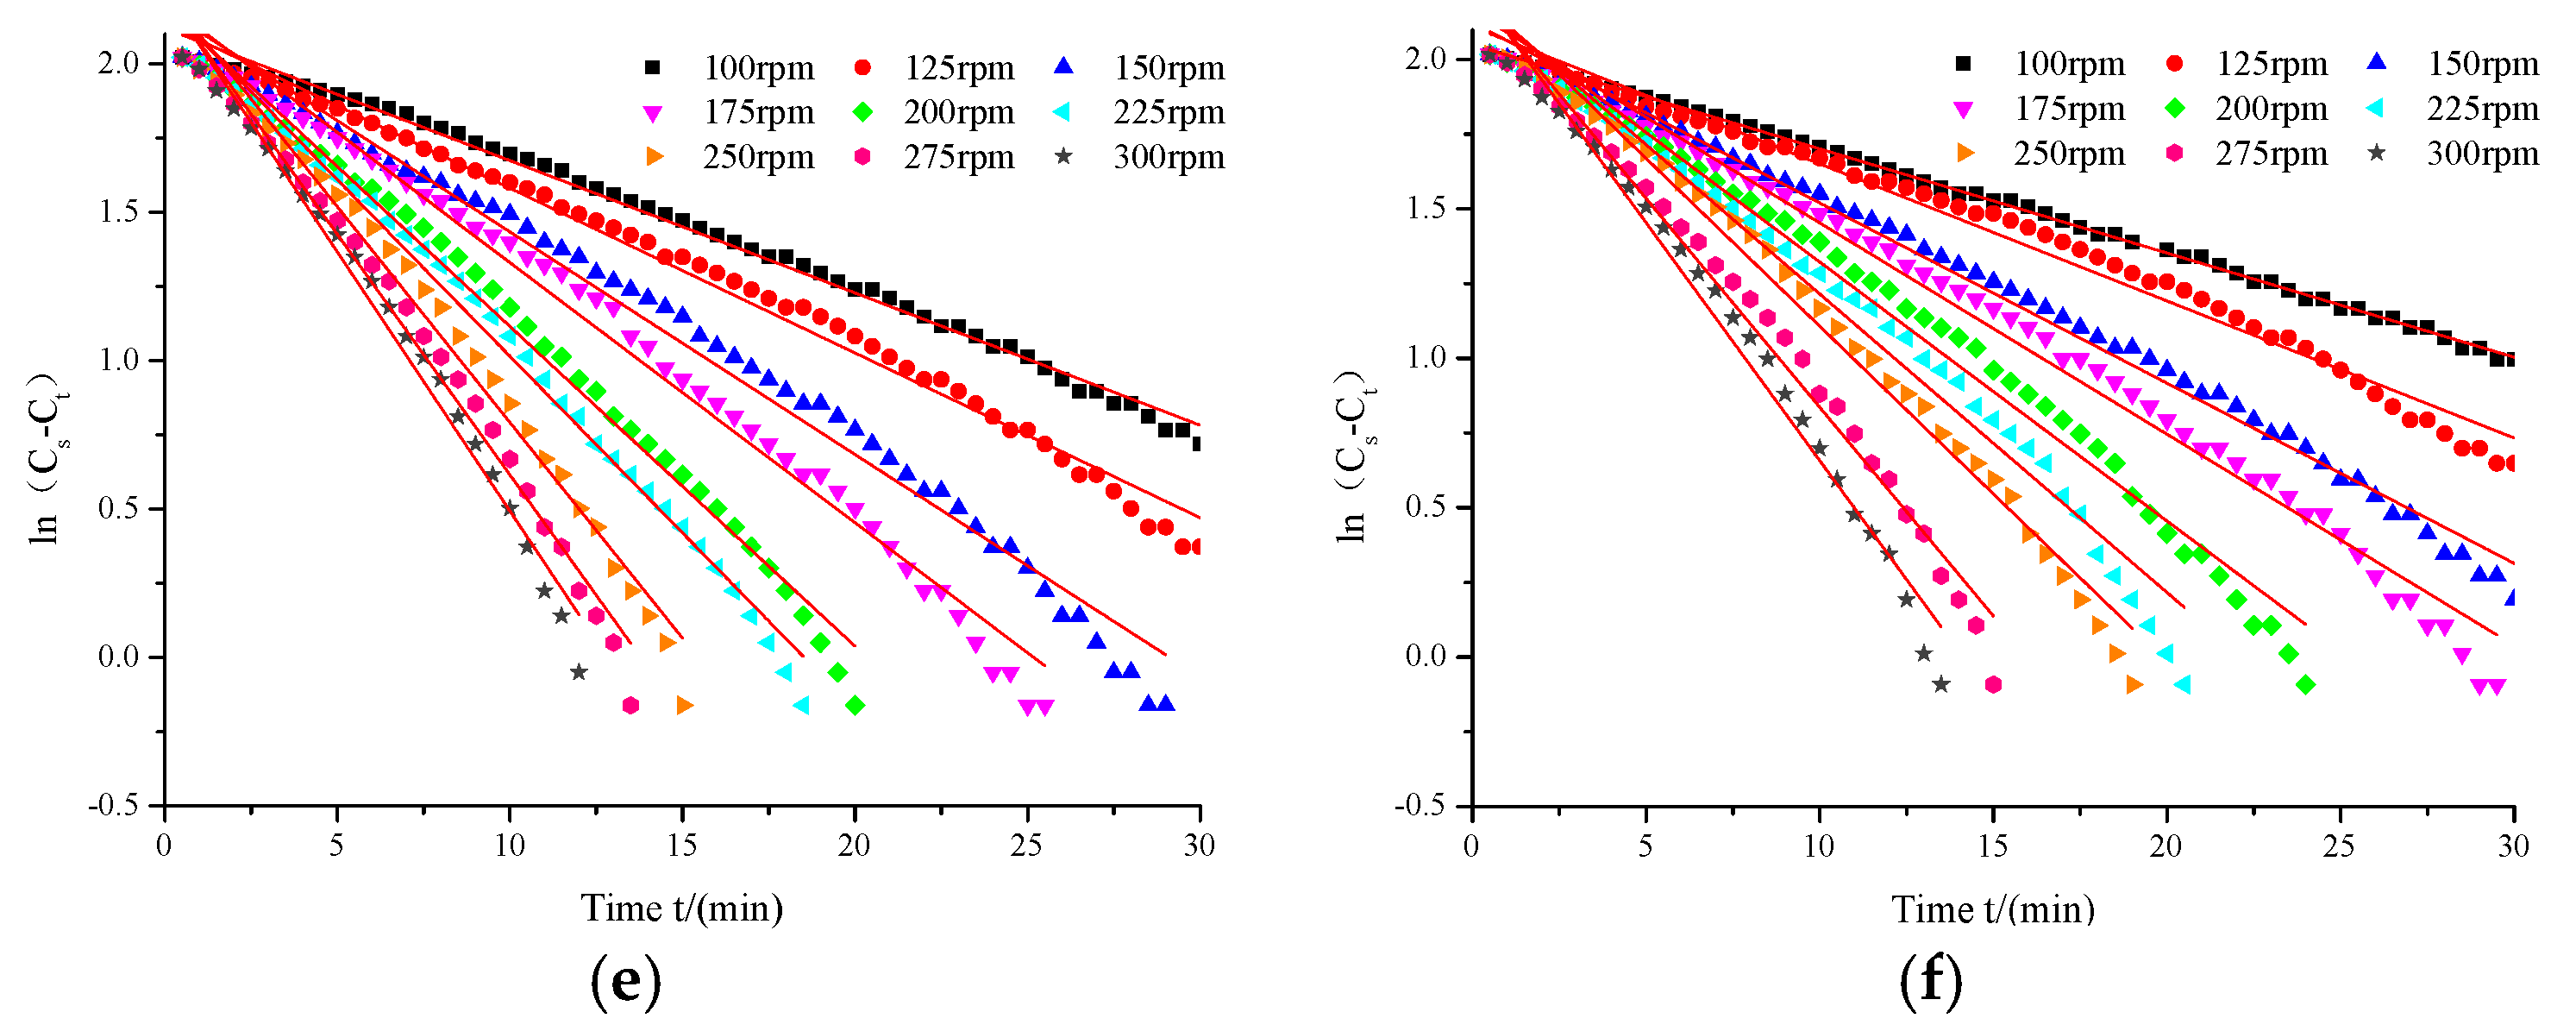
It can be seen from Equation (3) that oxygen mass transfer coefficient kLa is the opposite of the slope of the time history plot of logarithmic concentration ln (Cs − Ct). The dissolved oxygen concentration is converted to logarithmic concentration and scatter plot is made. Then the scatter point is linearly fitted. The curve fitting of each working condition has high accuracy, and the coefficient of determination R2 can be more than 0.98. The fitted lines are shown in Figure 5.
It can be seen from the figure that the slope of the fitted line (oxygen mass transfer coefficient kLa) increased with an increase of rotational speed at any immersion depth. The main reasons are as follows:
(1)
The turbulent intensity near the impeller increased with an increase of rotational speed. The liquid film thickness decreased with the action of strong turbulence. The resistance of free surface mass transfer was decreased, which was beneficial to oxygen transfer. That is, the mass transfer rate at free surface was accelerated.
(2)
The axial lifting of the aeration impeller increased with an increase of rotational speed, which increased the height and radiation radius of hydraulic jump effectively and the contact area between liquid and air was enlarged. More air was entrapped into the liquid and bubbles were generated, which was beneficial to bubble mass transfer.
The liquid was tested at different temperatures. In order to eliminate the influence of temperature, temperature correction was carried out in the test. The correction formula is as follow:
k L a ( 20 ) = k L a ( T ) × 1.024 20 T
where, T is the liquid temperature of the experiment, ℃; kLa(T) is oxygen mass transfer coefficient at experimental liquid temperature T, min−1; and 1.024 is the correction coefficient.
The fitted kLa under different conditions is calibrated and compared. The experimental temperature T was 29.1 °C when the immersion depth was +10 mm; 29.3 °C when the immersion depth was +5, −10, and −15 mm; and 28.9 °C when the immersion depth was +5 and 0 mm. The standard oxygen mass transfer coefficient kLa(20) is shown in Table 4.
It can be seen from the table that the standard oxygen mass transfer coefficient increased with an increase of rotational speed at a certain immersion depth. Standard oxygen mass transfer coefficient increased firstly then decreased with a decrease of immersion depth when rotational speed of the impeller was kept constant, and kLa(20) was the highest when the immersion depth was −5 mm.
The standard oxygen mass transfer coefficient varied little at different immersion depths when the inverted umbrella aerator rans at the low speed of 100 rpm. The hydraulic jump did not occur when the immersion depth was +10 mm and −15 mm. At this time, oxygen transfer mainly depended on liquid level renewal, which resulted in a lower standard oxygen mass transfer coefficient kLa(20). A hydraulic jump appeared when the immersion depth was +5 mm, 0 mm, −5 mm, and −10 mm. However, the hydraulic jump height was low, the radiation radius was small, and the turbulence intensity of liquid was weak due to the low rotational speed. The aeration performance varied a little under different immersion depths when the impeller ran at a low speed.
The standard oxygen mass transfer coefficient at an immersion depth of 0 mm and −5 mm was higher than other immersion depths when the inverted umbrella aerator ran at 300 rpm. kLa(20) was the highest when the immersion depth was −5 mm. The high-speed impeller had a driving and lifting effect on the liquid. The liquid moved upward along the plate on the axis plane, forming a parabolic trajectory. A hydraulic jump was generated, which enhanced the rate of bubble mass transfer. In addition, the impeller was immersed in the liquid and the stirring effect was obviously enhanced, which made the liquid velocity increase in the tank. Shallow liquid with high dissolved oxygen concentration was better mixed with bottom liquid with a low dissolved oxygen concentration. Dissolved oxygen diffused from the shallow layer to the bottom layer under the influence of a concentration gradient, which lead to the decrease of shallow oxygen concentration. The aeration efficiency was further increased.
When the aeration impeller was higher than the free surface (immersion depth is +10 mm, +5 mm), the contact area between the impeller and liquid level was small, and the turbulence intensity of the free surface was weak. At this time, the main mode of mass transfer was free surface mass transfer, which resulted in a lower standard oxygen mass transfer coefficient kLa(20). When the impeller was below the free surface (immersion depth is −10 mm, −15 mm), the hydraulic jump did not occur, and the number of bubbles was decreased. The mass transfer efficiency of bubbles below the liquid level decreased, which lead to a lower standard oxygen mass transfer coefficient.

3.2. Results and Discussion of High-Speed Photography

3.2.1. Bubble Characteristic Parameters Extraction

The images of bubbles were captured by high-speed photography. When the inverted umbrella aerator ran, the hydraulic jump was violent and many bubbles appeared. The overlapping adhesion during bubbles, bubbles reflection, inconspicuous contrast between bubbles and background, and surface reflection of wall affect the accuracy of bubble characteristic parameter extraction. Therefore, it was necessary to extract bubble characteristic parameters (bubble diameter, bubble position) efficiently using an appropriate image processing method. For the original image, bubble characteristic parameters were extracted effectively by pre-processing, picture segmentation, binarization, and characteristics extraction.
The bubble characteristic parameters were extracted from a binary image after preprocessing and picture segmentation. The main characteristic parameters were bubble equivalent diameter, bubble position, and gas holdup.
1.
Bubble equivalent diameter
The unbalanced pressure exerted on the bubbles during their movement in liquid resulted in deformation. The bubble size after deformation was different from the actual bubble size.
In order to study the relationship between bubble size and gas–liquid mass transfer accurately, the bubble equivalent diameter db was introduced. The diameter of a circle with the same area with ellipse was defined as the equivalent diameter of a bubble, as shown in formula (5):
d b = 4 S / π
where, S is the area of the ellipse, m2.
2.
Bubble coordinates
The coordinates of all pixels belonging to the same bubble were added and averaged, and the average was the coordinate of the bubble [18]. The formulas for calculating coordinates are as follows:
x c = i . j Ω j N
y c = i . j Ω j N
where, (i, j) represents the pixels of column J in row I in the image; N is the total number of pixels in the bubble connected region; and Ω denotes the connecting region of the bubble plane.
3.
Gas holdup
The liquid level difference method is usually used to measure the overall gas holdup [19]. The liquid level difference during operation is measured, and the gas holdup is calculated by a formula [20].
α g = h D h L h D
where, α g is the gas holdup; and hL and hD are the liquid level heights before and after aeration, respectively.
There was an error in the measurement of the liquid level change due to the drastic hydraulic jump, entrainment, and other phenomena during the operation of the inverted umbrella aerator. A method which calculated the gas holdup by extracting bubble characteristics and the total area of bubbles was proposed through high-speed photography and MATLAB image processing technology; the formula is (8).
α g = S bubbles S bubbles + S L
where, Sbubbles is the total area of bubbles and SL is the initial liquid area.

3.2.2. Analysis of Bubble Characteristics

1.
Bubble size
Oxygen mass transfer mainly included free surface mass transfer above the free surface and bubble mass transfer below the free surface. Free surface mass transfer means that oxygen above the free surface enters the liquid through the gas–liquid film. Bubble mass transfer refers to the process of oxygen diffusion from the bubble to the liquid. In essence, both of them are caused by the concentration and pressure gradient at the liquid–gas interface, which makes oxygen enter the liquid continuously. Free surface mass transfer exists without bubble breaking on the free surface. When the waves of the free surface are broken, bubbles are generated by the action of hydraulic jump and entrainment. Free surface mass transfer and bubbles mass transfer exist simultaneously.
The images collected at different working condition were processed. It was found that the rotational speed was different when bubbles first appeared. Therefore, only the working conditions with bubbles were analyzed. The size of bubbles was widely spread, and the number was quite different. The bubble equivalent diameter was calculated by formula (5). The bubble size ranged from 0 to 4.5 pixels for all working conditions. Bubbles were classified into four categories in pixels: 0–1.49 pixels, 1.5–2.49 pixels, 2.5–3.49 pixels, and 3.5–4.5 pixels, respectively. In order to count and calculate the bubbles size conveniently, four types of bubble sizes were rounded, and their diameters were 1, 2, 3, and 4 pixels. Per unit pixel was 0.353 mm in the image processing, the bubble sizes were 0.35 mm, 0.71 mm, 1.06 mm, and 1.41 mm, respectively.
Figure 6 shows the number of bubbles in different conditions. Bubble number of each speed at the immersion depth of 0mm is shown in Figure 6a. The total number of bubbles and the number of bubbles at each size increased with an increase of rotational speed at the same immersion depth. The reason may be that the increase of rotational speed makes the turbulence intensity increase and more air is involved. The number of small bubbles accounts for a higher proportion. The main reason was that the large size bubbles were divided into several small bubbles due to the shear stress in the rotation of the impeller. The percentage of bubbles in different sizes was similar with an increase of rotational speed. The 0–0.53 mm bubbles accounted for 40–67%, 0.53–0.88 mm bubbles accounted for 21–31%, and 0.88–1.23 mm bubbles accounted for 8%. The 1.23–1.59 mm bubbles occurred due to the coalescence of bubbles, which accounted for about 5%. The bubbles with a diameter of 0–0.53 mm had a great influence on oxygen mass transfer rate. With an increase in 0–0.53 mm bubbles number, the contact area between bubbles and liquid is larger, and the oxygen mass transfer is more intense. On the other hand, the impeller stirs the bubbles and the liquid, which strengthens the turbulent intensity of the liquid. Bubble collision leads to coalescence. Large size bubbles move to the free surface after coalescence, which causes the waves of the free surface to break. The contact area between the liquid surface and air increases and oxygen mass transfer on the free surface is strengthened.
Figure 6b shows the numbers of bubbles at different immersion depths when the rotational speed was 300 rpm. It can be seen from the figure that the immersion depth had an effect on the bubbles number. At the same rotational speed, the bubble number increased first and decreased with an increase in immersion depth, and reached the maximum at the immersion depth of −5 mm. The variation of bubbles number was the same as the standard oxygen mass transfer coefficient, which indicates that bubbles mass transfer plays a major role in the process of oxygen mass transfer. It can be seen from the figure that the bubbles with a diameter of 0–0.53 mm accounted for the largest proportion. Their amount first decreased and increased with the lifting of the impeller. Large size bubbles accounted for the least cardinality and did not occur when the immersion depth was 10 mm.
2.
Bubble distribution
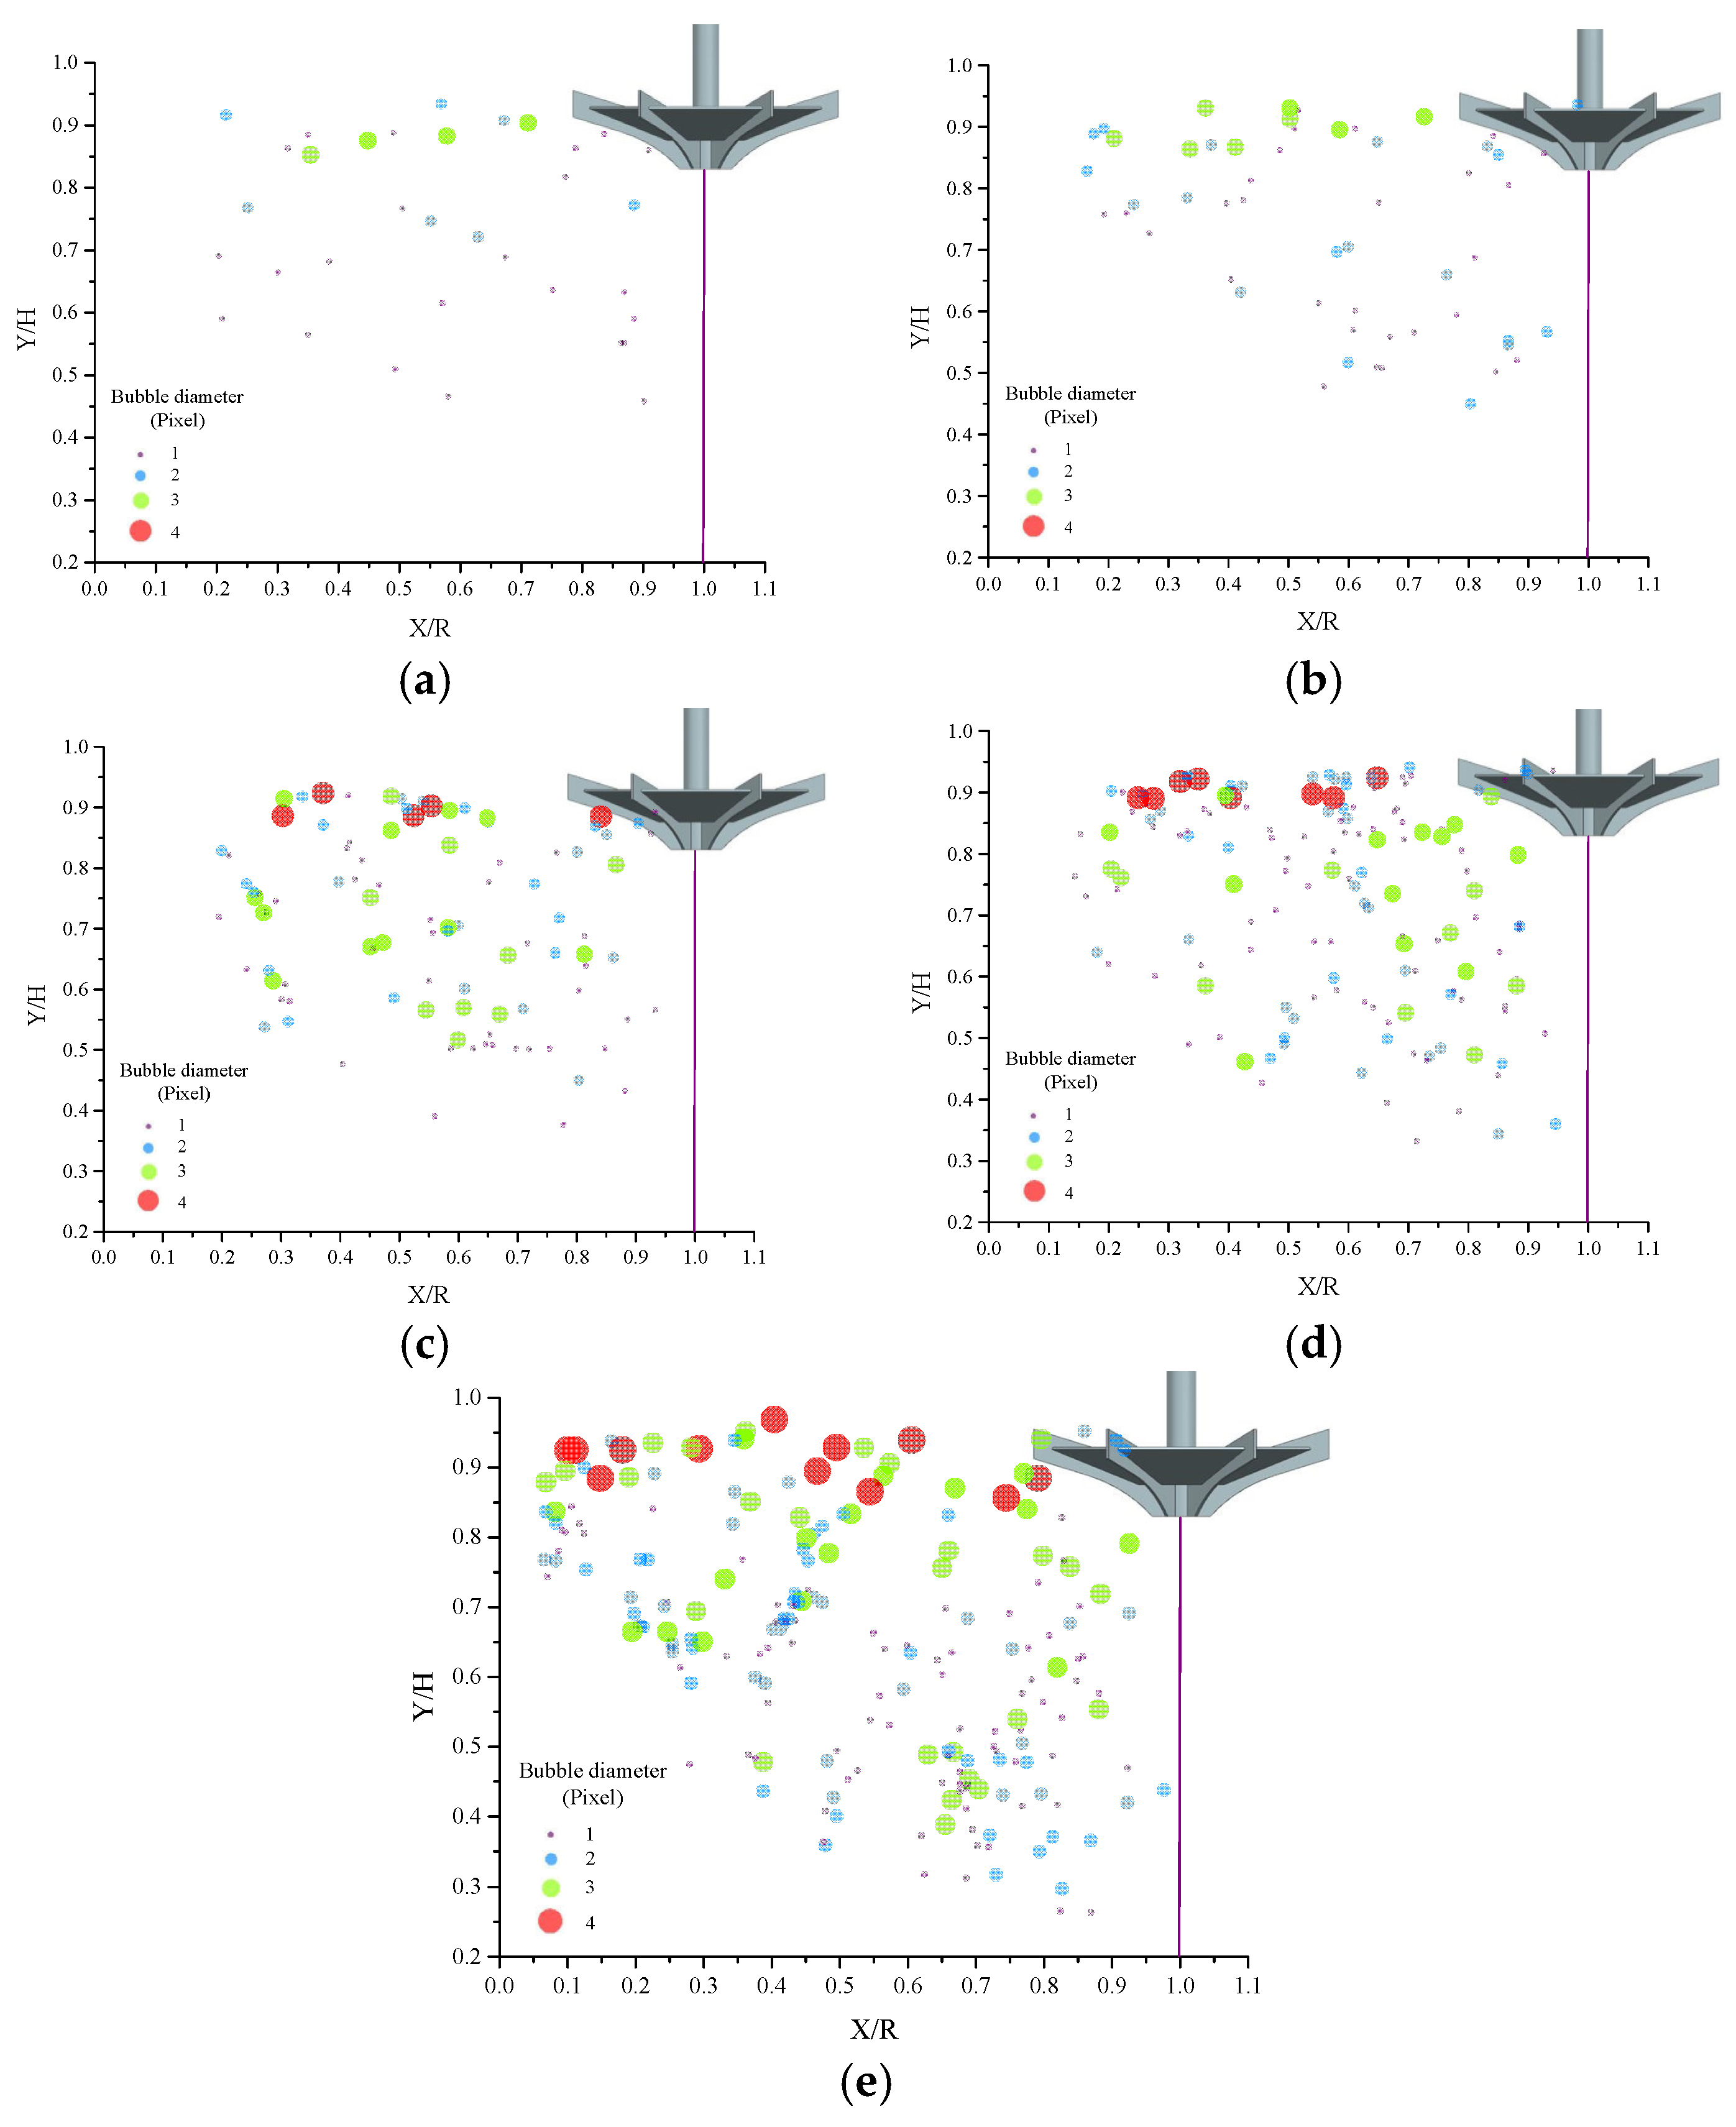
Bubble distribution under different rotational speeds at immersion depth of 0 mm was studied. When the rotational speed of inverted umbrella aerator was lower than 200 rpm, the turbulence intensity of liquid level was weak. There was no wave breaking on the free surface, and there were almost no bubbles during operation. Therefore, only the rotational speed above 200 rpm was analyzed. Bubbles were grouped into four categories in pixels as described above. The bubble distribution is shown in Figure 7.
From Figure 7, bubbles began to appear around the impeller when the inverted umbrella aerator ran at the rotational speed of 200 rpm. Bubbles number increased and the bubbles distributed in the upper liquid due to hydraulic jump when the rotational speed was 225 rpm. Hydraulic jump became more intense due to the rotational action of the impeller when the rotational speed was more than 250 rpm. Because of hydraulic jump and under pressure entrainment, a large amount of air entered the liquid and formed bubbles in different sizes. The bubbles presented a triangular distribution near the impeller. Bubbles not only appeared in the upper liquid, but also in the bottom. Under the influence of pressure gradient, air enters the liquid and the oxygen becomes dissolved gas. At this time, bubbles mass transfer exists, which makes the dissolved oxygen concentration increase. In addition, it can be seen from the figure that large size bubbles mainly appeared at the free surface, while small bubbles existed at the middle and bottom of the liquid. The reason is that the coalescence of bubbles increases the size of bubbles. Bubbles move towards the free surface under the influence of buoyancy. Small size bubbles were significantly affected by external forces. Under the influence of the circulation vortex, the bubbles moved to the wall and the bottom of the aeration tank.
3.
Variation of gas holdup
The variation of gas holdup at different working conditions is shown in Figure 8. As can be seen from the figure, the rotational speed was different when bubbles first appeared under different immersion depths. The bubbles started to appear at the rotational speed of 175 rpm when the immersion depth was +10 mm, 0 mm, −5 mm, −10 mm, and −15 mm, and the bubbles started to appear at the rotational speed of 200 rpm when the immersion depth was +5 mm. Gas holdup tended to increase with an increase of rotational speed. Gas holdup first increased and then decreased with a decrease of immersion depth, and the gas holdup was the highest at the immersion depth of −5 mm.

4. Relationship between Gas Holdup and Aeration Performance

It can be seen from the experimental results that the gas holdup and the standard oxygen mass transfer coefficient are related to the working conditions of the aerator, while the standard oxygen mass transfer coefficient reflects the aeration performance of the aerator.
The bubble characteristics and the standard oxygen mass transfer coefficient at different rotational speeds were analyzed when the immersion depth is 0 mm.
Figure 9a shows the variation of gas holdup (αg) and the standard oxygen mass transfer coefficient at different rotational speeds when the immersion depth was 0 mm. From the figure, the two have the same trend. Both of them showed an increasing trend with an increase of rotational speed at the certain immersion depth. Under the same immersion depth, the larger the rotational speed of the aerator, the greater the gas holdup and the standard oxygen mass transfer coefficient. Bubbles had a great influence on the oxygen mass transfer rate. The contact area between bubbles and liquid increased with an increase in gas holdup, which made the oxygen mass transfer more intense. With the increase of the rotational speed, the turbulence intensity of liquid was enhanced, and the effect of the impeller agitation on bubbles and liquid was strengthened. The bubble collision caused their coalescence, and large size bubbles moved towards the free surface after coalescence. The contact areas between liquid and air were increased, and the process of free surface mass transfer was strengthened.
The variation of gas holdup and the standard oxygen mass transfer coefficient was the same at the same rotational speed and different immersion depths. Bubbles were generated at all immersion depths when the speed was more than 275 rpm. A speed of 300 rpm was selected.
Figure 9b shows the variation of gas holdup and standard oxygen mass transfer coefficient under different immersion depths at the rotational speed of 300 rpm. From the figure, the two had the same trend. Both of them increased first and then decreased with a decrease of immersion depth at the certain rotational speed and both of them were the highest when the immersion depth was −5 mm. It shows that the bubble mass transfer plays an important role in the process of oxygen mass transfer, and bubbles have a great influence on oxygen mass transfer rate. The reason is that when the immersion depth was higher than −5 mm, the agitation of the surface liquid by impeller was significantly increased with a decrease of the immersion depth, which increased the contact area between the bubble and the surrounding liquid. The interaction between bubbles was enhanced, and oxygen mass transfer process was more intense. When the immersion depth was less than −5 mm, the total number of the bubbles decreased with a decrease of immersion depth. When the gas holdup decreased, the process of oxygen mass transfer was weakened.
In conclusion, the variation of gas holdup was the same as kLa(20), and it was related to the bubble number. With an increase of rotational speed, the bubble number increased, and the gas holdup and the standard oxygen mass transfer coefficient also increased. With a decrease of immersion depth, the bubble number first increased and then decreased, and the gas holdup and the standard oxygen mass transfer coefficient also first increased and then decreased. It shows that the aeration performance of the inverted umbrella aerator is closely related to the bubble characteristics, and the bubbles play a leading role in the process of oxygen mass transfer.

5. Conclusions

The experimental bench of the aeration performance and bubble characteristics was built. The aeration performance and bubble characteristics were studied through changing the rotational speed and immersion depth. The main conclusions are as follows:
1.
The standard oxygen mass transfer coefficient increased linearly with an increase of rotational speed at a certain immersion depth. Standard oxygen mass transfer coefficient increased firstly then decreased with a decrease of immersion depth when rotational speed is kept constant. The standard oxygen mass transfer coefficient was the highest when the immersion depth was −5 mm.
2.
The bubble size ranged from 0.1 mm to 1.59 mm under different working conditions, and 0–0.88 mm bubbles play an important role in the reaeration process of the inverted umbrella aerator.
3.
With an increase of rotational speed, the gas holdup and the standard oxygen mass transfer coefficient increased. With the lifting of the impeller, the gas holdup and the standard oxygen mass transfer coefficient first decreased and then increased. The variation of gas holdup corresponded to the standard oxygen mass transfer coefficient. Bubbles play a leading role in the process of oxygen mass transfer.

Author Contributions

All the co-authors contributed to the article. Methodology, C.D.; completion of the experiment, L.D., J.G., and J.L.; formal analysis, H.L., J.G., and J.L.; writing—original draft preparation, J.G. and J.L.; writing—review and editing, L.D., J.G. and C.D.; supervision, C.D. All authors have read and agreed to the published version of the manuscript.

Funding

This work was supported by the National Natural Science Foundation of China (No. 51879122, 51579117, 51779106), Sichuan Provincial Key Lab of Process Equipment and Control (GK201614, GK201816) and Six Talent Peaks Project in Jiangsu Province (GDZB-017).

Acknowledgments

The authors gratefully acknowledge the National Natural Science Foundation of China (No. 51879122, 51579117, 51779106), Sichuan Provincial Key Lab of Process Equipment and Control (GK201614, GK201816) and Six Talent Peaks Project in Jiangsu Province (GDZB-017).

Conflicts of Interest

The authors declare no conflict of interest.

References

  1. Rowe, P.N. A note on the motion of a bubble rising through a fluidized bed. Chem. Eng. Sci. 1964, 19, 75–77. [Google Scholar] [CrossRef]
  2. Rowe, P.N.; Partridge, B.A. An x-ray study of bubbles in fluid-ised beds. Chem. Eng. Res. Des. 1997, 75, S116–S134. [Google Scholar] [CrossRef]
  3. Rowe, P.N.; Yacono, C.X.R. The bubbling behavior of fine powders when fluidized. Chem. Eng. Sci. 1976, 31, 1179–1192. [Google Scholar] [CrossRef]
  4. Wang, S.K.; Lee, S.J.; Jones, O.C.; Jr, R.T.L. 3-D turbulence structure and phase distribution measurements in bubbly two-phase flows. Int. J. Multiphas. Flow 1987, 13, 327–343. [Google Scholar] [CrossRef]
  5. Kitagawa, A.; Sugiyama, K.; Murai, Y. Experimental detection of bubble-bubble interactions in a wall-sliding bubble swarm. Int. J. Multiphas. Flow 2014, 30, 1213–1234. [Google Scholar] [CrossRef]
  6. Revankar, S.T.; Ishii, M. Local interfacial area measurement in bubbly flow. Int. J. Heat Mass Transf. 1992, 35, 913–925. [Google Scholar] [CrossRef]
  7. Lee, W.H.; Lee, J.H.; Bishop, P.L.; Papautsky, I. Biological ap-plication of micro-electro mechanical systems microelectrode a-ray sensors for direct measurement of phosphate in the enhanced biological phosphorous removal process. Water Environ. Res. 2009, 81, 748–754. [Google Scholar] [CrossRef] [PubMed]
  8. Loubière, K.; Castaignède, V.; Hébrard, G.; Roustan, M. Bubble formation at a flexible orifice with liquid cross-flow. Int. J. Heat Mass Transf. 2012, 43, 717–725. [Google Scholar] [CrossRef] [Green Version]
  9. Cao, R.J.; Chen, X.C. Test and measurement of high power inverse cone surface aerator. Water Wastewater Eng. 2002, 28, 67–70. [Google Scholar]
  10. Dong, L.; Wang, Y.; Dai, C.; Liu, H.L.; Ming, J.Y. Prediction of aeration performance for inverted umbrella aerator based on dimensional analysis. J. Chem. Eng. Jpn. 2019, 52, 369–376. [Google Scholar] [CrossRef]
  11. Guo, X.S.; Zhou, X.; Chen, Q.W.; Liu, J.X. Flow field and dis-solved oxygen distributions in the outer channel of the orbal oxi-dation ditch by monitor and CFD simulation. J. Environ. Sci China 2013, 25, 645–651. [Google Scholar] [CrossRef]
  12. Dong, L.; Guo, J.N.; Liu, J.W.; Liu, H.L.; Dai, C. Experimental study and numerical simulation of gas–liquid two-phase flow in aeration tank based on CFD-PBM coupled model. Water 2020, 12, 1569. [Google Scholar] [CrossRef]
  13. Karpinska, A.M.; Dias, M.M.; Boaventura, A.R.; Santos, R.J. Modeling of the hydrodynamics and energy expenditure of oxi-dation ditch aerated with hydrojets using CFD codes. Water Qual. Res. J. Can. 2015, 50, 83–94. [Google Scholar] [CrossRef]
  14. Zhou, W.Z.; Fan, K.; Gou, Q.Z. Study on oxygen transfer characteristics of inverted-umbrella type surface aerator. Ind. Water Wastewater 2013, 44, 58–60. [Google Scholar]
  15. Liu, J.W. Gas-Liquid Flow Mechanism and Optimization Design Research for Inverted Umbrella Aerator. Master’s Thesis, Jiangsu University, Zhenjiang, China, 2019. [Google Scholar]
  16. Ming, J.Y. Free Surface Capture and Aeration Research on Inverse Umbrella Aerator. Master’s Thesis, Jiangsu University, Zhenjiang, China, 2017. [Google Scholar]
  17. Inverted-Umbrella Type Surface Aerator; Standards Press of China: Beijing, China, 2014; p. 9.
  18. Zaruba, A.; Krepper, E.; Prasser, H.M.; Vanga, B.N.R. Experimental study on bubble motion in a rectangular bubble column using high-speed video observations. Flow Meas. Instrum. 2005, 16, 277–287. [Google Scholar] [CrossRef]
  19. Jesus, S.S.D.; Neto, J.M.; Santana, A.; Filho, R.M. Influence of impeller type on hydrodynamics and gas-liquid mass-transfer in stirred airlift bioreactor. AIChE J. 2015, 61, 3159–3171. [Google Scholar] [CrossRef]
  20. Wang, C.L.; Zhang, J.L.; Zhang, M.Q. Hydrodynamics and oxygen mass transfer properties of the hemi-cambered pitched blade turbines. Chem. Ind. Eng. Prog. 2018, 37, 35–46. [Google Scholar]
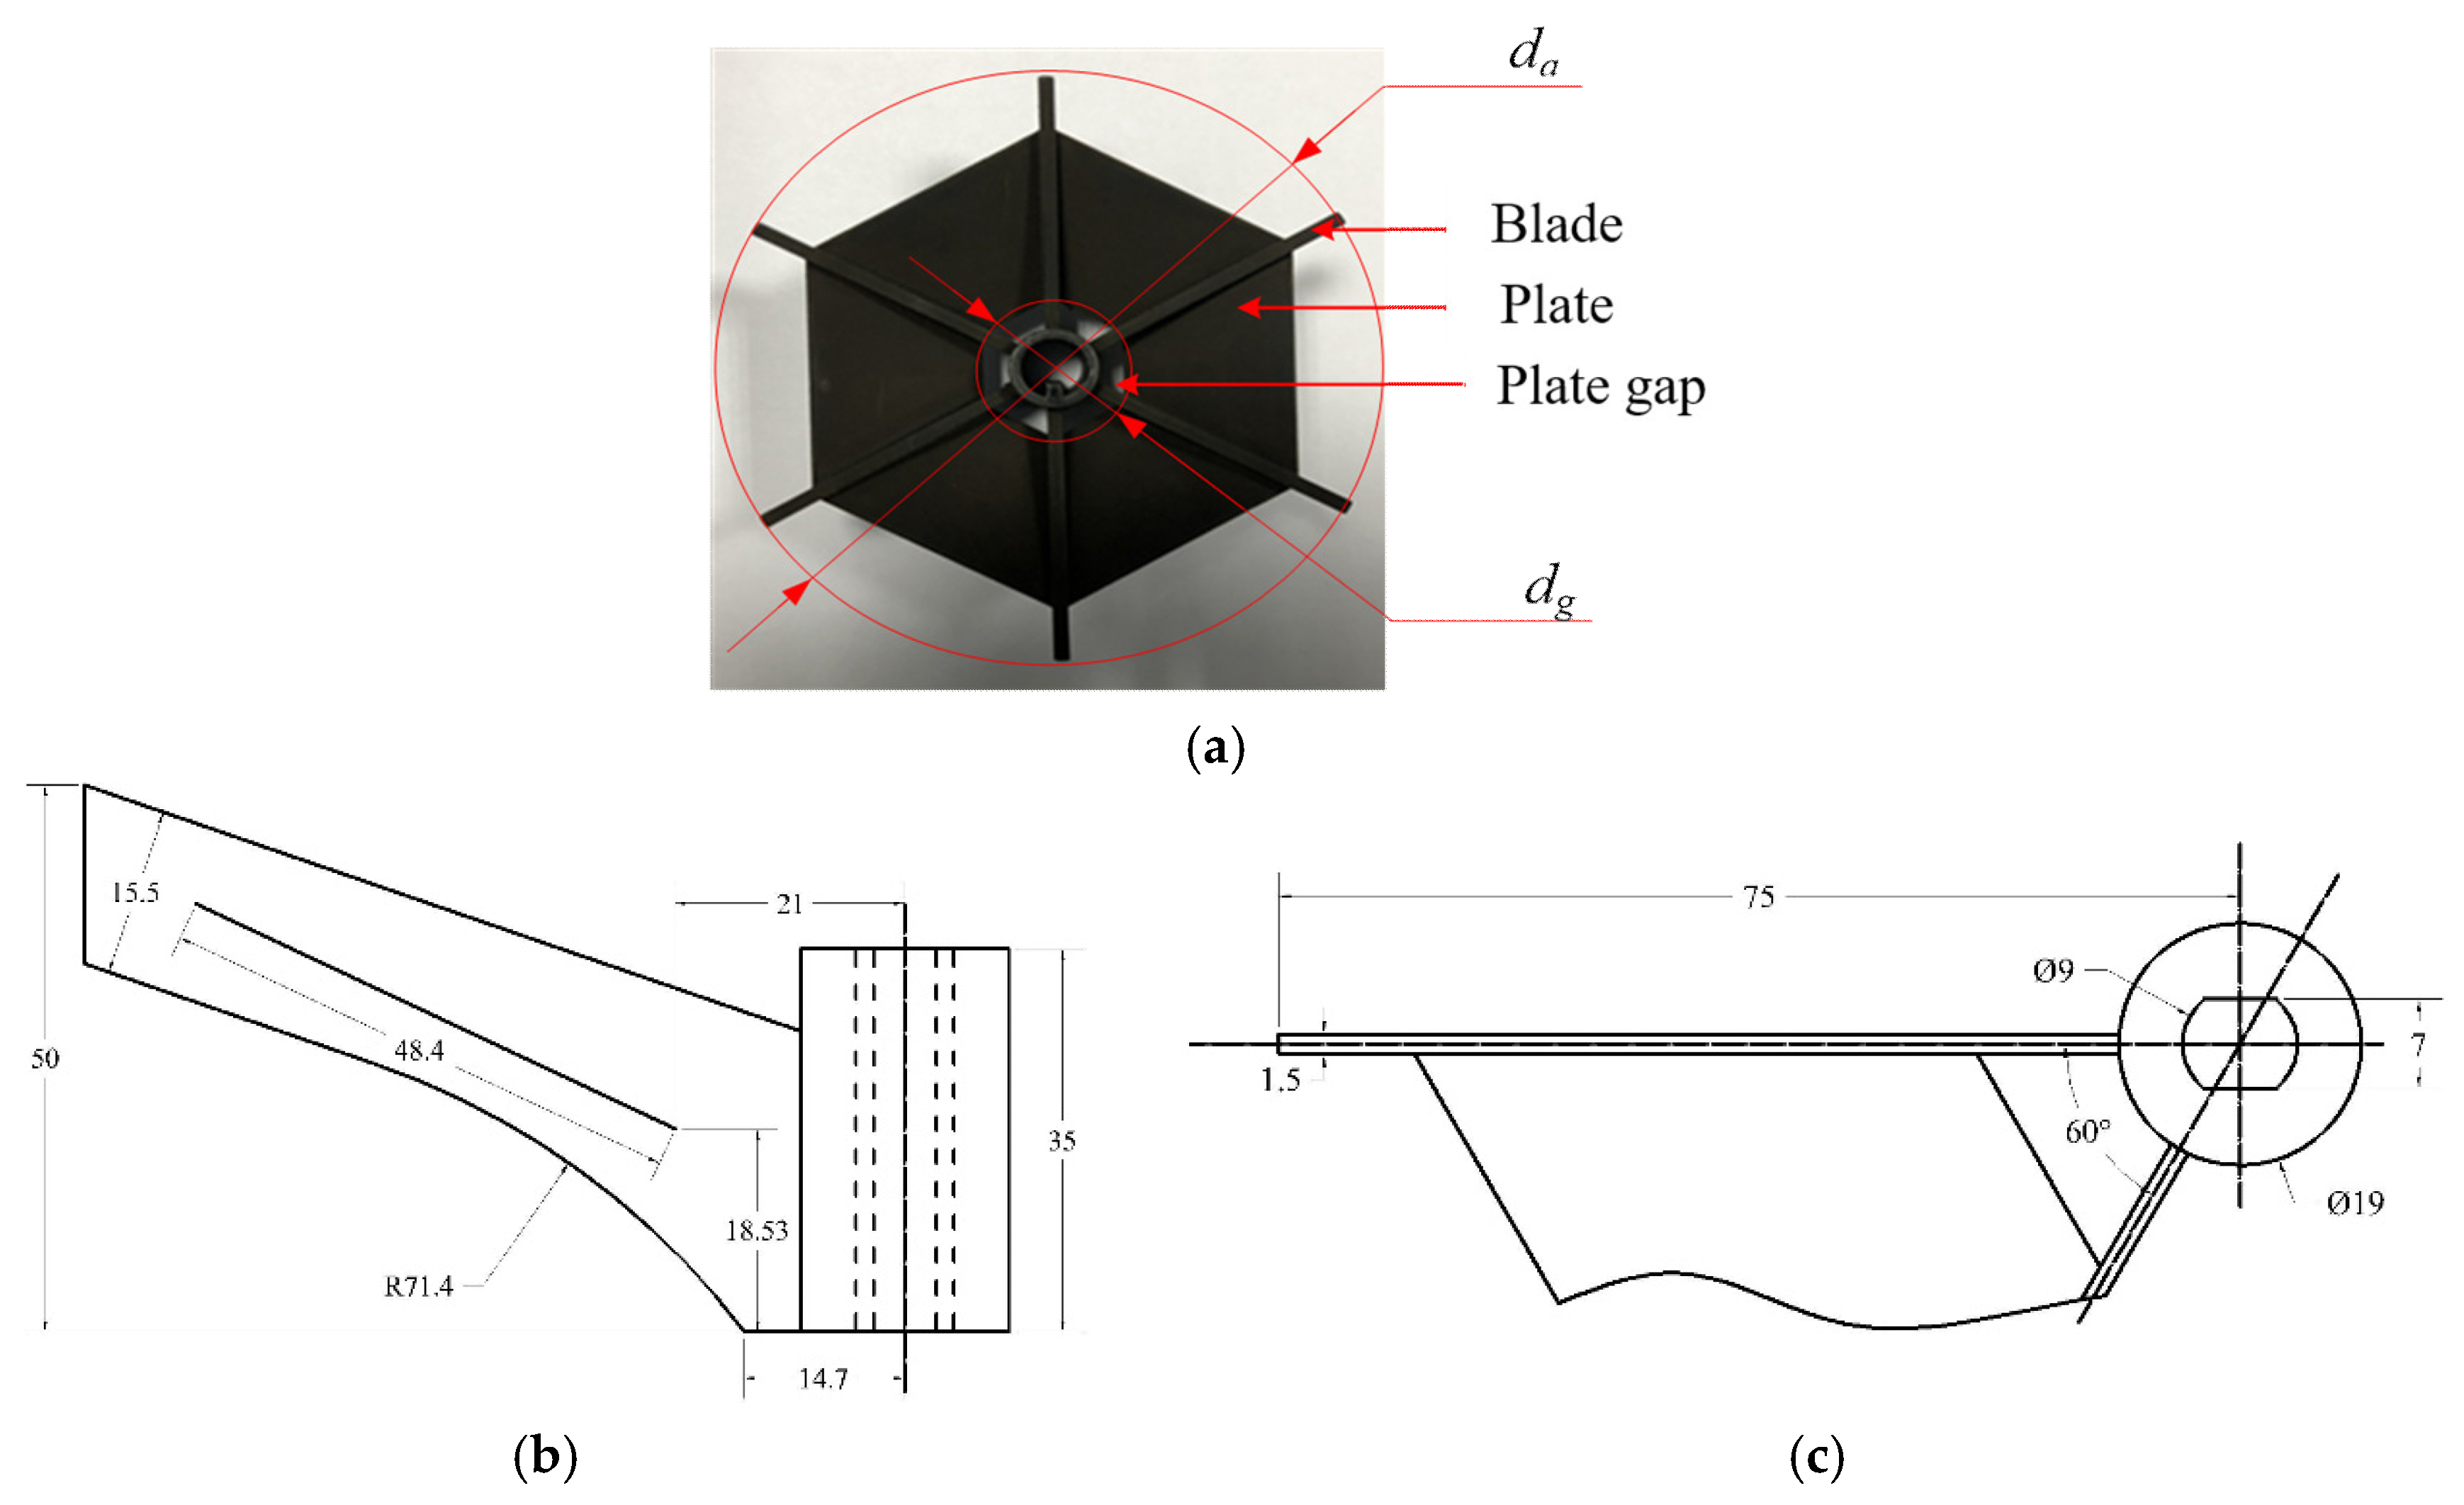
Figure 1. Photo and parameters of the impeller. (a) The photo of the impeller; (b) The side view of the impeller; (c) The top view of the impeller.
Water 12 02809 g001
Figure 2. The schematic diagram of the test system.
Water 12 02809 g002
Figure 3. Diagram of aeration tank.
Water 12 02809 g003
Figure 4. Dissolved oxygen concentration at different immersion depths. (a) +10 mm; (b) +5 mm; (c) 0 mm; (d) −5 mm; (e) −10 mm; (f) −15 mm.
Water 12 02809 g004
Figure 5. ln (Cs − Ct) at different immersion depths. (a) +10 mm; (b) +5 mm; (c) 0 mm; (d) −5 mm; (e) −10 mm; (f) −15 mm.
Water 12 02809 g005aWater 12 02809 g005b
Figure 6. Number of bubbles in different conditions. (a) Number of bubbles in different rotational speeds; (b) Number of bubbles in different immersion depths.
Water 12 02809 g006
Figure 7. Bubble distribution at different rotational speeds. (a) 200 rpm; (b) 225 rpm; (c) 250 rpm; (d) 275 rpm; (e) 300 rpm.
Water 12 02809 g007
Figure 8. Variation of gas holdup.
Water 12 02809 g008
Figure 9. Variation of αg and kLa(20). (a) Variation of αg and kLa(20) under different rotational speeds; (b) Variation of αg and kLa(20) under different immersion depths.
Water 12 02809 g009
Table 1. Detailed description of the portable dissolved oxygen meter.
NameTypeRangePrecisionManufacturer
Portable dissolved oxygen meterJPB-607A0~20 mg/L±0.3 mg/LLei Ci in Shanghai
Table 2. Specific parameters of the camera.
ProjectsTechnical Index
Maximum resolution1024 × 1024
Pixel size/μm14 × 14
Memory/G16
Continuous shooting time/s45
Whole resolution shooting speed/Frames Per Second (fps)4000
Reduced resolution shooting speed/fps256,000
Table 3. Experimental Scheme.
Liquid Level Height H/ mm200 mm
Immersion Depth Hl/ mm+10 mm+5 mm0 mm−5 mm−10 mm−15mm
Rotational Speed n/ rpm100125150175200225250275300
Table 4. Standard oxygen mass transfer coefficient.
Rotational Speed n/(r/min)Standard Oxygen Mass Transfer Coefficient kLa(20)/(min−1)
Hl = +10 mmHl = +5 mmHl = 0 mmHl = −5 mmHl = −10 mmHl = −15 mm
1000.02560.03420.03740.03970.03570.0280
1250.03130.04040.04630.05470.04450.0368
1500.03740.05430.06370.06800.06010.0484
1750.05090.06960.07760.08640.07030.0567
2000.06510.08830.09650.09850.08640.0695
2250.07470.09140.09910.10770.09540.0801
2500.08990.11100.12370.14140.11650.0901
2750.09940.13490.15220.15690.13010.1121
3000.12040.14490.16110.16550.13990.1277