Article

Differential Responses of Food Web Properties to Opposite Assembly Rules and Species Richness

1
State Key Laboratory of Freshwater Ecology and Biotechnology of China, Institute of Hydrobiology, Chinese Academy of Sciences, Wuhan 430000, China
2
Liaoning Key Laboratory of Aquatic Biology, College of Fisheries and Life Science, Dalian Ocean University, Dalian 116000, China
3
Freshwater Aquaculture Collaborative Innovation Center of Hubei Province, Hubei Provincial Engineering Laboratory for Pond Aquaculture, College of Fisheries, Huazhong Agricultural University, Wuhan 430000, China
4
Arctic Research Center, Hokkaido University, Sapporo 001-0021, Japan
5
Global Station for Arctic Research, Global Institution for Collaborative Research and Education, Hokkaido University, Sapporo 001-0021, Japan
6
Graduate School of Environmental Science, Hokkaido University, Sapporo 060-0810, Japan
*
Authors to whom correspondence should be addressed.
Water 2020, 12(10), 2828; https://doi.org/10.3390/w12102828
Submission received: 23 August 2020 / Revised: 22 September 2020 / Accepted: 27 September 2020 / Published: 12 October 2020
(This article belongs to the Section Biodiversity and Functionality of Aquatic Ecosystems)

Abstract

:
Trophic niches condition the energetic performance of species within food webs providing a vital link between food web assembly, species diversity, and functioning of ecosystems. Our understanding of this important link is, however, limited by the lack of empirical tools that can be easily applied to compare entire food webs at regional scales. By comparison, with different a priori synthetic models defined according to specific assembly rules (i.e., purely random, limiting similarity, and niche filtering), we demonstrate that a set of food web properties (trophic richness, evenness, and divergence) are controlled by ecological processes. We further demonstrate that although both limiting similarity and niche filtering are statistically significant assembly processes shaping our studied lake food webs, their relative importance is richness-dependent, and contextual to the specific food web property under consideration. Our results have both important theoretical and practical implications. Theoretically, the observed richness-dependent variation on food web properties contradicts the common criticism on food web theory that food web properties are roughly scale-invariant. Practically, these properties can help avoiding spurious conclusions, while providing useful information for multiple food web niche spaces supporting the ecosystem functioning.

1. Introduction

Our planet is experiencing unprecedented rates of human-induced loss of species and population declines across all major ecosystems with anticipated effects on ecosystem functioning and human well-being: the “anthropocene defaunation” [1]. The impacts of species loss are not only restricted to target populations, but also have wider implications by altering predator–prey ratios within food webs, which can lead to community-wide alterations via cascading community effects [2,3]. Under this scenario, studies of food web assembly and dynamics are of great importance for better understanding the ecology of stressed ecosystems and their potential vulnerability to collapse [4].
Food web assembly, species diversity, and ecosystem functioning are inherently related to each other [5]. Because environmental drivers such as habitat size, productivity, disturbance, and assembly history influence both species diversity and trophic interaction [6,7,8], species richness is generally highly correlated to food web structure across a variety of ecosystems [9,10]. Changes in richness resulting from species turnover and localized extinction are expected to affect the composition of trophic interactions in communities, with important consequences for ecosystem function [11]. However, existing empirical studies have largely focused on assemblages of competing organisms within a single trophic level [12], while those focusing on multi-trophic metacommunities are predominantly restricted to models of simplified webs and trophic motifs [13,14,15]. Therefore, the empirical study of entire food webs in a regional context represents a large gap in our understanding of the relationship between richness and food web properties. In particular, niche filtering and limiting similarity are two of the hypothesis most widely tested in community assembly and functional diversity [16,17,18], yet their relative importance in defining regional patterns in food web structure in natural communities is poorly understood. In limiting similarity theory [19], biotic interaction works through evolution and community assembly to give an increasing differentiation between coexisting species in their niche space. Contrastingly, the niche filtering hypothesis assumes that coexisting species are more similar to one another than would be expected by chance because environmental conditions (i.e., abiotic properties of the habitat) act as a filter allowing only a narrow spectrum of species to survive in their niche space [20].
Here we propose an approach based on the combination of complimentary trophic metrics (i.e., trophic richness, evenness, and divergence) in a multidimensional niche space to investigate the individual and interactive role of these general community assembly hypotheses in explaining the food web structure of fish communities in 165 Chinese flood plain lakes along a distinctive species richness gradient. We specifically tested two general hypotheses: (1) whether changes in food web properties, over and above those due to pure chance, are due to either limiting similarity or niche filtering, or a combination of both assemblage rules; and (2) whether these changes are constant along the existing species richness gradient in these lakes or richness-dependent. Niche filtering should favor species that are adapted to specific niche conditions while limiting similarity should facilitate the development of communities with dissimilar species through competition and niche exclusion. For the particular case of our flood plain lakes, we hypothesize that limiting similarity will be the main driving mechanism given the particular structural and functional characteristics of these subtropical shallow lakes including diverse omnivorous fish species and high diversification of foraging strategies among species adaptation of trophic strategies [21,22,23]. We purposely remain general in scope in order to explore for the first time how general community assembly hypotheses relate to trophic richness, evenness, and divergence of food web niche space.

2. Materials and Methods

2.1. Materials Source

To test these hypotheses, we used 165 fish assemblages in Chinese flood plain lakes and estimated the corresponding trophic niche of each species by combining their trophic position and degree of dependence on benthic resources following Zhang et al. [23]. We then characterized the trophic niche space at the community level using a geometry approach to calculate three complementary food web properties (i.e., richness, evenness, and divergence) from the assemblage trophic niche, defined by the location of all constituent species in trophic niche space. This procedure provides a common framework for trophy-based food web property measurement that allows comparison among multiple assemblages. To test for the effects of different assembly rules on the observed trophic niche patterns, we used a simulation approach where observed values for the three trophic metrics for all lake assemblages where compared against those resulting from simulated communities using three contrasting assemblage scenarios (i.e., completely random, limiting similarity, and niche filtering). Finally, piecewise linear regression was used to identify possible threshold responses in the food web properties along the corresponding species richness gradient for the study lakes.

2.2. Data Acquisition

The 165 study lakes are located in the mid-lower parts of the Yangtze River (28.52–31.71° N 112.28–121.09° E) (Figure 1). Some of their hydrological and morphological features are shown in Table A1. Corresponding fish assemblages were collected by field surveys conducted between 2008 and 2012 (n = 88 lakes). While for the rest of the lakes, fish assemblages were referred to from previous studies. Fish were caught by fish trap, gill net, and trawl net according to the specific methods used in fish surveys for each lake. Each lake was sampled by randomly assigning 4–6 transects for every 20 km2 of lake surface area. Fish were collected by volunteer fishermen as part of routine commercial fishery, which complied with the local fishery regulations. Each lake was sampled during the summer and autumn, and was visited at least twice during our studied period (i.e., a minimum of 4 surveys per lake). This procedure was assumed to control for the intra-annual variation in fish distribution. To ensure consistency among different surveys, abundance data from the surveys was converted into presence-absence data. Abundance data is also likely to be prone to bias introduced by variability in the catchability of fishes by the gears. Further, some species may be efficient pelagic-benthic connectors and not equally available to the same gear. Finally, fluctuations in abundance of individual species may result from changes in fish distributions, differing from year to year due to changes in lake morphology or food hotspot distribution. The validity of fish species of field surveys was checked using recent taxonomical monographs [24,25,26].

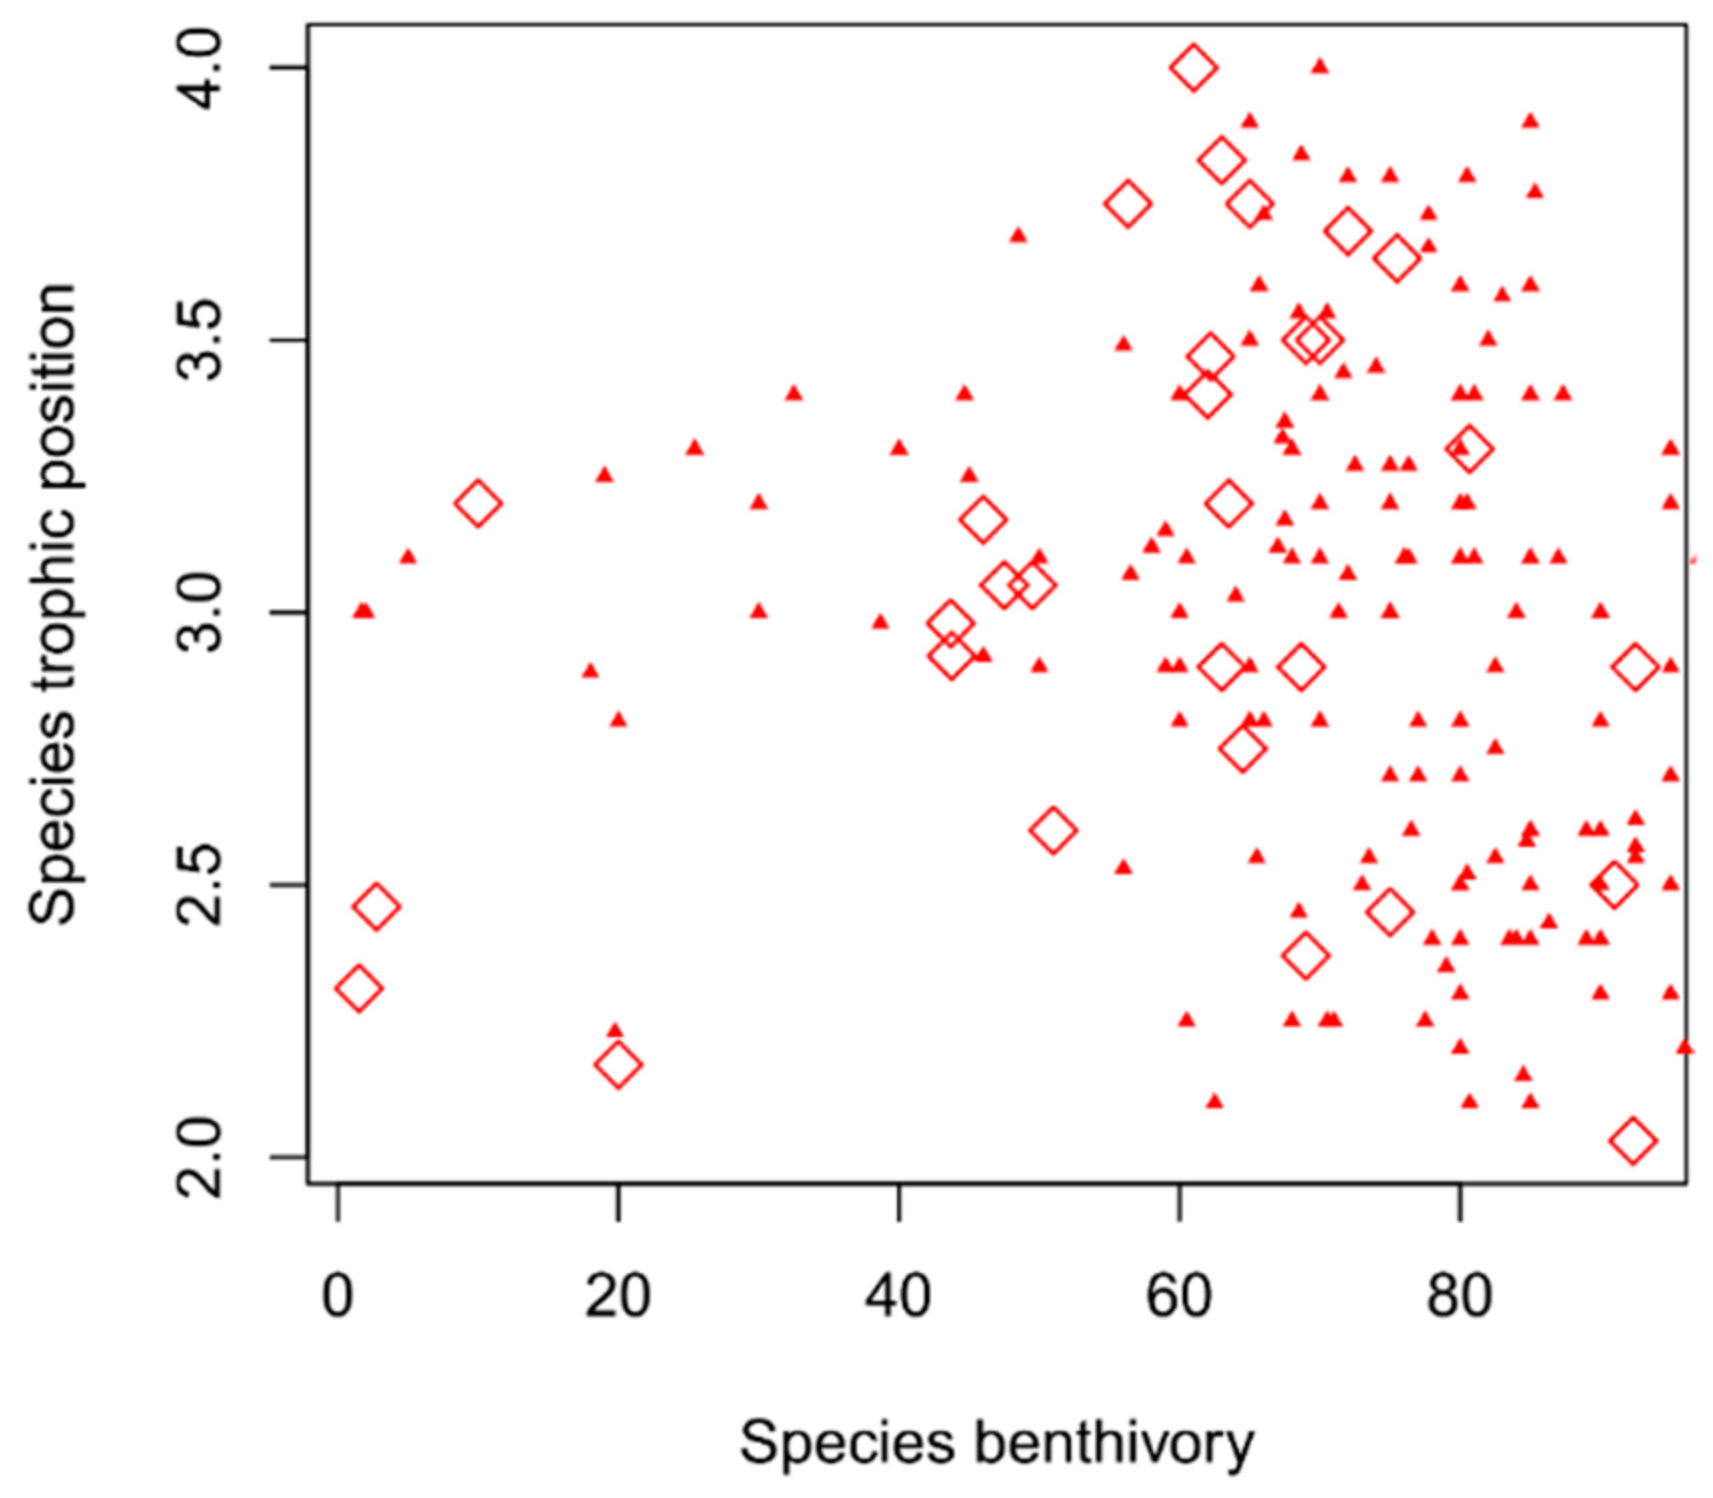
2.3. Niche Determination

Charles Elton defined a species’ niche as the sum of all the interactions (especially trophic) that link the species to other species in an ecosystem [27]. In other words, the niche represents the overall (trophic) role of a specific species [28]. Trophic niche theory thus provides a potential framework for assessing simultaneously the roles that local and regional-scale species dynamics play in generating food web properties [29]. We based our analyses of consumer species in lake ecosystems on a 2-dimensional trophic niche space comprising trophic position (TP) and benthivory (B). TP is a basic metric collected for ecological studies with a wide range of applications. It describes the position of a consumer between primary producers and predators throughout the food web and helps define its role in the energy transfer within an ecosystem. However, TP can be misleading when considered in isolation. For example, a 0.5 difference in TP can reflect a completely different diet, from herbivory to omnivory, and thus different biomass/energy transfer efficiency [30]. In this sense, B complements TP as a synthetic metric of a species’ resource utilization, which provides an indicator for benthic/littoral energy mobilization based on the estimated reliance on littoral benthic resources. For example, a value of 0.5 in B reflects a 50/50 percent energy utilization derived from pelagic and benthic resources [31]. For each species, trophic position and benthivory was estimated based on the mean TP and B values found for multiple specimens previously collected from lakes in the region [23]. Briefly, TP was calculated following the method of Winemiller and Vander Zanden et al. [32,33], and B was calculated through the relative contribution of different primary producers to the diets of consumers by grouping all food sources into benthic and pelagic. Although this procedure provides an estimate for the TP and B of a species, it is acknowledged that there is important intraspecific variation that this particular level of analysis will not account for [21,22].

2.4. Food Web Properties

We use a set of three food web metrics that reflect important complementary properties of trophic niche space and can be used to estimate the extent of trophic richness, redundancy, and specialization at the food web level (see Figure 1 in Villéger et al., 2008 for a schematic of how these metrics are calculated in a geometry) [34]. The trophic richness, redundancy, and specialization are functional diversity for food web research.
(1)
Richness of trophic niche space. This metric is defined by the convex hull volume of an assemblage in trophic niche space where the most extreme species (i.e., vertices) are linked to build the convex hull and calculate the corresponding volume inside. Therefore, by including all species in trophic niche space, it represents a measure of the total amount of niche space occupied, and a proxy for the trophic richness of a food web [34,35,36].
(2)
Evenness of trophic niche space. We measured trophic evenness following the regularity index proposed for the estimation of functional evenness [34,37]. This index measures the regularity of spacing between species in trophic niche space. A value of 1 is achieved when the distances of all nearest neighbor species pairs are identical. Conversely, when a large proportion of species are characterized by similar trophic ecologies (i.e., similar occupancy of the trophic niche space), trophic evenness will exhibit a smaller value, indicative of increased trophic redundancy.
(3)
Divergence of trophic niche space. This represents a measure of the species distance to the center of gravity of the assemblage’s trophic niche space defined by the convex hull, and thus it is a proxy for trophic niche specialization at community level. Trophic divergence is the highest if all the species are on the convex hull and at equal distance to its center of gravity. It has the advantage of being independent from trophic evenness [34]. Specialization has also been outlined as a key concept to predict the adaptive response of populations in heterogeneous or fluctuating environments [38].

2.5. Simulation

Three models provided the null expectation for measures of food web properties in which, for a constant number of species in each assemblage, species identity was chosen from the species pool following different assemblage rules or scenarios. Our first model (random scenario) constructed the random communities assuming that each species had an equal chance of occurring, irrespective of the species role in the food web. These were completely random combinations of the available species pool (comprising 192 species for the 165 assemblages), controlling for the number of species. Our other two models represent non-random loss scenarios where we assumed that community assembly is a process in which species are either removed from the species pool by local extinction due to niche filtering or limiting similarity (i.e., through biotic interactions). Community assemblage under the niche filtering scenario was simulated by randomly fixing an optimum trophic niche value within the range of observed values and then removing the species that the trophic niche position was most distant from the optimum. Where a tie was found between two or more species, the species removed was chosen at random. Finally, the limiting similarity scenario followed assemblage rules based on the complementary in species trophic niche within the food web to indicate the level of trophic interaction. Niche dissimilarities of all species pairs were calculated as measures of Euclidean distance and one of the species from the most similar pair was randomly removed.
For the three scenarios, we calculated each food web metric based on 1000 simulations, controlling for species richness to mimic the existing richness gradient in our study lakes. Inspection of standard deviations confirmed that 1000 iterations were sufficient to achieve simulation convergence. Mean food web properties were then calculated from the simulations and used in the analyses.

2.6. Response Thresholds

Visual inspection of the nonlinear relationship between species richness and the different food web properties strongly suggested the occurrence of a change point or threshold (i.e., a node at which the statistical properties change significantly) [39]. We therefore used piecewise linear regression to identify this threshold by fitting a degree-one spline with one knot point of unknown location [39]. Generation of confidence intervals at the 0.05 significance level was done by generating 1000 bootstraps of the data points. To allow comparison among food web properties, we calculated the standardized effect size (SES) for each metric by standardizing its values by those generated under the random scenario model before implementing the piecewise linear regression models (i.e., the shift base on the random scenario) [40]. Piecewise linear regression was conducted using the R package ‘SiZer’ [41,42].

2.7. Testing for Non-Randomization

If the community is assembled at random, we would expect the SES of observed food web properties under the non-random scenarios (i.e., limiting similarity and niche filtering) to be not significantly different from zero. To test this hypothesis, the possibility of detecting a non-random pattern at the metacommunity level (i.e., a number of local communities) was determined using a one-sided Wilcoxon signed rank test, which examines the shift of SES values from 0 [43]. All statistical analyses were performed using R 2.15.0 (R Development Core Team 2012).

3. Results

A total of 192 species were recorded from the 165 assemblages with a richness of 40 ± 28 (mean ± 1 standard deviation) and a range of 3–112 species spanning a wide range of benthivory and trophic positions (Figure 2).

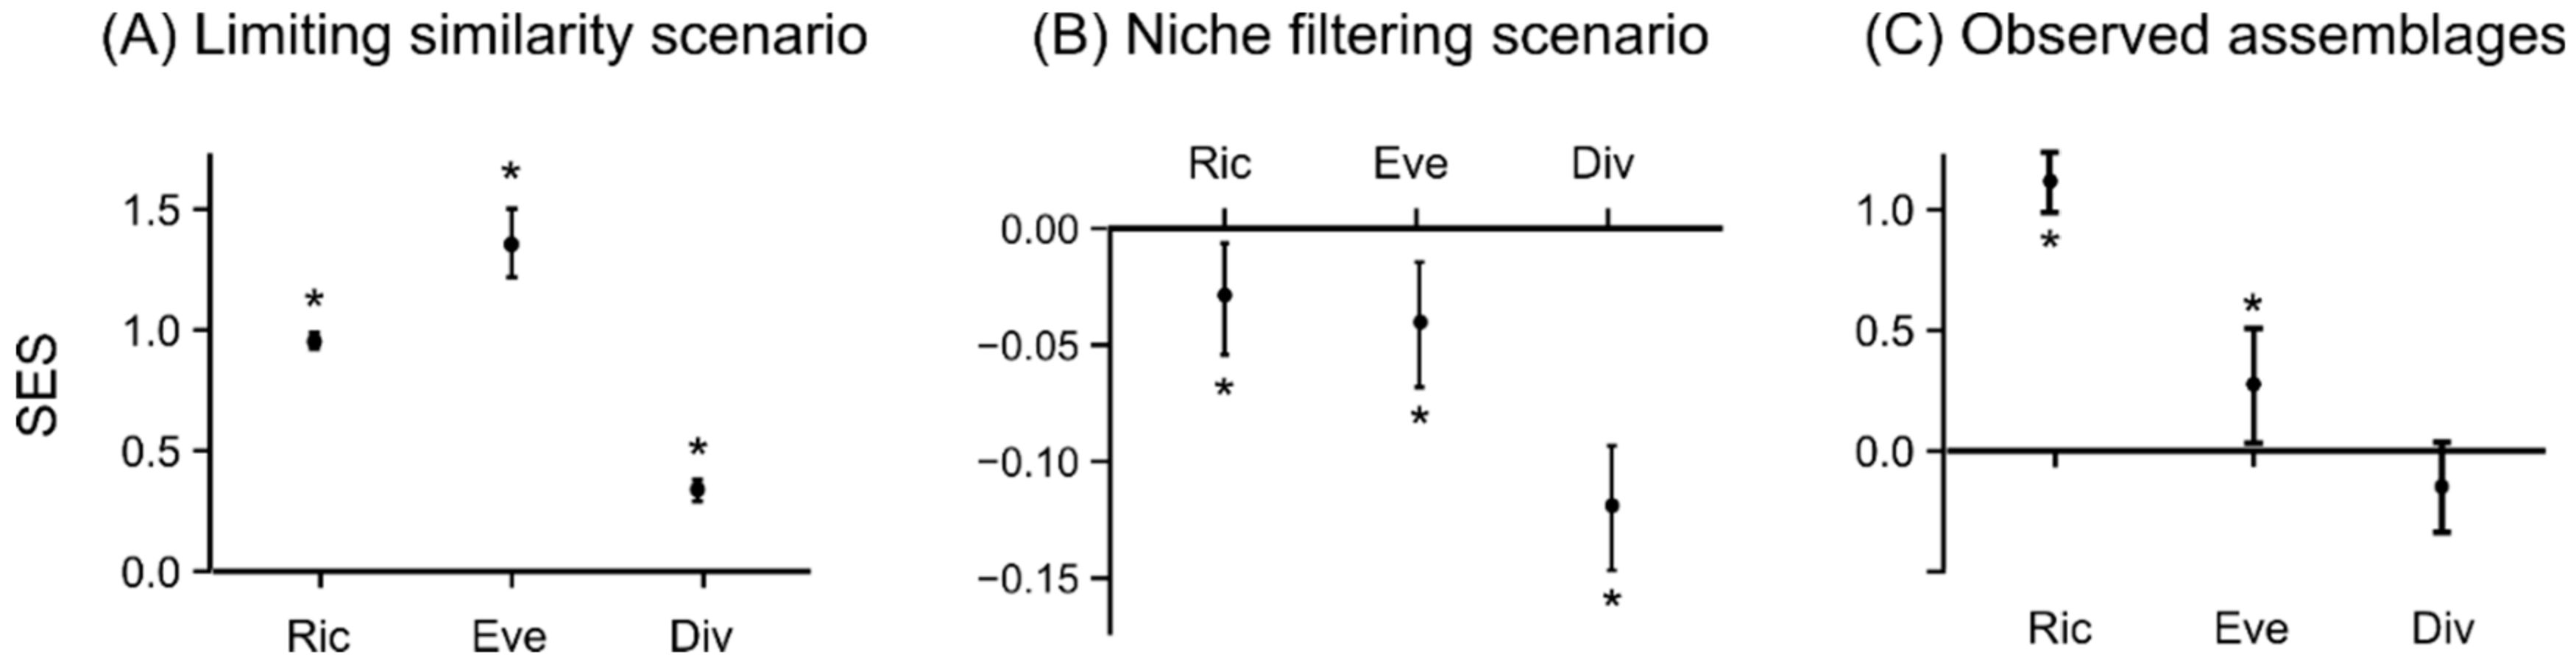
3.1. Assembly Rules in Modelled Scenarios

Changes of food web properties as a function of number of species from assemblages simulated under the random, limiting similarity and niche filtering scenarios showed remarkably similar trends within each individual metric (Figure 3). Both trophic richness and evenness displayed negative asymptotic trends to the loss of species. That is, trophic richness and evenness were relatively insensitive to the loss of species at high species richness until a certain threshold was reached (i.e., asymptote), from which further reductions in species numbers produced a rapid decline of both properties. The asymptote was however reached at much lower species numbers for trophic evenness than richness, suggesting a more resilient behavior of evenness to the loss of species for these communities. On the other hand, the decrease in the number of species produced a positive asymptotic trend on trophic divergence, with the divergence increasing with decreasing species richness. Again, this property was also relatively insensitive to the loss of species.
Following expectations, median SES values of modelled food web properties in the limiting similarity scenario were significantly higher than 0 (i.e., than expected by chance) for all three food web properties (Figure 4A), with trophic evenness showing the largest difference (p < 0.05; a two-tailed Wilcoxon signed-rank test). Contrastingly, median SES values of all food web properties under the niche filtering scenario were significantly lower than those registered for the random loss scenario (Figure 4B), with trophic divergence registering the largest difference. The SES of food web properties for the limiting similarity scenario were nonetheless larger than those registered for the niche filtering scenario.

3.2. Food Web Properties of Lake Fish Assemblages

Observed changes of food web properties as a function of the number of species for the fish assemblages in the study lakes were remarkably similar to those for the simulated random, niche filtering and limiting similarity scenarios (Figure 3). Interestingly, median SES values of fish assemblages were closer to those modelled under the limiting similarity scenario (i.e., positive and significant) for trophic richness and evenness (Figure 4A,C), while trophic divergence was lower, though non-significant, than that expected by chance, resembling the result from the niche filtering scenario (Figure 4B,C).

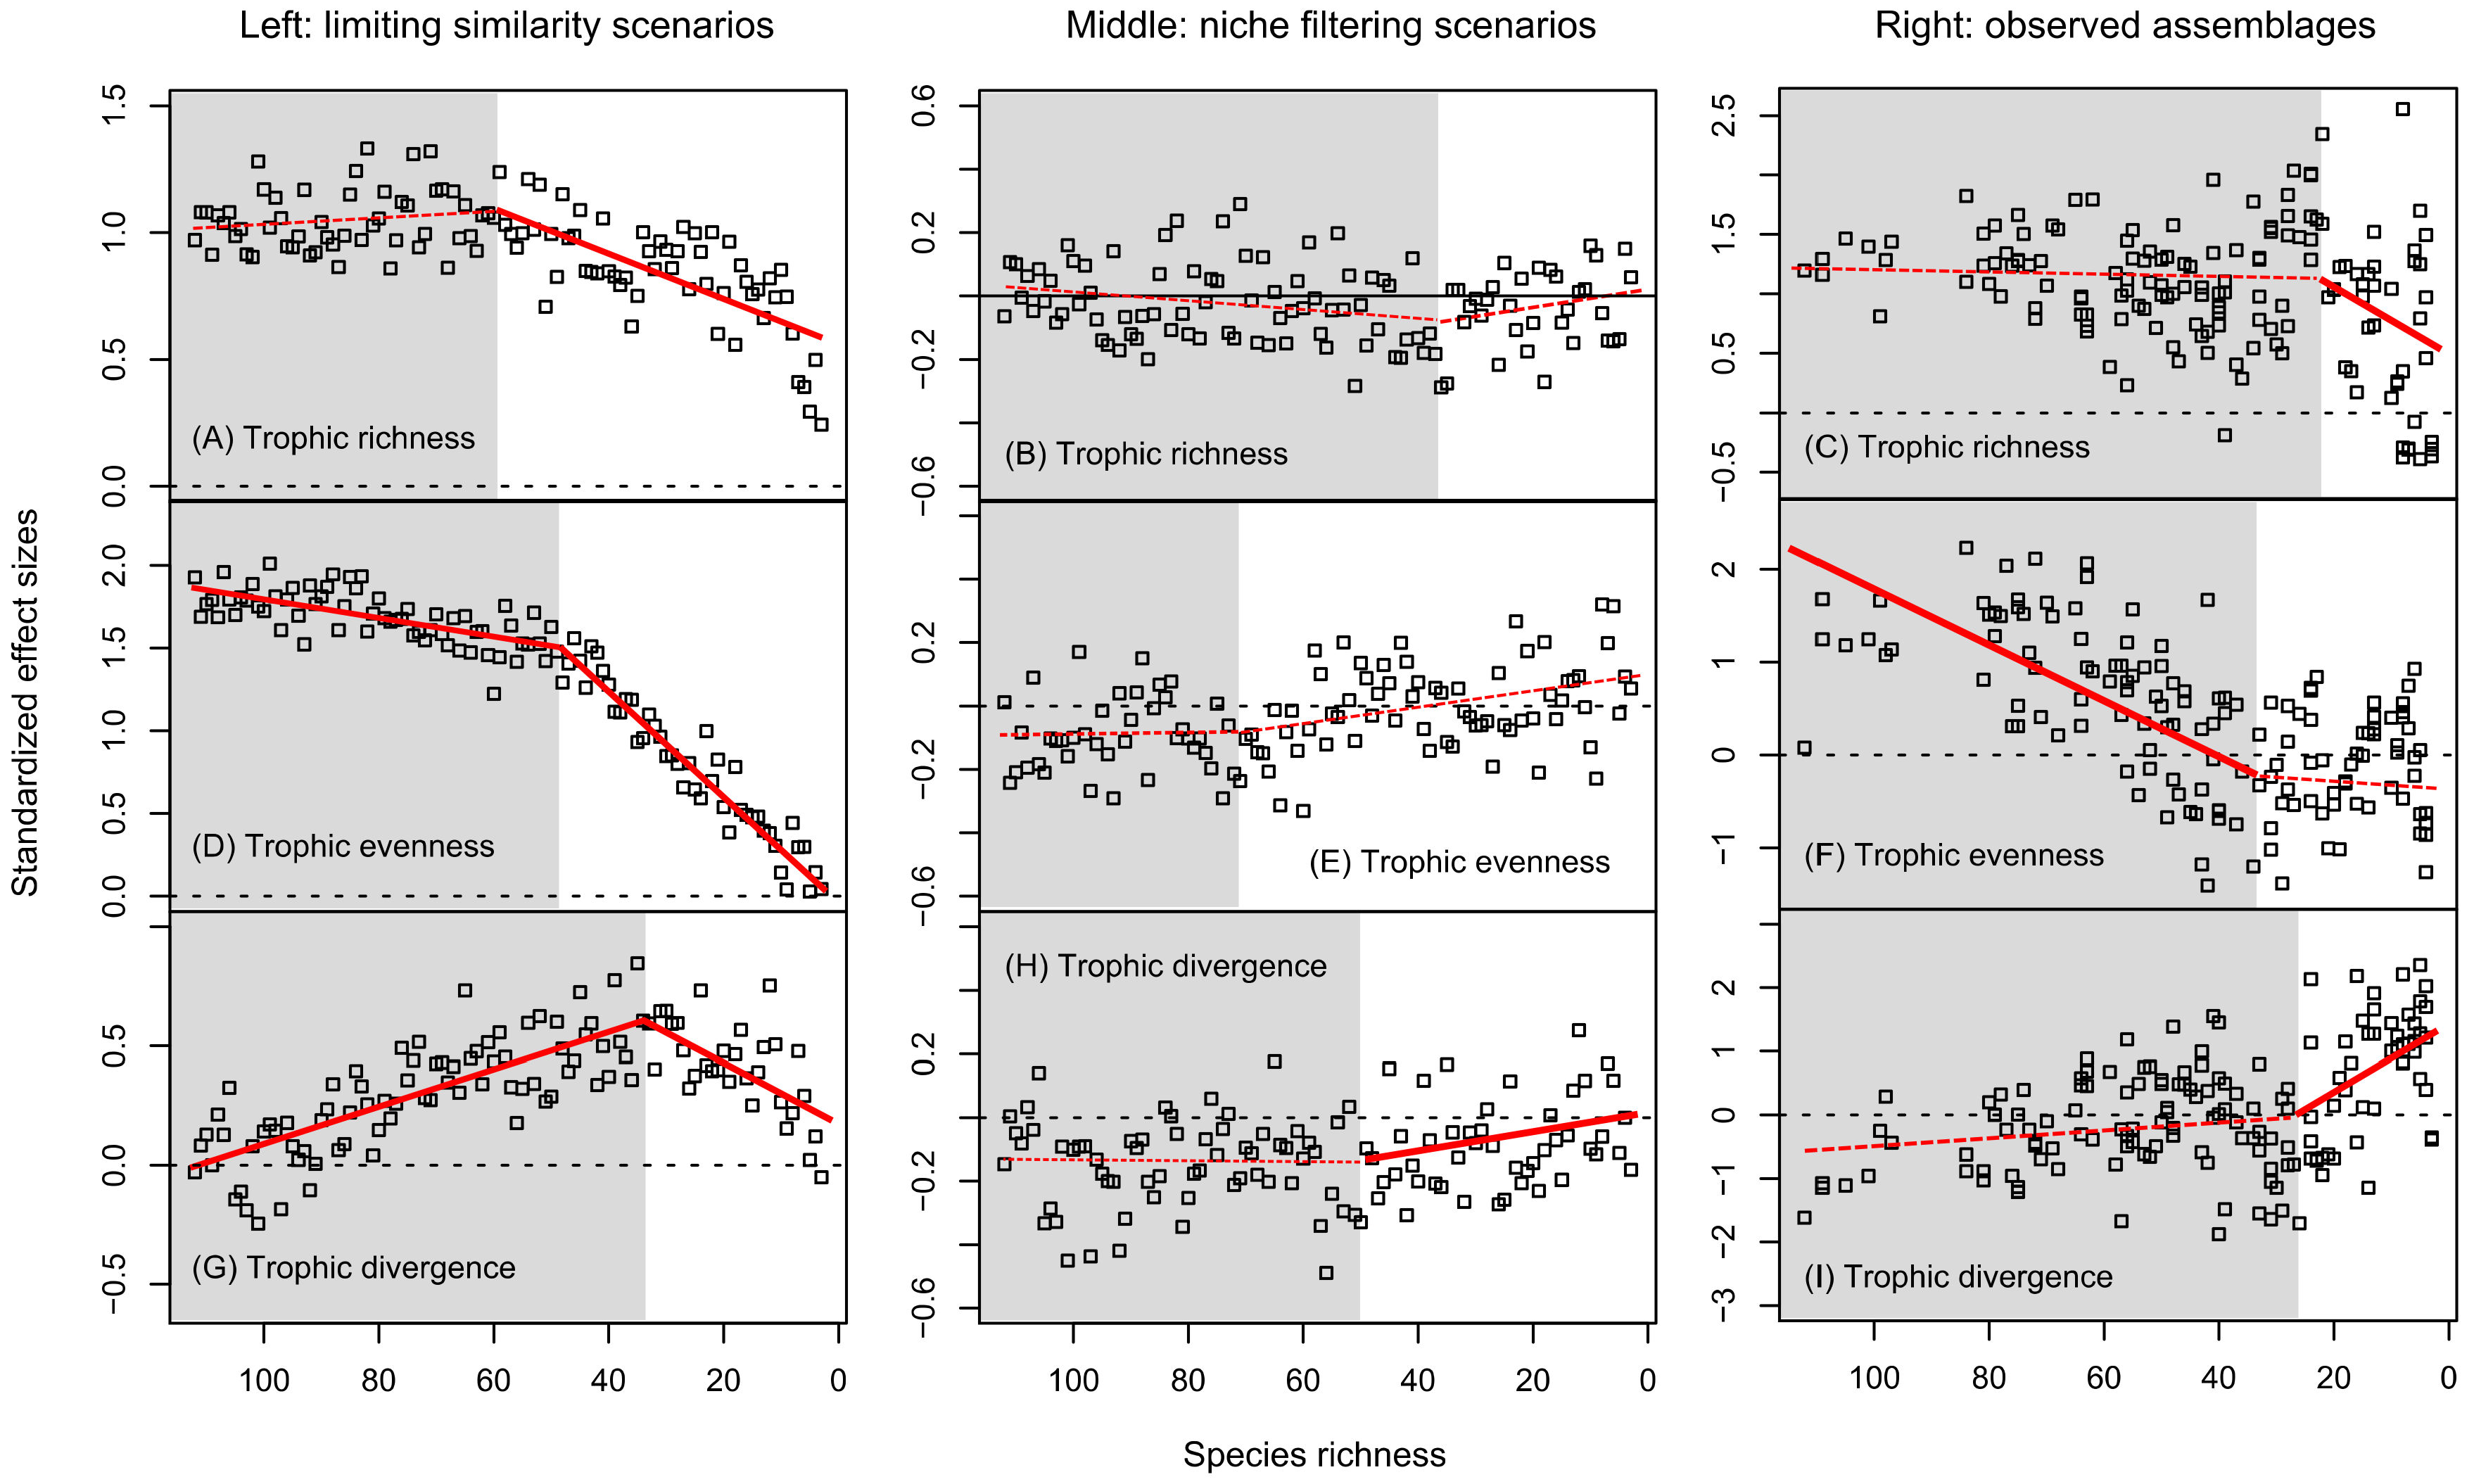
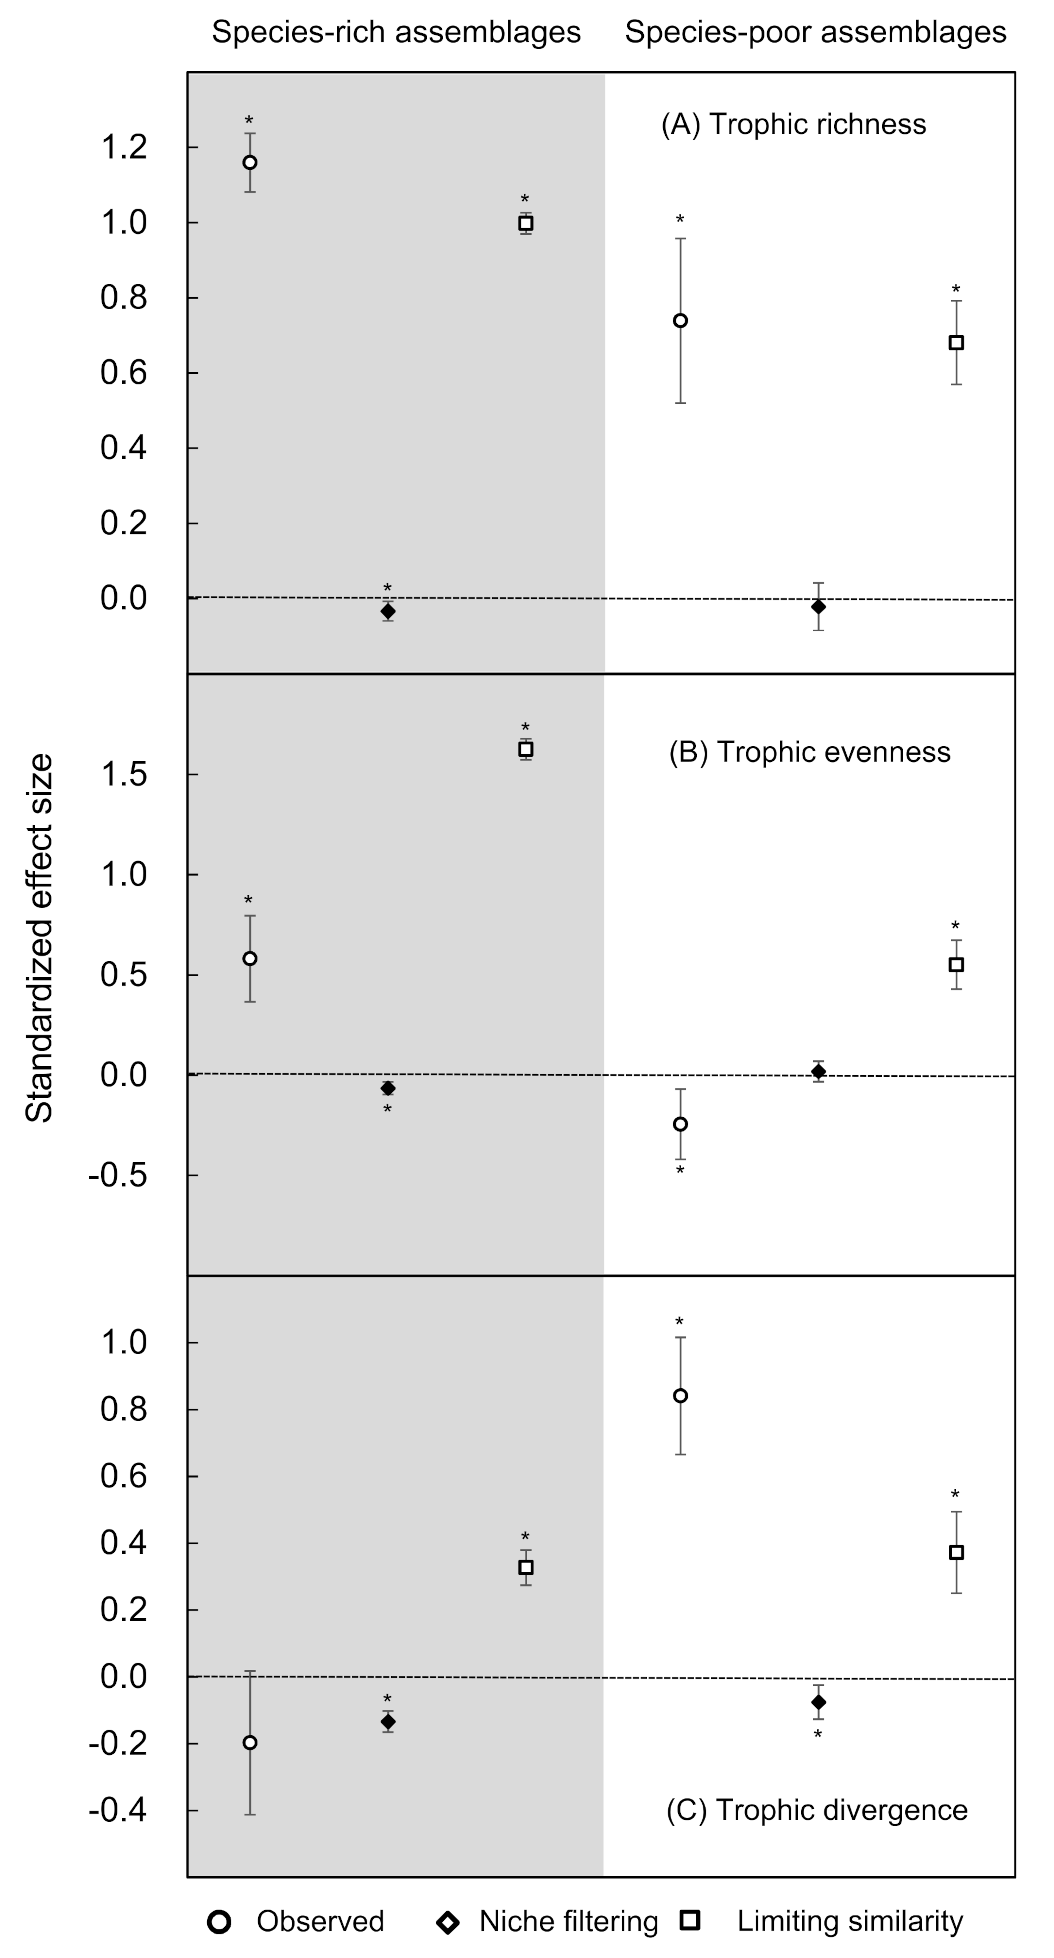
3.3. Differential Response to Variation in Species Richness

Piecewise linear regression suggested different responses of effect sizes for each food web property in modelled and observed assemblages as a function of species richness decrease (Figure 5). For trophic richness (Figure 5A–C), a decrease in the number of species produced a significant decrease in SES at species-poor assemblages (n < 59 species) under the limiting similarity scenario (see Additional Table A2; Figure 5A). The same effect was found for species-poor assemblages (n < 22 species) of observed fish assemblages (Figure 5C). For trophic evenness (Figure 5D-F), the SES decreased significantly with decreasing species richness for both species-rich and species-poor assemblages under the limiting similarity scenario (Figure 5D), though the rate of change in evenness was nearly six-fold higher for species-poor assemblages than species-rich assemblages (Additional Table A2). Observed assemblages showed also a significant decrease in trophic evenness with decreasing species richness, though only for species-rich (n > 33) assemblages (Additional Table A2, Figure 5F). Finally, the SES of trophic divergence under the limiting similarity scenario (Figure 5G) increased significantly with decreasing species richness at the species-rich assemblages (n > 33), but decreased significantly at the species-poor assemblages (Additional Table A2). A significant increase with decreasing species richness was found in species-poor assemblages for both the niche filtering scenario (n < 50) and the observed assemblages (n < 26, Table A2, Figure 5H,I).
Comparison of observed SESs of food web properties between observed and simulated communities for the non-random scenarios (i.e., limiting similarity and niche filtering) offered contrasting results between species-rich and species-poor assemblages (Figure 6). Averaged SESs of observed trophic richness behaved similarly for species-poor and species-rich assemblages (Figure 6A), with observed values significantly higher than either expected by chance or under the niche filtering scenario. Contrastingly, observed SESs for trophic evenness (Figure 6B), were significantly lower than expected by chance for species-poor assemblages but significantly higher for species-rich assemblages. Observed SESs in the species-poor assemblages were significantly lower than averaged SESs for the niche filtering and limiting similarity scenarios, but were in between the two scenarios for species-rich assemblages. For trophic divergence, observed SESs in the species-poor assemblages were significantly higher than SESs of the limiting similarity scenario (Figure 6C), indicating a strong selection for trophic niche specialist species.

4. Discussion

The impact of species loss is generally investigated at the species level, but it is seldom extended to explore community-level changes in food web structure. Our approach provides a framework to assess the role of assembly processes on trophic structure that allows comparison among multiple assemblages. Our results show clearly that both limiting similarity and niche filtering shaped the food web properties of the fish assemblages in our study lakes, with a leading role of limiting similarity on trophic diversity. Further, changes in some food web properties were richness-dependent, showing strong threshold responses between species-poor and species-rich assemblages. The exceptional trophic evenness and divergence in species-poor assemblages highlight the human-induced impacts (i.e., local extinction and aquaculture of selected species) on the local food web properties through eroding total species richness and keeping trophic specialized species in local food webs, which have important implications for management of lake ecosystems during coming decades.

4.1. Assembly Rules and Modelled Scenarios

Understanding food web properties of communities and their determinants is important because different trophic distributions at species identities may imply the operation of different assembly processes [35,44]. Our simulations showed a systematic increase/decrease in the three food web properties under the limiting similarity/niche filtering scenarios, relative to the purely random community-assembly scenario. This was expected given that niche filtering operates through niche convergence by favoring species that are adapted to specific niche conditions (i.e., therefore reduced trophic niche space, higher trophic redundancy, and low niche specialization), whereas limiting similarity promotes niche differentiation through the development of communities with dissimilar species because of niche exclusion and competition, i.e., trophic complementarity [19,20]. Differences in the relative magnitude of the three trophic properties simulated under the two assembly rules pertain to the specific trophic characteristics of the fish assemblages in these floodplain lakes. For example, the largest effect size of trophic evenness under limiting similarity suggests high trophic complementarity among species within an assemblage [37], which reflects the flexibility of consumers in energy acquisition [45,46]. Similarly, the relatively low level of trophic divergence found for the niche filtering scenario could be associated to a high degree of niche convergence for certain species within the fish assemblages; those with less trophic specialization [34]. Despite that niche filtering had an effect on the food web properties, the effect sizes for this scenario were less pronounced, or even negligible, compared to effects imposed by limiting similarity (Figure 4), probably because the species trophic position is intrinsically dispersed in the niche space of the regional species pool (Figure 4). A strong niche filtering effect is typically found in trait-converged and/or grouped assemblages [35]. Thus, niche filtering assembly prevents trophic specialization to enhance the intensified interaction induced by the low trophic richness and evenness compared to purely random communities.

4.2. Influence of Assembly Rules on Food Web Properties of Fish Assemblages

Empirical evidence demonstrates that both niche filtering and limiting similarity act simultaneously to shape lacustrine fish communities at local and regional scales [47]. The question remains, however, as to which mechanism is dominantly structuring these fish communities in floodplain lakes. Comparison with simulated results suggests strongly that the food web of fish assemblages in the lakes of this region are predominantly structured by limiting similarity (Figure 4). The fact that fish assemblages exhibited significantly larger (higher trophic richness) and more even trophic niche space than that expected by chance alone, could be attributed to two possible reasons: (1) in these flood plain lakes, the habitat is benign and heterogeneous, allowing a high number of trophically differentiated fish species to coexist (i.e., high trophic richness) [22,23]; and (2) the prevalence of omnivory in the fish communities of these subtropical lakes, which should result in a more evenly fulfilled trophic niche space (i.e., trophic evenness) [23].

4.3. Response to Variation in Species Richness

Our results confirmed our second hypothesis, that the effects of different assembly processes on food web properties would be richness-dependent. Relative to assemblages simulated under the three scenarios, fish assemblages showed a similar pattern to that of the limiting similarity scenario with relatively high values of trophic richness for species-rich assemblages, indicating a large occupation of trophic niche space in these species-rich communities. Further, the fact that the trend in species-rich assemblages was not significant suggests a higher resistance of these lakes for this property to loss of species richness than predicted from the limiting similarity scenario. Contrastingly, trophic evenness decreased with species loss for the species-rich assemblages, indicating that, although trophic richness and divergence are stable in these communities, a decrease in species number can still generate increased unevenness in trophic niche space, which in turn will decrease the omnivory prevalence and the efficiency of food web function [37].
In the species-poor assemblages, trophic richness decreased and divergence increased significantly as communities were getting poorer in species number, whereas evenness reached a stable but low level. This indicates that the occupation of food web niche space became small, and the weight of niche specialized species became more important. The exceptional trophic evenness and divergence SESs values observed compared to those resulting from the non-random simulations may be attributed to the regional human-induced impacts of species loss and gain on the food web properties operating in these lakes (e.g., fishery and littoral habitat loss). First, fishery selectivity focus on high trophic-level species and the species in trophic groups that are not species rich and highly trophic specialized (e.g., planktivorous species), resulting in the uneven distribution of the community in trophic niche space [48]. The real assemblages in the species-poor regime have then too few species to have any trophic complementary and regular trophic positions. The reintroduction, reinforcement and assisted colonization of trophic specialized species associated with fishery activity (see above) further enhance the trophic irregularity and divergence of local food web niche space in the species-poor assemblages [48]. Second, littoral habitat loss remains a significant threat to fish biodiversity in this region, which is caused mainly by reclamation, segregation by dams and dikes, and pollutant inputs under high intense human activities [48]. A decline in littoral/benthic habitats often follows a loss of benthic-pelagic omnivores and further affect the network of interspecific interactions within assemblages [22].

4.4. Trophy-Based Conservation Implications

The ongoing accelerating rates of extinction, as a result of ecosystem degradation, makes understanding how many species can be lost from a system before ecosystem function loss occurs a challenging but essential task for ecologists. Although our results indicate that a significant reduction in the number of species in species-rich communities does not lead to an appreciable loss in trophic richness, we do not advocate abandoning species-based conservation approaches in these floodplain lakes for several reasons. Firstly, despite the apparent resilience of these lakes to the loss of species under human disturbance suggested by trophic richness, the observed decrease in trophic evenness should reduce the potential for trophic compensation to occur. Further, our results demonstrate that a critical threshold of species richness for trophic evenness was reached, suggesting that communities in the species-poor assemblages below this threshold are operating at low trophic efficiency and their development is not self-sustainable. Given that, within the species-rich assemblages, trophic richness and divergence remained constant, this decrease in trophic evenness can be used as an early-warning indicator for conservation effort. We also suggest that, in the species-poor assemblages, the decrease of trophic divergence might be used to indicate community recovery for the restoration effort.

5. Conclusions

The impact of species loss is generally investigated at the species level, but it is seldom extended to explore community-level changes in food web structure. Our study highlights the challenges of elucidating food web structure for complex, naturally occurring assemblages at a regional scale. However, fairly simple models were able to accurately reproduce several properties of food webs from observed assemblages, including trophic richness, evenness, and divergence, and provide insights into the relative impacts of species richness on local- and regional-scale trophic niche spaces. Significant departure from random expectation might indicate either limiting similarity or niche filtering processes as a potential ecological process shaping the trophic niche space. Variant responses of food web properties to species richness indicate that no one property encapsulates the different facets of trophic niche space simultaneously at a certain species richness range (i.e., food web size). Therefore, the assessment of the trophic niche spaces using these complementary food web properties appears an adequate tool to avoid spurious conclusions, while providing useful information for ecosystem conservation and management.

Author Contributions

Conceptualization, M.Z. and J.X.; methodology, J.G.M. and J.X.; formal analysis, Y.G., T.W., H.Z., and P.Z.; resources, Y.G., T.W., H.Z., P.Z., and J.X.; writing—original draft preparation, Y.G., J.X., J.G.M., and M.Z.; writing—review and editing, Y.G., J.X., J.G.M., and M.Z.; supervision, M.Z., and J.X. All authors have read and agreed to the published version of the manuscript.

Funding

This research was supported by the National Key R&D Program of China (Grant No. 2018YFD0900904), the International Cooperation Project of the Chinese Academy of Sciences (Grant No. 152342KYSB20190025), the National Natural Science Foundations of China (Grant No. 31872687), and the Water Pollution Control and Management Project of China (Grant No. 2018ZX07208005).

Acknowledgments

For data compiling and sampling we wish to thank Yingying Chen and Yi Yang at the Huazhong aquaculture Univ., and Xiaohu Huang at Hubei Univ. We also thank local volunteer fishermen, who provided invaluable help in sampling and food supply.

Conflicts of Interest

The authors declare no conflict of interest. The funders had no role in the design of the study; in the collection, analyses, or interpretation of data; in the writing of the manuscript, or in the decision to publish the results.

Appendix A

Table A1. The hydrological and morphological features of the studied lakes.
Physicochemical ParametersMeanMaxMinStddevMedian
surface area (km2)190.372 2933.00010.200470.02345.000
pH8.341 10.0106.8910.4768.323
DO (mg/L)9.473 40.0800.5402.2849.300
Chla (µg/L)10.462 224.1890.91113.7036.592
TP (mg/L)0.106 4.9960.0100.2690.070
TN (mg/L)1.672 6.8660.2111.2321.264
NOx-N (mg/L)0.622 4.1230.0000.8960.284
NO2-N (mg/L)0.017 0.3420.0000.0360.002
NH4-N (mg/L)0.249 2.6850.0030.3530.143
PO4-P (µg/L)16.917 628.4800.30746.7483.973
CODMn (mg/L)5.436 20.9121.6841.9345.333
Table A2. Significance, i.e., the positive or negative changes are significant.
ScenarioFood Web PropertiesSpecies Richness Changepoint (CI 95%)Species-Poor Slope (CI 95%)Species-Rich Slope (CI 95%)
Limiting similarity Trophic richness59.0 (10.2–74.0)0.0088 (0.0062–0.0872)−0.0013 (−0.0046–0.0030)
Trophic evenness48.6 (44.0–52.8)0.0312 (0.0287–0.0347)0.0056 (0.0039–0.0074)
Trophic divergence33.1 (17.3–52.0)0.0135 (0.0036–0.0446)−0.0214 (−0.0106–−0.0061)
Niche filtering Trophic richness36.0 (14.2–90.0)−0.0025 (−0.0161–0.0018)0.0014 (−0.0013–0.0038)
Trophic evenness71.0 (14.2–90.1)−0.0024 (−0.0047–0.0010)−0.0003 (−0.0035–0.0022)
Trophic divergence50.0 (19.0–103.5)−0.0030 (−0.0174–−0.0005)0.0003 (−0.0025–0.0274)
Observed assemblagesTrophic richness22.0 (8.0–96.4)0.0308 (0.0008–0.1801)0.0005 (−0.0187–0.0087)
Trophic evenness33.0 (31.0–108.2)0.0044 (−0.0099–0.0283)0.0305 (0.0003–0.0412)
Trophic divergence26.0 (20.7–99.0)−0.0553 (−0.0864–−0.0144)−0.0059 (−0.0722–0.0003)

References

  1. Dirzo, R.; Young, H.S.; Galetti, M.; Ceballos, G.; Isaac, N.J.B.; Collen, B. Defaunation in the Anthropocene. Science 2014, 345, 401–406. [Google Scholar] [CrossRef] [PubMed]
  2. Martins, G.M.; Arenas, F.; Neto, A.I.; Jenkins, S.R. Effects of Fishing and Regional Species Pool on the Functional Diversity of Fish Communities. PLoS ONE 2012, 7, e44297. [Google Scholar] [CrossRef] [PubMed] [Green Version]
  3. Myers, R.A.; Worm, B. Rapid worldwide depletion of predatory fish communities. Nature 2003, 423, 280–283. [Google Scholar] [CrossRef] [PubMed]
  4. May, R.M. Food-web assembly and collapse: Mathematical models and implications for conservation. Philos. Trans. R. Soc. B Biol. Sci. 2009, 364, 1643–1646. [Google Scholar] [CrossRef]
  5. Duffy, E.J.; Cardinale, B.J.; France, K.E.; McIntyre, P.B.; Thébault, E.; Loreau, M. The functional role of biodiversity in ecosystems: Incorporating trophic complexity. Ecol. Lett. 2007, 10, 522–538. [Google Scholar] [CrossRef] [Green Version]
  6. Holt, R.D.; Lawton, J.H.; Polis, G.A.; Martinez, N.D. Trophic Rank and the Species-Area Relationship. Ecology 1999, 80, 1495. [Google Scholar] [CrossRef] [Green Version]
  7. Post, D.M.; Takimoto, G. Proximate structural mechanisms for variation in food-chain length. Oikos 2007, 116, 775–782. [Google Scholar] [CrossRef]
  8. Shmida, A.; Wilson, M.V. Biological Determinants of Species Diversity. J. Biogeogr. 1985, 12, 1. [Google Scholar] [CrossRef]
  9. Paine, R.T. Food Web Complexity and Species Diversity. Am. Nat. 1966, 100, 65–75. [Google Scholar] [CrossRef]
  10. Riede, J.O.; Rall, B.C.; Banasek-Richter, C.; Navarrete, S.A.; Wieters, E.A.; Emmerson, M.C.; Jacob, U.; Brose, U. Scaling of Food-Web Properties with Diversity and Complexity Across Ecosystems. In Resilience in Complex Socio-Ecological Systems; Elsevier B.V.: Amsterdam, The Netherlands, 2010; Volume 42. [Google Scholar]
  11. Estes, J.A.; Terborgh, J.; Brashares, J.S.; Power, M.E.; Berger, J.; Bond, W.J.; Carpenter, S.R.; Essington, T.E.; Holt, R.D.; Jackson, J.B.C.; et al. Trophic Downgrading of Planet Earth. Science 2011, 333, 301–306. [Google Scholar] [CrossRef] [Green Version]
  12. Logue, J.B.; Mouquet, N.; Peter, H.; Hillebrand, H. Empirical approaches to metacommunities: A review and comparison with theory. Trends Ecol. Evol. 2011, 26, 482–491. [Google Scholar] [CrossRef] [PubMed]
  13. Calcagno, V.; Massol, F.; Mouquet, N.; Jarne, P.; David, P. Constraints on Food Chain Length Arising from Regional Metacommunity Dynamics. Available online: https://royalsocietypublishing.org/doi/full/10.1098/rspb.2011.0112 (accessed on 18 September 2020).
  14. Calcagno, V.; Mouquet, N.; Jarne, P.; David, P. Coexistence in a metacommunity: The competition–colonization trade-off is not dead. Ecol. Lett. 2006, 9, 897–907. [Google Scholar] [CrossRef] [PubMed]
  15. Holt, R.D.; Hoopes, M.E. Food Web Dynamics in a Metacommunity Context-Modules and Beyond. In Metacommunities: Spatial Dynamics and Ecological Communities; University of Chicago Press: Chicago, IL, USA, 2005. [Google Scholar]
  16. Hubbell, S.P. Neutral theory and the evolution of ecological equivalence. Ecology 2006, 87, 1387–1398. [Google Scholar] [CrossRef] [Green Version]
  17. Kembel, S.W. Disentangling niche and neutral influences on community assembly: Assessing the performance of community phylogenetic structure tests. Ecol. Lett. 2009, 12, 949–960. [Google Scholar] [CrossRef] [PubMed]
  18. Weiher, E.; Keddy, P.A. Assembly rules, null models, and trait dispersion—New questions front old patterns. Oikos 1995, 74, 159–164. [Google Scholar] [CrossRef] [Green Version]
  19. MacArthur, R.; Levins, R. The Limiting Similarity, Convergence, and Divergence of Coexisting Species. Am. Nat. 1967, 101, 377–385. [Google Scholar] [CrossRef]
  20. Zobel, M. The relative role of species pools in determining plant species richness. An alternative explanation of species coexistence? Trends Ecol. Evol. 1997, 12, 266–269. [Google Scholar] [CrossRef]
  21. Xu, J.; Wen, Z.; Gong, Z.; Zhang, M.; Xie, P.; Hansson, L.-A. Seasonal Trophic Niche Shift and Cascading Effect of a Generalist Predator Fish. PLoS ONE 2012, 7, e49691. [Google Scholar] [CrossRef] [Green Version]
  22. Xu, J.; Wen, Z.; Ke, Z.; Zhang, M.; Zhang, M.; Guo, N.; Hansson, L.-A.; Xie, P. Contrasting energy pathways at the community level as a consequence of regime shifts. Oecologia 2014, 175, 231–241. [Google Scholar] [CrossRef] [Green Version]
  23. Zhang, H.; Wu, G.; Zhang, P.; Xu, J. Trophic fingerprint of fish communities in subtropical floodplain lakes. Ecol. Freshw. Fish 2013, 22, 246–256. [Google Scholar] [CrossRef]
  24. Chen, Y. Fauna Sinica, Osteichthyes, Cypriniformes II; Science Press: Beijing, China, 1998. [Google Scholar]
  25. Chu, X.; Zheng, B.; Dai, D. Fauna Sinica, Osteichthyes, Siluriformes; Science Press: Beijing, China, 1999. [Google Scholar]
  26. Yue, P. Fauna Sinica. Osteichthyes Cypriniformes III; Science Press: Beijing, China, 2000. [Google Scholar]
  27. Elton, C. The Journal of Animal Ecology. J. Ecol. 1947, 35, 266. [Google Scholar] [CrossRef]
  28. Leibold, M.A. The Niche Concept Revisited: Mechanistic Models and Community Context. Ecology 1995, 76, 1371–1382. [Google Scholar] [CrossRef]
  29. Leibold, M.A.; Holyoak, M.; Mouquet, N.; Amarasekare, P.; Chase, J.M.; Hoopes, M.F.; Holt, R.D.; Shurin, J.B.; Law, R.; Tilman, D.; et al. The metacommunity concept: A framework for multi-scale community ecology. Ecol. Lett. 2004, 7, 601–613. [Google Scholar] [CrossRef]
  30. Bonhommeau, S.; Dubroca, L.; Le Pape, O.; Barde, J.; Kaplan, D.M.; Chassot, E.; Nieblas, A.E. Eating up the world’s food web and the human trophic level. Proc. Natl. Acad. Sci. USA 2013, 110, 20617–20620. [Google Scholar] [CrossRef] [PubMed] [Green Version]
  31. Vander Zanden, M.J.; Vadeboncoeur, Y. Fishes as integrators of benthic and pelagic food webs in lakes. Ecology 2002, 83, 2152–2161. [Google Scholar] [CrossRef]
  32. Vander Zanden, M.J.; Cabana, G.; Rasmussen, J.B. Comparing trophic position of freshwater fish calculated using stable nitrogen isotope ratios (delta N-15) and literature dietary data. Can. J. Fish. Aquat.Sci. 1997, 54, 1142–1158. [Google Scholar] [CrossRef]
  33. Winemiller, K.O. Spatial and Temporal Variation in Tropical Fish Trophic Networks. Ecol. Monogr. 1990, 60, 331–367. [Google Scholar] [CrossRef]
  34. Villéger, S.; Mason, N.W.H.; Mouillot, D. New Multidimensional Functional Diversity Indices for a Multifaceted Framework In Functional Ecology. Ecology 2008, 89, 2290–2301. [Google Scholar] [CrossRef] [Green Version]
  35. Cornwell, W.K.; Schwilk, D.W.; Ackerly, D. A trait-based test for habitat filtering: Convex hull volume. Ecology 2006, 87, 1465–1471. [Google Scholar] [CrossRef]
  36. Layman, C.A.; Arrington, D.A.; Montana, C.G.; Post, D.M. Can stable isotope ratios provide for community-wide measures of trophic structure? Ecology 2007, 88, 42–48. [Google Scholar] [CrossRef]
  37. Mouillot, D.; Mason, W.H.N.; Dumay, O.; Wilson, J.B. Functional regularity: A neglected aspect of functional diversity. Oecologia 2004, 142, 353–359. [Google Scholar] [CrossRef] [PubMed]
  38. Levins, R. Evolution in Changing Environments: Some Theorethical Explorations; Princeton University Press: Princeton, NJ, USA, 1968. [Google Scholar]
  39. Toms, J.D.; Lesperance, M.L. Piecewise regression: A tool for identifying ecological thresholds. Ecology 2003, 84, 2034–2041. [Google Scholar] [CrossRef]
  40. Gotelli, N.J.; McCabe, D.J. Species co-occurrence: A meta-analysis of J. M. Diamond’s assembly rules model. Ecology 2002, 83, 2091–2096. [Google Scholar] [CrossRef]
  41. SiZer: Significant Zero Crossings. R Package Version 0.1-4. Available online: http://CRANR-projectorg/package=SiZer (accessed on 18 September 2020).
  42. Sonderegger, D.L.; Wang, H.; Clements, W.H.; Noon, B.R. Using SiZer to detect thresholds in ecological data. Front. Ecol. Environ. 2009, 7, 190–195. [Google Scholar] [CrossRef]
  43. Kraft, N.J.B.; Ackerly, D.D. Functional trait and phylogenetic tests of community assembly across spatial scales in an Amazonian forest. Ecol. Monogr. 2010, 80, 401–422. [Google Scholar] [CrossRef]
  44. Post, W.; Pimm, S. Community assembly and food web stability. Math. Biosci. 1983, 64, 169–192. [Google Scholar] [CrossRef]
  45. Pimm, S.L.; Lawton, J.H. On feeding on more than one trophic level. Nature 1978, 275, 542–544. [Google Scholar] [CrossRef]
  46. Yodzis, P. How Rare is Omnivory? Ecology 1984, 65, 321–323. [Google Scholar] [CrossRef]
  47. Mouillot, D.; Dumay, O.; Tomasini, J.A. Limiting similarity, niche filtering and functional diversity in coastal lagoon fish communities. Estuarine Coast. Shelf Sci. 2007, 71, 443–456. [Google Scholar] [CrossRef]
  48. Zhong, Y.G.; Power, G. Fisheries in China: Progress, problems, and prospects. Can. J. Fish. Aquat. Sci. 1997, 54, 224–238. [Google Scholar] [CrossRef]
Figure 1. Map showing the study floodplain lake locations (black circles) in the middle and lower reaches of the Yangzi River, China.
Water 12 02828 g001
Figure 2. Species benthivory and trophic position of the 192 species in the trophic niche space comprising the species pool for the floodplain lakes. The 30 dominant species, present in half of the total 165 assemblages, are represented by open diamonds.
Water 12 02828 g002
Figure 3. Simulated and observed food web properties as a function of species loss. The lines and shaded areas are the means and standard deviations of food web properties for the random, limiting similarity, and niche filtering scenarios. Squares correspond to the observed assemblages. The food web properties are arranged from top to bottom rows with trophic richness, evenness, and divergence. Note the species richness on X axis is arranged from large to small.
Water 12 02828 g003
Figure 4. Differences in SESs (standardized error sizes) of food web properties. (A) Limiting similarity scenario; (B) niche filtering scenario; and (C) observed assemblages. Ric, Eve, and Div represent trophic richness, evenness, and divergence, respectively. Error bars represent the 95% confidence intervals. Asterisks indicate that the difference in SESs was significantly different from zero (p < 0.05; a two-tailed Wilcoxon signed-rank test).
Water 12 02828 g004
Figure 5. Standardized effect sizes of food web properties as a function of species loss. From left to right, subfigure (A,D,G) represents limiting similarity scenario, subfigure (B,E,H) corresponds niche filtering scenario, and subfigure (C,F,I) represents observed assemblages, respectively. The food web properties are arranged from top to bottom rows with trophic richness (A,B,C), trophic evenness (D,E,F), and trophic divergence (G,H,I). The relationships were fitted by piecewise linear regression (see Methods), and the solid thick lines represent the regression lines with significant slopes, while the dashed thinner line the non-significant ones. The location of the changing point (see the corresponding number of species in Table A2) is used to divide the response of food web properties into the species-rich (shaded) and species-poor (unshaded) assemblages. Horizontal dashed lines show zero effect size. Note the species richness on X axis is arranged from large to small.
Water 12 02828 g005
Figure 6. Standardized effect sizes of observed and simulated (niche filtering and limiting similarity) assemblages under low and high species richness (i.e., species-poor and species-rich regimes). (A) Trophic richness, (B) trophic evenness, and (C) trophic divergence. Error bars are 95% confidence intervals. Asterisks indicate that the difference in SESs was significantly different from zero (p < 0.05; a two-tailed Wilcoxon signed-rank test).
Water 12 02828 g006

