Article

AIN-Based MEMS (Micro-Electro-Mechanical System) Hydrophone Sensors for IoT Water Leakage Detection System

*
Author to whom correspondence should be addressed.
Water 2020, 12(11), 2966; https://doi.org/10.3390/w12112966
Submission received: 24 August 2020 / Revised: 5 October 2020 / Accepted: 12 October 2020 / Published: 22 October 2020
(This article belongs to the Section Hydraulics and Hydrodynamics)

Abstract

:
There is an urgent need for industrial Internet of things (IoT) solutions to deploy a smart hydrophone sensor grid to monitor pipeline health and to provide an accurate prediction in the event of any leakage. One solution is to develop an IoT water leakage detection system consisting of an interface to capture acoustic signals from aluminum nitride (AlN)-based micro-machined infrasonic hydrophone sensors that are fed as inputs and predict an approximate leak location as a form of output. Micro-electro-mechanical systems (MEMS) are particularly useful for IoT applications with low power consumption and small device footprint. Data analytics including characterization, pre/post processing are applied to determine the leaks. In this work, we have developed the process flow and algorithm to detect pipe leakage occurrence and pinpoint the location accurately. Our approach can be implemented to detect leaks for different pipe lengths, diameters and materials.

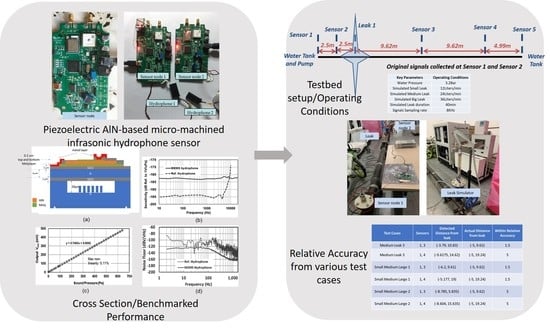
Graphical Abstract

1. Introduction

Water is one of most important natural resources, the availability of which directly impacts the livelihood and survival of humankind. Using pipelines as a medium of transportation from water sources has, in turn, become a large part of the infrastructure and ecosystem. While water leakage during transport is not uncommon, water leakage has been, and continues to be, an important factor in monetary loss worldwide, resulting in a loss of approximately 32 billion cubic meters each year [1,2]. Pipeline leakage detection has the potential to reduce water wastage and maintain stringent checks on infrastructure integrity through an immediate alarm system.
There are many ways to detect water leakages in pipelines [3,4,5,6]. Almost all of these monitoring techniques make use of onsite measurements which can be invasive or non-invasive. These non-invasive techniques are also known as Non-Destructive Testing (NDT) techniques, whereby there is no contact with the water medium and they do not affect the integrity of the pipes. Invasive techniques include the use of tracer gases [7], ground penetrating radars [6], flow, pressure [8] and acoustics sensors [9] which include hydrophones. Examples of non-invasive techniques include the use of visual image and video sensors [10], soil humidity sensors [11], accelerometers [12] as well as acoustic sensors such as microphones [13] or geophones that are placed on the pipes’ exterior. These can be further enhanced when coupled with wireless implementations using Internet of things (IoT) solutions, thereby allowing real-time continuous monitoring.
Among all the different techniques, acoustic sensors such as hydrophones provide much better sensitivities over long distances of up to 1 km or more [14], culminating in the preferential choice of use particularly for leakage detection in extensive pipe networks [5]. Further, the hydrophone is suited for use in both invasive and non-invasive applications since it can be used with or without contact with the target detection medium when immersed in the medium or hosted on the pipe’s exterior, respectively. Its supporting structure can also be designed to allow it to be versatile in virtually most hostile environments [15]. The use of hydrophones also allows the exact location of the leakage source to be determined through the use of time arrival of leak (TOA) calculations. The state-of-the-art hydrophones that are currently available in the market are mostly piezoceramic-based [14,15,16], while our proposed hydrophone is piezoelectric-based [17,18]. Hydrophones based on piezoceramics have high acoustic impedances, and hence those based on purely piezoelectrics are preferred [17]. Compared to traditional hydrophones, the use of micro-electro-mechanical systems (MEMS)-based hydrophone allows for higher optimal sensitivity, and allowance for smaller size and lower cost. This, in turn, allows for implementation in a smaller pipe system and ease of scalability to larger sensor node arrays for large-scale IoT implementation, taking into account more extensive cost savings as compared to other traditional hydrophones.
However, concerns about the reliability and accuracy of detection, as well as multigrid implementation on a large scale involving many sensors, are a huge impediment to the adoption of such sensing technologies. There is also a lack of well-defined process flow to govern the detection of leaks from the collected acoustic signals. Most of existing leak detection methods make use of adaptive thresholds [19], machine learning [20,21], all of which requires sufficient data for training before they can be used for prediction. There are others who use multivariate statistical analysis [22,23] as well. Much of these analytical methods serve only to detect the presence of the leaks and not the exact leak location. In this work, we try to define a process flow to determine the presence of leaks and their associated leak location, which can later be used as inputs or in tandem with existing machine learning techniques to further improve the accuracy and reliability of detected leaks.
The proposed water leakage detection system in this work will illustrate to the industry that it is possible to isolate the leak location, showcase the potential to scale up and demonstrate deployment feasibility in a multigrid sensor environment. This technology and derivative solutions will become an important building block to a smart nation with industry 4.0-ready pipeline systems in smart factories and smart estates.
In this work, we made use of a MEMS-based hydrophone coupled with a microcontroller that is IoT-enabled for communication with the backend server on which the collected signals are pre/post-processed in accordance with a well-defined process flow. Making use of cross-correlation algorithms, we tested the IoT water leakage detection system on a 30 m pipeline testbed, where the leak location can be accurately identified within tolerable limits. We were able to establish leakage detection in a sensor network with allowance for automatic detection and real-time monitoring, prompting alerts only with the onset of abnormal events.

2. MEMS Hydrophone Device Structure and Fabrication

The MEMS hydrophone used in this study is a piezoelectric aluminum nitride (AlN)-based micro-machined infrasonic hydrophone sensor. Its cross section is as shown in Figure 1a, and it has been shown that the MEMS hydrophone sensor is capable of achieving a flat sound sensitivity of −182.5 ± 0.3 dB (Referenced to 1 Vrms/μPa) over an industry-standard hydrophone verification unit with reference value of −194.5 ± 0.6 dB over the operation bandwidth 10 Hz~100 Hz, as shown in Figure 1b [24].
The piezoelectric AlN-based micro-machined infrasonic hydrophone sensor, to the best of our knowledge, is the highest noise resolution of micro-machined hydrophones reported to date. A non-linearity of 0.11% with a noise resolution of 57.5 dB referenced to 1 μPa/ Hz within an ultra-low operation bandwidth is observed in Figure 1c,d, respectively. The hydrophone was fabricated based on an in-house complementary metal oxide semiconductor (CMOS)-compatible AlN-on-SOI (silicon-on-insulator) platform [25,26].
Figure 2 further explains the AlN-on-SOI MEMS hydrophone fabrication processes. In step a, the wafer is double-sided polished (DSP) and alignment marks are etched on to the backside of the wafer. This is followed by patterning the cavity and etching silicon on the front side of the DSP wafer with alignment key on the backside of the wafer. If pillars within the cavity are needed, double etching steps are required if the pillars are not the same height as the cavity, as shown in step b.
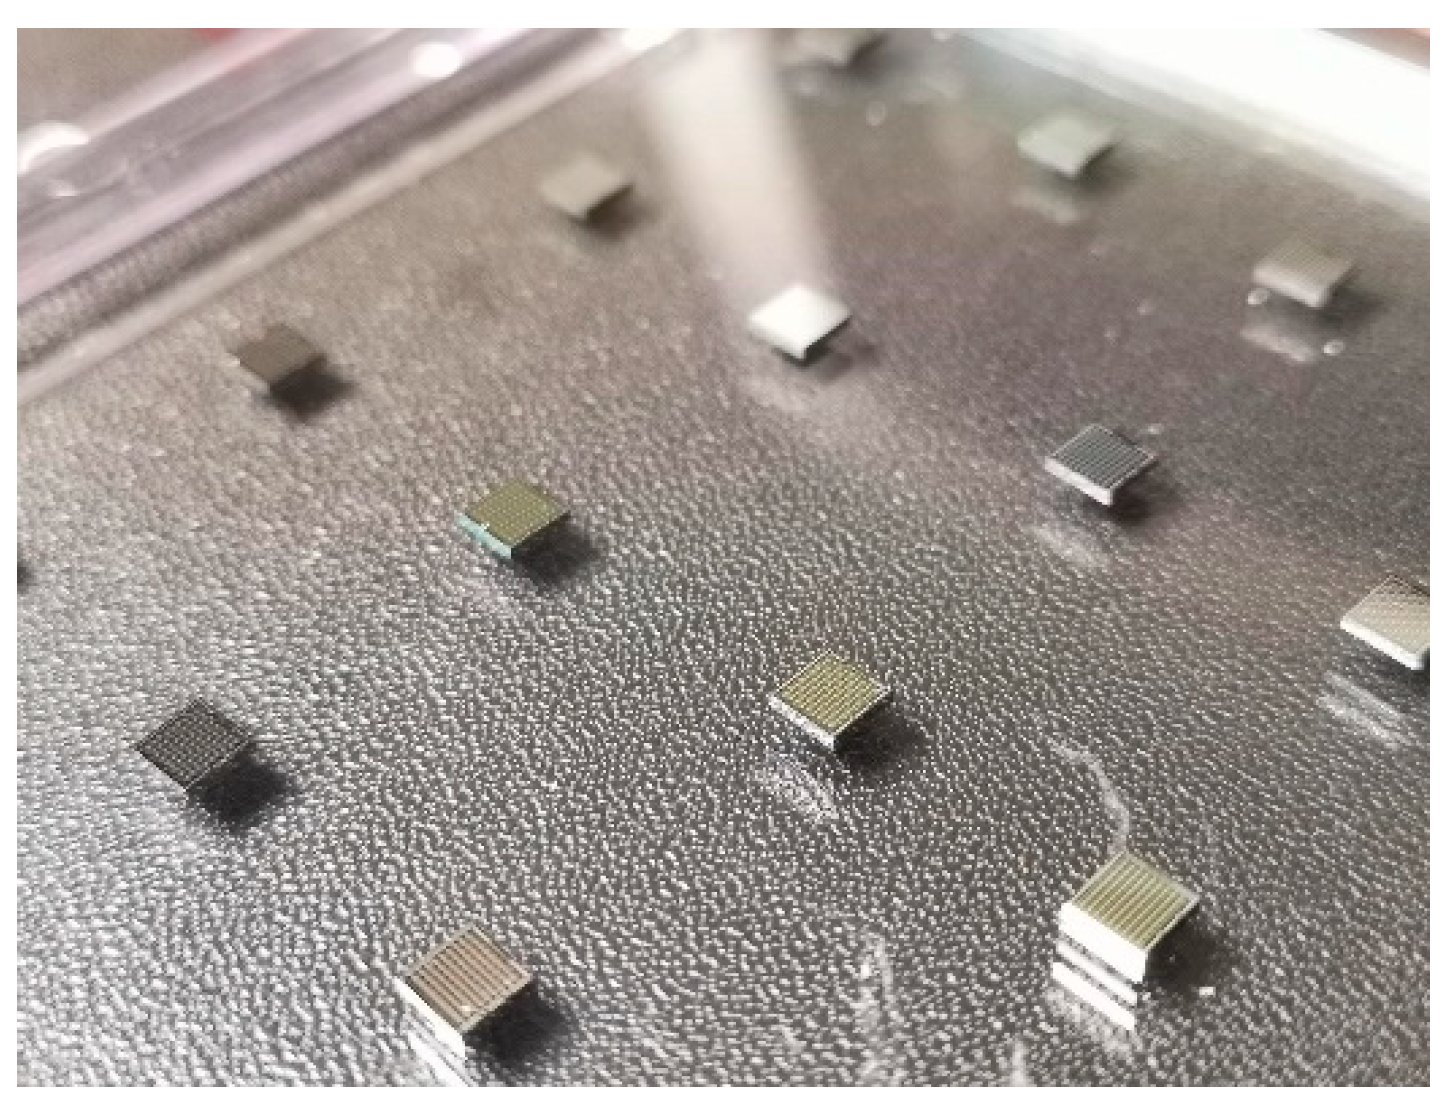
A different SOI wafer is used, and the dielectric layer can be produced using microfabrication technique (thermal oxidation). Wafers are bonded together to create a vacuum-sealed cavity (fusion bonding) in steps c and d. The second-stage manufacturing starts with the deposition and patterning of aluminum nitride (AlN) and the moly (Mo) layers. This multilayer composite structure comprises of a silicon support layer and a Mo/AlN/Mo piezoelectric stack. First, we deposited a 0.02 µm AlN seed layer at high temperature and a 0.2 µm bottom Moly layer, followed by a 1.0 µm AlN at high temperature deposition and a 0.2 um top Moly layer, as shown in step f. Alignment marks are also transferred from the back to the front side to ensure further alignment during subsequent lithography steps. A 0.2 µm oxide HM deposition and patterned top Moly defines the device structure and another layer of oxide is deposited using plasma-enhanced chemical vapor deposition (PECVD). This oxide layer is subsequently patterned and etched to the bottom electrode while a thick PECVD oxide layer is deposited and patterned to open up contacts for both top and bottom electrodes. Finally, a metal layer is deposited and patterned on the front side to form metal pads. The resultant fabricated array of MEMS hydrophone sensors is shown in Figure 3.

3. IoT Sensor Node Platform for Water Leakage Detection

To transform the sensor node into an IoT platform, the wireless hydrophone sensor node is built around an Advanced reduced instructions set machine (RISC) machine (ARM) microcontroller (MCU) running at 168 MHz core clock, which can be optionally configured to run at lower frequencies to save power [27]. Its architecture is as shown in Figure 4. Cirrus Logic WM8731 Stereo Codec (samples @ 8Ksps, 16 bits) interfaced to the MCU is fed by the on-board Op-Amp OPA2353, which is configured as a second-order multi-feedback low-pass filter with audio bandwidth to pass acoustic signals captured by hydrophones. Acoustic signals from the active hydrophone are fed at the input of op-amp OPA2353. An on-board ESP8266 Wi-Fi module is interfaced to the MCU through Universal Asynchronous Receiver/Transmitter (UART) and configured at 3 Mega baud rates to carry the sensor data traffic to and from the MCU. The completed wireless sensor node platform is as shown in Figure 5.
This developed wireless sensor node platform has built-in Wi-Fi and global positioning system (GPS) modules with provisions for external antenna connections depending on the deployment environment. It is also designed with dual channel analog frontend for hydrophone signal capturing and processing. For the leak detection algorithm to work, there is a need for collected signals to be time-synchronized. To facilitate this, the network GPS-based clock synchronization is adopted. 1 PPS signal from the GPS drives the on-board Frequency Locked Loop (FLL), which is formed with 16 MHz voltage controlled crystal oscillator (VCXO) along with clock synchronization circuitry on board. This GPS-synchronized 16 MHz clock is used as a master clock for the MCU and CODEC on board, allowing all systems on the sensor nodes to be locked to the precise GPS clock timing to enable timing synchronization of the hydrophone data samples.
The sensor node is capable of low power operation and is able to operate from a 6V, 1A wall adaptor, while optionally a rechargeable 6V battery pack can be used to power up the sensor node where the power supply is not available. Multiple sensor nodes can be connected to the backend server through the Wi-Fi network so as to establish IoT capability, as shown in Figure 6. While this configuration allows a large sensor deployment of up to 256 sensor nodes, each sensor node can be assigned unique IPv4 addresses to communicate with the cloud server through the internet. Each sensor node also has their own 8-bit unique ID to tag the sensor data packets for easy identification in the backend server.

4. Deployment of Water Leakage Detection System

To test the entire water leakage detection system, a 30 m long straight pipe testbed was set up as shown in Figure 7, comprising of 5 sensor nodes and a simulated leak location. A schematic of the entire testbed is shown in Figure 8. For this testbed, a water pressure of 3.2 Bar was maintained in the pipes. Hydrophones were placed inside the pipe and leaks of varying intensity were simulated, characterizing small, medium and large leaks as 12, 24 and 36 L/min (LPM), respectively.
The process flow that was adopted for water leakage detection is as follows. First the sensor location is collected based on the GPS coordinates of the deployed sensors. Data collected by the sensors are then pre-processed upon ensuring data integrity. Data integrity checks include and are not limited to the intermittent capture of time-synchronized signals with sufficiently high sampling rates to meet resolution requirements for a sufficient duration and whose data sizes are small enough to allow for fast and efficient pre/post-processing. In our testbed, we simulated leaks with an adopted time duration of 40 s and signals were collected at a sampling rate of 8 KHz to meet resolution requirements of 1.5 m. Varying scenarios were studied, including small, medium and large leaks, as well as a combination of all the three different leak signatures.
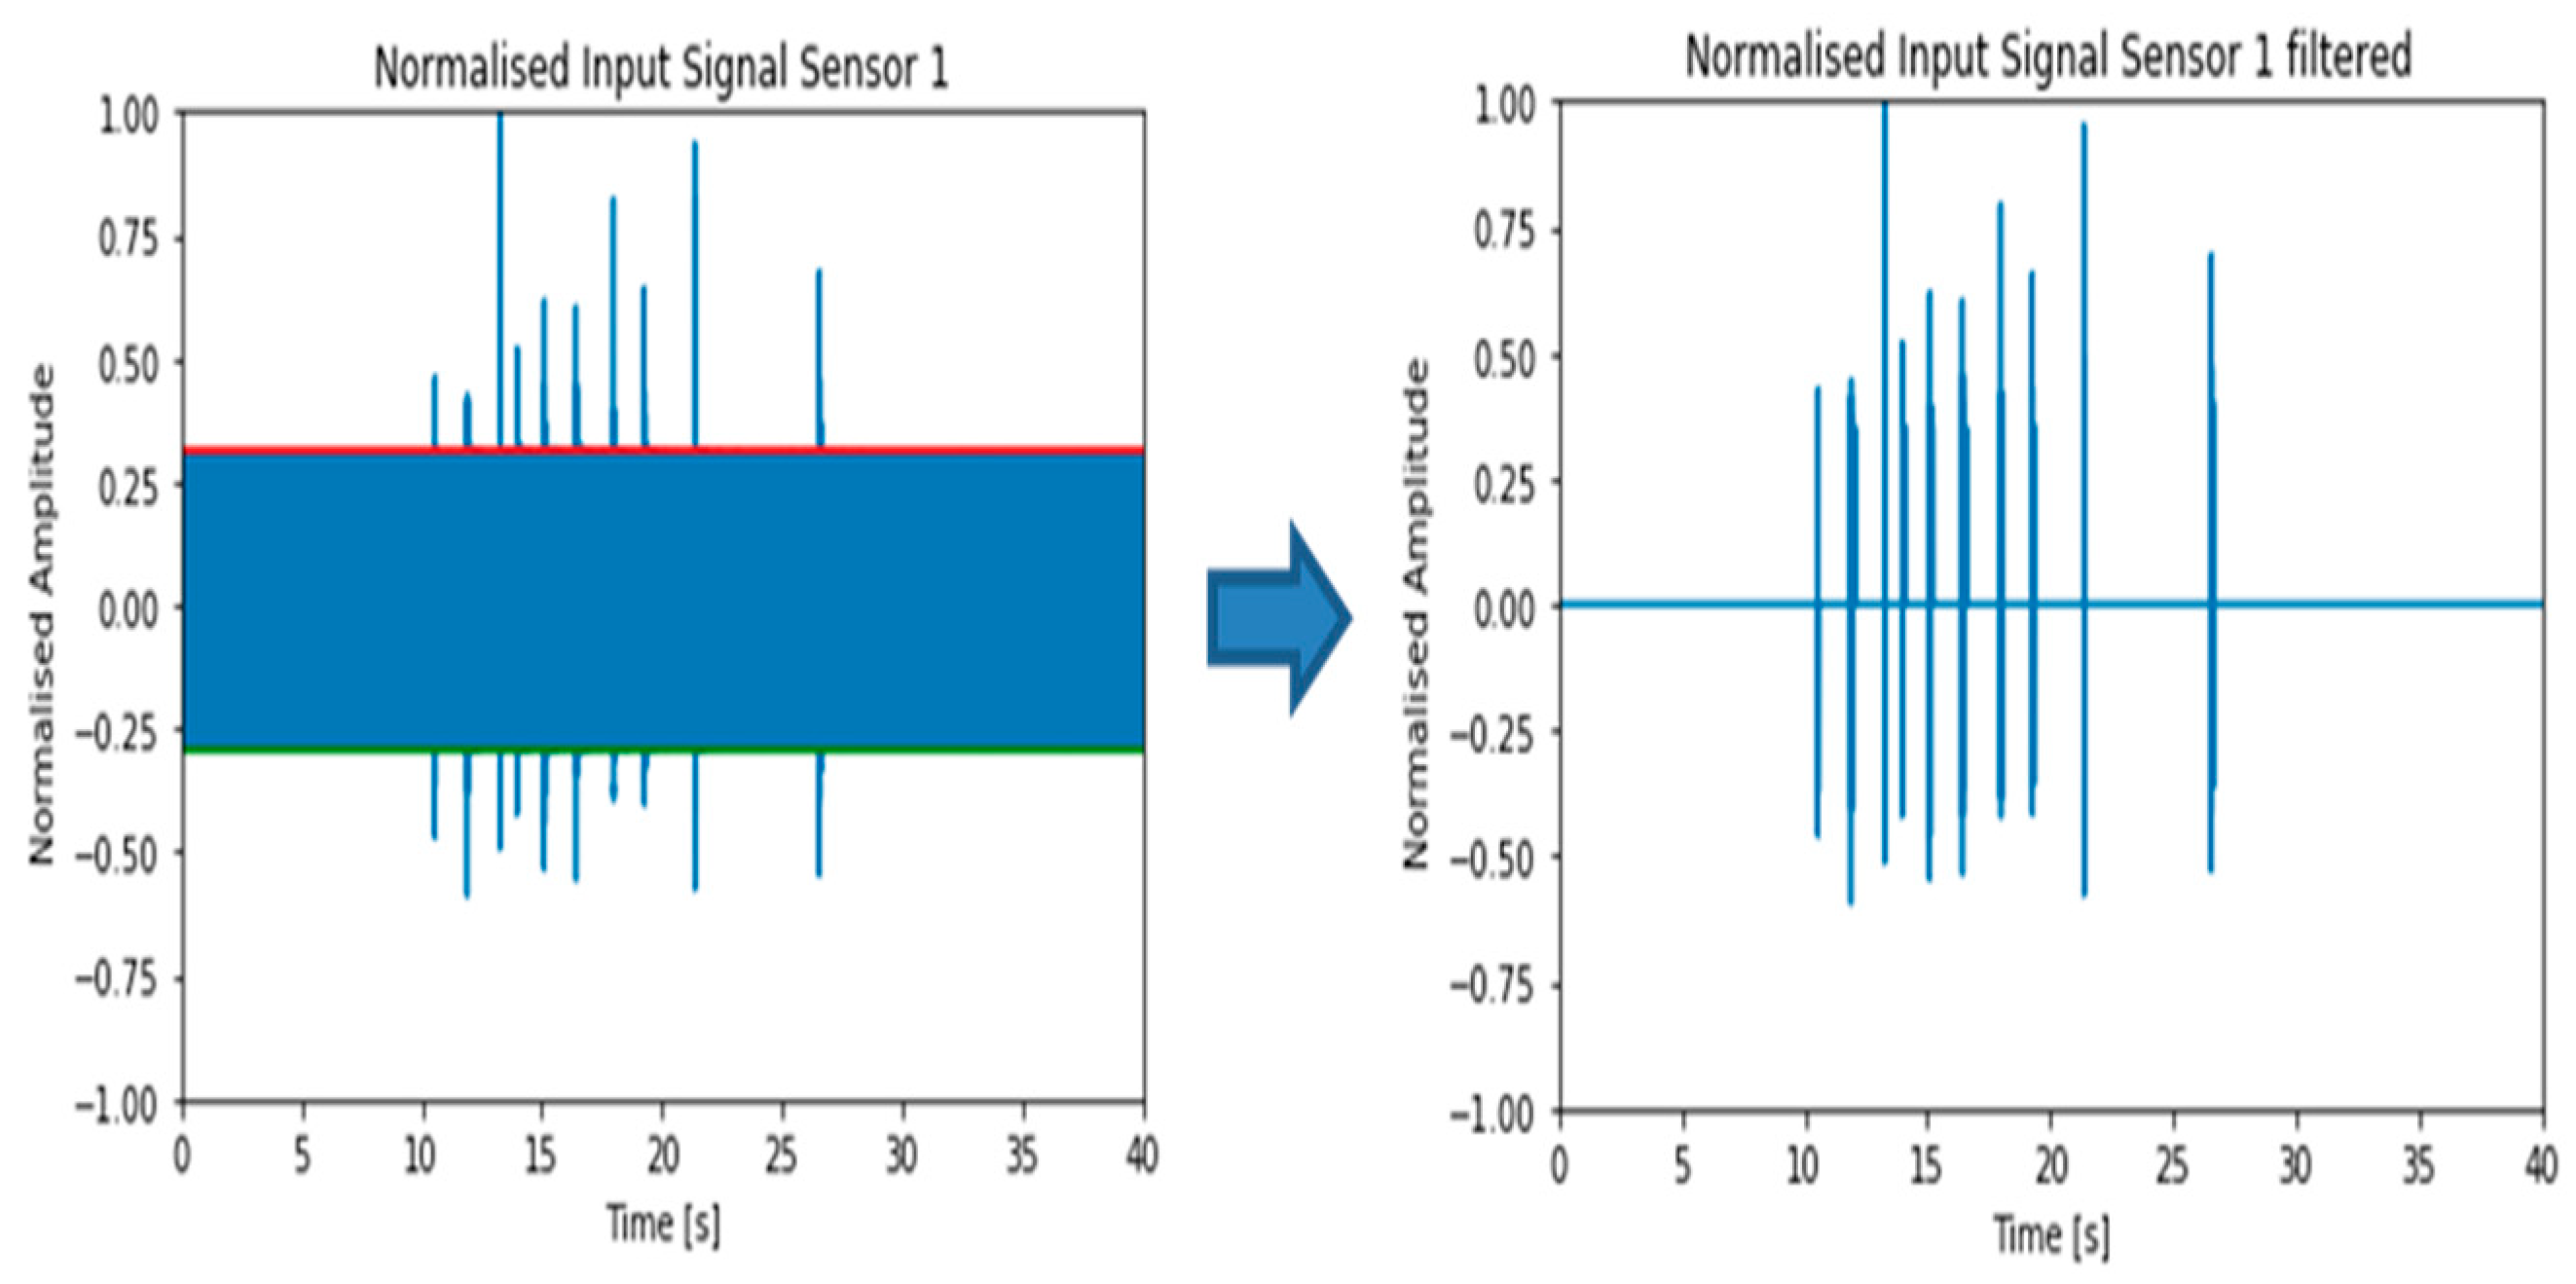
For preprocessing of collected signals, we adopted techniques to extract the clean portions of the signals, make the signal more pronounced by normalization and to extract key parameters such as the number of channels, the sampling frequency and the number of samples. To clean the signals, we perform averaging of the signal envelope to obtain the maximum amplitude and mean dominant frequency. A mean squared error for the signal is calculated with a noise buffer inserted above the collected noise. An example of such filter operation is as shown in Figure 9. Using the medium leak signature between sensors 1 and 3 from our testbed results, we can filter and perform subsequent frequency analysis of the signals to obtain the results shown in Figure 10.
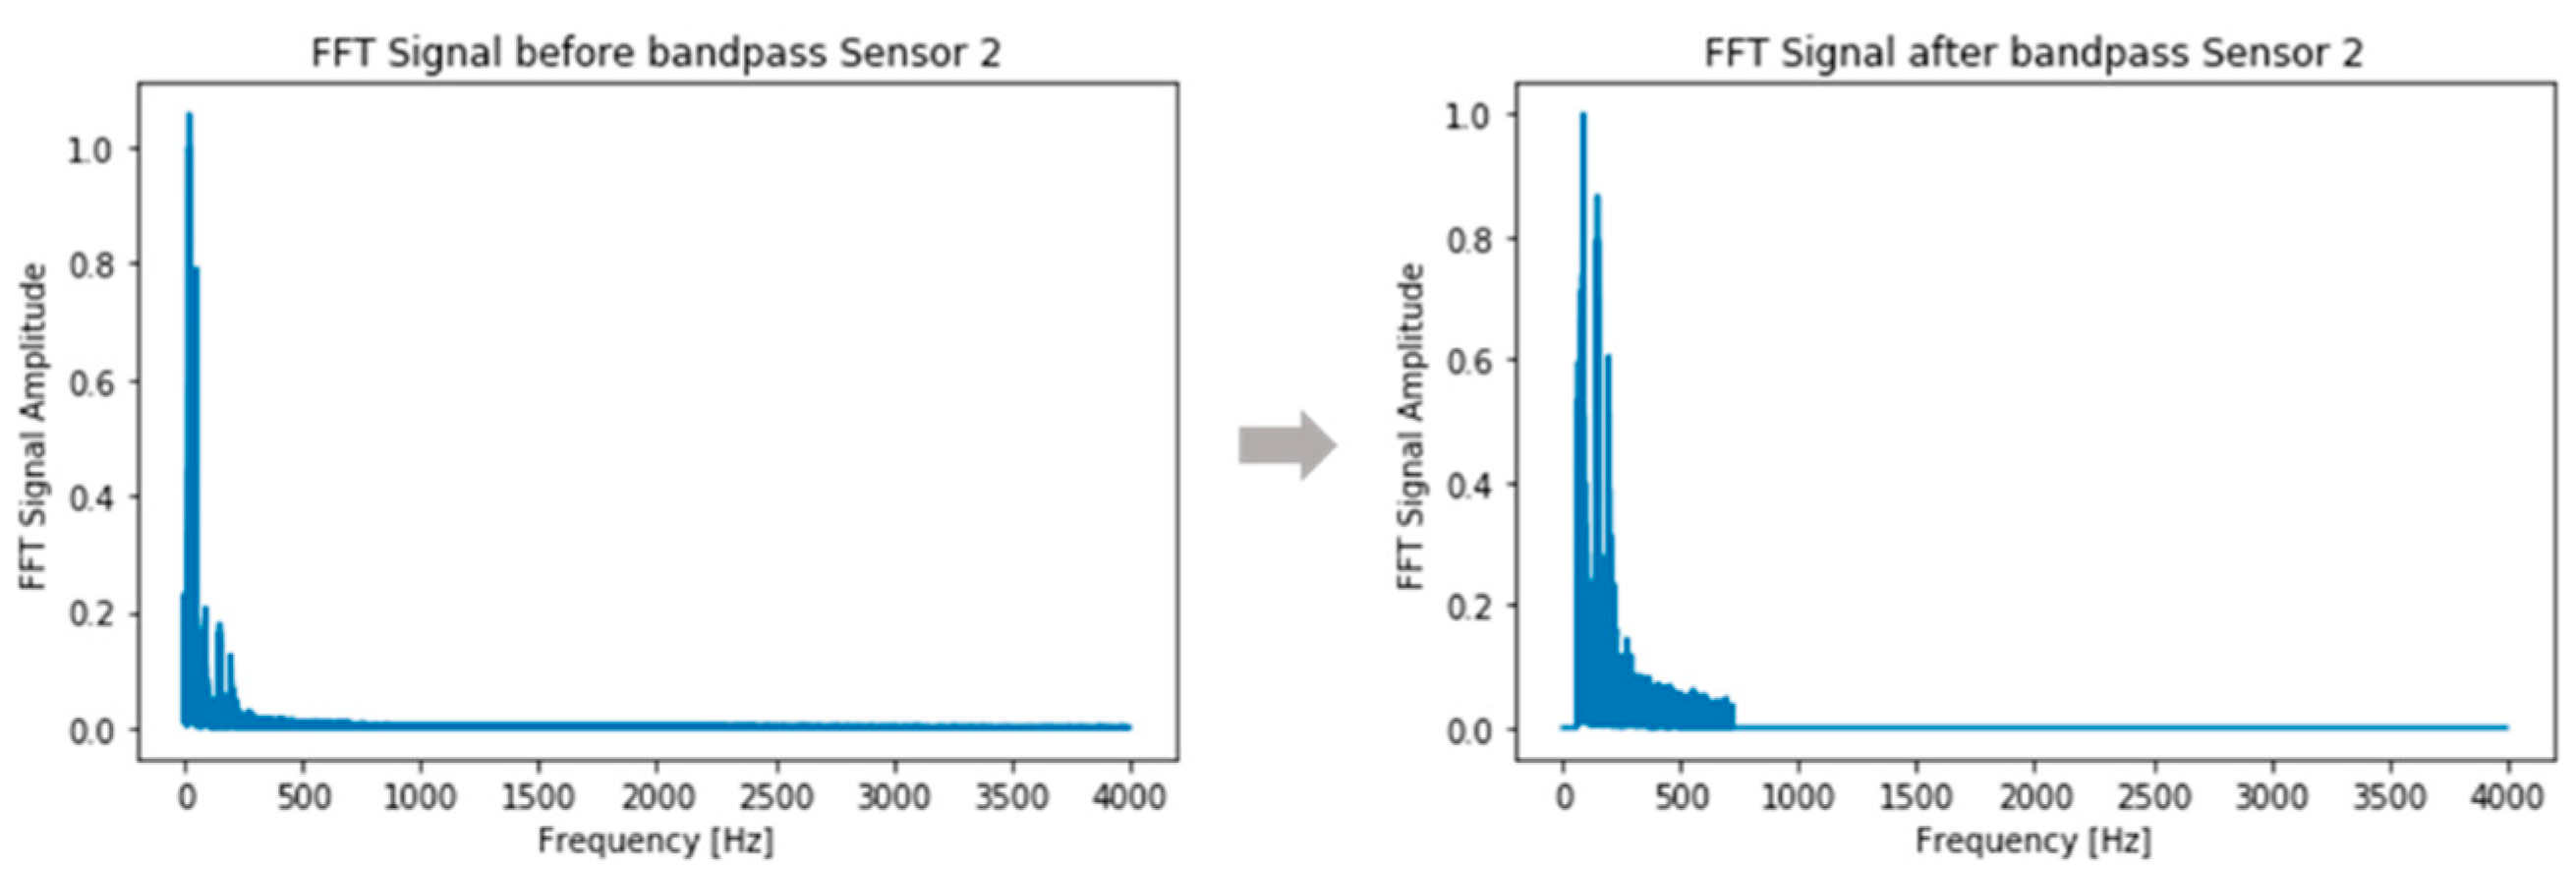
Once the data collected are found to have satisfied the data integrity checks and have been pre-processed to only contain information that is pertinent to our analysis, we can then proceed to ensure the integrity of the algorithms/functions via various post-processing techniques. The post-processing techniques that we adopted include the identification of leak frequency ranges. This involves the use of spectral centroids [28] to isolate the frequency ranges of interest. A direct result of identifying the spectral centroids from Sensor 2 is shown in Figure 11. The next technique involves the use of bandpass filter to retain relevant data within the frequency range of interest. For the medium leak detected from sensor nodes 1 and 3, the lower and upper bounds are calculated to be 60 Hz and 720 Hz, respectively. This is shown in Figure 12. Lastly, we make use of the cross-correlation algorithm to identify the time arrival of leak.
The cross-correlation function, P GCC ( t ) , is calculated from the cross-spectral density function, P 12 ( f ) as follows.
P 12 ( f ) = S 1 ( f ) S 2 * ( f )
where S 1 ( f ) = F . T [ s 1 ( t ) ] and S 2 ( f ) = F . T [ s 2 ( t ) ] . s 1 ( t ) and s 2 ( t ) are the collected signals from sensor node 1 and sensor node 2, respectively. The generalized cross-correlation with weighting function [29] is as follows:
P GCC ( f ) = P 12 ( f ) ψ dif ( ω )
where ψ dif ( ω ) = ω n and n refers to the order of the weighing function. The cross-correlation function in time can then be obtained as
p GCC ( t ) = I . F . T [ P GCC ( f ) ]
Thereafter, the leak location can be narrowed and identified via the use of positive or negative lags to identify which sensor node is closer to the signal, as shown in Figure 13. The lag time obtained is also known as the time arrival of leak (TOA).
Once the algorithm determines the TOA after post-processing the collected signals from the deployed sensor nodes, we are able to determine the leak location. Assuming a setup with 2 deployed sensors as shown in Figure 14, a leakage distance of a simulated water leak from the deployed sensors can be determined using the formula
Dist _ sensor 1 _ leak = Dist _ sensor TOA speed _ sound _ water 2
Based on the distance of the leak from the two sensors, the leakage location of a simulated water leak can be determined. This abovementioned process flow can be applied not just to acoustic signals but for other time-based signals as well, for instance, accelerometer signals. For all of the test cases, a relative accuracy of up to 1.5 m can be achieved, which is the maximum resolution for an adopted sampling rate of 8 KHz. The results are as shown in Table 1.

5. Conclusions

In conclusion, we have developed a water leakage detection system with MEMS hydrophone sensor nodes and built-in IoT capability. The benefits of adopting the MEMS hydrophone far outweighs those of other existing hydrophones in that it allows for higher optimal sensitivity, small footprint, lower cost and easier scalability for large-scale IoT implementation. The process flow and algorithms for signal analysis for such a water leakage detection system has also been defined, allowing for leak localization. This process flow can be further enhanced to incorporate machine learning techniques or adopted into existing leakage detection processes to improve the accuracy of the location of the identified leak for different pipe lengths, diameters and materials. The complete water leakage detection solution with automatic detection, real-time monitoring and alerts with the onset of abnormal events has been tested with an in-house 30 m pipe testbed with a controller leak simulator, thereby demonstrating the feasibility of such water leakage detection deployment, with the allowance to scale up the sensor deployment if necessary.

Author Contributions

Conceptualization and methodology, W.K.P., B.H., S.M.R. and S.T.L.; software and validation, W.K.P., S.T.L. and S.M.R.; hardware design, S.M.R., B.H. and K.T.C.C.; formal analysis and investigation, W.K.P., S.M.R., B.H. and E.N.; resources, E.N., T.T.H. and J.H.H.Y.; data curation, W.K.P. and S.M.R.; writing—original draft preparation, all authors; writing—review and editing, all authors; project administration, T.T.H.; funding acquisition, J.H.H.Y. All authors have read and agreed to the published version of the manuscript.

Funding

The study has been supported by Exploit Technologies Pte. Ltd. (ETPL), the technology commercialization arm of the Agency for Science, Technology and Research (A*STAR), Singapore, and JCS Venture Lab. The related technologies will be commercialized through a tech start-up, MEMSING Pte. Ltd., a joint venture of A*STAR and JCS Venture Lab.

Conflicts of Interest

The authors declare no conflict of interest. The funders had no role in the design of the study; in the collection, analyses, or interpretation of data.

References

  1. Frauendorfer, R.; Liemberger, R. The Issues and Challenges of Reducing Non-Revenue Water; Asian Development Bank: Mandaluyong, Philippines, 2010. [Google Scholar]
  2. Ress, E.; Roberson, J.A. The Financial and Policy Implications of Water Loss. J. Water Works Assoc. 2016, 108, E77–E86. [Google Scholar] [CrossRef]
  3. BenSaleh, M.S.; Qasim, S.M.; Obeid, A.M. A Review on Wireless Sensor Network for Water Pipeline Monitoring Applications. In Proceedings of the 2013 International Conference on Collaboration Technologies and Systems, San Diego, CA, USA, 20–24 May 2013; pp. 128–131. [Google Scholar]
  4. Shama, A.M.; Bady, A.; El-Shaib, M.; Kotb, A.M. Review of leakage detection methods for subsea pipeline. In Proceedings of the 17th International Congress of the International Maritime Association of the Mediterranean, Lisbon, Portugal, 9–11 October 2017. [Google Scholar]
  5. Adegboye, M.A.; Fung, W.K.; Karnik, A. Recent Advances in Pipeline Monitoring and Oil Leakage Detection Technologies: Principles and Approaches. Sensors 2019, 19, 2548. [Google Scholar] [CrossRef] [Green Version]
  6. Adedeji, K.B.; Hamam, Y.; Abe, B.T.; Abu-Mahfouz, A.M. Towards Achieving a Reliable Leakage Detection and Localization Algorithm for Application in Water Piping Networks: An Overview. IEEE Access 2017, 5, 20272–20285. [Google Scholar] [CrossRef]
  7. Murvay, P.S.; Silea, I. A survey on gas leak detection and localization techniques. J. Loss Prev. Process. Ind. 2012, 25, 966–973. [Google Scholar] [CrossRef]
  8. Elaoud, S.; Haji-Taieb, L.; Haji-Taieb, E. Leak detection of hydrogen-natural gas mixtures in pipes using the characteristics method of specified time intervals. J. Loss Prev. Process. Ind. 2010, 23, 637–645. [Google Scholar] [CrossRef]
  9. Golshan, M.; Ghavamian, A.; Abulshaheed, A.M.A. Pipeline Monitoring System by Using Wireless Sensor Network. IOSR J. Mech. Civ. Eng. 2016, 13, 43–53. [Google Scholar]
  10. Zhang, J. Designing a Cost Effective and Reliable Pipeline Leak Detection System. In Proceedings of the Pipeline Reliability Conference, Houston, TX, USA, 19–22 November 1996. [Google Scholar]
  11. Meribout, M.; Khezzar, L. Leak detection systems in oil and gas fields: Present trends and future prospects. Flow Meas. Instrum. 2020, 75, 101772. [Google Scholar] [CrossRef]
  12. Shukla, H.; Piratla, K. Leak detection in water pipelines using supervised classification of acceleration signals. Autom. Constr. 2020, 117, 103256. [Google Scholar] [CrossRef]
  13. Zimpfer, V.; Hamery, P.; Blanck, G.; Foz, T.; Andeol, G. Measurement of the acoustic leak for the de-termination of the optimal earplug type. In Proceedings of the 26th International Congress of Sound and Vibration, Montréal, QC, Canada, 7–11 July 2019. [Google Scholar]
  14. Bruel & Kjær. Hydrophones—Types 8103, 8104, 8105 and 8106; Bruel & Kjær: Nærum, Denmark, 2017. [Google Scholar]
  15. DolphinEar Hydrophones, Product Datasheet. Available online: http://www.dolphinear.com/de200.html (accessed on 2 October 2020).
  16. Aquarian Audio. H2a Hydrophone User’s Guide. Available online: https://www.aquarianaudio.com/AqAudDocs/H2a_manual.pdf (accessed on 2 October 2020).
  17. Hurrell, A. Piezoelectric and fibre-optic hydrophones. In Ultrasonic Tranducers; Woodhead Publishing: Cambridge, UK, 2012; pp. 619–676. [Google Scholar]
  18. Xu, J.; Chai, K.T.; Han, B.; Wai, E.L.-C.; Li, W.; Yeo, J.; Njihof, E.; Gu, Y. Low-Cost, Tiny-Sized MEMS hydrophone Sensor for Water Pipeline Leak Detection. IEEE Trans. Ind. Electron. 2019, 66, 6374. [Google Scholar] [CrossRef]
  19. Mujtaba, S.M.; Lemma, T.A.; Taqvi, S.A.A.; Ofei, T.N.; Vandrangi, S.K. Leak Detection in Gas Mixture Pipelines under Transient Conditions Using Hammerstein Model and Adaptive Thresholds. Processes 2020, 8, 474. [Google Scholar] [CrossRef] [Green Version]
  20. Xie, J.; Xu, X.; Dubljevic, S. Long range pipeline leak detection and localization using discrete observer and support vector machine. AIChE J. 2019, 65, e16532. [Google Scholar] [CrossRef]
  21. Zadkarami, M.; Shahbazian, M.; Salahshoor, K. Pipeline leak diagnosis based on wavelet and statistical features using Dempster–Shafer classifier fusion technique. Process Saf. Environ. Prot. 2017, 105, 156–163. [Google Scholar] [CrossRef]
  22. Santos-Ruiz, I.; Lopez-Estrada, F.R.; Puig, V.; Perez-Perez, E.J.; Mina-Antonio, J.D.; Valencia-Palomo, G. Diagnosis of Fluid Leaks in Pipelines Using Dynamic PCA. IFAC-Pap. 2018, 51, 373–380. [Google Scholar] [CrossRef]
  23. Wang, X.; Lin, J.; Ghidaoui, M.S. Usage and Effect of Multiple Transient Tests for Pipeline Leak Detection. J. Water Resour. Plann. Manag. 2020, 146, 06020011. [Google Scholar] [CrossRef]
  24. Xu, J.; Zhang, X.; Fernando, S.N.; Chai, K.T.; Gu, Y. AIN-on-SOI platform-based micro-machined hydrophone. Appl. Phys. Lett. 2016, 109, 032902. [Google Scholar] [CrossRef]
  25. Wang, N.; Xu, J.; Zhang, X.; Wu, G.; Zhu, Y.; Li, W.; Gu, Y. Methods for precisely controlling the residual stress and temperatiure coefficient of the frequency of a MEMS resonator based on an AIN cavity silicon-on-insulator platform. J. Micromech. Microeng. 2016, 26, 074003. [Google Scholar] [CrossRef]
  26. Sun, C.; Soon, B.W.; Zhu, Y.; Wang, N.; Loke, S.P.H.; Mu, X.; Tao, J.; Gu, A.Y. Methods for improving electromechanical coupling coefficient in two dimensional electric field excited AIN Lamb wave resonators. Appl. Phys. Lett. 2015, 106, 253502. [Google Scholar] [CrossRef]
  27. Rabeek, S.M.; Han, B.; Chai, K.T.C. Design of Wireless IoT Sensor Node & Platform for Water Pipeline Leak Detection. In Proceedings of the 2019 IEEE Asia-Pacific Microwave Conference, Singapore, 10–13 December 2019; pp. 1328–1330. [Google Scholar]
  28. Maser, M.L.; Fickus, M.; Bryan, E.; Petkie, D.T.; Terzuoli, A.J., Jr. Fast Computation of spectral centroids. Adv. Comput. Math. 2011, 35, 83–97. [Google Scholar] [CrossRef]
  29. Hosseini, M.S.; Rezaie, A.H.; Zanjireh, Y. Time difference if arrival estimation of sound source using cross correlation and modified maximum likelihood weighting function. Sci. Iran. D 2017, 24, 3268–3279. [Google Scholar] [CrossRef] [Green Version]
Figure 1. Piezoelectric AlN-based micro-machined infrasonic hydrophone sensor. (a) Cross-sectional view. (b) Hydrophone acoustic measurement. (c) Non-linearity measurement obtained by sweeping the sound pressure up to 640 Pa at 26 Hz. (d) Measured noise performance.
Water 12 02966 g001
Figure 2. Sample fabrication process flow for piezoelectric AlN-based micro-machined infrasonic hydrophone sensor.
Water 12 02966 g002
Figure 3. Fabricated array of Micro-Electro-Mechanical System (MEMS) hydrophone sensors.
Water 12 02966 g003
Figure 4. Wireless Sensor Node architecture.
Water 12 02966 g004
Figure 5. Overview of developed wireless sensor node platform.
Water 12 02966 g005
Figure 6. IoT wireless sensor platform.
Water 12 02966 g006
Figure 7. Testbed for water leakage detection system.
Water 12 02966 g007
Figure 8. Schematic of testbed for water leakage detection system.
Water 12 02966 g008
Figure 9. Filtered signals upon consideration of noise buffer.
Water 12 02966 g009
Figure 10. Frequency Analysis of filtered signals.
Water 12 02966 g010
Figure 11. Isolating frequency ranges of interest using spectral centroids.
Water 12 02966 g011
Figure 12. Bandpass filter operation to retain data within frequency ranges of interest.
Water 12 02966 g012
Figure 13. Positive/negative time lags to narrow leak location.
Water 12 02966 g013
Figure 14. Schematic of leakage distance calculation from two deployed sensors.
Water 12 02966 g014
Table 1. Sensors leak location results in meters.
Test CasesSensorsDetected Distance from LeakActual Distance from LeakWithin Relative Accuracy
Medium Leak 31, 3(−3.79, 10.83)(−5, 9.62)1.5
Medium Leak 31, 4(−9.6175, 14.62)(−5, 19.24)5
Small Medium Large 11, 3(−6.2, 9.61)(−5, 9.62)1.5
Small Medium Large 11, 4(−5.177, 19)(−5, 19.24)1.5
Small Medium Large 21, 3(−8.785, 5.835)(−5, 9.62)5
Small Medium Large 21, 4(−8.604, 15.635)(−5, 19.24)5
Publisher’s Note: MDPI stays neutral with regard to jurisdictional claims in published maps and institutional affiliations.