Abstract
Microbial communities promptly respond to the environmental perturbations, especially in the Arctic and sub-Arctic systems that are highly impacted by climate change, and fluctuations in the diversity level of microbial assemblages could give insights on their expected response. 16S rRNA gene amplicon sequencing was applied to describe the bacterial community composition in water and sediment through the sub-Arctic Pasvik River. Our results showed that river water and sediment harbored distinct communities in terms of diversity and composition at genus level. The distribution of the bacterial communities was mainly affected by both salinity and temperature in sediment samples, and by oxygen in water samples. Glacial meltwaters and runoff waters from melting ice probably influenced the composition of the bacterial community at upper and middle river sites. Interestingly, marine-derived bacteria consistently accounted for a small proportion of the total sequences and were also more prominent in the inner part of the river. Results evidenced that particular conditions occurring at sampling sites (such as algal blooms, heavy metal contamination and anaerobiosis) may select species at local scale from a shared bacterial pool, thus favoring certain bacterial taxa. Conversely, the few phylotypes specifically detected in some sites are probably due to localized external inputs introducing allochthonous microbial groups.
1. Introduction
Freshwater and brackish Arctic and sub-Arctic water systems (e.g., estuaries, rivers, and fjords) are vulnerable to ongoing climate change. Arctic and sub-Arctic river flow dynamics also depend on the increased amounts of glacial and snow meltwaters because of global warming as well as precipitation [1,2]. This strongly affects the physico-chemical and biological features of their receiving water bodies (e.g., estuaries, ocean, and fjords), which can be therefore enriched in particulate matter, allochthonous microorganisms and contaminants [3,4].
These systems therefore constitute a link between meltwaters and the ocean through transport of particulate matter and microorganisms [2], with an increasing river flow that can produce a river-dominated community in downstream aquatic systems [5,6,7]. As freshwater bacterial communities are taxonomically distinct from marine estuarine and communities [8,9], the fluvial microorganisms may influence the native microbial communities in terms of both composition and metabolic functions causing alterations in biogeochemical cycles. For this reason, the study of microbial communities inhabiting Arctic and sub-Arctic rivers can be fundamental to gain important insights on the biogeochemical processes in coastal and estuary ecosystems [2]. The bacterial community structure can largely vary at spatial scale, and be shaped at local scale, within the same freshwater system [3,10]. This is highly dependent on hydrological connections and local water residence time that both affect the balance between the seeding of new microbial taxa from multiple sources (e.g., rainfall, atmospheric deposition, sediments and soils, and metazoans) along the watercourse and local sorting by environmental conditions, predation or competition [11,12,13].
Arctic environments are suitable models for the survey of the extreme environmental conditions’ effects. Deepening the relation existing between the microbial communities associated with water or sediment and environmental factors, and human impact at local and global scales, fluvial and costal environments could be the key to better understand such fragile ecosystems. The sub-Arctic Pasvik River, representing the largest river system in the northern Fennoscandia, originates from the Inari Lake in Finland and flows into the Bøkfjorden in Norway. The Pasvik River is a highly dynamic environment due to the inputs of snowmelt, rainwater, and groundwater flow, which together lead the river to assume freshwater and brackish features at its inner and outer zones, respectively. Previous microbiological studies in the area explored the occurrence and abundance of heavy metal-tolerant and polychlorobiphenyl-oxidizing bacteria, as well as antibiotic susceptibility, in relation to contamination [3,4,14]. Recent advances in molecular biology technologies have facilitated the analysis of environmental samples from a wide variety of ecosystems, spanning from aquatic systems (e.g., sea, rivers, and lakes) to soils, revealing an unexpected high levels of microbial diversity and complexity. Through the use of large amounts of generated data, even the smallest fluctuations in the microbial community structure deriving from environmental fluctuations (caused by both natural and anthropogenic phenomena) can be promptly detected [15]. In this study, we first report on the phylogenetically composition by the 16S rRNA gene amplicon sequencing of bacterial assemblages in water and sediment along the Pasvik River (High Norway), with the aim to obtain further insight in the exploration of main factors affecting their distribution. The main aim was to exploit such advanced techniques to address some questions among others: are there site-specific variations in the composition of the bacterial communities of water and sediment in these areas? Are there variations in the biodiversity and abundance levels in the microbial communities of water and sediment? Which are the parameters that may possibly have affected the changes highlighted? The possible identification of site-specific variations, given the different location of the stations with respect to the fjord, could be indicative of the effect of the melting processes and it is expected that these have a different value in water and sediment.
2. Materials and Methods
2.1. Sampling Area
The Pasvik River is the largest river system in the northern Fennoscandia. The watershed is the area of the border between Finland, Norway, and Russia. The river starts from the Inari Lake (Finland; freezing period normally extends from November to early June), north of the Arctic Circle, and flows into the Bøkfjorden (Norway), which is part of the Varangerfjord in the Barents Sea. A large number of lakes, wetlands and rivers with rapids characterize the hydrographic network of the Pasvik River basin. The annual mean air temperature is rather low, i.e., −3 °C. The watercourse is surrounded by a birch and pinewood landscape with stretches of boggy land. The water conditions in the Pasvik River are representative of Eastern European rivers. A high spring flood, increased autumn flow, and periods of low water in summer/autumn and autumn/winter characterize the annual fluctuation in its water level. The precipitation in the area is low, with an annual mean of 358 mm. The overall fluctuations of water level are small (approximately −80 cm). The ice-free season lasts from May–June to October–November. The river collects snowmelt, with a considerable proportion of rainwater and groundwater flow, and it is typically a freshwater environment at its inner zone and brackish at its outer zone [16,17].
2.2. Sampling and Preliminary Treatment of Samples
Water surface samples (60–100 cm depth) and/or sediment samples were collected from 15 stations along the Pasvik River (Arctic Norway) during the sampling campaign carried out in 2013 in the framework of the SedMicro project. Based on their proximity to the fjord, stations were subdivided in three groups: outer (including stations 1 and 17), middle (stations 2, 4, 9, 18, and 19), and inner (stations 3, 5, 6, 7, 8, 13, 15, and 16) stations (Figure 1). Both matrices (water and sediment) were sampled at stations 1, 5, 8, and 9. Sampling was carried out manually by using acid-washed polycarbonate containers. Exceptions were sediment samples from deepest stations (i.e., 17, 18, and 19) which were collected by scuba (depth 23.8, 25.3, and 20.1 m, respectively). For each sample site measurements of physic and chemical parameters of water (i.e., temperature, oxygen, pH, conductibility, and salinity) were carried out. Samples were named by a number followed by the suffix s and w for sediment and water, respectively (Table 1). Samples were preliminary processed after sampling (approximately 2 h) in the laboratory of the NIBIO Svanhovd Research Station (Svanvik, Pasvik Valley), as described in the following sections.
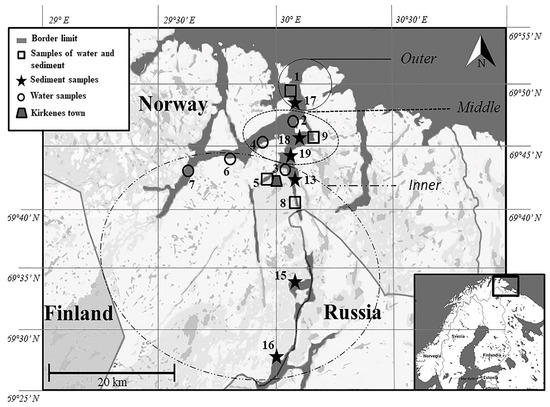
Figure 1.
Location of the sampling sites along the Pasvik River.

Table 1.
Physico-chemical data recorded at each sampling station at sampling time. Stations in bold were sampled for both water and sediment.
2.3. DNA Extraction and 16S rRNA Gene Amplification
Water samples (between 1.5 and 5.0 L) were filtered on polycarbonate membranes (diameter 47 mm; 0.22 µm) and stored at −20 °C until processing. Sediment samples were directly kept at −20 °C. DNA from environmental samples was then extracted by using the PowerSoil kit (MoBio Laboratories Inc., QIAGEN, Venlo, Netherlands) according to the supplied protocol. The V1–V2 region of the 16S rRNA genes [18] was amplified by PCR as previously described by Conte et al. [19]. In order to reduce biases in massive sequencing, the two-step PCR protocol was applied, consisting in a first step of 30 PCR cycles with conventional PCR primers and then using 0.5 μL of first reaction amplicon for 6 cycles PCR with barcoded primers for Ion Torrent sequencing. Duplicate PCR reactions of 40 µL were set up at 0 °C under a PCR cabin by using 1 µL of extracted DNA, 0.4 µL of Phusion High-Fidelity DNA polymerase (2U µL−1), 8 µL of Phusion buffer (10X), 1 µL of each dNTP (10 mM), 1 µL of SYBR Green I 25X, and 1 µL of each primer (10 μM). The universal primers 27f (5′-AGAGTTTGATCCTGGCTCAG-3′) and 338r (5′-GCT GCC TCC CGT AGG AGT -3′) were used. The amplification was performed according to the following program; (1) 98 °C for 1 s; (2) 30 cycles at 98 °C for 10 s, 53 °C for 30 s and 72 °C for 60 s; (3) 72 °C for 10 s. Amplified products were visualized by electrophoresis agarose gel (1.5%, w/v) using ethidium bromide (EtBr) (1 mg mL−1). The two reactions were pooled and set up under the same conditions to add Ion Xpress barcodes for sample read identification, and IonA and P1 sequences needed in template preparation. To 0.5 µL of pre-amplified DNA the components of the PCR mixture were added to a final volume of 20 µL: 0.2 µL of Phusion High-Fidelity DNA polymerase (2U µL−1), 4 µL of Phusion buffer, 0.5 μL dNTPs (10 mM), 0.5 µL of SYBR Green I 25X, and 0.5 µL of each barcoded primer (10 µM). The reaction was carried out according to the following program; (1) 98 °C for 30 s; (2) 6 cycles at 98 °C for 10 s, 53 °C for 30 s and 72 °C for 60 s; (3) 72 °C for 10 s. Amplified products were visualized by gel electrophoresis as described above. PCR products were purified using the Agencourt AMPure XP (Beckman Coulter, Inc., Milano, Italy) kit, according to the manufacturer’s instructions, and then quantified using the Qubit dsDNA HS Assay Kit with Qubit Fluorometer 2.0 (Invitrogen, Thermo Fisher Scientific, Milano, Italy). Twenty nanograms of each purified product was pooled for emulsion PCR with Ion PGM Template OT2 400 Kit (Thermo Fisher Scientific, Milano, Italy). Sequencing was performed on an Ion Torrent Personal Genome Machine™ (Thermo Fisher Scientific, Milano, Italy) using the Ion PGM Sequencing 400 Kit and the Ion 314™ chip (all Ion Torrent reagents by Thermo Fischer Scientific) following manufacturer’s protocols. The raw data were analyzed using the bioinformatics analysis software Mothur (version 1.39.5) (https://mothur.org/). Barcodes and primers were identified with maximum one base error and trimmed off. Reads were cleaned with the trim.seqs command by length (reads shorter than 200 bp were discarded) and by quality score using score quality windows (i.e., average 25 and size 10). Remaining sequences were aligned (align.seqs) with the Silva reference files (release 123 full-length sequences and taxonomy references). To optimize sequencing quality was used the screen.seq command (optimize = end and criteria = 95. Gaps were removed by filter.seqs. Reads were denoised using the pre.cluster command in Mothur platform [20] to remove sequences that were likely due to pyrosequencing errors and assemble reads which differed only by 2 bp. Chimeric sequences were identified and removed [21]. Finally the sequences were classified against the same Silva database [22] (cutoff = 80 and iters = 1000) and were created the distance matrix (label 0.03) to generate the operational taxonomic units (OTU) table for the subsequently analysis. Ion Torrent sequence data obtained from this study have been registered as NCBI Bioproject PRJNA656825.
2.4. Statistical Analysis
The Principal Component Analysis (PCA), based on the matrix of transformed data, produced by Trimmed Mean of M-value (TMM) normalization, was run to graphically synthesize the microbial community structure at each sampling site by considering physic chemical variables (i.e., O2, temperature, salinity, and pH). Pearson’s correlation was run after checking level of measurement, related pairs, absence of outliers, and linearity. Shannon diversity index (H’) for each sampling site was calculated in Mothur software based on the total number of good quality reads classified. Bray–Curtis similarity coefficients were computed on the entire biological dataset and used to perform non-metric multidimensional scaling (nMDS) of all retrieved bacterial phyla. OTUs were grouped in VENN diagrams using R version 3.6.1 (http://www.R-project.org/) with specific packages (e.g., venn, tidyverse, and stringr) based on their origin and location. The abundance of OTUs was assessed across all samples, and OTUs representing retrieved phyla and groups were clustered in a heat map according to their co-occurrence where dendogram was performed by R Pheatmap, and clustering_distance (for row and column) values was made as “correlation” that is used for Pearson correlation [23].
3. Results
3.1. Physicochemical Characterization
Results of environmental parameters are reported in Table 1 for each sampling station. Briefly, dissolved oxygen concentration showed strong concentration, with the lowest values for water samples from the outer Station 1 and the highest for the inner Station 8. With regards to sediment samples, the fluctuations were less stressed, and the highest dissolved oxygen concentration was evidenced again at the Station 8. Highest values of conductibility were observed at Stations 5, 6, and 9 for water samples, and 17 and 18 for sediments. In terms of salinity, lower measurements were detected among the inner Stations, both for water (Station 4) and sediment (Stations 8, 15, and 16) samples.
3.2. Phylogenetic Composition of the Bacterial Community
Overall, the Ion Torrent sequencing of the V1–V2 region of the bacterial 16S rRNA gene produced 106,641 sequence reads. After quality check and removal of chimeras, 36,157 high-quality sequences were obtained. A higher diversity was observed in sediment than in water samples, with a H’ index that was in the range 4.94 to 6.78 and 1.70 to 4.70, respectively. A total of 4597 OTUs were obtained with the highest number (i.e., 288) that was found in the sediment sample 15s and the lowest (i.e., 63) that was found in the water sample 1w (Table 2).
Table 2.
Number of good quality reads, OTUs, and Shannon diversity index obtained after row data analysis for each sampling station. Stations sampled for both sediment and water are in bold.
The diversity index and the observed richness (OTUs) showed a general symmetric pattern, as it is shown in the rarefaction curve (Supplementary Figure S1). The VENN diagram of all retrieved OTUs (distinguished in outer, middle, and inner sites) showed the OTU-sharing among water (29 common OTUs; Figure 2a) and sediment samples (27 common OTUs; Figure 2b). No OTU was common to all samples. Conversely, inner and middle sites showed the largest number of shared OTUs (42 and 109 in water and sediment, respectively) (Figure 2c).
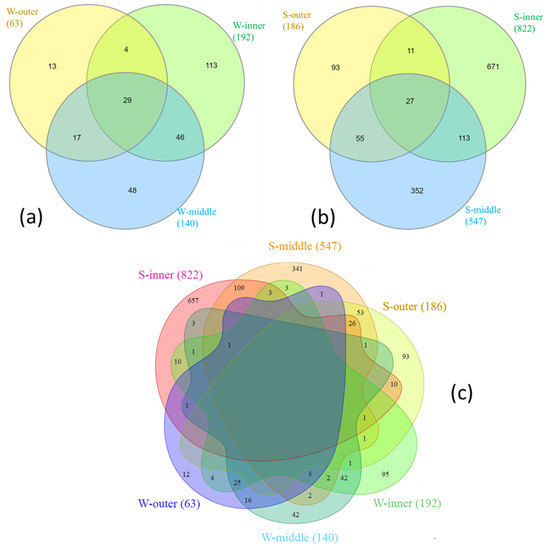
Figure 2.
Venn diagrams showing unique and shared OTUs (a) among water samples by sampling zone, (b) among sediment samples by sampling zone, and (c) among all samples by sampling zone. The number of OTUs per sampling site is in bracket.
3.3. Bacterial Taxa
Overall, Proteobacteria predominated in both water and sediment communities (63.6% and 47.3%, respectively), followed in abundance by Bacteroidetes (range: 17.4–12.4%) and Actinobacteria (4.66–9.5%) (Figure 3a and Figure 4a). Minor groups (i.e., Acidobacteria, Aminicenantes, Armatimonadetes, Atribacteria, Caldiserica, Chlamydiae, Chlorobi, Chloroflexi, Cyanobacteria, Cloacimonetes, Elusimicrobia, Fibrobacteres, Fusobacteria, Firmicutes, Hydrogenedentes, Lentisphaerae, Marinimicrobia, Microgenomates, Nitrospirae, Gemmatimonadetes, Saccharibacteria, Spirochaetae, Verrucomicrobia, and Planctomycetes) generally occurred at percentages below 1% and represented the 2.2 and 3.2% of total sequences within the water and sediment communities, respectively.
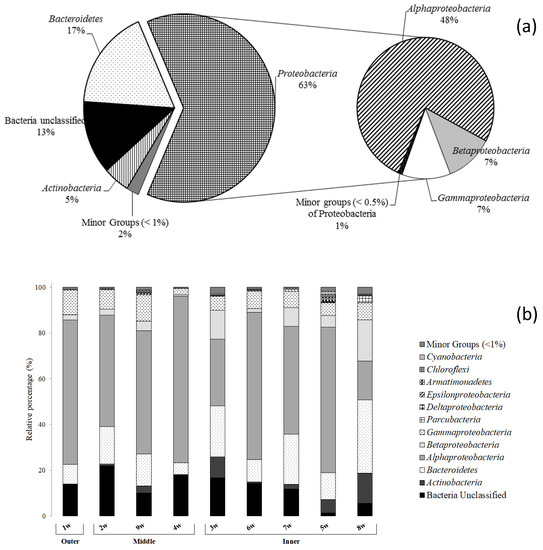
Figure 3.
Phylogenetic groups retrieved in (a) all water samples and (b) at each sampling site along the Pasvik River.
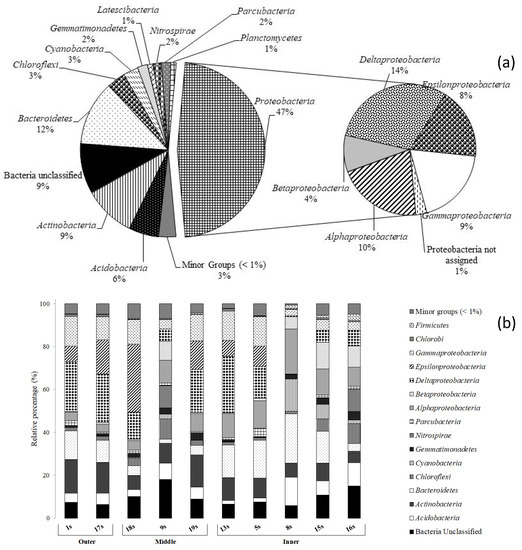
Figure 4.
Phylogenetic groups retrieved in (a) all sediment samples and (b) at each sampling site along the Pasvik River.
3.3.1. Water Samples
Proteobacteria reads were predominantly affiliated to Alphaproteobacteria (48.1% of total reads), followed by Gamma- (14.0%) and Betaproteobacteria (7.2 and 7.1%, respectively). Delta- and Epsilonproteobacteria were less represented (0.2 and 0.05%, respectively) (Figure 3a). Main bacterial taxa generally occurred at all stations (Figure 3b). Alphaproteobacteria predominated in almost all water samples, reaching the highest relative percentage (i.e., 72.8%) at the middle station 4w, followed by Betaproteobacteria (from 0.7 to 17.9% at stations 4w and 8w, respectively). Gammaproteobacteria also occurred at all sampled stations, ranging between 11.5 and 2.5% at sampling stations 9w and 4w, respectively. The CF group of Bacteroidetes was well represented, with the highest value (31.9%) at the inner station 8w. Actinobacteria were also retrieved at all sampling stations (range 0.2–13.1%), as well as Cyanobacteria (range: 0.3–1.2%). Parcubacteria occurred at six of the nine sampling stations (i.e., 4w, 3w, 6w, 7w, 5w, and 8w), as well as Chloroflexi (i.e., 2w, 9w, 3w, 6w, 5w and 8w), with a relative percentage ranging between 0.03–2.8% and 0.03–1.3%, respectively. Armatimonadates were only in four sampling stations (i.e., 9w, 3w, 5w, and 8w), ranging between 0.1 and 1.6%.
3.3.2. Sediment Samples
Differently from water, Proteobacteria classes (i.e., Alpha-, Beta-, Gamma-, Delta-, and Epsilonproteobacteria) occurred at very similar percentages in sediment, ranging between 9.1 and 14.5 % (Figure 4a). The CF group of Bacteroidetes (highest abundance at station 8s; 22.9%) was also ubiquitarious (Figure 4b). Actinobacteria were mostly distributed in the outer sites (i.e., 1s and 17s with 15.7 and 14.3%, respectively). Acidobacteria were also retrieved at all sampling sites (range 1.7–13.1). The remaining phyla (i.e., Chlorobi, Chloroflexi, Cyanobacteria, Firmicutes, Gemmatimonadetes, Nitrospira, Parcubacteria) showed percentages between 0.1 and 10.8% and were principally retrieved in the inner part of the water system.
3.4. Bacterial Genera
Bacterial genera that were retrieved in water and sediment at percentage ≥0.1% are reported in Table 3. Sequences resolved at genus level in water and sediment samples were in the range of 80.4% to 43.7% and 41.2% to 13.3% of total sequences, respectively.
Table 3.
Bacterial genera retrieved in water and sediment samples along the Pasvik River. Phyla occurring at percentages below 0.1% at all stations are not reported.
3.4.1. Water Samples
Among Proteobacteria, Alphaproteobacteria predominated with the genus Pelagibacter, which ranged from 5.9 to 55.3% (at stations 8w and 6w, respectively) (Table 3). The genus Polynucloeobacter (Betaproteobacteria) was ubiquitarious and its abundance was between 0.1 and 4.6%. Gammaproteobacteria were mainly represented by the genera Balneatrix and Pseudoalteromonas. The genera Desulfosarcina and Desulfobulbus (Deltaproteobacteria) were retrieved only at the stations 9w and 6w, respectively. Finally, Epsilonproteobacteria were present only at the station 8w with the genus Sulfurovum. Bacteroidetes were characterized by a greater variability, with the predominance of NS5 marine group (38.8%), followed by the genera Sediminibacterium (20.5%) and Polaribacter (9.9%), all retrieved in all sampling stations. In particular the NS5 marine group were dominant at sampling site 7w with a percentage of 10.4%, instead Sediminibacterium were the most abundant genus in station 8w and 3w (13.7 and 4.7%, respectively). In all but two stations (i.e., 2w and 8w), the genus Aquiluna (among Actinobacteria) was predominant (7.5%). Among Cyanobacteria the genera Crinalium and Chamaesiphon occurred at stations 5w and 8w, respectively.
3.4.2. Sediment Samples
Among Proteobacteria, the genera Pseudahrensia, Anderseniella, Variibacter, and Sphingorhabdus ranged between 4.9 and 3.6% (Table 3). Betaproteobacteria were represented by two genera (i.e., Polynucleobacter and Limnohabitans) retrieved only at 5s and 9s. With regard to Deltaproteobacteria, the genera Desulfobulbus and Desulfosarcina were distributed quite uniformly among sediment samples. Epsilonproteobacteria were exclusively represented by the genus Sulfurovum that was retrieved in almost all sampling sites, with the maximum percentage (31.6%) at station 18s. Finally, among Gammaproteobacteria the most abundant genera were Marinicella and Cocleimonas. Bacteroidetes were characterized by a great variability in sediment samples. In particular, it was possible to observe a predominance of the genera Algibacter, Lutimonas, and Ferruginibacter. Actinobacteria were equally distributed among the sampling sites, with the genus Illumatobacter being the most abundant (17.6%) and ubiquitous. Acidobacteria were found in relevant percentage in sediment with the genera Blastocatella, Geothrix, Bryobacter, and Solibacter. Chloroflexi were mainly represented by the genus Roseiflexus and were retrieved at sampling site 16s with the percentage of 1.6%. Finally, Cyanobacteria were represented by five genera. Among them, Pleurocapsa, Chamaesiphon and Crinalium occurred at high percentages at the inner station 8s.
3.5. Influence of Environmental Parameters on Bacterial Community Distribution
PCA was carried out separately for water and sediment samples to determine the most important variables (physicochemical properties) that explain the relationship between nine water and ten sediment samples, respectively, and to detect any group patterns. The bacterial community composition in water was mainly influenced by oxygen (Figure 5a). The two main components explained the 89.6% of the total variance, with axis 1 (60.5% of the variance) that was mainly expressed by temperature and pH, and axis 2 (29.1% of the variance) where the greatest weight was given by salinity and oxygen concentration. The analysis indicated a clear separation of water and sediment, with salinity inversely correlating with both first and second coordinates. The oxygen concentration was negatively correlated with the first component and positively correlated with the second one. Water and sediment samples grouped separately, suggesting a different influence of environmental parameters on biodiversity level. Salinity and temperature seemed to be more impactful on sediment than water samples. The figure shows a sort of gradient in the spatial distribution of samples, with all samples from the outer stations on the bottom of graph, most samples from middle stations and part of samples from the inner stations in the center of the PCA ordination, and finally samples from most of the inner stations distributed for both water and sediments on the top of graph (namely, stations 3w, 6w, 7w, 8w, and 15s and 16s). Sample from station 1w, which presented the lowest oxygen concentration and highest salinity values among water samples, appeared isolated from all the other. As well as for station 4w, which recorded similar salinity percentage, in these samples some taxonomic groups were absent at genus level. Interestingly, samples from 8s, 15s and 16s (inner Stations) appeared isolated from the others, by showing the strongest negative correlation with salinity. On the contrary, among sediment samples those from stations 1s, 17s and 18s were the more strongly positively correlated with salinity.
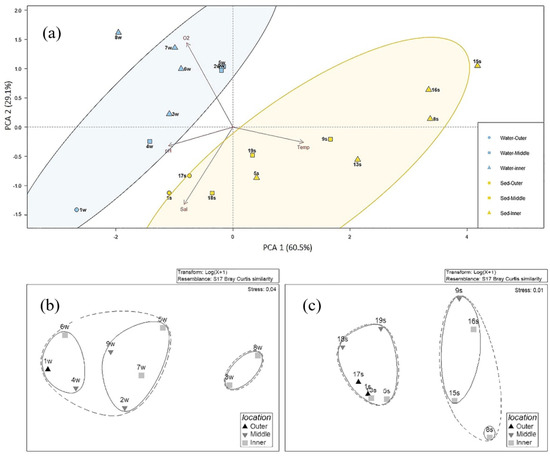
Figure 5.
Principal Component Analysis (PCA) analysis on the distribution of water (blue) and sediment (yellow) samples in relation to oxygen, temperature, salinity, and pH in water (blue) and sediments (yellow). The two ellipses include samples with a similarity >75% (a), nMDS analysis computed on abundance values at genus level detected in water (b), and sediment samples (c).
3.5.1. Influence of Environmental Parameters on Water Bacterial Community Distribution
Biological and environmental data were correlated by Pearson’s correlation to identify significant relation between group abundance and environmental parameters. A significant negative correlation (for all p < 0.05; R between −0.69 and −0.79) was observed between some phylotypes retrieved in water (i.e., Acidobacteria, Armatimonadetes, Bacteroidetes, Chlorobi, Chloroflexi, Cyanobacteria, Gemmatimonadates, Gracilibacteria, Parcubacteria, Planctomycetes, Betaproteobacteria, and Epsilonproteobacteria) and the salinity gradient along the river. Only Firmicutes showed a significant correlation (p < 0.05) with pH. At genus level, only Cocleimonas (among Epsilonproteobacteria) negatively correlated with pH (p < 0.05), while the BAL 58 marine group (among Betaproteobacteria) was positively correlated with temperature (p < 0.05). The cluster analysis performed on the heatmap related to retrieved bacteria phyla showed that bacterial communities in water samples were quite similar among stations, with the exception of stations 8w that grouped separately (Figure 6). The nMDS computed on bacterial abundance retrieved in water samples at genus level (Figure 5b) shows the formation of a cluster including the two Inner stations 3w and 8w and of a bigger group composed of two smaller subclusters including the other stations.
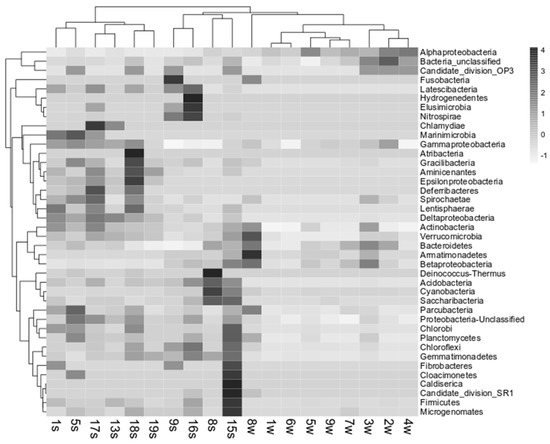
Figure 6.
Heat map associated with cluster analysis and based on main OTUs retrieved in water and sediment samples from the Pasvik River.
3.5.2. Influence of Environmental Parameters on Sediment Bacterial Community Distribution
The bacterial community composition in sediment was mainly influenced by salinity and temperature (Figure 5). The bacterial communities at sites 15s, 8s, 16s, and 9s were mostly influenced by temperature, whereas other sediment samples were related to salinity. The Pearson’s correlation showed that Chloroflexi, Firmicutes, Nitrospirae, Alphaproteobacteria, and Betaproteobacteria were negatively correlated with salinity (p < 0.01; R between −0.74 and −0.93, with the exception of Alphaproteobacteria that showed a p < 0.05). Conversely, Deltaproteobacteria, Epsilonproteobacteria, Gammaproteobacteria, and Deferribacteres showed a positive correlation with salinity (p < 0.01; R between 0.73 and 0.88).
As it is shown in the heatmap in Figure 6, the bacterial communities associated with sediments clustered in two main groups. The first one (composed of stations 15s, 8s, 16s and 9s) was closest to water samples, while the second group was composed of stations 1s, 5s, 17s, 13s, 18s, and 19s. The nMDS computed on bacterial abundance retrieved in sediment samples at genus level (Figure 5c) reflects the same clustering, but also highlights a higher similarity for the stations 15s, 16s and 9s, grouped together in a smaller cluster.
At genus level, Pseudahrensia (among Alphaproteobacteria), Desulphosarcina (among Deltaproteobacteria), Sulfurovum (among Epsilonproteobacteia), and Marinicella (among Gammaproteobacteria) positively correlated (p < 0.05) with salinity, whereas Roseoflexi (among Chloroflexi) and Gemmatimonas (among Gemmatimonadates) showed a negative correlation (p < 0.05) with salinity. Furthermore, Roseoflexi and Gemmatimonas showed a negative correlation (p < 0.05 and < 0.01, respectively) with pH.
4. Discussion
As highly sensitive indicators, the microbial communities of aquatic systems could be an excellent key for reading and monitoring disturbing or alternating effects on the environmental conditions of delicate and special ecosystems such as those of the sub-Arctic area. Moreover, the use of modern approaches can support observations in a more precise and consistent way and identify new details not observed before.
In this study, samples of water and sediment were collected along the entire river course, choosing stations in the inner most area, in the middle and in the outer most part flowing into the fjord, by presuming to observe more remarkable fluctuations in the inner and outer stations, more exposed to external phenomena, such as snow melting, rainwater inputs, and ground water flow. From the ecological point of view, it was possible to observe a sort of gradient, mainly delineated by the salinity and oxygen profiles, with the inner stations (Stations 8w and 8s, and 15s and 16s) having lower salinity and the outer ones (Stations 1w and 1s, and 17s) with higher salinity. The oxygen concentration profile was more evident in water samples than in sediments and ranged from very low concentration in the outer station (Station 1w), and then increased in the inner area (Station 8w).
Changes in bacterial community composition and richness between water and sediments, and between sampling site groups showed a decrease of bacterial diversity from inner to outer part of the fjord. Moreover, water showed a higher variability in terms of diversity respect to sediments. The unidirectional flow of water along a river causes the dispersion downstream of upstream sources of bacteria, which can then assemble locally. According to Ruiz-González et al. [12] and Niño-García et al. [13], the decrease in microbial diversity (from inner to outer sites) along boreal rivers might be dependent on the common origin from a highly diverse terrestrial community and by increasing local sorting. Contrary to sediments, whose bacterial diversity remained quite stable among the Pasvik watercourse (Shannon diversity showed variation between 6.78 in the sampling site 15s and 4.94 in the sampling site 18s), we found that the OTU richness in water peaked in the inner samples and quite gradually decreased towards middle and outer samples (Shannon diversity showed variation between 4.7 sampling site 8w and 1.7 sampling site 4w), a trend that was accompanied by gradual decrease in the relative abundance of typical freshwater taxa (e.g., members of subclade IIIb of the SAR11 clade, Cyanobacteria, Fluviicola, and Limnohabitans).
Overall similar percentages of Proteobacteria (particularly Gamma- and Betaproteobacteria), Bacteroidetes and Actinobacteria were determined in water and sediment samples, with Proteobacteria that were of major importance in the river. However, as it was expected, bacterial assemblages substantially differed in the distribution of main phyla and retrieved OTUs, with sediments that harboured a more diversified community, including a number of better represented minor groups and proteobacterial classes. For example, differently from water, Delta- and Epsilonproteobacteria were well represented within the sedimentary bacterial community of the Pasvik River, with the occurrence of genera (i.e., Desulfobacter, Desulfobulbus, and Sulfurovum) involved in the sulfur cycle. However, interestingly, such groups evidenced low abundances or were totally absent in the inner stations 8s, 15s, and 16s, where salinity was very low, by suggesting a salinity-driven shift in the bacterial community of sediments. Conversely, Alphaproteobacteria (generally of greater importance in marine samples) constituted a significant portion of the bacterioplankton in the Pasvik River, even if they were well represented (and more diversified at genus level) also in sediments. In this study, Alphaproteobacteria in water were predominantly, and almost ubiquitously, represented by members of the SAR11 clade, mainly belonging to the genera Pelagibacter and Roseobacter. This latter lineage is generally a marine dweller [24]. However, freshwater members were also found in abundance in rivers [25,26]. The SAR11 clade is generally highly dominant in both salt and freshwater systems worldwide [27,28]. It is composed of photoheterotrophic microbes that are able to oxidize a wide range of one-carbon compounds and use light by proteorhodopsin. This makes them particularly well suited for aquatic environments characterized by oligotrophic conditions, playing a major role in biogeochemical carbon cycling and energy fluxes by a non-chlorophyll-based phototrophy [29]. More interestingly, we detected sequences of the subclade IIIb of the SAR11 clade, also known as LD12, which is typical of freshwaters and often occupies similar relative abundances as its marine cousins in many lotic and lentic environments [30]. In this study, LD12 members were well represented at inner stations 3w and 8w, with their abundance that decreased downstream until their absence in the outer station. LD12 members are of particular interest for the comprehension of SAR11 evolution and, more generally, of the transitions of bacterioplankton between marine and freshwater environments [31,32].
Chloroflexi and Acidobacteria, as well as Nitrospirae, were better represented (or exclusively present) in sediment samples than in water. Members in the phylum Chloroflexi are capable of anoxygenic photosynthesis, as well as nitrogen transformation [33]. Their occurrence suggests that denitrification may occur within the Pasvik River sediments, even if the denitrification rate is expected to be low in cold and oligotrophic environments [34]. Acidobacteria are among the most dominant bacterial groups in soil, but their ecophysiology remains largely unknown [35,36]. In this study, they were ubiquitarious in sediment samples, with higher relative percentages that were determined at inner stations. Members in the genera Solibacter and Geothrix are involved in the nitrogen cycle [36], as it is the case of Nitrospira among Nitrospirae. Cyanobacteria were also well represented in the Pasvik sediment samples than in waters, with the genera Crinalium, Pleurocapsa, and Chamaesiphon that were abundant at the inner station 8s; such phototrophs are of widespread importance in polar freshwater systems [37]. Interestingly, Crinalium is a rarely occurring cyanobacterial genus commonly isolated from coastal sand dunes, but it has been also reported in cold environments, such as soils and cryoconite pools [38]. Pleurocapsa members are capable of nitrogen fixation and frequently reported in freshwater and saline environments, where their population can exist in microbial mats [39]. Finally, Chamaesiphon morphospecies are widespread freshwater epilithic cyanobacteria forming thin biofilms in streams and rivers worldwide. Notably, due to their persistence in unstable river beds, such benthic cyanobacteria have been currently used as bioindicators and in the assessment of water quality [40].
Among the phylogenetic groups that occurred at similar percentages in water and sediment samples, Bacteroidetes constituted a good portion of the Pasvik River bacterial community, although not predominantly present. They are known for their ability to degrade dissolved organic matter. Water and sediment samples shared a number of bacterial genera, which were differently distributed among stations. Among them, Algibacter affiliates were ubiquitarious in water samples, but resulted more abundant in sediments. Such genus has been frequently reported in marine environments, including cold sites [41], especially in habitats of algae, thus indicating a preference for complex polysaccharides. The genus Ferruginibacter is often found in freshwater sediments [42], also in relation to heavy metal contamination [43]. This is not surprising as the Pasvik area, due to iron mining activities and emissions by the Company Pechenganikel (a foundry in the Russian town of Nikel), is contaminated by a wide range of toxic and bioaccumulative substances, including heavy metals, mainly at its inner and middle sites [4]. Among the non-shared Bacteroidetes genera or groups, the NS5 marine group, Polaribacter, Pseudarcicella, and Fluviicola (a typical freshwater genus) characterized water samples, whereas Lutimonas and Maribacter were retrieved in sediments. A number of authors have reported on the dominance of flavobacterial phylotypes responding to phytoplankton blooms, with the succession of particular clades (including Ulvibacter spp., Polaribacter spp., and NS5 marine clades) and the progressive consumption of the algal-derived organic matter [44,45]. In this study, the NS5 marine group was found at very high percentages, also at inner stations, and its co-occurrence with some clades cited above was especially evident at the middle station 9w, suggesting that an algal bloom was present at sampling time.
Betaproteobacteria are frequently freshwater-dominant components of bacterioplankton [46], but this was not the case of the Pasvik River at sampling time, even if they were slightly more abundant at the low-salinity inner stations. Betaproteobacteria were mainly represented by two typically freshwater genera, Polynucleobacter and Limnohabitans [47,48]. According to Balmonte et al. [46], the ecophysiological flexibility of Limnohabitans members allow their persistence in turbid, organic carbon-impacted and hypoxic flood waters. Surprisingly, most betaproteobacterial sequences from inner stations were affiliated to BAL58 marine group (whose name derives from strain BAL58, an obligate oligotrophic marine bacterium), frequently reported also in freshwater-marine transition zones [49,50].
Water and sediment samples shared the same gammaproteobacterial genera, even if they showed different relative percentages and distribution. Exceptions were Balneatrix spp. that resulted ubiquitarious in water samples (and more abundant at middle and outer stations), but absent in sediment. According to Jain and Krishnan [51], being one of the predominant genera associated with marine particles, this genus probably thrives on algal bloom byproducts. The genera Pseudoalteromonas and Marinicella, which are both commonly retrieved in marine environments, were more abundant in water and sediments, respectively [52,53].
Finally, Actinobacteria similarly contributed to the bacterial communities in the analyzed matrices, but water and sediment differed at the genus level. In detail, Illumatobacter spp., generally proliferating in places contaminated by hydrocarbons [54], were particularly abundant in sediment samples, thus suggesting a contaminant input in the area. Actinobacteria also include members of the CL500-29 marine group, found primarily in marine ecosystems, but previously reported also in freshwater rivers and lakes [55,56]. Samples from station 1w revealed an extensive absence of most of the genera included in the Actinobacteria group and detected in water samples from the other sampling sites.
5. Conclusions
The bacterial communities included chemo- and photoautotrophic, as well as photoheterotrophic phylotypes, thus suggesting an active biogeochemical cycling along the Pasvik River. The bacterial community was affected by different physicochemical properties, while in water it was mostly affected by oxygen concentration and in sediment by salinity and temperature. In particular, glacial meltwaters and runoff waters from melting ice probably influenced the environmental parameters of receiving water bodies thus influencing mostly the bacterial community composition at inner and middle river sites. Interestingly, marine-derived bacteria consistently accounted for a small proportion of the total sequences, also in the inner part of the river, and more research on their origin is necessary in the future to explain these results, as their recruitment within the aquatic network should be excluded. The observed site-specific segregation of bacterial communities suggests a selection of species at local scale from a shared bacterial pool. This finding was probably dependent on particular conditions occurring at sampling sites (such as algal blooms, heavy metal contamination and anaerobiosis) favoring certain bacterial. Most likely the rare phylotypes detected only in few sites were impacted by localized external inputs introducing allochthonous microbial groups. Further investigation will be coupled with geochemical and hydrological measurements at local and seasonal scales, to shed light on the ecological factors modulating bacterial assemblages in this Arctic river.
Supplementary Materials
The following are available online at https://www.mdpi.com/2073-4441/12/11/3098/s1, Figure S1: Rarefaction curves constructed with the mothur rarefaction.single command, using a resampling without replacement approach.
Author Contributions
Conceptualization, A.L.G., L.M., and M.P.; methodology, A.M., M.P., and L.M.; software, M.P. and C.R.; formal analysis, M.P., F.M., A.C.R., and A.C.; data curation, M.P.; writing—original draft preparation, M.P., A.L.G.; writing—review and editing, A.L.G.; supervision, A.L.G.; project administration, L.M.; funding acquisition, L.M. All authors have read and agreed to the published version of the manuscript.
Funding
This research was funded by the INTERACT Transnational Access EU Program within the projects SedMicro.
Acknowledgments
The authors wish to thank the INTERACT coordinator Hannele Savela, and Lars Ola Nillson and Paul Aspholm at the NIBIO Svanhovd Research Station (Svanvik, Pasvik Valley) for their strong and continuous logistic support which allowed us to successfully carry out all the lab- and field-works planned. Our thanks to Pietro Cefali for assistance during sampling activities.
Conflicts of Interest
The authors declare no conflict of interest.
References
- Mueller, D.R.; Vincent, W.F.; Jeffries, M.O. Break-up of the largest Arctic ice shelf and associated loss of an epishelf lake. Geophys. Res. Lett. 2003, 30, 2031. [Google Scholar] [CrossRef]
- Hauptmann, A.L.; Markussen, T.N.; Stibal, M.; Olsen, N.S.; Elberling, B.; Bælum, J.; Sicheritz-Pontén, T.; Jacobsen, C.S. Upstream freshwater and terrestrial sources are differentially reflected in the bacterial community structure along a small Arctic river and its estuary. Front. Microbiol. 2016, 7, 1474. [Google Scholar] [CrossRef] [PubMed]
- Caputo, S.; Papale, M.; Rizzo, C.; Giannarelli, S.; Conte, A.; Moscheo, F.; Graziano, M.; Aspholm, P.E.; Onor, M.; De Domenico, E.; et al. Heavy metal resistance in bacteria from contaminated Arctic sediment is driven by heavy metal local inputs. Arch. Environ. Contam. Toxicol. 2019, 77, 291–307. [Google Scholar] [CrossRef] [PubMed]
- Rappazzo, A.C.; Papale, M.; Rizzo, C.; Conte, A.; Giannarelli, S.; Onor, M.; Abete, C.; Cefali, P.; De Domenico, E.; Michaud, L.; et al. Heavy metal tolerance and polychlorinated biphenyl oxidation in bacterial communities inhabiting the Pasvik River and the Varanger Fjord area (Arctic Norway). Mar. Pollut. Bull. 2019, 141, 535–549. [Google Scholar] [CrossRef] [PubMed]
- Fortunato, C.S.; Eiler, A.; Herfort, L.; Needoba, J.A.; Peterson, T.D.; Crump, B.C. Determining indicator taxa across spatial and seasonal gradients in the Columbia River coastal margin. ISME J. 2013, 7, 1899–1911. [Google Scholar] [CrossRef]
- Cameron, K.A.; Stibal, M.; Olsen, N.S.; Mikkelsen, A.B.; Elberling, B.; Jacobsen, C.S. Potential activity of subglacial microbiota transported to anoxic river delta sediments. Microb. Ecol. 2017, 74, 6–9. [Google Scholar] [CrossRef]
- Dubnick, A.; Kazemi, S.; Sharp, M.; Wadham, J.; Hawkings, J.; Beaton, A.; Lanoil, B. Hydrological controls on glacially exported microbial assemblages. J. Geophys. Res. Biogeosci. 2017, 122, 1049–1061. [Google Scholar] [CrossRef]
- Bouvier, T.; del Giorgio, P.A. Compositional changes in freeliving bacterial communities along a salinity gradient in two temperate estuaries. Limnol. Oceanogr. 2002, 47, 453–470. [Google Scholar] [CrossRef]
- Tamames, J.; Abellàn, J.; Pignatelli, M.; Camacho, A.; Moya, A. Environmental distribution of prokaryotic taxa. BMC Microbiol. 2010, 10, 85. [Google Scholar] [CrossRef]
- Cavaco, M.A.; St. Louis, V.L.; Engel, K.; St. Pierre, K.A.; Schiff, S.L.; Stibal, M.; Neufeld, J.D. Freshwater microbial community diversity in a rapidly changing High Arctic watershed. FEMS Microbiol. Ecol. 2019, 95, 11. [Google Scholar] [CrossRef]
- Crump, B.C.; Hobbie, J.E. Synchrony and seasonality in bacterioplankton communities of two temperate rivers. Limnol. Oceanogr. 2005, 50, 1718–1729. [Google Scholar] [CrossRef]
- Ruiz-González, C.; Niño-García, J.P.; Del Giorgio, P.A. Terrestrial origin of bacterial communities in complex boreal freshwater networks. Ecol. Lett. 2015, 18, 1198–1206. [Google Scholar] [CrossRef]
- Niño-García, J.P.; Ruiz-González, C.; del Giorgio, P.A. Interactions between hydrology and water chemistry shape bacterioplankton biogeography across boreal freshwater networks. ISME J. 2016, 10, 1755–1766. [Google Scholar] [CrossRef]
- Laganà, P.; Votano, L.; Caruso, G.; Azzaro, M.; Lo Giudice, A.; Delia, S. Bacterial isolates from the Arctic region (Pasvik River, Norway): Assessment of biofilm production and antibiotic susceptibility profiles. Environ. Sci. Pollut. Res. 2018, 25, 1089–1102. [Google Scholar] [CrossRef]
- Rastogi, G.; Sani, R. Molecular techniques to assess microbial community structure, function, and dynamics in the environment. In Microbes and Microbial Technology; Ahmad, I., Ahmad, F., Pichtel, J., Eds.; Springer: New York, NY, USA, 2020. [Google Scholar] [CrossRef]
- Amundsen, P.-A.; Staldvik, F.J.; Lukin, A.A.; Kashulin, N.A.; Popova, O.A.; Reshetnikov, Y.S. Heavy metal concentration in freshwater fish from the border region between Norway and Russia. Sci. Total Environ. 1997, 20, 211–224. [Google Scholar] [CrossRef]
- Karimmousavi, S.; Primicerio, R.; Amundsen, P. Diversity and structure of Chironomidae (Diptera) communities along a gradient of heavy metal contamination in a subarctic watercourse. Sci. Total Environ. 2003, 307, 93–110. [Google Scholar] [CrossRef]
- Fouhy, F.; Clooney, A.G.; Stanton, C.; Claesson, M.J.; Cotter, P.D. 16S rRNA gene sequencing of mock microbial populations—Impact of DNA extraction method, primer choice and sequencing platform. BMC Microbiol. 2016, 16, 123. [Google Scholar] [CrossRef]
- Conte, A.; Papale, M.; Amalfitano, S.; Mikkonen, A.; Rizzo, C.; De Domenico, E.; Michaud, L.; Lo Giudice, A. Bacterial community structure along the subtidal sandy sediment belt of a high Arctic fjord (Kongsfjorden, Svalbard Islands). Sci. Total Environ. 2018, 619, 203–211. [Google Scholar] [CrossRef]
- Schloss, P.D.; Gevers, D.; Westcott, S.L. Reducing the effects of PCR amplification and sequencing artifacts on 16S rRNA-based studies. PLoS ONE 2011, 6, e27310. [Google Scholar] [CrossRef]
- Edgar, R.C.; Haas, B.J.; Clemente, J.C.; Quince, C.; Knight, R. UCHIME improves sensitivity and speed of chimera detection. Bioinformatics 2011, 27, 2194–2200. [Google Scholar] [CrossRef]
- Quast, C.; Pruesse, E.; Yilmaz, P.; Gerken, J.; Schweer, T.; Yarza, P.; Peplies, J.; Glöckner, F.O. The SILVA ribosomal RNA gene database project: Improved data processing and web-based tools. Nucleic Acids Res. 2013, 41, D590–D596. [Google Scholar] [CrossRef]
- Koenig, J.E.; Spor, A.; Scalfone, N.; Fricker, A.D.; Stombaugh, J.; Knight, R.; Angenet, L.T.; Ley, R.E. Succession of microbial consortia in the developing infant gut microbiome. Proc. Natl. Acad. Sci. USA 2011, 108, 4578–4585. [Google Scholar] [CrossRef]
- Luo, H.W.; Moran, M.A. Evolutionary ecology of the marine Roseobacter clade. Microbiol. Mol. Biol. Rev. 2014, 78, 573–587. [Google Scholar] [CrossRef]
- Kirchman, D.L.; Dittel, A.I.; Findlay, S.E.G.; Fischer, D. Changes in bacterial activity and community structure in response to dissolved organic matter in the Hudson River, New York. Aquat. Microb. Ecol. 2004, 35, 243–257. [Google Scholar] [CrossRef]
- Garneau, M.E.; Vincent, W.F.; Alonso-Sáez, L.; Gratton, Y.; Lovejoy, C. Prokaryotic community structure and heterotrophic production in a river-influenced coastal arctic ecosystem. Aquat. Microb. Ecol. 2006, 42, 27–40. [Google Scholar] [CrossRef]
- Haro-Moreno, J.M.; Rodriguez-Valera, F.; Rosselli, R.; Martinez-Hernandez, F.; Roda-Garcia, J.J.; Gomez, M.L.; Fornas, O.; Martinez-Garcia, M.; López-Pérez, M. Ecogenomics of the SAR11 clade. Environ. Microbiol. 2020, 22, 1748–1763. [Google Scholar] [CrossRef]
- Morris, R.M.; Rappé, M.S.; Connon, S.A.; Vergin, K.L.; Siebold, W.A.; Carlson, C.A.; Giovannoni, S.J. SAR11 clade dominates ocean surface bacterioplankton communities. Nature 2002, 420, 806–810. [Google Scholar] [CrossRef]
- Giovannoni, S.J. SAR11 bacteria: The most abundant plankton in the oceans. Ann. Rev. Mar. Sci. 2017, 9, 231–255. [Google Scholar] [CrossRef]
- Salcher, M.M.; Pernthaler, J.; Posch, T. Seasonal bloom dynamics and ecophysiology of the freshwater sister clade of SAR11 bacteria ‘that rule the waves’ (LD12). ISME J. 2011, 5, 1242–1252. [Google Scholar] [CrossRef]
- Logares, R.; Bråte, J.; Bertilsson, S.; Clasen, J.L.; Shalchian-Tabrizi, K.; Rengefors, K. Infrequent marine–freshwater transitions in the microbial world. Trends Microbiol. 2009, 17, 414–422. [Google Scholar] [CrossRef]
- Henson, M.W.; Lanclos, V.C.; Faircloth, B.C.; Thrash, J.C. Cultivation and genomics of the first freshwater SAR11 (LD12) isolate. ISME J. 2018, 12, 1846–1860. [Google Scholar] [CrossRef]
- Denef, V.J.; Mueller, R.S.; Chiang, E.; Liebig, J.R.; Vanderploeg, H.A. Chloroflexi CL500-11 populations that predominate deep-lake hypolimnion bacterioplankton rely on nitrogen-rich dissolved organic matter metabolism and C1 compound oxidation. Appl. Environ. Microbiol. 2016, 82, 1423–1432. [Google Scholar] [CrossRef]
- Palacin-Lizarbe, C.; Camarero, L.; Catalan, J. Denitrification temperature dependence in remote, cold, and N-poor lake sediments. Water Resour. Res. 2018, 54, 1161–1173. [Google Scholar] [CrossRef]
- Foesel, B.U.; Rohde, M.; Overmann, J. Blastocatella fastidiosa gen. nov., sp. nov., isolated from semiarid savanna soil—The first described species of Acidobacteria subdivision 4. Syst. Appl. Microbiol. 2013, 36, 82–89. [Google Scholar] [CrossRef]
- Kielak, A.M.; Barreto, C.C.; Kowalchuk, G.A.; van Veen, J.A.; Kuramae, E.E. The ecology of Acidobacteria: Moving beyond genes and genomes. Front. Microbiol. 2016, 7, 744. [Google Scholar] [CrossRef]
- Vincent, W.F.; Quesada, A. Cyanobacteria in high latitude lakes, rivers and seas. In Ecology of Cyanobacteria II; Whitton, B., Ed.; Springer: Dordrecht, Germany, 2012; pp. 371–385. [Google Scholar]
- Mikhailyuk, T.; Vinogradova, O.; Holzinger, A.; Glaser, K.; Samolov, E.; Karsten, U. New record of the rare genus Crinalium Crow (Oscillatoriales, Cyanobacteria) from sand dunes of the Baltic Sea, Germany: Epitypification and emendation of Crinalium magnum Fritsch et John based on an integrative approach. Phytotaxa 2019, 400, 165–179. [Google Scholar] [CrossRef]
- Kolda, A.; Petrić, I.; Mucko, M.; Gottstein, S.; Žutinić, P.; Goreta, G.; Ternjej, I.; Rubinić, J.; Radišić, M.; Udovič, M.G. How environment selects: Resilience and survival of microbial mat community within intermittent karst spring Krčić (Croatia). Ecohydrology 2019, 12, e2063. [Google Scholar] [CrossRef]
- Rott, E.; Schneider, S.C. A comparison of ecological optima of soft-bodied benthic algae in Norwegian and Austrian rivers and consequences for river monitoring in Europe. Sci. Total Environ. 2014, 475, 180–186. [Google Scholar] [CrossRef]
- Jung, Y.J.; Lee, Y.M.; Baek, K.; Hwang, C.Y.; Cho, Y.; Hong, S.G.; Kim, J.H.; Lee, H.K. Algibacter psychrophilus sp. nov., a psychrophilic bacterium isolated from marine sediment. Int. J. Syst. Evol. Microbiol. 2015, 65, 1735–1740. [Google Scholar] [CrossRef] [PubMed]
- Lim, J.H.; Baek, S.K.; Lee, S.T. Ferruginibacter alkalilentus gen. nov., sp. nov. and Ferruginibacter lapsinanis sp. nov., novel members of the family Chitinophagaceae in the phylum Bacteroidetes, isolated from freshwater sediment. Int. J. Syst. Evol. Microbiol. 2009, 59, 2394–2399. [Google Scholar] [CrossRef] [PubMed]
- Xu, R.; Sun, X.; Han, F.; Li, B.; Xiao, E.; Xiao, T.; Yang, Z.; Sun, W. Impacts of antimony and arsenic co-contamination on the river sedimentary microbial community in an antimony-contaminated river. Sci. Total Environ. 2020, 713, 136451. [Google Scholar] [CrossRef] [PubMed]
- Ngugi, D.K.; Stingl, U. High-quality draft single-cell genome sequence of the NS5 Marine Group from the coastal Red Sea. Genome Announc. 2018, 6, e00565-18. [Google Scholar] [CrossRef] [PubMed]
- Díez-Vives, C.; Nielsen, S.; Sánchez, P.; Palenzuela, O.; Ferrera, I.; Sebastián, M.; Pedrós-Alió, C.; Gasol, J.M.; Acinas, S.G. Delineation of ecologically distinct units of marine Bacteroidetes in the Northwestern Mediterranean Sea. Mol. Ecol. 2019, 28, 2846–2859. [Google Scholar] [CrossRef]
- Balmonte, J.P.; Arnosti, C.; Underwood, S.; McKee, B.A.; Teske, A. Riverine bacterial communities reveal environmental disturbance signatures within the Betaproteobacteria and Verrucomicrobia. Front. Microbiol. 2016, 7, 1441. [Google Scholar] [CrossRef]
- Hahn, M.W.; Kasalicky, V.; Jezbera, J.; Brandt, U.; Jezberova, J.; Simek, K. Limnohabitans curvus gen. nov., sp nov., a planktonic bacterium isolated from a freshwater lake. Int. J. Syst. Evol. Microbiol. 2010, 60, 1358–1365. [Google Scholar] [CrossRef] [PubMed]
- Jezberová, J.; Jezbera, J.; Brandt, U.; Lindström, E.S.; Langenheder, S.; Hahn, M.W. Ubiquity of Polynucleobacter necessarius ssp. asymbioticus in lentic freshwater habitats of a heterogenous 2000 km2 area. Environ. Microbiol. 2010, 12, 658–669. [Google Scholar]
- Simu, K.; Hagström, Å. Oligotrophic bacterioplankton with a novel single-cell life strategy. Appl. Environ. Microbiol. 2004, 70, 2445–2451. [Google Scholar] [CrossRef]
- Gołębiewski, M.; Całkiewicz, J.; Creer, S.; Piwosz, K. Tideless estuaries in brackish seas as possible freshwater-marine transition zones for bacteria: The case study of the Vistula river estuary. Environ. Microbiol. Rep. 2017, 9, 129–143. [Google Scholar] [CrossRef]
- Jain, A.; Krishnan, K.P. Differences in free-living and particle-associated bacterial communities and their spatial variation in Kongsfjorden, Arctic. J. Basic Microbiol. 2017, 1–12. [Google Scholar] [CrossRef]
- Zhong, Y.L.; Sun, X.K.; Hui, J.G.; Teng, H.L.; Du, Z.J. Marinicella rhabdoformis sp. nov., isolated from coastal sediment. Int. J. Syst. Evol. Microbiol. 2020, 70, 3528–3533. [Google Scholar] [CrossRef]
- Parrilli, E.; Tedesco, P.; Fondi, M.; Tutino, M.L.; Lo Giudice, A.; de Pascale, D.; Fani, R. The art of adapting to extreme environments: The model system Pseudoalteromonas. Phys. Life Rev. 2019. [Google Scholar] [CrossRef]
- Peng, M.; Xiaoxue, Z.; Qiuyu, W. Bacterial community diversity of oil-contaminated soils assessed by high throughput sequencing of 16S rRNA genes. Int. J. Environ. Res. Public Health 2015, 12, 12002–12015. [Google Scholar] [CrossRef]
- Zwart, G.; Crump, B.C.; Kamst-van Agterveld, M.P.; Hagen, F.; Han, S.-H. Typical freshwater bacteria: An analysis of available 16S rRNA gene sequences from plankton of lakes and rivers. Aquat. Microb. Ecol. 2002, 28, 141–155. [Google Scholar] [CrossRef]
- Yu, S.; He, R.; Song, A.; Huang, Y.; Jin, Z.; Liang, Y.; Li, Q.; Wang, X.; Müller, W.E.G.; Cao, J. Spatial and temporal dynamics of bacterioplankton community composition in a subtropical dammed karst river of southwestern China. Microbiol. Open 2019, 8, e849. [Google Scholar] [CrossRef]


Publisher’s Note: MDPI stays neutral with regard to jurisdictional claims in published maps and institutional affiliations. |
© 2020 by the authors. Licensee MDPI, Basel, Switzerland. This article is an open access article distributed under the terms and conditions of the Creative Commons Attribution (CC BY) license (http://creativecommons.org/licenses/by/4.0/).