Case Report

Use of Seasonal Streamflow Forecasts for Flood Mitigation with Adaptive Reservoir Operation: A Case Study of the Chao Phraya River Basin, Thailand, in 2011

1
Department of Civil and Environmental Engineering, School of Environment and Society, Tokyo Institute of Technology, 2-12-1-M1-6 Ookayama, Meguro-ku, Tokyo 152-8552, Japan
2
Global and Local Environment Co-creation Institute (GLEC), Ibaraki University, 2-2-35 Sakuragawa, Mito, Ibaraki 310-0801, Japan
*
Author to whom correspondence should be addressed.
Water 2020, 12(11), 3210; https://doi.org/10.3390/w12113210
Submission received: 2 October 2020 / Revised: 9 November 2020 / Accepted: 12 November 2020 / Published: 16 November 2020
(This article belongs to the Section Water Resources Management, Policy and Governance)

Abstract

:
Predicting streamflow can help water managers make policy decisions for individual river basins. In 2011, heavy rainfall from May until October resulted in the largest flood event in the history of Thailand. This event created difficulty for water managers, who lacked information to make predictions. Studies on the 2011 Thai flood have proposed alternative reservoir operations for flood mitigation. However, no study to date has used predictive information to determine how to control reservoirs and mitigate such extreme floods. Thus, the objective of this study is to update and develop a method for using streamflow predictive data to support adaptive reservoir operation with the aim of mitigating the 2011 flood. The study area was the Chao Phraya River Basin, one of the most important basins in Thailand. We obtained predictive information from a hydrological model with a reservoir operation module using an ensemble of seasonal precipitation data from the European Centre for Medium–Range Weather Forecasts (ECMWF). The six-month ECMWF prediction period was used to support the operation plan for mitigating flooding in 2011 around each reservoir during the wet season. Decision-making for reservoir operation based on seasonal predictions was conducted on a monthly time scale. The results showed that peak river discharge decreased slightly, by around 4%, when seasonal predictive data were used. Moreover, changing the reservoir operation plan and using seasonal predictions decreased the peak river discharge by around 20%.

1. Introduction

Natural disasters have occurred throughout human history. In particular, catastrophic floods and droughts have had a significant impact on society. However, humans can reduce the damage caused by disasters by developing advanced technologies such as dams [1,2,3]. The purpose of dam construction is to control water so that it provides the greatest possible benefit to society [4,5]. Flood and drought mitigation can be achieved through well-organized reservoir operation [6,7,8]. However, a report by the Intergovernmental Panel on Climate Change [9] noted that the effects of climate change make extreme weather and climate events, such as extreme precipitation events and droughts, more frequent and severe globally. Thus, water managers face significant challenges in terms of controlling water in a way that benefits society.
In 2011, catastrophic flooding occurred in Thailand. From May until October 2011, the country experienced heavy rainfall as a result of five typhoons. This rainfall was estimated to total 1439 mm or about 143% of the average rainy season rainfall from 1982 to 2002 [10,11]. This flood caused substantial damage to the Thai economy and society. The capital city, Bangkok, and industrial areas were inundated from May until December, which caused the Thai economy to lose about USD 45 billion [12]. Because of a lack of information on future rainfall, there was no plan for this unexpectedly severe rainfall event, which affected the Chao Phraya River Basin (CPRB). Thus, two large reservoirs located behind the Bhumibol and Sirikit dams were unable to mitigate the flooding.
Several studies in Thailand have focused on optimizing reservoir operation and analyzing the regulated flow of the 2011 floodwaters in the CPRB [13,14,15,16]. Mateo et al. [6], which aimed to mitigate flooding in the CPRB in 2011 through alternative dam operation strategies, proposed four operation schemes for controlling target dam storage to mitigate flooding. In that study, researchers proposed four operation schemes for controlling target dam storage to mitigate flooding. The results showed that peak streamflow could be reduced using the proposed schemes. However, that investigation did not use seasonal predictive information. Predictions at the seasonal scale are useful for water management and can support timely reservoir operation. To make decisions related to reservoir operation, water managers must act on predictive information and water demand at the time [17,18].
In Thailand, most reservoirs are operated using a rule curve. The rule curve, which guides water managers to properly control reservoirs, is created from historical streamflow data in the target basin area [19]. It is analyzed using past streamflow data obtained since the recording of streamflow began. Two rule curves are used: the upper rule curve and the lower rule curve. The upper rule curve is defined as the standard water level in a reservoir each month. It is essential to maintain a water level that does not exceed the upper control level. Water is maintained between the upper water level and the maximum water level to prevent flooding. The lower rule curve indicates the minimum water level in the reservoir each month, setting a standard level that is not below the control level. The aim is to reserve sufficient water between the minimum and the lowest water levels that will meet the needs for cultivation and prevent water shortages during the dry season [20]. In 2011, dam storage at both reservoirs was lower than the rule curve at the beginning of the wet season, and no information was available on whether streamflow would increase or decrease during the subsequent months. In addition, the reservoirs might not have been appropriately managed to mitigate flooding in 2011 because of a lack of predictive information. Moreover, the substantial rainfall in 2011 was an unexpected event, and such events make it more difficult to operate reservoirs to mitigate flooding. Therefore, a method of predicting streamflow is needed for effective water management in Thailand.
Aiming to support water management, previous streamflow prediction studies have simulated predictions using hydrological models [21]. The hydrological ensemble prediction system (HEPS) uses a hydrological model forced with a range of probabilities in a seasonal climate forecast environment based on general circulation models (GCMs) [22]. HEPS has been widely used in numerous studies around the world. However, GCM ensemble climate forecasting is generally biased, which can increase the uncertainty of streamflow forecasts. In addition, the spread of the GCM ensemble climate forecast may be too wide for a small region such as the CPRB [23]. These limitations must be addressed before GCM ensemble climate forecasting can be used for water management [24].
Previous studies of seasonal streamflow prediction have proposed various methods to improve the accuracy of seasonal streamflow prediction [25,26]. However, little attention has been paid to using seasonal streamflow forecasts to support water management. Although Mateo et al. [6] proposed a useful operation scheme, they did not consider seasonal streamflow prediction. Moreover, their research mitigated the 2011 flood by controlling storage of the target dams. In reality, water managers cannot set target storage levels at the beginning of the wet season without predictive information and water demand; in addition, climatic factors are uncertain. Therefore, to predict seasonal streamflow while accounting for reservoir operation, we updated and developed a method for using seasonal streamflow predictive data to support adaptive reservoir operation. Thus, the objective of this study is to demonstrate the use of streamflow predictive information for adaptive reservoir operation with the aim of mitigating the 2011 flood in the CPRB. This paper presents a comparison of river discharge with and without the use of predictive information to support adaptive reservoir operation. In addition, the results of river discharge with the 2011 reservoir operation and river discharge with the alternative reservoir operation were compared in this study.

2. Study Area, Data and Methods
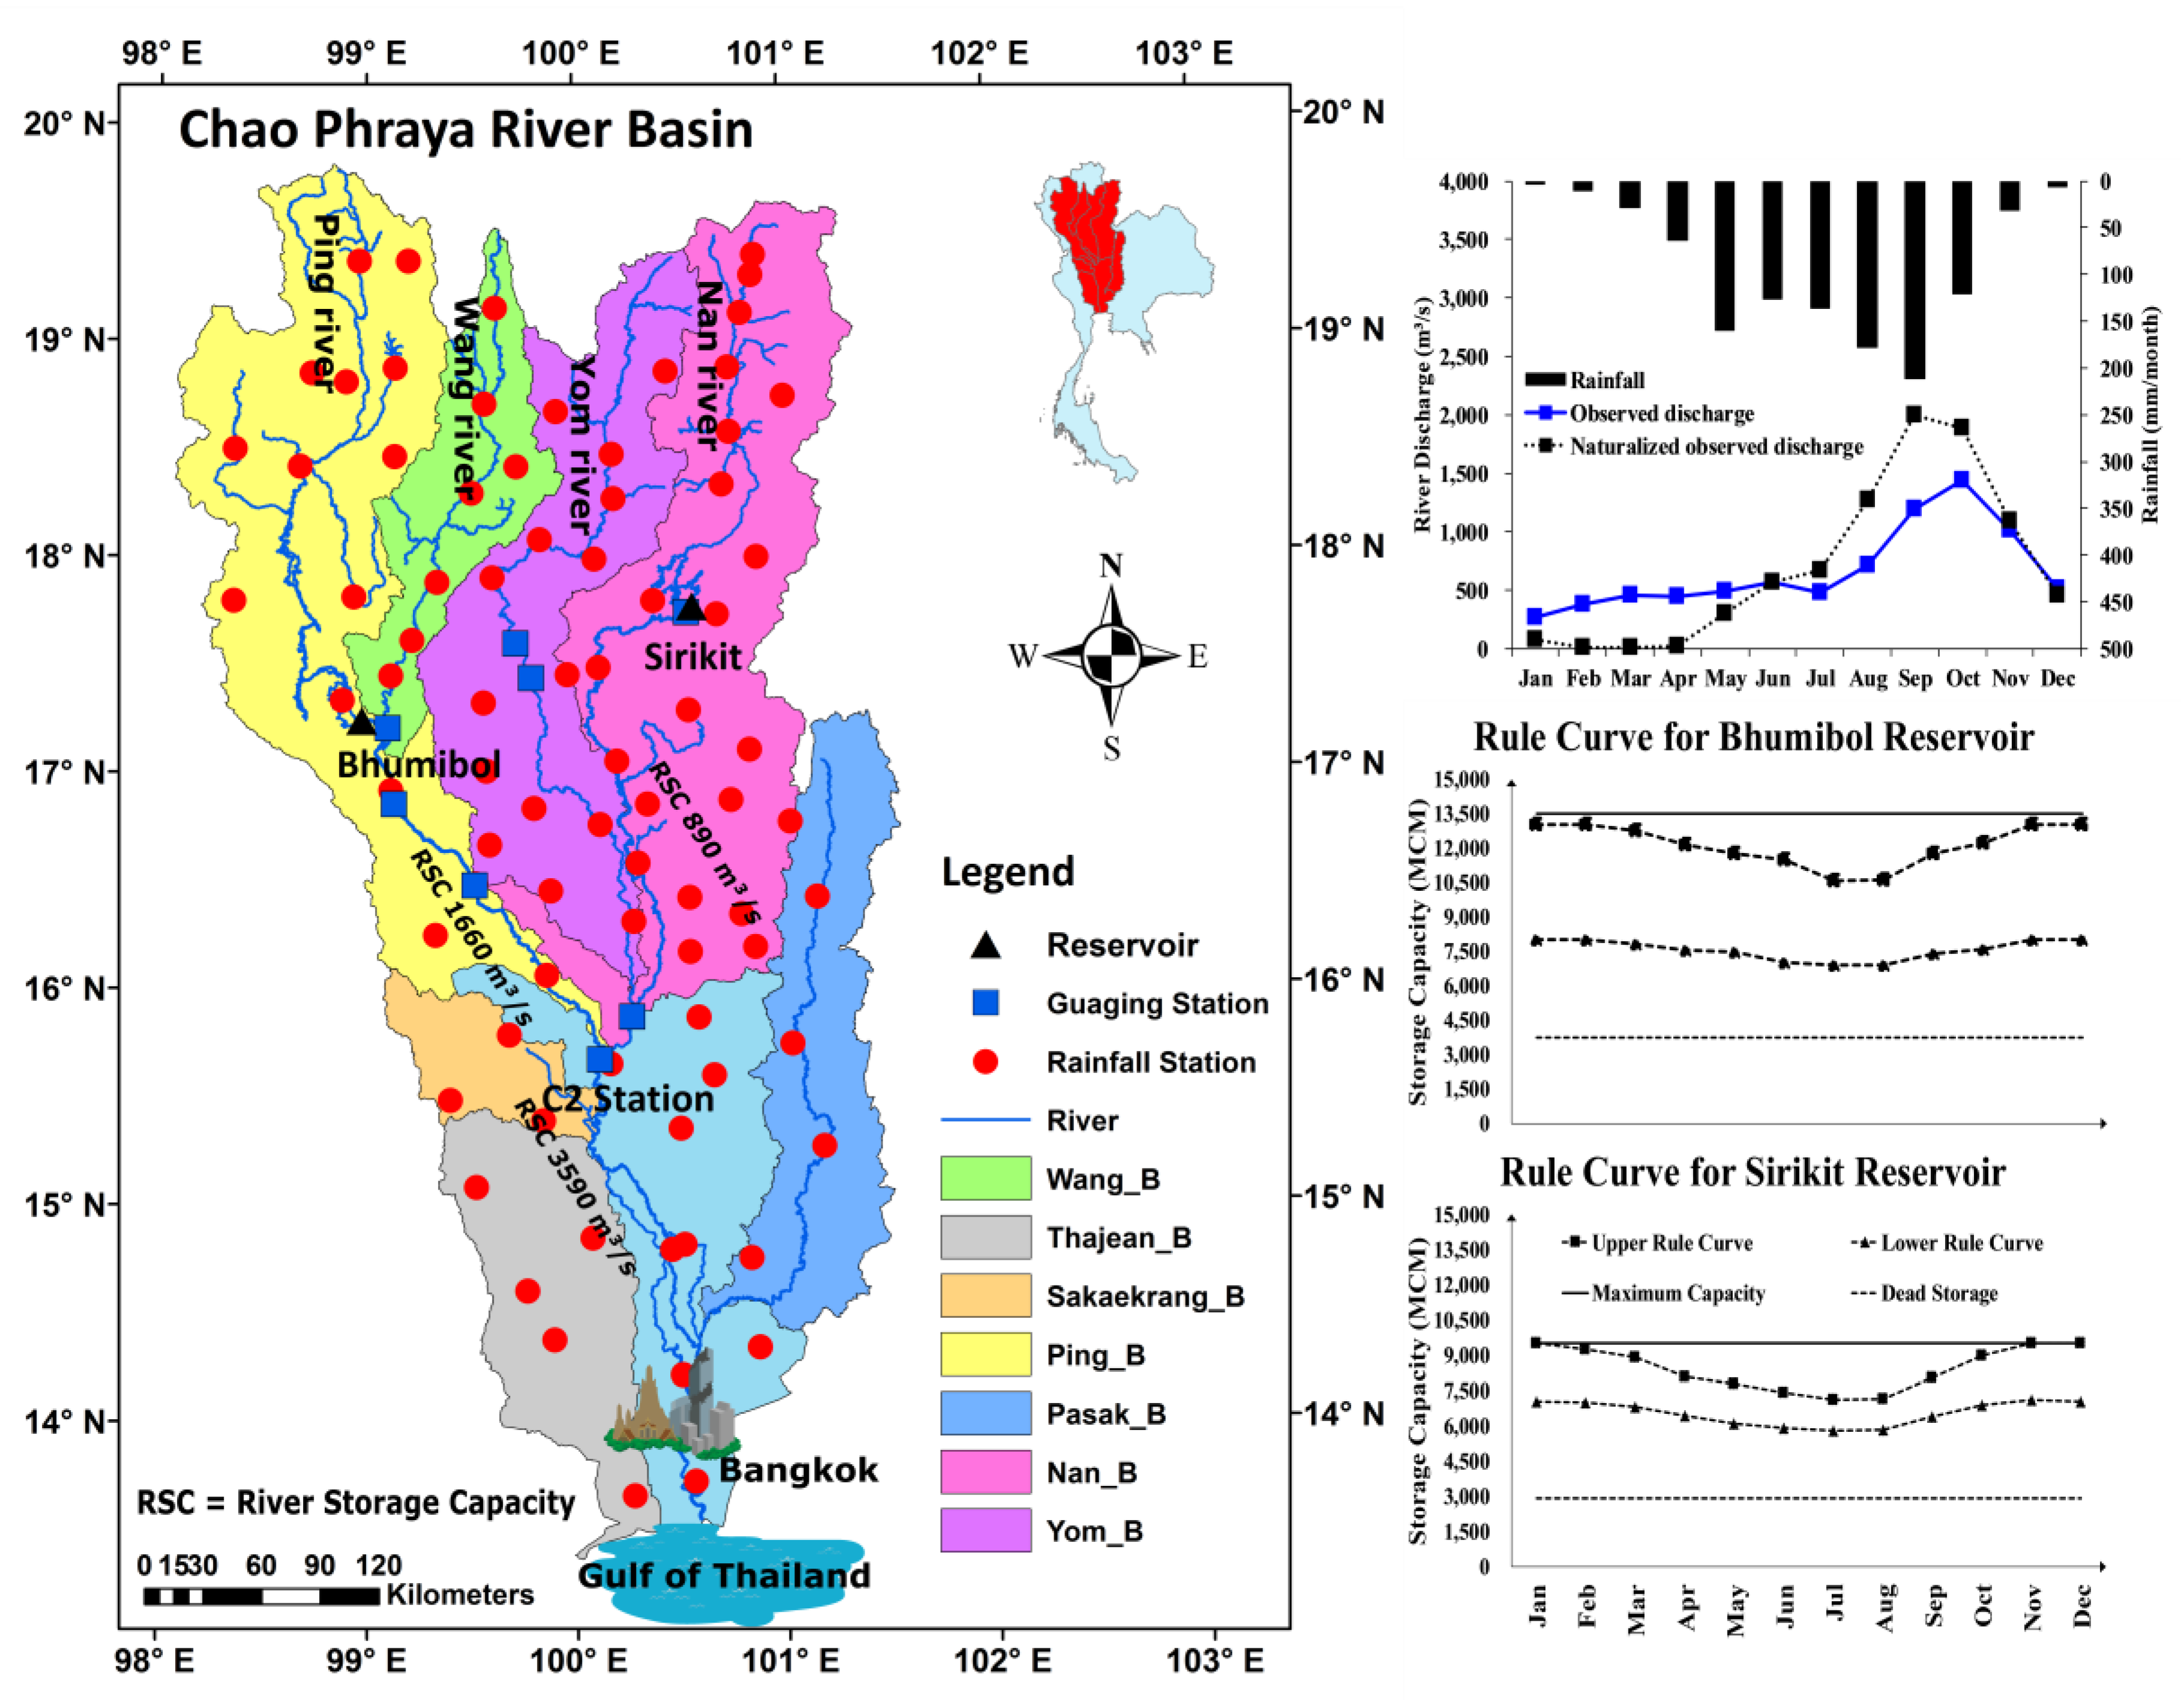
2.1. Study Area

The CPRB, which is located in central Thailand, is one of the largest river basins in the country, with an area of about 158,000 km2 (30% of Thailand’s area; see Figure 1). The CPRB has long supported the local community and economy. The Thai people have made use of the CPRB for transport, drainage, recreation, fishing, agriculture (in particular, rice), and as a source of water for centuries. Moreover, Bangkok is located downstream of the CPRB. The total number of households in the CPRB is 23.0 million (1996), and it accounts for 66% of Thailand’s gross domestic product (GDP) [27]. Given its importance, the impact of natural disasters on the Thai economy and society, in particular downstream of the CPRB, is significant. Figure 1 shows an overview of river operations for two major reservoirs in the CPRB. The maximum dam storage capacity of the Bhumibol reservoir (13,500 million centimeters; MCM) is greater than that of the Sirikit reservoir (9700 MCM). The representative discharge station for the CPRB is station C2. The river storage capacity, which is the lowest flow rate that indicates flooding, is 3590 m3/s.
Ping, Wang, Yom, and Nan, which are sub-basins of the CPRB, are located upstream. The Bhumibol and Sirikit reservoirs are located along the Ping and Nan Rivers, respectively. Water flows from the north of Thailand before reaching station C2, which is located at Nakorn Sawan. Downstream of the CPRB is the Gulf of Thailand. The dry season in the CPRB is from November to April, and the wet season is from May to October. To supply water in the dry season and mitigate flooding in the wet season, two large reservoirs were built with a combined storage capacity of 23 billion m3. The Bhumibol and Sirikit reservoirs play an essential role in water management in the CPRB. These two large reservoirs ensure that river discharge increases during the dry season and decreases in the wet season relative to the river discharge pattern without reservoirs (Figure 1). The period of peak river discharge in the CPRB is from September to October, because heavy rainfall usually occurs from August to September. Thus, the outflow from reservoirs is usually lower during the wet season from August to October than from May to July.

2.2. Data

Seasonal precipitation data generated with the European Centre for Medium-Range Weather Forecasts (ECMWF) System 5 [28] were used as input data. The resolution of these precipitation data is 1° in both latitude and longitude. The temporal resolution of seasonal precipitation is daily from 1993 to 2016. ECMWF System 5 predicts precipitation with a forecast range of six months and releases ensemble predictions on the first of each month. For each ECMWF System 5 prediction, 25 ensemble members are used. In this study, we selected a starting prediction month of June (the start of the wet season) and conducted seasonal precipitation prediction for July, August, and September.
Geographic data and meteorological forcing data, such as daily observed temperature, relative humidity, wind speed, wave radiation, and surface air pressure, were obtained from previous research [29,30]. Table 1 summarizes the input data used in this study. Precipitation data were reanalyzed from measurements from rain gauge stations. The spatial resolution of the reanalyzed precipitation data was 5 min. The temporal coverage of the observed input data was from 2010 to 2011.

2.3. Method

2.3.1. Hydrological Model

We used the H08 model [31] to simulate hydrological processes. The H08 model is a distributed global hydrological model that has been adapted and calibrated for application in the CPRB [6]. It consists of six sub-models, namely, land surface hydrology, river routing, reservoir operation, crop growth, environmental flow, and water abstraction. These six models can run separately, or coupled models can run all processes in an integrated manner. Because this study was focused on the use of seasonal predictive data for water management through reservoir operation, the land surface hydrology, river routing, and reservoir operation models were used.
The land surface hydrology model in H08 is based on the leaky bucket model [32,33]. It considers a single-layer bucket for all vegetation and soil types, predicting soil moisture to a depth of 15 cm. In the leaky bucket model, soil moisture drains continuously from the bucket, whereas in the original bucket model, runoff is generated only when the bucket is full.
The river routing model in the H08 model, known as total runoff integrated pathways (TRIP) [34], is an idealized global river channel network model. In this model, streamflow is calculated by summing the runoff from the land surface model while considering hydrologic routing. The river is depicted as a straight line with no cross-sectional component that flows at a constant velocity toward a downstream cell. Flow directions were determined from digital elevation models manually corrected using atlases [6]. The TRIP model does not consider lakes or swamps, reservoir operation, withdrawal, or losses to evaporation from water surfaces.
The reservoir operation model in the H08 model uses operating rules for individual reservoirs. In general, reservoirs can be classified as irrigation or non-irrigation reservoirs. For non-irrigation reservoirs, reservoir operation is planned to minimize variation in sub-annual and interannual streamflow. For irrigation reservoirs, the aim is to release water daily in proportion to the irrigation water requirements of the lower reaches. To simulate reservoir operation in the CPRB, we based the reservoir operation schedule on historical outflow data from the Bhumibol and Sirikit reservoirs. During the dry season, the Bhumibol and Sirikit reservoirs release water, whereas they store water during the wet season to mitigate flooding. The dry season in the CPRB runs from the beginning of January until May, whereas July to December is considered the wet season.
Important parameters, such as the bulk transfer coefficient and shape parameter in the land surface model, followed Mateo et al. [6]. We conducted our simulation on a daily time scale, with 5 min longitudinal and latitudinal grids. The domain of the CPRB ranged from 97° E to 102° E longitude and from 13° N to 20° N latitude.

2.3.2. Bias Correction

Prior to using the seasonal predictive data, we used a popular bias correction method, namely, quantile mapping, to increase the accuracy of rainfall prediction. The outputs from the climate model are usually produced at a coarse grid scale, which may lead to errors in capturing forecast uncertainty and introduce biases. Quantile mapping [35] was used to correct the cumulative distribution function between the observed rainfall data from 1987 to 2010 and the seasonal rainfall forecast data in the CPRB. The bias correction technique was applied to data in a grid-to-grid manner. Figure A4 and Figure A5 (in Appendix C) shows the comparison between observed rainfall data and the seasonal rainfall forecast after bias correction.

2.3.3. Adaptation of Reservoir Operation based on Predictive Data

Four parameters are essential to simulating reservoir operation in the reservoir operation sub-model of the H08 model: the rate of release during the dry season, the rate of release during the wet season, target storage, and the target storage date. In a previous study [6], target storage and the target storage date were altered to create an alternative reservoir operation schedule. However, when using predictions for adaptive reservoir operation each month, one can only control the rate of release. Moreover, reservoir operation, particularly during the wet season, is crucial for decision-making to mitigate flooding and storing the appropriate amount of water to support society. Thus, the difference between this study and previous research is that we changed the rates of release from the Bhumibol and Sirikit reservoirs for each month during the wet season based on the monthly predictive data.
Reservoir operation in this study occurred from June to October, because June and October are the first and last months of the wet season, respectively. Two alternative reservoir operations were adaptively applied, as shown in Figure 2. The first alternative operation was simply to follow the rule curve of each reservoir. We refer to this strategy as “PlanU” operation, because reservoir storage is limited by the upper rule curve. The second alternative operation was to follow a new rule curve proposed after the 2011 flood until the end of October. In addition, we set the target storage for each reservoir, which resembled the reservoir operation proposed in a previous study [6]. The second alternative operation is designated “PlanM” operation here. The main difference between the two plans is the amount of reservoir storage.
After the flooding of 2011, the rule curves of the reservoirs were changed (this is usually done once per decade) from the dashed line with squares to the dashed line with triangles shown in Figure 2. If the water manager controls the water level using the rule curve, the maximum reservoir storage available during the wet season to support the dry season is about 15,350 MCM: about 8750 MCM in the Bhumibol reservoir and about 6600 MCM in the Sirikit reservoir. In addition, the water demand in the CPRB [36] is about 11,377 MCM per year. Thus, the target storage level to meet water demand can be attained if the Bhumibol and Sirikit reservoirs meet about 78% and 87% of their total storage capacities, respectively. Therefore, the purpose of PlanM is to prevent overflow at both reservoirs by setting the target storage level, thereby mitigating flooding.
Figure 3 shows a sample study operation plan based on seasonal predictions, which is applied at the monthly scale. First, we used predictive data to simulate reservoir storage and river discharge as shown in the prediction box of Figure 3. Then, we determined the reservoir operation as follows:
(1) No change in reservoir operation if most reservoir storage predictive data (more than 50% of the total ensemble predictions) fall between the upper rule curve and lower rule curve.
(2) Increase the rate of outflow until most reservoir storage is below the upper rule curve if most predicted reservoir storage is above the upper rule curve.
(3) Decrease the rate of outflow until most reservoir storage is above the lower rule curve if most predicted reservoir storage is below the lower rule curve.
(4) Stop increasing the rate of outflow if most river discharge predictions are above the river storage capacity at station C2 in that month.
As shown in Figure 3, most predicted reservoir storage in Bhumibol reservoir (left figure in prediction box of Figure 3) fell above the upper rule curve. Thus, we changed the operation plan by increasing the rate of outflow from the Bhumibol reservoir. Meanwhile, most predicted reservoir storage in Sirikit (right figure in prediction box of Figure 3) fell below the lower rule curve. Thus, we changed the operation plan by reducing the rate of outflow from the Sirikit reservoir. The results after we changed the reservoir operation are represented by the red line in the operation box of Figure 3. Then we used the new rates of outflow from both reservoirs to simulate the next prediction month.

3. Results

3.1. Reliability of the Predictive Data

Simulations from 25 ensembles for river discharge using the original ECMWF System 5 predictive data and bias-corrected predictive data are shown in Figure 4, with a zero-month lead-time from June to October. We selected results with a zero-month lead-time because we operated the reservoir at monthly intervals. The initial conditions for simulating the zero-month lead time predated the prediction month. For example, we used the initial prediction in May for the June prediction. A comparison of daily discharge between the observed data and predictive data using the original ensemble is shown in Figure 4a. The ensemble simulation of river discharge using the original ECMWF System 5 predictions (Figure 4a) is generally higher than the observed river discharges. During the peak period in October, simulations using the original ECMWF prediction were higher than the observed data, including the Thai operation simulation. A comparison of predictive data using the bias-corrected ensemble is shown in Figure 4b. The ensemble simulation of river discharge using bias-corrected predictive data showed improved accuracy compared with ensemble simulation of river discharge using the original ECMWF prediction.
The ensemble simulation results for river discharge using the bias correction technique were lower than those for Thai operation (red line in Figure 4) but still higher than the observed data. The reason for these differences is that 2011 was an abnormal year, and Thailand had not previously experienced an extreme event like the 2011 flooding. Thus, when we apply a bias correction to historical data, the predicted results are underestimates. Overall, the accuracy of the ensemble river discharge prediction was improved with the quantile mapping bias correction technique. We used the root mean square error (RMSE), relative mean error (RME), coefficient of variation of the RMSE (CV), Nash–Sutcliffe efficiency (NSE), and coefficient of determination (R2) to determine the accuracy. The results for each accuracy index are shown in Figure 5. The zero-month lead-time prediction improved after bias correction; in particular, the NSE showed a significant improvement. However, some months, such as August, had lower accuracy after bias correction, because the simulation used original predictive data similar to the observed data, in particular in 2010.
The simulation results using the bias-corrected predictive data were underestimates, in particular for extreme events such as the 2011 flood. The underestimation of simulated discharge after bias correction has been reported in previous studies [37]. This problem is caused by the bias correction itself, which uses previous observations to correct the predictive data. Thus, bias correction does not always improve the accuracy of predictive data, particularly for extreme events.

3.2. Adaptive Operation Using Predictive Data for 2011

Reservoir storage predictions from June are shown in Figure 6. No change in reservoir operation occurred in June, because most reservoir storage predictions (more than 50% of the total ensemble predictions) fell between the rule curves of both the Bhumibol and Sirikit reservoirs. Although the first prediction month for the Sirikit reservoir fell below the rule curve, most reservoir storage predictions were within that range at the end of December. Prediction of river discharge for July at station C2 is shown in Figure 7a. Figure 7b,c shows predictions of reservoir storage for July at the Bhumibol and Sirikit reservoir. The tendency for the risk of reservoir storage to be above the maximum capacity is apparent. However, most ensemble predictions remained under the upper rule curve in both reservoirs. Therefore, no changes in the rate of outflow from either reservoir were made in July. Thus, no difference was observed between adaptive operation using predictive data and adaptive operation without predictive data, as shown in Figure 7.
Predictive data without adaptive operation, shown in Figure 8, indicated that most ensemble predictions were higher than the upper rule curve and reached the maximum capacity of both reservoirs (Figure 8b,c). Based on this result, we increased the rate of outflow from the two reservoirs until most ensemble predictions for reservoir storage (more than 50% of the total ensemble predictions) fell between the rule curves. The results after we increased the rate of outflow from both reservoirs are shown as a red dashed line. As a result of the increased rate of outflow in August, river discharge increased after adaptive operation using predictive data, as indicated by the pink line in Figure 8b,c, which shows that most ensemble predictions after adaptive operation fell between the rule curves.
The ensemble predictive data for September, in which we used the increased rate of outflow in August for simulation, are shown in Figure 9a–c. No adaptive operation was conducted in the Bhumibol and Sirikit reservoirs, because most ensemble predictions for reservoir storage were within the range of the rule curves. The results of ensemble prediction without adaptive operation and with adaptive operation using predictive data are presented in Figure 9a–c. Because no change in operation occurred in September, there was no difference in September.
The discharge predictions for September tended to decrease from the beginning to the middle of the month. The reason for this could related to the discharge from the upstream area, which was controlled by the two reservoirs. In addition, the amount of rainfall began to decrease in September relative to August. For this reason, the discharge predictions increased rapidly after the middle of the month because dam storage reached its maximum capacity in both reservoirs; that is, the sudden increase in predicted discharge in September was due to concurrent changes in the rates of release from both reservoirs. Because peak discharge is in October, the rate of outflow cannot change in October. Thus, September was the last month in which reservoir operations could be conducted.

3.3. Adaptive Operation Using Predictive Data Based on PlanM Operation

The operating conditions for this simulation were the same as those for the previous simulation, which are explained in Section 2.3.3. The upper rule curve of PlanM is represented with an orange line as shown in Figure 2. Thus, most ensemble predictions for reservoir storage had to fall under the orange line and above the lower rule curve. The prediction period began in June.
The results of adaptive operation with predictive data beginning in July are shown in Figure 10. As shown in Figure 10b,c, most ensemble predictions for reservoir storage were higher than the target storage (orange dashed line). Therefore, we increased the rate of outflow from both reservoirs in July until the ensemble prediction for reservoir storage was under the target storage level (orange dashed line) and above the lower rule curve shown in Figure 10a–c. The difference relative to before the adaptive operation is shown with a pink line.
We used the rate of release after adaptive operation using predictive data to obtain predictions for August, as shown in Figure 11a–c. Most ensemble predictions of reservoir storage were higher than the target storage level (orange dashed line) in both reservoirs. Thus, we increased the rate of outflow in August until most ensemble predictions for reservoir storage (more than 50% of the total ensemble predictions) were under the target storage level (orange dashed line) and above the lower rule curve. The results after adaptive operation using predictive data from PlanM for August are represented by the orange dashed lines in Figure 11a–c. We increased the rate of outflow from the two reservoirs until the ensemble prediction for reservoir storage was near the lower rule curve and near the river storage capacity at station C2. However, most ensemble predictions remained higher than the target storage of the Bhumibol and Sirikit reservoirs (orange dashed line). Nonetheless, most ensemble predictive data fell between the rule curves for both reservoirs.
The prediction results for September are shown in Figure 12. No adaptive operation was conducted based on predictive data, although most ensemble predictions for reservoir storage were higher than the target storage level (orange dashed line). River discharge in September tended to decrease from the beginning until the middle of the month. The reason for this could be related to the discharge from upstream, which was controlled by the two reservoirs. In addition, the amount of rainfall in September began to decrease relative to August. Thus, the discharge predictions after the middle of the month increased rapidly because the dam storage of both reservoirs reached maximum capacity. No adaptive operation was undertaken in October, because October is the month of peak discharge. Thus, September was the last month of adaptive operation.

4. Discussion

This study updated the previous work of Mateo et al. [6] to develop a method for using seasonal streamflow predictive information to support adaptive reservoir operation. This previous study [6] showed promising results for successful mitigation of the 2011 flood without using predictive information. The authors showed the 2011 flood could have been mitigated by releasing stored water during the early wet season, thus giving reservoirs sufficient storage capacity to retain a greater volume of water during the peak period. However, more benefit could be gained by using seasonal predictive information to support reservoir operations. In reality, reservoirs, particularly in Thailand, cannot always release water during the early wet season because water stored during the wet season is held to support society during the dry season. Thus, the significant difference between models with and without predictive information is that the use of predictive information allows water managers to make more suitable decisions to derive the best benefits for society.
Previous studies [38,39,40] used ensemble streamflow prediction to design reservoir operations in snow-dominated river basins. These studies used long-term streamflow prediction. The major difference between these previous studies [38,39,40] and the current study is the river basin characteristics, because the CPRB, which is located in Thailand, is not affected by snow. In addition, the rule curve is commonly used by Thai water managers to operate reservoirs. Thus, our study used the benefits of the rule curve and seasonal predictive information to support reservoir operation.
An annual comparison of reservoir operation with and without the use of predictive information is presented in Figure 13. The green line represents simulated river discharge in 2011 when predictive data were not used to manage operations. The red and orange lines represent simulated river discharge using predictive data based on 2011 operation and PlanM. When predictive information was used, the peak river discharge was significantly lower because the rate of outflow was increased to prevent overflow from both reservoirs as shown in Figure A1 of Appendix A. However, reservoir storage was above the maximum level at the end of October as shown in Figure A2 of Appendix A. The increased rate of outflow could also delay the overflow: Because river discharge in the CPRB peaks at the beginning of October, peak river discharge was lower with the use of predictive information than without it. Furthermore, the river discharge based on PlanM tended to be lower than that based on 2011 operation.
By applying seasonal predictions from June to September based on 2011 operation, we mitigated the 2011 flood by around 4%. When we changed the reservoir operation strategy from PlanU to PlanM, we mitigated the 2011 flood by around 8%. When reservoir operation was based on PlanM with predictive data, about 20% of the 2011 flood was mitigated. The reason why reservoir operation under PlanM mitigated the 2011 flood better than under PlanU was that we reduced the maximum target storage of both reservoirs to prevent overflow. In addition, we used predictive data representing river discharge and storage results from the start of the prediction period until the end of 2011. Thus, we mitigated flooding by applying seasonal predictions. Nonetheless, overflow from both reservoirs occurred with every reservoir operation at the end of September. However, the overflow time and length were delayed and shifted with changes in target storage. The amount of water was depleted in both reservoirs prior to the huge increase in supply around August to October. Thus, decreasing the amount of dam storage to prevent overflow using the predictive method reported in this study can mitigate flooding, particularly if the upper rule curve is lowered to reach the target storage level. Figure A3 (in Appendix B) shown the comparison of peak discharge and percentage of peak discharge different from simulations.

5. Conclusions

This study updates previous studies, in which various reservoir operations for flood mitigation were proposed, using ECMWF predictive information to support adaptive reservoir operation. We developed a method for applying seasonal predictions from the ECMWF, demonstrating the use of predictive information for adaptive reservoir operation in the CPRB in Thailand. We used model H08, a distributed hydrological model with a reservoir module, to obtain predictions of river discharge and reservoir storage with a six-month prediction period. In addition, we used two different operating plans to compare river discharge results. The first (PlanU) was simply to follow the 2011 operation schedule, which followed the 2011 rule curve. The second (PlanM) resembled reservoir operations described in a previous study, in which the maximum target storage in 2011 was reduced. The results for river discharge based on seasonal predictions obtained using PlanU showed that seasonal predictive information could be useful for flood mitigation and slightly decreased the peak river discharge, by about 4%, for 2011. In contrast, the results for PlanM showed that peak river discharge was reduced by about 20% relative to the observed 2011 river discharge. The reservoir operation under PlanM, which set target storage levels for each reservoir, tended to make each reservoir release its storage earlier than those under PlanU. That is, a combination of seasonal prediction and PlanM best mitigated flooding.

Author Contributions

Conceptualization, W.K. and S.K.; methodology, W.K.; validation, W.K., S.Y. and S.K.; software, W.K.; formal analysis, W.K.; data curation, W.K.; writing—original draft preparation, W.K.; writing—review and editing, W.K., S.Y. and S.K.; supervision, S.K.; project administration, S.K.; funding acquisition, S.K. All authors have read and agreed to the published version of the manuscript.

Funding

This research was supported by Japan Society for Promotion of Science (JSPS) Grant-in-Aid for Scientific Research (JSPS KAKENHI Grant Numbers 16H06291).

Acknowledgments

The first author is very grateful to Dhanapala Arachindra Sachindra and Natsuki Yshida. This research was supported partially by the Japan Science and Technology Agency/Japan International Cooperation Agency, and the Science and Technology Research Partnership for Sustainable Development (JST/JICA, SATREPS).

Conflicts of Interest

The authors declare no conflict of interest.

Appendix A

Figure A1 shows simulated outflow from the Bhumibol and Sirikit reservoirs in 2011 under PlanU and PlanM operations. The results for outflow using seasonal predictions are indicated by the red and blue lines for PlanU and PlanM, respectively. Because it used seasonal predictions, the rate of outflow under PlanU was elevated only in August, whereas that under PlanM was elevated in both July and August. Because the increased rate of outflow was higher in July and August when seasonal predictive data were used, as shown in Figure A1 for both reservoirs, reservoir storage in July and August was lower under PlanM, which used seasonal predictive data, than under PlanU, as shown in Figure A2. In addition, adaptive operation following PlanM slightly lowered reservoir storage compared to PlanU. However, adaptive operation under PlanM using seasonal predictions lowered reservoir storage, which in turn mitigated flooding during the peak flow period in October, more than adaptive operation under PlanU.
Figure A1. Comparison of outflow at (a) Bhumibol dam and (b) Sirikit dam, showing simulated outflow using PlanU operation in 2011 (green line) and simulated discharge using PlanM operation in 2011 (blue line): (1) after adaptive operation using predictive data based on 2011 operations (red line) and (2) after adaptive operation using predictive data based on PlanM (yellow line).
Water 12 03210 g0a1
Figure A2. Comparison of dam storage at (a) Bhumibol dam and (b) Sirikit dam, showing simulated dam storage using PlanU operation in 2011 (green line) and simulated discharge using PlanM operation in 2011 (blue line): (1) after adaptive operation using predictive data based on 2011 operations (red line): and (2) after adaptive operation using predictive data based on PlanM (yellow line). The yellow dash line shows the target storage of PlanM in this study.
Water 12 03210 g0a2

Appendix B

Figure A3 compares simulated discharge at station C2 in 2011. Overall, adaptive operation under PlanM reduced peak discharge. Moreover, PlanM operation using seasonal predictions mitigated flooding in 2011.
Figure A3. Comparison of peak discharge (blue bar color) and percentage of peak discharge different from simulation (red bar color) between peak simulated discharge using PlanU operation and simulated discharge using PlanM operation in 2011 and simulated discharge: (1) after adaptive operation using predictive data and (2) after adaptive operation using predictive data by PlanM.
Water 12 03210 g0a3

Appendix C

Figure A4 shows the results for seasonal rainfall prediction after bias correction from June, July, August, and September until December 2011. The results are on a daily time scale. Figure A5 shows scatter plots of observed rainfall (y-axis) and predicted rainfall (x-axis) and the ensemble range for June until December, with panels showing different prediction lead times. For example, panel (d) in Figure A5 shows a scatter plot of observed and predicted rainfall, with yellow, red, blue, and green representing rainfall predictions for September with 0, 1, 2, and 3 month lead times, respectively.
Based on these results, rainfall predictions tended to be underestimated relative to observed rainfall data. From these results, the adaptive reservoir operation, which increased the outflow rate from reservoirs, only occurred during August when using PlanU to operate in this study. In addition, adaptive reservoir operation could be started prior to August to mitigate flooding in 2011 if the rainfall prediction was more accurate.
Figure A4. Comparison of daily rainfall data, showing observed rainfall (blue line), ensemble seasonal rainfall predictions (light pink dashed line), and average ensemble seasonal rainfall prediction (pink line). Rainfall predictions from: (a) June until December 2011, (b) July until December 2011, (c) August until December 2011, and (d) September until December 2011.
Water 12 03210 g0a4
Figure A5. Scatter plot of monthly rainfall data, showing observed rainfall (y-axis) and average rainfall prediction (x-axis) with ensemble seasonal rainfall predictions (colored lines). Rainfall predictions for (a) June 2011, (b) July 2011, (c) August 2011, (d) September 2011, and (e) October 2011.
Water 12 03210 g0a5aWater 12 03210 g0a5b

References

  1. Mercer, J.; Kelman, I.; Taranis, L.; Suchet-Pearson, S. Framework for integrating indigenous and scientific knowledge for disaster risk reduction. Disasters 2009, 34, 214–239. [Google Scholar] [CrossRef]
  2. Fadul, E.; Masih, I.; De Fraiture, C. Adaptation strategies to cope with low, high and untimely floods: Lessons from the Gash spate irrigation system, Sudan. Agric. Water Manag. 2019, 217, 212–225. [Google Scholar] [CrossRef]
  3. Tasseff, B.; Bent, R.; Van Hentenryck, P. Optimization of Structural Flood Mitigation Strategies. Water Resour. Res. 2019, 55, 1490–1509. [Google Scholar] [CrossRef]
  4. Berhane, G.; Gebreyohannes, T.; Martens, K.; Walraevens, K. Overview of micro-dam reservoirs (MDR) in Tigray (northern Ethiopia): Challenges and benefits. J. Afr. Earth Sci. 2016, 123, 210–222. [Google Scholar] [CrossRef]
  5. Ehteram, M.; Mousavi, S.-F.; Karami, H.; Farzin, S.; Emami, M.; Othman, F.; Amini, Z.; Kisi, O.; El-Shafie, A. Fast convergence optimization model for single and multi-purposes reservoirs using hybrid algorithm. Adv. Eng. Informatics 2017, 32, 287–298. [Google Scholar] [CrossRef]
  6. Mateo, C.M.; Hanasaki, N.; Komori, D.; Tanaka, K.; Kiguchi, M.; Champathong, A.; Sukhapunnaphan, T.; Yamazaki, D.; Oki, T. Assessing the impacts of reservoir operation to floodplain inundation by combining hydrological, reservoir management, and hydrodynamic models. Water Resour. Res. 2014, 50, 7245–7266. [Google Scholar] [CrossRef]
  7. Ehsani, N.; Vorosmarty, C.; Fekete, B.; Stakhiv, E.Z. Reservoir operations under climate change: Storage capacity options to mitigate risk. J. Hydrol. 2017, 555, 435–446. [Google Scholar] [CrossRef]
  8. Liu, H.; Deng, B.; Liu, Y.; Jiang, C.; Wu, Z.; Long, Y. Preliminary Numerical Analysis of the Efficiency of a Central Lake Reservoir in Enhancing the Flood and Drought Resistance of Dongting Lake. Water 2018, 10, 225. [Google Scholar] [CrossRef] [Green Version]
  9. Murray, V.; Ebi, K.L. IPCC Special Report on Managing the Risks of Extreme Events and Disasters to Advance Climate Change Adaptation (SREX). J. Epidemiol. Community Health 2012, 66, 759–760. [Google Scholar] [CrossRef]
  10. Komori, D.; Nakamura, S.; Kiguchi, M.; Nishijima, A.; Yamazaki, D.; Suzuki, S.; Kawasaki, A.; Oki, K.; Oki, T. Characteristics of the 2011 Chao Phraya River flood in Central Thailand. Hydrol. Res. Lett. 2012, 6, 41–46. [Google Scholar] [CrossRef]
  11. Gale, E.L.; Saunders, M.A. The 2011 Thailand flood: Climate causes and return periods. Weather 2013, 68, 233–237. [Google Scholar] [CrossRef] [Green Version]
  12. World Bank Group. Available online: https://openknowledge.worldbank.org/handle/10986/26862 (accessed on 3 October 2020).
  13. Suiadee, W.; Tingsanchali, T. A combined simulation–genetic algorithm optimization model for optimal rule curves of a reservoir: A case study of the Nam Oon Irrigation Project, Thailand. Hydrol. Process. 2007, 21, 3211–3225. [Google Scholar] [CrossRef]
  14. Pinthong, P.; Das Gupta, A.; Babel, M.S.; Weesakul, S. Improved Reservoir Operation Using Hybrid Genetic Algorithm and Neurofuzzy Computing. Water Resour. Manag. 2008, 23, 697–720. [Google Scholar] [CrossRef]
  15. Wichakul, S.; Tachikawa, Y.; Shiiba, M.; Yorozu, K. DEVELOPING A REGIONAL DISTRIBUTED HYDROLOGICAL MODEL FOR WATER RESOURCES ASSESSMENT AND ITS APPLICATION TO THE CHAO PHRAYA RIVER BASIN. J. Jpn. Soc. Civ. Eng. Ser. B1 (Hydraul. Eng.) 2013, 69, I_43–I_48. [Google Scholar] [CrossRef] [Green Version]
  16. Wichakul, S.; Tachikawa, Y.; Shiiba, M.; Yorozu, K. Development of a Flow Routing Model Including Inundation Effect for the Extreme Flood in the Chao Phraya River Basin, Thailand 2011. J. Disaster Res. 2013, 8, 415–423. [Google Scholar] [CrossRef]
  17. Viel, C.; Beaulant, A.-L.; Soubeyroux, J.-M.; Céron, J.-P. How seasonal forecast could help a decision maker: An example of climate service for water resource management. Adv. Sci. Res. 2016, 13, 51–55. [Google Scholar] [CrossRef] [Green Version]
  18. Long, Y.; Wang, H.; Jiang, C.; Ling, S. Seasonal Inflow Forecasts Using Gridded Precipitation and Soil Moisture Information: Implications for Reservoir Operation. Water Resour. Manag. 2019, 33, 3743–3757. [Google Scholar] [CrossRef]
  19. Prasanchum, H.; Kangrang, A. Optimal reservoir rule curves under climatic and land use changes for Lampao Dam using Genetic Algorithm. KSCE J. Civ. Eng. 2017, 29, 1247–1364. [Google Scholar] [CrossRef]
  20. Kangrang, A.; Prasanchum, H.; Hormwichian, R. Development of Future Rule Curves for Multipurpose Reservoir Operation Using Conditional Genetic and Tabu Search Algorithms. Adv. Civ. Eng. 2018, 2018, 1–10. [Google Scholar] [CrossRef] [Green Version]
  21. Harrigan, S.; Prudhomme, C.; Parry, S.; Smith, K.; Tanguy, M. Benchmarking ensemble streamflow prediction skill in the UK. Hydrol. Earth Syst. Sci. 2018, 22, 2023–2039. [Google Scholar] [CrossRef] [Green Version]
  22. Schaake, J.C.; Hamill, T.M.; Buizza, R.; Clark, M. HEPEX: The Hydrological Ensemble Prediction Experiment. Bull. Am. Meteorol. Soc. 2007, 88, 1541–1548. [Google Scholar] [CrossRef]
  23. Fang, G.; Yang, J.; Chen, Y.; Zammit, C. Comparing bias correction methods in downscaling meteorological variables for a hydrologic impact study in an arid area in China. Hydrol. Earth Syst. Sci. 2015, 19, 2547–2559. [Google Scholar] [CrossRef] [Green Version]
  24. Li, Y.; Jiang, Y.; Lei, X.; Tian, F.; Duan, H.; Lu, H. Comparison of Precipitation and Streamflow Correcting for Ensemble Streamflow Forecasts. Water 2018, 10, 177. [Google Scholar] [CrossRef] [Green Version]
  25. Lucatero, D.; Madsen, H.; Refsgaard, J.C.; Kidmose, J.; Jensen, K.H. Seasonal streamflow forecasts in the Ahlergaarde catchment, Denmark: The effect of preprocessing and post-processing on skill and statistical consistency. Hydrol. Earth Syst. Sci. 2018, 22, 3601–3617. [Google Scholar] [CrossRef] [Green Version]
  26. Crochemore, L.; Ramos, M.-H.; Pappenberger, F. Bias correcting precipitation forecasts to improve the skill of seasonal streamflow forecasts. Hydrol. Earth Syst. Sci. 2016, 20, 3601–3618. [Google Scholar] [CrossRef] [Green Version]
  27. Office of Natural Water Resources Committee (ONWRC) of Thailand Working Group. Available online: http://www.unesco.org/new/fileadmin/MULTIMEDIA/HQ/SC/pdf/wwap_Thailand_case%20studies1_EN.pdf (accessed on 3 October 2020).
  28. Johnson, S.J.; Stockdale, T.N.; Ferranti, L.; Balmaseda, M.A.; Molteni, F.; Magnusson, L.; Tietsche, S.; Decremer, D.; Weisheimer, A.; Balsamo, G.; et al. SEAS5: The new ECMWF seasonal forecast system. Geosci. Model Dev. 2019, 12, 1087–1117. [Google Scholar] [CrossRef] [Green Version]
  29. Yoshimura, K.; Sakimura, T.; Oki, T.; Kanae, S.; Seto, S. Toward flood risk prediction: A statistical approach using a 29-year river discharge simulation over Japan. Hydrol. Res. Lett. 2008, 2, 22–26. [Google Scholar] [CrossRef] [Green Version]
  30. Kotsuki, S.; Tanaka, K.; Kojiri, T.; Hamaguchi, T. The Water Budget Analysis with Land Surface Model in Chao Phraya River Basin. In Proceedings of the 23rd annual conference, Japan Society of Hydrology and Water Resources, Tokyo, Japan, 8 September 2010; pp. 44–45. [Google Scholar]
  31. Hanasaki, N.; Kanae, S.; Oki, T.; Masuda, K.; Motoya, K.; Shirakawa, N.; Shen, Y.; Tanaka, K. An integrated model for the assessment of global water resources – Part 1: Model description and input meteorological forcing. Hydrol. Earth Syst. Sci. 2008, 12, 1007–1025. [Google Scholar] [CrossRef] [Green Version]
  32. Manabe, S. CLIMATE AND THE OCEAN CIRCULATION. Mon. Weather. Rev. 1969, 97, 775–805. [Google Scholar] [CrossRef]
  33. Robock, A.; Vinnikov, K.Y.; Schlosser, C.A.; Speranskaya, N.A.; Xue, Y. Use of Midlatitude Soil Moisture and Meteorological Observations to Validate Soil Moisture Simulations with Biosphere and Bucket Models. J. Clim. 1995, 8, 15–35. [Google Scholar] [CrossRef]
  34. Oki, T.; Sud, Y.C. Design of Total Runoff Integrating Pathways (TRIP)—A Global River Channel Network. Earth Interactions 1998, 2, 1. [Google Scholar] [CrossRef]
  35. Themeßl, M.J.; Gobiet, A.; Heinrich, G. Empirical-statistical downscaling and error correction of regional climate models and its impact on the climate change signal. Clim. Chang. 2012, 112, 449–468. [Google Scholar] [CrossRef]
  36. Thaiwater. Available online: https://www.thaiwater.net/web/attachments/25basins/10-chaopraya.pdf (accessed on 3 October 2020).
  37. Cannon, A.J.; Sobie, S.R.; Murdock, T.Q. Bias Correction of GCM Precipitation by Quantile Mapping: How Well Do Methods Preserve Changes in Quantiles and Extremes? J. Clim. 2015, 28, 6938–6959. [Google Scholar] [CrossRef]
  38. Anghileri, D.; Voisin, N.; Castelletti, A.; Pianosi, F.; Nijssen, B.; Lettenmaier, D.P. Value of long-term streamflow forecasts to reservoir operations for water supply in snow-dominated river catchments. Water Resour. Res. 2016, 52, 4209–4225. [Google Scholar] [CrossRef] [Green Version]
  39. Alemu, E.T.; Palmer, R.N.; Polebitski, A.S.; Meaker, B. Decision Support System for Optimizing Reservoir Operations Using Ensemble Streamflow Predictions. J. Water Resour. Plan. Manag. 2011, 137, 72–82. [Google Scholar] [CrossRef]
  40. Voisin, N.; Hamlet, A.F.; Graham, L.P.; Pierce, D.W.; Barnett, T.P.; Lettenmaier, D.P. The Role of Climate Forecasts in Western U.S. Power Planning. J. Appl. Meteorol. Clim. 2006, 45, 653–673. [Google Scholar] [CrossRef]
Figure 1. Overview of flow direction, locations of reservoirs, gauging station, rainfall station, and hydrograph in the Chao Phraya River Basin at station C2; 30 year average (1981–2010) rainfall observations at the rainfall station (black bar), observed discharge (square box with blue line), and naturalized observed discharge (discharge without dam; square box with black dotted line).
Water 12 03210 g001
Figure 2. Reservoir operation in this study; PlanU (red line), and PlanM (yellow line).
Water 12 03210 g002
Figure 3. Methodology of this study.
Water 12 03210 g003
Figure 4. Comparison of daily discharge at station C2 between observations (black line), simulation results (red line), simulation results using ensemble predicted rainfall data (light blue dotted line), and the median of simulation data using ensemble predicted rainfall data (blue line). Simulation results using (a) the original European Centre for Medium-Range Weather Forecasts (ECMWF) System 5 ensemble predicted data; and (b) bias-corrected ensemble predictions.
Water 12 03210 g004
Figure 5. Scatter plot of accuracy indices between simulated daily discharge using the original predicted data (x-axis) and simulated daily discharge using quantile mapping (y-axis). (a) Root mean square error (RMSE); (b) coefficient of variation of the RMSE (CV); (c) relative mean error (RME); (d) Nash–Sutcliffe model efficiency coefficient (NSE); (e) coefficient of determination (R2); (f) correlation coefficient (CC).
Water 12 03210 g005
Figure 6. River discharge at station C2 (a) and reservoir storage predictions (green line) from June until December at the Bhumibol (b) and Sirikit (c) reservoir. Blue line represents simulation using observed meteorological data (hindcast). Black dashed line represents rule curve. Dash-point black line represents maximum storage capacity.
Water 12 03210 g006
Figure 7. River discharge predictions at station C2 (a) and storage predictions from July until December at the Bhumibol (b) and Sirikit (c) reservoir, shown with the green line, and river discharge and storage prediction after adaptive operation with predictive data from July until December (red dashed line).
Water 12 03210 g007
Figure 8. River discharge predictions at C2 station (a) and storage predictions from August until December at the Bhumibol (b) and Sirikit (c) reservoir, shown with the green line, and river discharge and storage predictions after adaptive operation with predictive data from August until December (red dashed line).
Water 12 03210 g008
Figure 9. River discharge predictions at C2 station (a) and storage predictions from September until December at the Bhumibol (b) and Sirikit (c) reservoir, shown with the green line, and river discharge and storage predictions after adaptive operation with predictive data from September until December (red dashed line).
Water 12 03210 g009
Figure 10. River discharge predictions at station C2 (a) and storage predictions from July until December at the Bhumibol (b) and Sirikit (c) reservoir, shown with the green line, and river discharge and storage predictions after adaptive operation with predictive data from July until December (orange dashed line).
Water 12 03210 g010
Figure 11. River discharge predictions at station C2 (a) and storage predictions from August until December at the Bhumibol (b) and Sirikit (c) reservoir, shown with the green line, and river discharge and storage prediction after adaptive operation with prediction data from August until December (orange dashed line).
Water 12 03210 g011
Figure 12. River discharge prediction at station C2 (a) and storage prediction from September until December at the Bhumibol (b) and Sirikit (c) reservoir, shown with the green line, and river discharge and storage prediction after adaptive operation with predictive data from September until December (orange dashed line).
Water 12 03210 g012
Figure 13. Comparison of river discharge, showing simulated discharge with PlanU operation in 2011 (green line), simulated discharge with PlanM operation in 2011 (blue line), and simulated discharge: (1) after adaptive operation based on 2011 operations using seasonal predictive data (red line) and (2) after adaptive operation based on PlanM using predictive data (orange line).
Water 12 03210 g013
Table 1. Summary table of data in this study.
Data TypeNameSourceResolutionData Length
Meteorological forcing dataSurface air pressure[29]1/12°
Every 6 h
2010–2011
Wind speed
Specific humidity
Shortwave and Longwave radiation
Temperature
RainfallRe-analysis 11/12°
Daily
2010–2011
ECMWF System 5 rainfall[28]
Daily
June–October 2011
Geographic dataGeographic map[30]1/12°-
Observed dataDischarge at station C2Royal Irrigation DepartmentDaily2011
Outflow and at the Bhumibol and Sirikit reservoirElectricity Generating Authority of Thailand (EGAT)
Dam storage
1 Data were reanalyzed by Prof. Kenji Tanaka et al. using observed precipitation data from the Royal Irrigation Department (RID) and Thai Meteorological Department (TMD).
Publisher’s Note: MDPI stays neutral with regard to jurisdictional claims in published maps and institutional affiliations.

