Abstract
This paper presents a qualitative approach for assessing land-use pressures on the water resources of a transboundary Dinaric karst catchment of the Kupa River in Southeast Europe. Spatial analyses of the water quality indices for surface water and groundwater were carried out in a GIS environment, as well as a detailed assessment of man-made hazards based on recommendations of COST Action 620. The produced maps provide an insight into the qualitative status of water resources at a regional scale by indicating areas of potential negative impacts of land use through the identification of point and diffuse sources of pollution. Higher values of the water quality indices for surface water and groundwater are observed in lowland areas, karst plateaus and poljes, where the impacts of anthropogenic activities such as agriculture and quarries take place on karstified permeable carbonate rocks. Hazard assessment showed how transport infrastructure induces a low hazard level. Settlement areas without proper sewerage systems impose moderate hazard levels, while direct wastewater discharges into groundwater and waste illegally disposed in karst swallow holes and caves located near settlements were classified as having high hazard levels. The applied methods proved to be suitable even in challenging karst environments where the complex properties and structure make the exploration and monitoring of groundwater resources difficult and scarce.
1. Introduction
Increasingly frequent weather extremes coupled with unsustainable land-use practices and exacerbated by spatially heterogeneous water resources allocation due to complex hydrogeological conditions, pose various challenges in terms of water quantity and quality. Driven by various socio-economic factors and affected by climate change, land-use changes have a negative impact on water resources, especially on vulnerable karst groundwater sources used for water supply [1,2]. Consequently, sustainable development that implies a synergy between economic and spatial growth, water resource management and protection objectives, while adapting to climate change, is of strategic importance for transboundary catchments like the Kupa (in Slovenian Kolpa) River basin [3]. To adequately manage and protect this part of the Danube River basin, decision-makers need to address ongoing water protection and flood risk issues not only at the local and national levels but also at the transnational level. The transnational efforts mentioned above were undertaken in the Interreg Danube Transnational Program CAMARO-D project, in which the partner institutions worked on advanced management routines for the impacts of land use on the water regime in the Danube River basin. As primary project results, the partnership elaborated “Guidance for the Danube Region on Sustainable Land-Use Planning” (GUIDR), followed by a “Transnational Catchment Based Concept for Land-Use Planning” (LUDP). Together, these documents serve as a basis for the appropriate coordination and harmonization of different function-oriented sustainable land-use management activities [4].
Faced with more frequent severe seasonal flooding, the population of the Kupa (Kolpa) River basin is still employing some of the inadequate land-use practices. These include urbanization, development, and agriculture in the flood plain; excessive use of pesticides; inappropriate or non-existent manure storage; inadequate use of heavy agricultural/forestry machinery and equipment; illegal waste dumpsites in karst swallow holes and caves; direct urban drainage into watercourses; and missing or inadequate sewerage systems due to dispersed settlements [5]. In addition, built hydro-technical objects significantly changed the hydrological system and water regime [6,7], which made the protection of water resources and flood mitigation even more challenging. Various legislative acts and protection instruments are proclaimed on multiple levels, to protect water resources through either a system of spatial planning or environmental protection [8,9,10,11]. However, their implementation alone is not sufficient to achieve good quantitative and qualitative water status. It is also necessary to raise awareness and promote the participation of all relevant decision-makers, practitioners, and the general public at the local, regional, and national levels. Thus, the CAMARO-D project focused on initiating site-specific innovative solutions in the form of best management practices based on the results of previously implemented pilot action activities such as hydrogeological field investigations, climate change modeling, and GIS-based hazard assessment and mapping.
The main objective of this paper is to present the results of the hazard assessment and, together with the mapping of the water quality index, to identify the karst areas in need of action, to contribute to the water resources protection, and to promote sustainable land-use management practices at the level of Kupa River basin. The water quality indices assessment carried out in this study was based on the methodology proposed by Čenčur Curk et al. [12] in the CC-WARE project, which was focused on the assessment of the vulnerability of water resources under climate change in Southeast Europe. This methodology has been applied in recent studies on a regional scale [13,14]. Furthermore, for the assessment of the hazards present within the Kupa River catchment the recommendations of COST Action 620 project “Vulnerability and risk mapping for the protection of carbonate (karst) aquifers” [15] were followed. The conceptual “European approach” developed with COST Action 620, which can be tailored to areas with different scales and various hydrogeological conditions, has proved to be one of the indispensable methods for producing vulnerability, hazard, and risk maps of karst aquifers [16,17,18,19].
2. Study Area
Located in the SE of Europe (Figure 1), Kupa (Kolpa) River catchment drains an area of approximately about 10,605 km2 and covers three neighboring countries: Croatia (79.32%), Slovenia (18.32%), and Bosnia and Herzegovina (2.36%) [20]. However, in this paper, Croatian (only karstic area –4505.02 km2) and Slovenian parts (1102.98 km2) of the catchment area are considered (5608 km2 in total). Most of the border between Slovenia and Croatia is not seen in Figure 1, as the border is the river Kupa (Kolpa) itself.
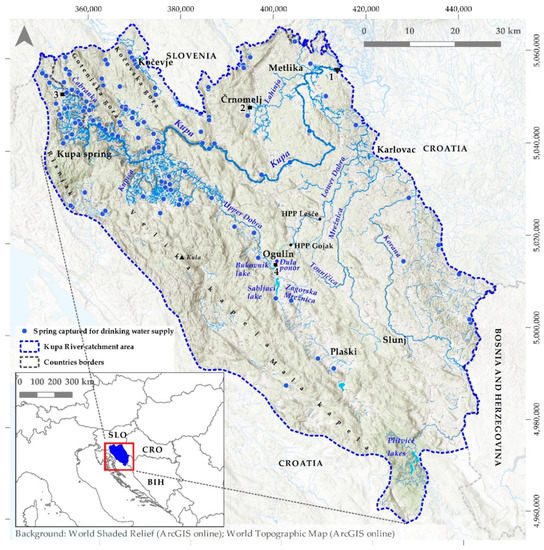
Figure 1.
Location of the study area ((1) hydrological station Kamanje; meteorological stations: (2) Črnomelj, (3) Parg, (4) Ogulin).
The river Kupa (Kolpa) (294.4 km long) is part of the Danube River basin. Due to the hydrogeological complexity of its karstic part, the exact catchment boundaries are difficult to determine. The SW catchment boundary, which represents the contact between the Adriatic Sea and the Danube River basins [3,6,21], and the N boundary in Slovenia are clearly defined with tracing experiments [22,23]. The NE boundary, which corresponds to the contact between the Dinarides and the Pannonian basin, was previously defined by several authors, namely Bura [24], Roglić [25], Herak [26], and Bogunović and Bensa [27]. The catchment boundary with Bosnia and Herzegovina is defined with the state border, as this part of the catchment area has not yet been sufficiently explored.
The distinctive spatial diversity of the catchment’s natural features is due to the mountainous forest karst areas of the Dinarides in SW, followed by the fluviokarst and further into the NE lowlands and the cultivated Karlovac alluvial plain (outside the study area). The altitude of the area ranges from about 100 m a.s.l. in the north to 1534 m a.s.l. of Kula the highest peak in the researched area located at Bjelolasica–Velika Kapela Mountain. The average altitude of the catchment area is about 520 m a.s.l., while the slope (gradient) reaches up to 75°. In general, the catchment’s morphology (e.g., mountain ranges and karst poljes) coincides with the so-called “Dinaric” northwest-southeast strike of the main geological structures.
The heterogeneous relief is one of the main factors that define the climate of the study area, which shows Mediterranean influence in the south, while in the northern parts a continental influence is present. According to the geographical distribution of Köppen’s climate types, the study area belongs mainly to a temperate humid climate with warm summers (type Cfb). In contrast, in the high mountain areas of both Croatia and Slovenia, the climate is humid boreal (type Df) [28,29]. A mean monthly air temperature is the highest in July and August and ranges from 16.9 °C (data period 1950–2018) for Parg (the station with the highest altitude of 863 m a.s.l.) [30] to 21.2 °C (data period 1981–2010) for the station Dobliče near Črnomelj (157 m a.s.l.) [31]. The minimum mean air temperature is measured for January and ranges from −1.5 °C for Parg to 0.3 for the station Ogulin (328 m a.s.l.) [30].
The abundant precipitation periods in autumn, winter, and spring generate most of the runoff in the upstream catchment area, while long summer periods are generally dry [32]. In the Slovenian part of the catchment area, the mean annual precipitation ranges from 1839 mm/year in the NW to 1089 mm/year in the NE [29]. Similarly, the mean annual precipitation in Croatia ranges from 1843 mm/year in the mountainous region of Gorski kotar to 1558 mm/year in Ogulin (central part of the study area) and 1101 mm/year in the lowland NE area [33].
As a result of spatially dynamic geomorphological settings (from mountainous to lowland areas) and contact of two climate types across the study area, the typology of discharge regimes of rivers is diverse. In highly karstified mountain massifs with plentiful karst phenomena, the surface hydrographic network is poorly developed, as the water infiltrates either dispersedly through numerous fissures or via sinkholes into the underground. The water is drained towards the abundant springs zone of Kupa River and its main tributaries of the upstream part: Čabranka, Lahinja, and Kupica. All these rivers (Kupa up to Kamanje station) are characterized by a Dinaric pluvial-nival regime, which implies two distinct annual discharge peaks, the first in spring and the second in autumn. The minimum discharges are observed in August, January, and February [34]. The Kupa begins its flow with an abundant Vauclusian spring at an altitude of 321 m a.s.l in the Risnjak National Park located in the Gorski kotar region, Croatia. The river then forms an approximately 100 km long state border between the Republic of Croatia and the Republic of Slovenia before it reaches Kamanje. Further downstream and outside the study area, the Kupa River enters an extensive alluvial plain and reaches Sava River at the altitude of 97 m a.s.l.
In the central part of the catchment area, the main tributaries of the Kupa are Dobra, Mrežnica, and Korana (Figure 1), which in their canyon-like flow intersect the fluviokarst area with a distinct morphology. The dual nature of the Dobra River is evident in its torrential flow of Upper Dobra with the Dinaric pluvial-nival regime and the canyon flow of the Lower Dobra with Mediterranean pluvial-nival regime (maximum discharge in December and April, minimum in July or August and February or March). The water of Upper Dobra sank in the Đula ponor near Ogulin until 1957, when the course was diverted with overflow dam to the accumulation lake Bukovnik and hydroelectric power plant (HPP) Gojak. Only during periods of heavy precipitation, the riverbed between the dam and the ponor fills up with water, occasionally flooding the Ogulin area. The Upper Dobra River then flows underground and reappears after HPP Gojak as Lower Dobra, which flows for 52 km before it reaches the Kupa River [35]. Another hydroelectric power plant that also uses the water of the Lower Dobra is the HPP Lešće, located SE of HPP Gojak. The spring of Zagorska Mrežnica occurs with several other smaller springs and was dammed to form the artificial hydro-technical lake Sabljaci, while its water is transported through the tunnel towards Bukovnik Lake and the HPP Gojak. Moreover, during the rainy season, a significant volume of water flows over the dam, forming the flow of Zagorska Mrežnica River that sinks several kilometers downstream and flows underground into the adjacent catchments of the Tounjčica and Dobra rivers [6]. The Mrežnica River has Peripannonian pluvial-nival regime with the first discharge maximum in March or April and the second in December, while a minimum is observed in August and February [36]. Before the confluence with the Kupa, the Mrežnica River joins with the Korana River. The latter emerges at Plitvice lakes located in the south of the observed area. Like the Lower Dobra, Korana River (upstream of Slunj) also has a Mediterranean pluvial-nival regime.
A concise overview of the complex geological and hydrogeological characteristics of the study area was based on the survey of the Geological Map of the Republic of Croatia 1:300,000 [37]; the Basic Geological Map of the Republic of Slovenia 1:250,000 [38]; the Hydrogeological Map of the Republic of Slovenia 1:250,000 [39], and the Hydrogeological Map of the Republic of Croatia 1:300,000 [40]. On this basis, the joint Croatian and Slovenian hydrogeological map was produced (Figure 2) in the QGIS software and compared with the International Hydrogeological Map of Europe 1:1,500,000—IHME1500 [41]. This required a modification of the Hydrogeological Map of the Republic of Croatia 1:300,000 according to the categories of IHME1500.
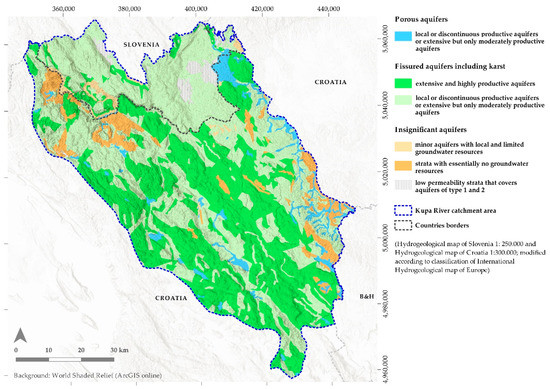
Figure 2.
Hydrogeological map of the Kupa River catchment [39,40], according to the classes of the International Hydrogeological Map of Europe 1:1,500,000 [41].
The studied part of the Kupa River catchment area comprises the contact of two main tectonostratigraphic units of the Dinarides orogenic system: “Outer Dinaridic Platform,” i.e., Karst Dinarides, and Internal Dinaridic Platform, i.e., “Pre-Karst and Bosnian Flysch Unit of Internal Dinarides” [42,43]. Outer Dinarides consist mainly of thick carbonate succession deposited on the Adriatic Carbonate Platform [42]. Inner Dinarides, which extend between Outer Dinarides and the Pannonian basin, are characterized by deep water succession deposited on the passive margin of the Adria Microplate [43]. The catchment consists mainly of karstified soluble Mesozoic carbonate rocks of Jurassic and Cretaceous age, which are strongly tectonically compressed [37]. Depending on the occurrence of highly permeable limestone components or less permeable dolomites, the Mesozoic rocks are categorized either as “extensive and highly productive aquifers” or as “local or discontinuous productive aquifers or extensive but only moderately productive aquifers” (Figure 2) [41]. These are the most important aquifers in the area, as they supply not only the significant karst springs that are used for drinking water supply but also rivers utilized for the production of hydroelectric power. In the Slovenian part of the Kupa River catchment area, Jurassic dolomites, limestones, and breccia prevail. Cretaceous limestones and dolomites occur in wide areas of the Croatian part of the catchment area, while in the Slovenian part, they outcrop along with non-clastic siliceous sedimentary rocks, Cretaceous flysch, and other basin sediments in some areas. Triassic dolomites, Seisian and Campilian deposits, and rare pyroclastic deposits constitute some of the mountainous areas and mainly surround Paleozoic deposits. Paleozoic (Carboniferous and Permian) predominantly clastic rocks, rarely limestones and dolomites, are the oldest rocks in the catchment area. In contrast to Mesozoic rocks, Paleozoic rocks are found in smaller parts of the catchment area. Paleozoic rocks are characterized as insignificant aquifers (IAH categories “minor aquifers with local and limited groundwater sources” and “strata with essentially no groundwater resources” (Figure 2) [41] due to their general low permeability) and therefore enable surface runoff and developed river network such as rivers Čabranka, Kupa, and Upper Dobra. Tertiary deposits are represented by Paleocene and Eocene carbonate flysch and clastites and Miocene Dinaric deposits. Quaternary unconsolidated sediments are present in river valleys and lakes. They are mainly classified as “local or discontinuous productive aquifers or extensive but moderately productive porous aquifers” while in Slovenia, some of the Pliocene to Holocene terrestrial deposits are classified as “low permeability strata that cover either porous of fissured aquifers” (Figure 2).
As in fractured and karstified terrains, the water resources in the Kupa River catchment area are particularly vulnerable to pollution due to the intrinsic karst properties. Generally thin or non-existent overlaying soil layers, low retention capacity, a relatively rapid exchange between surface and groundwater bodies, concentrated infiltration through numerous swallow holes, and potentially far-reaching and relatively fast groundwater flow along preferential paths of karst conduits and channels, could lead to rapid and long-distance spreading of man-made pollution. Given the relatively low hypsometric position of the riverbeds and the low hydraulic gradient, the Kupa, Korana, Dobra, and Mrežnica rivers are the erosional basis for groundwater and represent the groundwater table. In other parts of the terrain, the depth to the groundwater varies depending on the hydrogeological properties of the rocks. The permeability of the Upper Jurassic to Eocene limestone and limestone with dolomite intercalations ranges from 10−4 to 10−6 m/s. Poorly permeable rocks (dolomites, dolomitized limestones from the Upper Triassic to Lower Cretaceous) have the permeability ranging from 10−6 to 10−8 m/s. Flysch complex from the Lower Triassic to Eocene has permeability <10−8 m/s as mentioned by Buljan et al. [6] based on [44]. The groundwater level in Jurassic and Cretaceous limestone corresponds to the nearest surface flows. Groundwater can be characterized by a flow generally oriented south and southeast, as the rivers flow.
The abundance of high-quality spring water (with minimum discharges, generally ranging from 0.1 m3/s to up to 2 m3/s [40]) and the transboundary nature of the Kupa River basin make its water resources strategically important [3], which evokes the need for international management and protection. Furthermore, the population in the study area is very dispersed in numerous small settlements, so all aquifers are very important. For the majority of surface and groundwater abstraction points (out of total 168 abstraction points for drinking water, 66 are located in Croatia and 102 in Slovenia) (Figure 1), drinking water protection zones are declared, covering an area of about 2010 km2 or 36% of the total catchment area.
3. Materials and Methods
To identify areas with potential impacts of land use on water resources quality in the Kupa River catchment area, first insight into the climatic, hydrological, geological, and hydrogeological settings is given in the description of the study area. This was followed by an assessment of the man-induced hazards according to the Water quality index (WQI) mapping (diffuse and partly point sources) based on the methodology proposed in the CC-WARE project [12] and a detailed hazard assessment and mapping (point, linear, and diffuse pollution sources) based on the methodology proposed in COST Action 620 [15]. The handling and graphical data processing on a spatial scale were carried out using the Geographic Information System (QGIS Version 2.18.21).
3.1. The Water Quality Index
A probability that pollutants, originating from different land-use activities, will reach water resources is represented by the water quality index. The maps for the surface water and groundwater quality index have been produced using the modified methodology proposed by Čenčur Curk et al. [12].
The impact of land use on water quality is expressed in terms of land-use load coefficients (LUSLI), which are estimated for each individual land use (CLC level 3). LUSLI presents potential surface water pollution. It is assumed that LUSLI is proportional to the nutrient (phosphorus and nitrogen) export coefficients [45] assigned to each Corine Land Cover (CLC) 2018 dataset of land-use categories [46] (Table 1). The normalization of values (by scaling between 0 and 1) enabled the classification into five different classes from very low to very high water quality index for surface waters (WQIsw).

Table 1.
Land use load coefficient (LUSLI) applied for Corine land cover 2018 categories in the Kupa River catchment area.
The sensitivity of groundwater to pollution depends primarily on the type of aquifer or, more precisely on the effective infiltration coefficient (Table 2), which represents the portion of rainfall that infiltrates into groundwater and carries pollution load into groundwater. The water quality index for groundwater is thus a function of the pollution load, expressed as WQIsw, and the effective infiltration coefficient (EIC). The latter was determined as a function of the aquifer type (hydrogeological map; Figure 2), with an EIC (Table 2) assigned to each aquifer type [12]. Multiplying the water quality index for surface waters (WQIsw) by the effective infiltration coefficient (EIC) and normalizing it from 0 to 1 gives the indicator for groundwater quality—Water quality index for groundwater (WQIgw). The WQIgw map consists of five equally distributed classes.
WQIgw = WQIsw ∙ EIC
Table 2.
Effective infiltration factor (EIC) (modified from Čenčur Curk et al. [12]).
3.2. Hazard Assessment (COST620)
The hazard assessment and mapping for the karstic part of the Kupa River catchment area was based on the recommendations of the COST Action 620 project “Vulnerability and risk mapping for the protection of carbonate (karst) aquifers” [15]. Altogether, the evaluation comprised three steps: identification of potentially hazardous activity, and the characterization and quantification of the hazards. The input data were collected from the Slovenian Environment Agency (WFS server of Environmental Atlas), The Surveying and Mapping Authority of the Republic of Slovenia, the Croatian Environmental Pollution Register, and the Croatian Environmental Information System (WFS server). Depending on the type of land use, the data of the hazard inventory were then systematically distributed to the following categories: point sources, which include industrial activities, disposal of wastewater from treatment facilities (discharge into surface and groundwater), and waste disposal (landfills as well as illegal dump sites); linear sources as traffic corridors and settlements as polygonal diffuse sources (sewerage system, cesspits). Information on existing wastewater and sewerage systems was obtained from the published spatial plans of municipalities and compared with data of entities responsible for wastewater treatment and disposal.
The hazard index HI is calculated as follows [15]:
where H is the weighting coefficient, Qn is the ranking factor (0.8–1.2), and Rf the reduction factor (0–1.0). Weighting allows comparing different hazard categories by allocating values ranging from 0 to 100. The ranking factor enables differentiation within the same type of hazard category. For instance, the ranking factor of 0.8 was applied to closed landfills, 1.0 to active landfills, and 1.2 to active landfills undergoing remediation. As far as agricultural production is concerned, a ranking factor of 0.8 was applied to all agricultural land with significant natural vegetation, while vineyards, orchards, and berry plantations were rated at 1.0. The ranking factor of 1.2 was assigned to non-irrigated arable land and complex cultivation patterns, as areas with more intensive production activities. The reduction factor as an empirical number enables the estimation of contamination event probability. Thereby, for each linear and point hazard sources, impact zones were determined with the corresponding reduction factor Rf (Table 3). It follows that Rf of 0 means that there is no possibility of water resources contamination; Rf of 0.5 represents the reduction of negative impact likelihood by 50%, while Rf of 1.0 means that there are no reasons to reduce the possibility of contamination.
HI = H ∙ Qn ∙Rf
Table 3.
Hazards impact zones, categorized according to the data type.
The final graphical interpretation of the hazard data shows the potential degree of harmfulness for hazards of anthropogenic origin, the locations of point sources of contamination, the extent of the impact zones for linear sources, and polygonal diffuse sources. Table 4 shows the hazard indices, classes, and levels with corresponding colors representing the degree of harmfulness. Each hazard map layer of vector data was accompanied by tables with stored attribute information that encompasses the type of harmful activity; values for H, Qn, Rf, and HI; and hazard classes. Depending on the availability of the collected data, information on quantities and types of potentially harmful compounds emitted or stored is also included, with the coordinates defining the precise location of the point sources.
Table 4.
Hazard index and hazard index classes.
Where certain types of hazard overlap, those with the highest value were selected to represent the harmfulness of the hazard in specific locations.
4. Results
4.1. Water Quality Index
4.1.1. Surface Water Quality Index (WQIsw)
Normalized WQIsw values were applied to CLC categories, which were identified within the Kupa River catchment area. The CLC map of the Kupa River catchment area (Figure 3) shows how broad-leaved forests (~34.8%) and mixed forests (~24%) occupy most of the catchment area, which includes highland and mountainous areas and surrounding settlements with adjacent agricultural land. Agricultural land is generally characterized by significant areas of natural vegetation (~9.3%), which interchanges with transitional woodland-shrubs (~8.8%) and coniferous forests (~8.1%). Complex cultivation patterns (~6.7%) are mainly present in several karst plateaus, hilly areas, and smaller karst poljes. Areas used as pastures are mainly found in the Slovenian part and the eastern to south-eastern parts of the catchment area in Croatia, which together make up ~3.7% of the total catchment area.
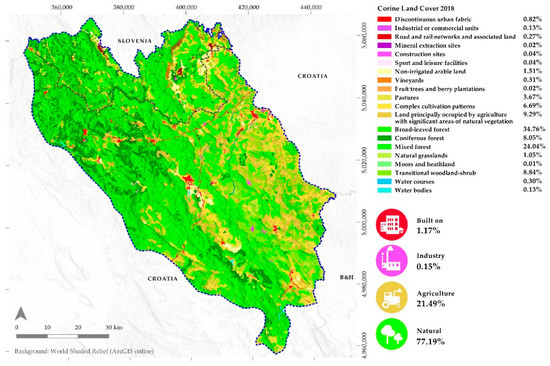
Figure 3.
Land-use map of the studied area (input data source: Corine land cover, 2018).
The map showing the Surface water quality index (WQIsw) is presented in Figure 4 and shows five equally distributed classes from very low (min. value 0.21) to very high (max. value 1.0) WQIsw values. Higher values of WQIsw are assigned in lowland areas, karst plateaus and poljes, where anthropogenic activities and their impacts are significant. Accordingly, very high WQIsw values refer to non-irrigated arable land, while high WQIsw values consider complex cultivation patterns and mineral extraction sites. Medium WQIsw values were determined for construction sites, roads, railway networks, and their associated areas. Conversely, natural and semi-natural areas where human impact is negligible have lower WQIsw values. About 11% of the total Kupa River catchment area has low WQIsw values, while very low WQIsw values cover over ~81% of the study area. Agricultural land with significant natural vegetation shows low WQIsw values, while very low values were allocated to mountainous forest areas and pastures. Urban areas and settlements have low WQIsw values.
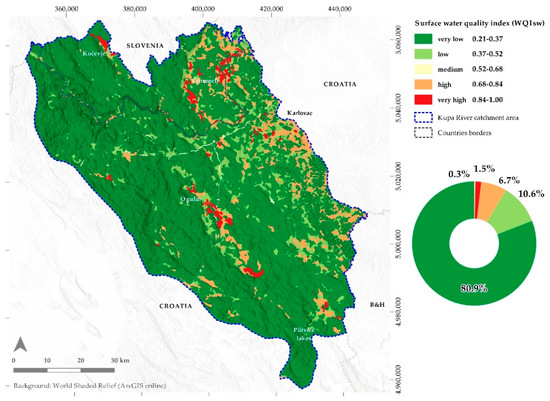
Figure 4.
Surface water quality index (WQIsw) for the Kupa River catchment area with the percentage of the respective class.
4.1.2. Groundwater Quality Index (WQIgw)
The water quality index for groundwater is a function of the pollution load, expressed as WQIsw, and the effective infiltration coefficient (EIC). EIC was determined as a function of the aquifer type (Figure 2), with an EIC (Table 2) assigned to each aquifer type. The map showing the spatial distribution of effective infiltration coefficient (EIC) values for the Kupa River catchment is shown in Figure 5. It should be noted that there are no “extensive and highly productive aquifers” and “confined extensive aquifers” in the study area. However, an additional aquifer type “low permeability strata that cover porous and fissured aquifers” is introduced, for which the EIC factor of 0.05 is assigned.
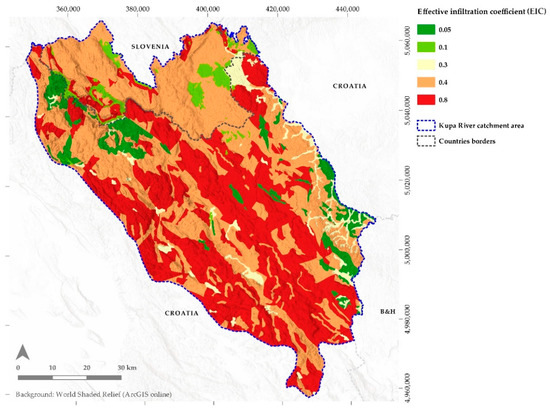
Figure 5.
Effective infiltration coefficient (EIC).
The effective infiltration coefficient reflects the hydrogeological characteristics of the Kupa River catchment area. Hence, higher EIC values indicate a higher groundwater quality vulnerability, whereas low groundwater vulnerability is indicated by low EIC values. As the majority of the study area (~70%) consists of fractured and karstified carbonate rocks with highly and moderately productive aquifers, their intrinsic vulnerability is very high (red colors for carbonate rocks with aquifers of high to very high permeability) and high (orange colors for carbonate rocks with aquifers of medium permeability). In contrast, clay and marl deposits are insignificant aquifers with low permeability and are characterized by low vulnerability.
Obtained groundwater quality index (WQIgw) values (non-normalized) range from 0.01 to 0.8. Figure 6 shows five equally distributed classes of normalized values from very low (min. value 0.01) to very high (max. value 1.0) WQIgw values. Very high and high values of WQIgw are found in the vicinity of settlements where agricultural activities take place on land consisting mainly of carbonate rocks with good permeability. This also applies to traffic networks laid over karstified carbonate rocks. Medium WQIgw values were assigned to built-up areas such as settlements, industrial and commercial areas, and construction sites. Medium WQIgw values also refer to agricultural land with significant natural vegetation areas that extend over carbonate rocks with good permeability and to vineyards and non-irrigated arable land on carbonate rocks with medium to low permeability. Low and very low WQIgw values were assigned to the largest part (~52%) of the Kupa River catchment area. These are forest areas on carbonate rocks with medium (low WQIgw) to low permeability (very low WQIgw) or areas without aquifers and anthropogenic activities occurring in areas consisting of intergranular Quaternary deposits.
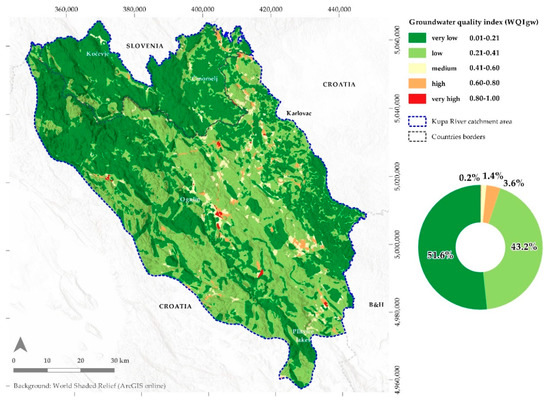
Figure 6.
Groundwater quality index (WQIgw) for the Kupa River catchment, with the percentage of the respective class.
4.2. Hazard Map
Weighting values (ranging from 10 to 85) were assigned to each hazard type identified within the Kupa River catchment area, as shown in Table 5. The illegal waste dump sites category was introduced.
Table 5.
Weighting values for hazards identified within the Kupa River catchment area (adapted from [15]).
Two hazard maps have been produced, which represent collected data. The topographical map was omitted to improve the visibility of the hazard symbols and the overall map readability; instead, a shaded relief was used (greyscale areas in the maps with no hazards). The unclassified hazard map shows all identified hazard types within the study area (Figure 7). The classified hazard map of the Kupa River catchment area describes the potential impacts of various hazard sources (Figure 8), based on a detailed assessment that followed the recommendation of COST Action 620. The Hazard Index classification ranges between 10 and 85. There are no hazards classified at a very high level within the study area. High hazard levels have been identified for direct wastewater treatment outflows into karst and waste illegally disposed in karst swallow holes and caves located generally in the vicinity of settlements. Moderate hazard levels have been identified for active landfills with remediation process and wastewater effluents from various industrial activities discharged into the watercourses. Agricultural activities in the form of arable land, vineyards, and orchards have been classified as inducing low hazard levels. Similarly, pastures situated mainly in karst mountain areas or near arable land and settlements were characterized by a very low hazard level. The road network, which mainly lacks proper stormwater runoff, was classified as a low hazard level in the 5 m impact zone and a very low hazard level in the 5–25 m zone. Likewise, the railway network in the 5 m impact zone was assigned with a low hazard level. Due to many settlement areas without a sewerage system, a moderate hazard level was assessed, while the low hazard levels were determined for those with potentially leaking sewer network.
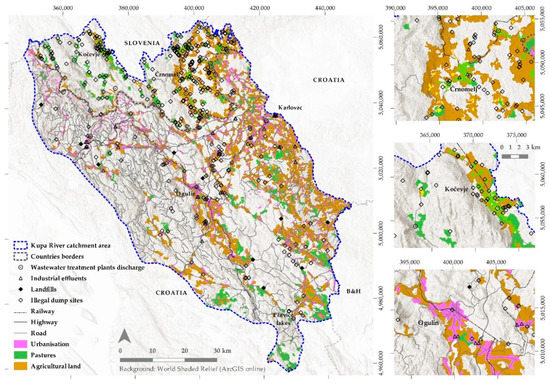
Figure 7.
Unclassified hazard map of the Kupa (Kolpa) River catchment area.
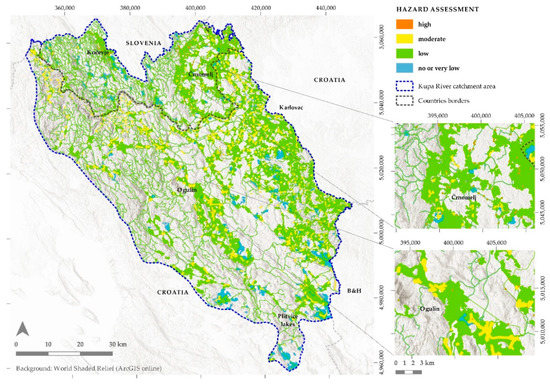
Figure 8.
Classified hazard map of the Kupa (Kolpa) River catchment area, showing hazard levels.
5. Discussion
Water resources of sufficient quantity and good quality can support spatial and economic development through various ecosystem services, taking into account the health of the population and ecosystems. Thus, if the potential and actual impacts of land-use activities are not taken into account and existing or newly developed land-use and water management tools are not used, an opportunity is missed to contribute efficiently to the protection and sustainable water resources management. From the perspective of protecting water resources and their ecosystem services (drinking water), it is important to obtain actual data on areas associated with activities that pose a threat (hazard) to surface water or groundwater. In particular, the hazard maps provide a comprehensive overview of point and diffuse sources of pollution and their spatial distribution within the catchment area. Accordingly, they can serve as valuable input data for future spatial planning, the designation of protected areas (especially measures as prohibitions and restrictions), and the allocation of water monitoring stations in recognized hot-spots, which is particularly important in areas of vulnerable karst water resources.
Groundwater quality index (WQIgw) maps are merely visualizations of water pollution hazards, and their accuracy depends to a large extent on the correctly prepared input data of the Corine land cover and its resolution. These maps do not indicate exact locations of the negative impacts but rather a zonal spatial distribution. Consequently, WQIgw maps based on CLC and hydrogeological map are applicable for regional-scale studies and not for detailed scale, which is required for delineation of drinking water protection zones, where precise locations of activities causing adverse effects are required. However, they can be used as a schematic outline or as a first step towards more detailed hazard maps. It should be noted that the WQIgw index and hazard maps represent the potential for groundwater pollution. The realization of this potential can be seen in the measured water quality. For this reason, a more detailed hazard assessment needs to be carried out and examined with data from qualitative status monitoring.
Comparing the water quality index and hazard maps, it is evident that arable land has a very high index (pollution load), while the hazard map shows low hazard. Large areas with a low and very low groundwater quality index are mainly forest areas, which are not classified as a hazard in the hazard map (no color in the hazard map).
The findings of the carried out hazard assessment are in line with previous studies in the Kupa (Kolpa) River catchment area. A similar hazard assessment and mapping study was previously carried out by Biondić [16] on a much smaller spatial extent of the upper part of the Kupa River catchment, also based on the recommendations of COST Action 620. He assessed moderate hazard levels for settlements without adequate wastewater collection and discharge systems, landfills, quarrying, and industrial activities, while the transport infrastructure was classified as having a low hazard level. In his study Biondić [16] identified no hazards that could induce “very low,” “high,” and “very high” hazard levels, as opposed to this research where high hazard levels have been associated with illegal waste disposal sites and direct discharges of wastewater. Furthermore, Meaški [18] prepared a hazard map for the Plitvice Lakes National Park, the southernmost part of the Kupa River catchment area. The impact zones of point, linear, and polygonal hazard sources were defined similarly, with the classified hazard level categories largely corresponding to those identified in the presented work. The difference lies in the classification of agricultural land, for which Meaški assessed very low hazard levels and inner impact zones of roads as imposing a moderate hazard level. This results from applying different Qn factors, which Meaški [18] estimated, taking into account the purpose of the hazard assessment and mapping scale, as it encompassed the national park area with very valuable water resources and natural assets. Contrary to previously mentioned research, this paper gives for the first time a comprehensive hazard assessment for the whole karstic part of the Kupa River catchment area, taking into account its transboundary character and part of the catchment located in the neighboring country Slovenia. In addition, for the first time, water quality index mapping was done for the Kupa River catchment on a transboundary scale.
Furthermore, existing groundwater vulnerability maps of Slovenia [47] and Croatia [48] indicate predominant categories of extremely and highly vulnerable groundwater resources, which were determined for highly karstified areas with numerous ponors, where direct contact of surface contamination with groundwater is possible. When correlating these areas with the water quality indices and hazard maps of this study, it is clear how most settlements and agricultural land are located in areas of moderate to high groundwater vulnerability.
The methodology of hazard assessment according to COST Action 620 includes the mapping of hazards that are represented in point, linear, and polygonal forms. This proved to be a certain challenge from the point of view of mapping scale, as point sources on maps at the regional scale can be lost within linear and polygonal hazards. However, regional hazard maps require much more generalized input data; therefore, it is common practice to represent industrial plants and landfills as points on such a spatial scale. In contrast, more detailed scales, as they can be used in spatial planning within drinking water protection zones, include polygonal hazard forms, i.e., buffer zones with graded effects. It can be concluded that the methodology used in the presented study has proven to be applicable for such a regional study for aquifers on a transboundary scale, even in challenging karst environments where the complex properties and structure make the exploration and monitoring of groundwater resources laborious and often scarce. However, a more detailed scale for better localization of potential hazards should be preferred for the decision-making on appropriate protection measures in vulnerable parts of the Kupa River catchment. This is particularly true for urban (settlements) and industrial areas with a wide range of different types of hazard, the cumulative effect of which should be taken into account and studied in more detail.
It is important to note that the hazards in the study area are not continuously present during a year. Their temporal resolution was not considered in this study, but it can be assumed that the occurrence and duration of agricultural hazards (such as fertilization, tillage, grazing) depend on the season. It must also be considered how the hazard maps can change substantially over time depending on spatial development and land-use change, which can occur quite rapidly in developing urban areas. Particularly in Croatia, a large number of wastewater collection and treatment projects are currently being planned for settlements without existing networks and facilities. In order to be able to locate all recent hazards in a particular area, it is necessary to constantly update the maps with new data.
Moreover, there is a risk that hazard assessments are often subjective, because of the expert’s knowledge base and experience background, as the parameters (e.g., weighting factors in the methodology of COST Action 620, land-use load, and effective infiltration coefficients in the CC-WARE methodology) and evaluation of hazards are based on a qualitative assessment of parameters as expert judgment.
It is important to note that not all existing hazards have been mapped, as only those activities that are mandatory to be reported and have an appropriate environmental permit are collected from national inventories. Unfortunately, there is a lack of environmentally aware public behavior with regards to waste disposal, manure storage, application of pesticides, and so forth. For instance, the inventory of illegal waste disposal sites in Croatian karst swallow holes and caves is constantly updated by various speleological societies through a voluntary initiative for waste cleanup.
Thus, an integrated management approach is required to efficiently preserve the water resources of the Kupa River catchment, which are already exposed to various anthropogenic pressures (as shown by the water quality indices and hazard mapping) and additionally threatened by climate change. As water resources cross administrative boundaries, a legal framework [10,11,49] is established at the transnational level to protect and ensure their long-term sustainable use. However, as highlighted in the GUIDR (Guidance for the Danube region for sustainable land use planning) [4] developed by the CAMARO-D project, land-use planning should provide a basis for the sustainable management of water resources and related social and economic systems, by coordinating competing demands based on adequate planning mechanisms. It should be noted that not only the sectoral synergy is essential, but that an important factor in efficient and sustainable management is also the engagement of all relevant stakeholders in the decision-making process and the raising of public awareness by providing information on hazards related to harmful land-use practices. This applies in particular to vulnerable karst areas, where the inhabitants should understand the multiple benefits of maintaining and improving the status of the water environment as crucial to achieving the objectives of sustainable management. The outcomes of the combined approach to water quality indices and hazard assessment applied to karst water resources in the present study can be easily understood by non-experts, thus facilitating their dissemination outside the scientific community.
6. Conclusions
The present study aimed at investigating methods to assess potential impacts of land-use on vulnerable karst water resources in the wide transboundary catchment area of the Kupa River. This was achieved by using spatial analyses in GIS software for water quality index mapping for surface and groundwater resources, followed by detailed mapping of man-made hazards. The final results depicted on the water quality index map show predominant zones with “very low” and “low” water quality indices for surface and groundwater resources. However, higher values are observed in lowland areas, karst plateaus, and poljes where the impacts of anthropogenic activities such as agricultural production and quarrying take place on permeable karstified carbonate rocks. Overall, the assessment and mapping of the water quality index proved to be a straightforward method applicable for a generalized representation of the interrelations between land use and water resources of karst aquifers on a regional scale.
Despite the complex data preparation, the hazard assessment proved to be successful and delivered satisfactory results, which are in line with the results of the water quality indices assessment and the findings of previous studies carried out on a detailed scale for parts of the Kupa River catchment. The hazard map pinpoints the areas with potentially harmful impacts on water resources caused by various point and diffuse sources of pollution. Illegal waste dumps in the areas of karst swallow holes and caves, and direct wastewater discharges into the karst underground have been identified as potentially problematic areas and classified as high hazard levels. Moreover, numerous scattered settlements without adequate sewerage systems represent a moderate hazard level, while low hazard levels were determined for the surrounding agricultural activities and transport infrastructure that cross the entire catchment area.
Both methods examined in the present study can be used as the first screening tool for the qualitative status of water resources at a regional scale. This is particularly true for transboundary catchments, as the maps highlight the areas where certain action steps might be required to meet the water quality requirements established by the existing legislation. In combination with existing regional vulnerability maps, the resulting water quality index and hazard maps can serve as a basis for future adaptation strategies in the context of water protection, water management, and climate change, so that further deterioration of water resources quality can be prevented. Hazard inventories and graphical interpretations could be useful to different sectors, from local actors such as water managers, spatial planners, and nature conservationists to wider decision-making and legislative bodies, whose cooperation is a key factor for the sustainable management of the Kupa River catchment’s water resources.
In order to build on the results presented in this study, future research should consider a more detailed assessment and mapping of areas where a higher hazard density has been identified, as well as areas with highly vulnerable karst water resources, drinking water protection zones, or nature reserves. Moreover, downscaling to areas of special interest will allow a more thorough correlation between the potential hazards collected from several data inventories and the on-site situation. A step forward could also be the development of a Kupa River catchment risk map based on existing vulnerability and hazard maps, which has been elaborated in the presented study.
Author Contributions
Conceptualization, B.Č.C. and A.S.; data preparation, A.S. and B.Č.C.; writing—original draft preparation, A.S.; writing—review and editing, B.Č.C., J.L.R., J.T., and I.B.; visualization, A.S.; supervision, J.L.R. All authors have read and agreed to the published version of the manuscript.
Funding
This research’s activities have been undertaken within the framework of CAMARO-D (Cooperating towards Advanced Management Routines for land use impacts on the water regime in the Danube River basin) project co-funded by the European Union funds European Regional Development Fund and Instrument for Pre-Accession Assistance. Croatian Geological Survey funded the APC.
Acknowledgments
The authors would like to express their gratitude to Prvoslav Marjanović for his guidance through the water quality index assessment.
Conflicts of Interest
The authors declare no conflict of interest.
References
- Taylor, R.G.; Scanlon, B.; Döll, P.; Rodell, M.; Van Beek, R.; Wada, Y.; Longuevergne, L.; Leblanc, M.; Famiglietti, J.S.; Edmunds, M.; et al. Ground Water and Climate Change. Nat. Clim. Chang. 2013, 3, 322–329. [Google Scholar] [CrossRef]
- Lukač Reberski, J.; Rubinić, J.; Terzić, J.; Radišić, M. Climate Change Impacts on Groundwater Resources in the Coastal Karstic Adriatic Area: A Case Study from the Dinaric Karst. Nat. Resour. Res. 2020, 29, 1975–1988. [Google Scholar] [CrossRef]
- Biondić, B.; Biondić, R.; Kapelj, S. Karst Groundwater Protection in the Kupa River Catchment Area and Sustainable Development. Environ. Geol. 2006, 49, 828–839. [Google Scholar] [CrossRef]
- Marjanović, P.; Pejović, D.; Marjanović, M. GUIDR—Guidance for the Danube Region for Sustainable Land Use Planning. 2019. Available online: http://www.interreg-danube.eu/uploads/media/approved_project_output/0001/37/5b8d5a835624b6a9538ab8bc7e4f92cc625eb3c8.pdf (accessed on 10 August 2020).
- Federal Ministry of Agriculture Regions and Tourism; Agricultural Research and Education Centre Raumberg-Gumpenstein; Municipality of the City of Vienna Department 31—Vienna Water; University of Ljubljana; Public Water Utility JP VOKA SNAGA; Croatian Geological Survey; Forest Research Institute Baden-Württemberg. Transnational Cluster-Specific Characteristics Cluster 1 “Land Use and Vegetation Cover—Protection of Groundwater Resources”. 2019. Available online: www.interreg-danube.eu/approved-projects/camaro-d/outputs?page=1 (accessed on 15 August 2020).
- Buljan, R.; Pavlić, K.; Terzić, J.; Perković, D. A Conceptual Model of Groundwater Dynamics in the Catchment Area of the Zagorska Mrežnica Spring, the Karst Massif of Kapela Mountain. Water 2019, 11, 1983. [Google Scholar] [CrossRef]
- Pavlić, K.; Jakobović, D. High Flows from Gornja Dobra Basin. Rud. Geol. Naft. Zb. 2018, 33, 45–52. [Google Scholar] [CrossRef]
- International Commission for the Protection of the Danube River. The Danube River Basin District Management Plan. 2015. Available online: www.icpdr.org/main/activities-projects/river-basin-management-plan-update-2015 (accessed on 5 September 2020).
- International Commission for the Protection of the Danube River. Convention on Cooperation for the Protection and Sustainable Use of the Danube River; International Commission for the Protection of the Danube River: Vienna, Austria, 1994; p. 21. [Google Scholar]
- The Croatian Government. Plan Upravljanja Vodnim Područjima 2016–2021. (River Basin Management Plan 2016–2021); The Croatian Government: Zagreb, Croatia, 2016.
- The Slovenian Government. Načrt Upravljanja Voda na Vodnem Območju Donave za Obdobje 2016–2021 (Danube River Basin Management Plan 2016–2021); The Slovenian Government: Ljubljana, Slovenia, 2016.
- Čenčur Curk, B.; Cheval, S.; Vrhovnik, P.; Verbovšek, T.; Herrnegger, M.; Nachtnebel, H.; Marjanović, P.; Siegel, H.; Gerhardt, E.; Hochbichler, E.; et al. CC-WARE—Mitigating Vulnerability of Water Resources under Climate Change. WP3—Vulnerability of Water Resources in SEE, Report Version 5; 2014. Available online: https://www.researchgate.net/publication/301889158_CC-WARE_Mitigating_Vulnerability_of_Water_Resources_under_Climate_Change_WP3_-_Vulnerability_of_Water_Resources_in_SEE (accessed on 29 January 2020).
- Nistor, M.-M. Groundwater Vulnerability in the Piedmont Region under Climate Change. Atmosphere 2020, 11, 779. [Google Scholar] [CrossRef]
- Stevanović, Z.; Marinović, V. A Methodology for Assessing the Pressures on Transboundary Groundwater Quantity and Quality-Experiences from the Dinaric Karst. Geol. Croat. 2020, 73, 1–12. [Google Scholar] [CrossRef]
- COST Action 620 Vulnerability and Risk Mapping for the Protection of Carbonate (Karst) Aquifers; Final Report; Zwahlen, F., Ed.; European Commission, Directorate-General for Research: Luxembourg, 2004. [Google Scholar]
- Biondić, R. Zaštita Voda Gornjeg Dijela Sliva Kupe (Water Protection of the Upper Part of the River Kupa Catchment Area). Ph.D. Thesis, Faculty of Mining, Geology and Petroleum Engineering, University of Zagreb, Zagreb, Croatia, 2005. [Google Scholar]
- Kovačič, G.; Ravbar, N. The Protection of Karst Waters. Acta Carsologica 2007, 36, 254. [Google Scholar] [CrossRef]
- Meaški, H. Model Zaštite Krških Vodnih Resursa na Primjeru Nacionalnog parka “Plitvička Jezera” (Model of the Karst Water Resources Protection on the Example of the Plitvice Lakes National Park). Ph.D. Thesis, Faculty of Mining, Geology and Petroleum Engineering, University of Zagreb, Zagreb, Croatia, 2011. [Google Scholar]
- Loborec, J.; Kapelj, S.; Novak, H. Analysis of Groundwater Pollution Hazard in Karst: A Case Study of Jadro and Žrnovnica Catchment Area. Građevinar 2015, 67, 1093–1103. [Google Scholar] [CrossRef]
- Frančišković-Bilinski, S.; Bhattacharya, A.K.; Bilinski, H.; Bhaskar, D.B.; Mitra, A.; Sarkar, S.K. Fluvial Geomorphology of the Kupa River Drainage Basin, Croatia: A Perspective of Its Application in River Management and Pollution Studies. Z. Fur Geomorphol. 2012, 56, 93–119. [Google Scholar] [CrossRef]
- Meaški, H.; Biondić, B.; Biondić, R. Delineation of the Plitvice Lakes Karst Catchment Area, Croatia. In Karst without Boundaries; Stevanović, Z., Krešić, N., Kukurić, N., Eds.; CRC Press/Balkema: Boca Raton, FL, USA, 2016; pp. 269–284. [Google Scholar]
- Habič, P.; Kogovšek, J.; Bricelj, M.; Zupan, M. Izviri Dobličice in njihovo širše kraško zaledje. Acta Carsologica 1990, 19, 5–100. [Google Scholar]
- Habič, P.; Kogovšek, J. Sledenje voda v kraškem zaledju Krupe v JV Sloveniji. Acta Carsologica 1992, 21, 35–76. [Google Scholar]
- Bura, D. Statistika Krša Jugoslavije (Statistical Analysis of Jugoslavian Karst); Savezno savjetovanje o kršu: Split, Croatia, 1958; pp. 67–98. [Google Scholar]
- Roglić, J. Geografski aspekt Dinarskog krša (Geographical aspect of Dinaric karst). In Krš Jugoslavije 1; Petrik, M., Ed.; JAZU: Zagreb, Croatia, 1969; pp. 19–39. [Google Scholar]
- Herak, M. Karst of Yugoslavia. In Karst: Important Karst Regions of the Northern Hemisphere; Herak, M., Stringfield, V.T., Eds.; Elsevier: Amsterdam, The Netherlands, 1972; pp. 25–83. [Google Scholar]
- Bogunović, M.; Bensa, A. Tla krša-temeljni čimbenik biljne proizvodnje (Karst Soils-Fundamental Factor of Agriculture Production). In Hrvatski Krš i Gospodarski Razvoj; Biondić, B., Božičević, J., Eds.; Centar za Krš: Gospić/Zagreb, Croatia, 2005; pp. 41–50. [Google Scholar]
- Šegota, T.; Filipčić, A. Köppen’s Classification of Climates and the Problem of Corresponding Croatian Terminology. Geoadria 2003, 8, 17–37. [Google Scholar] [CrossRef]
- Kozjek, K.; Dolinar, M.; Skok, G. Objective Climate Classification of Slovenia. Int. J. Climatol. 2017, 37, 848–860. [Google Scholar] [CrossRef]
- Croatian Hydrological and Meteorological Service. Mean Monthly Temperature for Stations Parg and Ogulin. Available online: https://meteo.hr/klima.php?section=klima_podaci¶m=k1 (accessed on 2 November 2020).
- Slovenian Environment Agency (ARSO). Mean Monthly Temperature for Station Dobliče. Available online: http://www.meteo.si/uploads/probase/www/climate/table/sl/by_location/doblice/climate-normals_81-10_Doblice.pdf (accessed on 2 November 2020).
- Biondić, B.; Biondić, R.; Kapelj, S. Protection of the Kast Aquifers in the River Kupa Catchment Area and Sustainable Development. Environ. Geol. 2003, 50, 33–36. [Google Scholar]
- Pavlić, K.; Kovač, Z.; Jurlina, T. Analiza Trendova Srednjih i Maksimalnih Protoka u Ovisnosti o Klimatskim Promjenama—Primjer Na Krškim Slivovima Hrvatsk. Geofizika 2017, 34, 157–174. [Google Scholar] [CrossRef]
- Frantar, P.; Hrvatin, M. Pretočni Režimi v Sloveniji Med Letoma 1971 in 2000. Geogr. Vestn. 2005, 77, 115–127. [Google Scholar]
- Bonacci, O.; Andrić, I. Impact of an Inter-Basin Water Transfer and Reservoir Operation on a Karst Open Streamflow Hydrological Regime: An Example from the Dinaric Karst (Croatia). Hydrol. Process. 2010, 24, 3852–3863. [Google Scholar] [CrossRef]
- Čanjevac, I. Tipologija Protočnih Režima Rijeka u Hrvatskoj. Hrvat. Geogr. Glas. 2013, 75, 23–42. [Google Scholar] [CrossRef]
- Croatian Geological Survey. The Geological Map of the Republic of Croatia at 1:300,000 Scale; Croatian Geological Survey: Zagreb, Croatia, 2009. [Google Scholar]
- Bauser, S. Basic Geological Map of the Republic of Slovenia at Scale 1:250,000; Geological Survey of Slovenia: Ljubljana, Slovenia, 2010. [Google Scholar]
- Hydrogeological Map of the Republic of Slovenia 1:250,000—IAH; Geological Survey of Slovenia: Ljubljana, Slovenia, 2004.
- Biondić, B.; Biondić, R.; Brkić, Ž. Basic Hydrogeological Map of Croatia 1:300,000; Croatian Geological Survey: Zagreb, Croatia, 2003. [Google Scholar]
- BGR (Bundesanstalt für Geowissenschaften und Rohstoffe). International Hydrogeological Map of Europe 1:1 500 000. 2015. Available online: https://www.bgr.bund.de/EN/Themen/Wasser/Projekte/laufend/Beratung/Ihme1500/ihme1500_projektbeschr_en.html (accessed on 26 November 2019).
- Vlahović, I.; Tišljar, J.; Velić, I.; Matičec, D. Evolution of the Adriatic Carbonate Platform: Palaeogeography, Main Events and Depositional Dynamics. Palaeogeogr. Palaeoclimatol. Palaeoecol. 2005, 220, 333–360. [Google Scholar] [CrossRef]
- Schmid, S.; Bernoulli, D.; Fügenschuh, B.; Matenco, L.; Schefer, S.; Schuster, R.; Tischler, M.; Ustaszewski, K. The Alpine-Carpathian-Dinaridic Orogenic System: Correlation and Evolution of Tectonic Units. Swiss J. Geosci. 2008, 101, 139–183. [Google Scholar] [CrossRef]
- Terzić, J. Hydrogeology of Adriatic Karst Islands. Ph.D. Thesis, University of Zagreb, Zagreb, Croatia, 2006. [Google Scholar]
- Wochna, A.; Lange, K.; Urbanski, J. The influence of land cover change during sixty years on non point source phosphorus loads to Gulf of Gdansk. J. Coast. Res. 2011, 64, 1820–1824. [Google Scholar]
- European Environment Agency & Copernicus Land Service. Corine Land Cover 2018. Available online: https://land.copernicus.eu/pan-european/corine-land-cover/clc2018 (accessed on 26 November 2019).
- Prestor, J.; Janža, M. Assessment of the Infiltration (Kennessy Method) and Groundwater Vulnerability of Slovenia; Geological Survey of Slovenia: Ljubljana, Slovenia, 2006. [Google Scholar]
- Biondić, R.; Biondić, B.; Rubinić, J.; Meaški, H.; Kapelj, S.; Tepeš, P. Ocjena Stanja i Rizika Cjelina Podzemnih Voda na Krškom Području u Republici Hrvatskoj—Završno Izvješće (Assessment of status and Risk of Groundwater Bodies in the Karst Area of Croatia—Final Report); Faculty of Geotechnical Engineering, University of Zagreb: Varaždin, Croatia, 2009; (unpublished); Available online: https://www.voda.hr/sites/default/files/dokumenti/ocjena_stanja_i_rizika_podzemnih_voda_na_krskom_podrucju_u_rh_varazdin_2009.pdf (accessed on 5 November 2020).
- Directive 2000/60/EC of the European Parliament and of the Council of 23 October 2000 establishing a framework for Community Action in the Field of Water Policy. Off. J. Bruss. 2000, 327, 1–73.


Publisher’s Note: MDPI stays neutral with regard to jurisdictional claims in published maps and institutional affiliations. |
© 2020 by the authors. Licensee MDPI, Basel, Switzerland. This article is an open access article distributed under the terms and conditions of the Creative Commons Attribution (CC BY) license (http://creativecommons.org/licenses/by/4.0/).