Abstract
This study explores coastal hazard characteristics along Provincial Highway No. 9 (hereafter the Provincial Highway) in Taiwan. Numerical simulation was conducted to analyze wave attacks and medium-to-long-term coastal morphological change along the Provincial Highway and identify areas of high hazard potential. Hydrodynamic and morphological change numerical models were used to simulate various meteorological scenarios in the research site; specifically, far-field, medium-field, and near-field simulations were performed. Subsequently, the simulated results were employed to analyze hazard characteristics and determine the potential for hazard along the Provincial Highway. According to the analysis of hazard characteristics, the high potential of wave attacks was revealed in the following sections of the highway: 440K+000-441K+000, areas near 424K+500, and 396K+000-396K+500, and the highest potential for erosion was shown in the areas near 418K+000 and 397K+500. Finally, these areas with a high potential for wave attacks and erosion were marked to create a map of hazard potential for the provincial highway, and thus provide insights into future construction works or hazard-prevention operations.
1. Introduction
To improve the safety of coastal highways, the incidence of disasters must be reduced through various engineering and non-engineering measures. Engineering measures are those that use suitable engineering techniques to enhance the highway’s resistance to disasters (e.g., constructing sea dikes and embankment). By contrast, non-engineering are desk-top based measures to inform and underpin the engineering measures (e.g., assessing the sources and consequences of disasters, risks, the potential for damage, vulnerability, and adaptation given extreme weather and climate change). This study focused on the use of non-engineering measures to improve disaster prevention practices for a provincial highway. EurOtop (2018) [1] used an artificial intelligence approach, to establish prediction equations for the run-up heights and wave-overtopping rate for various terrains and structures. This increased the accuracy of wave-overtopping warning systems and highways’ resistance to wave attacks. Recent developments have applied EurOtop (2018) [1] within integrated warning systems around the world. For example, Sabino et al. (2014) [2] designed an integrated system for managing wave-overtopping hazards along Portugal’s coast (including harbors and coastal highways). The system integrates various wave models, simulates large-scale offshore waves and calculates the distribution of waves as they are transmitted to nearshore areas, before applying an artificial neural network or an empirical formula (Mase et al., 2013) [3] to predict run-up heights and the wave-overtopping rate. Finally, a predetermined threshold is used for various types of hazard warning, and a geographic information system is used to produce a hazard map in which layers of different colors are used to represent the severity of hazards. Red, for example, indicates a severe hazard. This type of warning system, in addition to its core objective of hazard reduction, can be used to inform future planning of national land development and related decision-making.
Although few studies have analyzed hazards on coastal highways in Taiwan, many Taiwanese studies have explored hazard prevention measures and historical storm analysis. Shih et al. (2018) [4] employed the Semi-implicit Cross-scale Hydroscience Integrated System Model, a numerical model, to hindcast the wave heights and the water levels of storm surges of 129 historical typhoons in Taiwan. Statistical analysis was then conducted to produce a wave potential and risk map during typhoons in Taiwan. Shih et al. (2018) [4] has been used to identify vulnerable areas of the Taiwan coast. Several studies have also assessed the risks in other coastal areas in Taiwan (Chien et al., 2012; Huang et al., 2018) [5,6]. The marine design conditions from these studies can be used to simulate scenarios, and the simulation result may be adopted as the basis for preventing wave-overtopping and relevant engineering designs (Huang et al., 2007) [7]. Because hindcast results for typhoons are often used as a key source for scenario analysis, developing typhoon hindcasting techniques has become a popular research topic in recent years. Studies have used hybrid techniques to produce hybrid wind fields that comprise various reanalysis wind fields and parametric typhoon models before using a numerical model to hindcast winds and waves (e.g., Chen et al., 2019, Hsiao et al., 2019, Hsiao et al., 2020) [8,9,10].
In addition to the direct coastal damage that is caused by storm surge attacks, morphological changes have a prominent negative influence on the coast. This results in the reduction of beaches, loss of land, increased height of storm surges, and increased frequency of storm wave attack the land. Generally, sediment deposition is a beneficial phenomenon to coasts (e.g., the build up of beaches material protecting a road); however, the deposition of sediment around public facilities can hinder the normal operations of facilities (e.g., from the low accessibility of harbors). Accordingly, morphological (both deposition and erosion) changes are an important factor in assessing coastal hazards. Assessing coastal morphological changes typically involves simulating representative wave scenarios for the summer, winter, and the entire year to discuss morphological changes in the medium-to-long term (Southgate 1995, Walstra et al. 2013, Fayyaz et al. 2019) [11,12,13]. Moreover, to increase the efficiency of simulating morphological changes, studies have incorporated the morphology acceleration factor (MAF) to accelerate the simulation of long-term morphological changes (Moerman 2011, Knaapen and Joustra (2012), Styles et al. 2016) [14,15,16]. Recently, the combination of multiple models was applied to evaluate the coastal flooding/erosion during storms (Tsoukala et al. 2016; Gaeta et al. 2018; Postacchini et al. 2019; Postacchini and Ludeno 2019; Torresan et al. 2019; Apollonio et al. 2020; Jang et al. 2020) [17,18,19,20,21,22,23]. These methodological approaches were adopted to provide an accurate and reliable estimate of coastal hazards.
This study has developed non-engineering hazard prevention measures for a provincial highway. We employ risk assessment methods including typhoon hindcasting, frequency analysis, wave-overtopping empirical formulas, and morphological change calculations to establish a numerical simulation assessment and analyze the hazard characteristics along the provincial highway. We then prioritise areas along the provincial highway with high hazard potential. The results are intended to be used as a foundation for future highway improvement works by relevant authorities.
2. Study Sites Information
Taiwan is located in an area affected by Northwest Pacific typhoons. A total of 369 typhoon events were recorded by the Center Weather Bureau (CWB) from 1911 to 2019 [24]. The site of this study, Provincial Highway No. 9 (hereafter “the Provincial Highway”), is situated in Taitung, an eastern city in Taiwan (Figure 1). The present study explored the characteristics of hazard along 50 km length of the Provincial Highway which is adjacent to the coast (Figure 1). Eastern Taiwan is typically the most severely hit region of Taiwan for typhoons, and the Provincial Highway is the arterial road that connects most traffic between eastern and southern Taiwan. This Provincial highway is susceptible to disasters because of its steep terrain, relatively low highway design standard, unfavorable alignment, highly variable grade, and insufficient lane width. These disaster events interrupt traffic and cause negative influences on regional economic development, industrial transportation, and travel. The lanes on the Provincial Highway were widened in 2011 to enhance its capacity. However, the Provincial Highway is still subject to frequent flooding from wave attacks, which threaten the safety of vehicles and people-, cause beach erosion, undermining of the highway, and long-term coastal recession, which further increases the possibility of waves damaging the Provincial Highway and causing flooding.
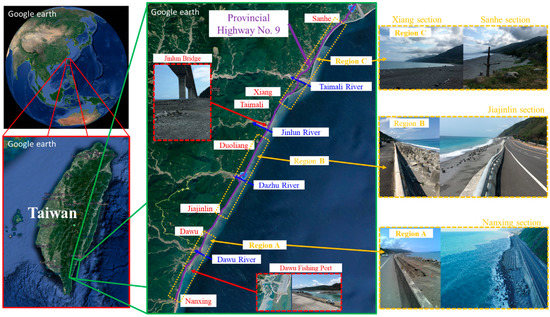
Figure 1.
Location of Taitung Provincial Highway No. 9 in eastern Taiwan.
3. Methodology
This study’s assessment had three numerical assessment steps, namely far-field, medium-field, and near-field steps. The connection between the three steps is depicted in Figure 2. The numerical assessment process and relevant operations are roughly divided into three stages:
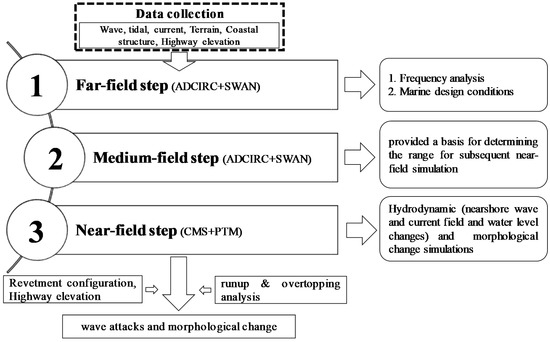
Figure 2.
Schematic of the nested numerical modelling process and relevant operations.
- Far-field step: A coupled advanced circulation (ADCIRC)-simulating waves nearshore (SWAN) model was used to conduct large-scale simulations producing offshore conditions of storm surge and wave height. From this model, we calculated the storm surge and wave height during historical typhoons from 1989 to 2018. The CWB announced warnings on 171 typhoons from 1989 to 2018 but these typhoons did not necessarily have a marked influence on the research site. The radius of the storm for typhoons ranges from approximately 200 to 300 km. Accordingly, this study determined all historical typhoons with trajectories that passed through the area within a 300-km radius of Taitung to be typhoons of potential influence on the research site. A total of 101 typhoons were determined to have substantial influence on the research sites. The results were subjected to frequency analysis to obtain the design wave conditions and hindcast the design water levels according to the tidal data and storm surge height that were published by the CWB of Taiwan.
- Medium-field step: The design conditions from the far-field step were employed as the boundary conditions for the medium-field step to calculate the wave and current field change and wave setup in the medium-field region. The result of wave setup was then used with the elevation data of the Provincial Highway to delineate the area that was hit by the simulated hazard, which provided a basis for determining the range for subsequent near-field step.
- Near-field step: A coastal modeling system (CMS) and particle tracking model (PTM) were employed to conduct numerical simulations for each near-field region. The simulations comprised hydrodynamic (nearshore wave field, current field and water level changes) and morphological change simulations. The result for each near-field region was then applied to analyze hazard characteristics along the Provincial Highway.
3.1. Wave-Current Coupled Numerical Model (Far-Field Step)
3.1.1. Model Description
To obtain the design water level conditions for waves and storm surges in the research site, the coupled ADCIRC-SWAN model was adopted. This model integrates the SWAN and ADCIRC models to incorporate the interaction effect of waves and currents. The SWAN model (Booij et al. 1997) [25] was used to forecast winds and waves in nearshore waters. The ADCIRC model, a finite element model (Westerink et al. 1991) [26], uses a triangular mesh driven by time-varying water elevation, wind field and pressure field on the open boundary of offshore waters. This study used the ADCIRC two-dimension depth integrated model (Luettich et al. 1992) [27] to simulate the current field and distribution of water levels in the water surround Taiwan. In wave-current coupling, the SWAN model generates bottom radiation stress and sends it to the ADCIRC for wave radiation stress for current field calculation.
In this study, the far-field simulation’s calculation range spanned longitudinally from 110 E to 150 E and latitudinally from 10 N to 50 N (Figure 3). The morphological calculation was conducted using 1 and 2 arc-minute mesh global digital elevation data (ETOPO1/ETOPO2) that were published by the United States National Geophysical Data Center [28]. The number of mesh nodes was 50,812, with 98,946 elements. The mesh resolution of the boundary reduced from an offshore resolution of the 0.5 degrees to 0.015 degrees at the Taiwan shoreline boundary. The model’s typhoon wind field was generated by substituting observational data including the location of the center, pressure at the center, wind speed, and movement speed and was published by into the Rankine Vortex Model (RVM).
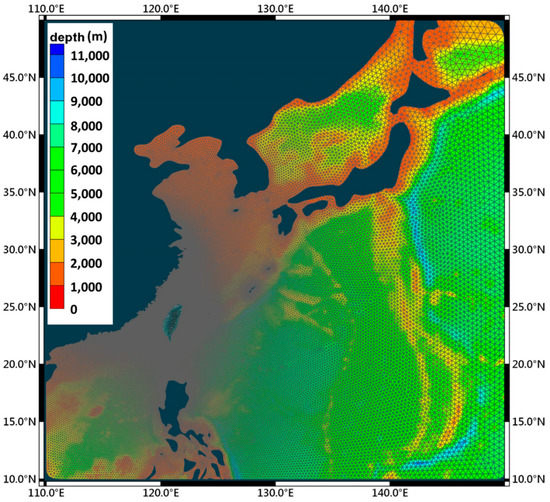
Figure 3.
Bathymetry and unstructured grid for Far-field simulation.
3.1.2. Verification of the Far-Field Simulation
This study used the water level, storm surge height, and wave height during Typhoons Meranti in September 2016 and Nesat in July 2017 to verify the far-field simulation. Figure 4 depicts the paths of the two typhoons that were published by the CWB. The wind field that was generated by the RVM was incorporated into the far-field simulation to calculate the water level and water-current field during the typhoons. The numerical results were then compared with data on the water level (Fugang tide station, Dawu tide station, and Lanyu tide station) and waves (Hualian Port, Taitung Buoy, Green Island buoy, and Taitung Open-Ocean Buoy) for verification. Figure 5 displays the locations of these monitoring stations, and Figure 6, Figure 7, Figure 8 and Figure 9 compile the comparison results with the measured data. In addition to qualitative verification, this study used a quantitative approach to perform model verification and more precisely determine the accuracy of model calculation. The quantitative method involved determining the difference between measured and simulated data by using an agreement coefficient (D) and averaged deviation (P) (Willmott 1981) [29], which are defined as follows:
where is the predicted value; and are the observed and average values, respectively; D = 1 indicates complete agreement; and P = 0 indicates no difference. Table 1 and Table 2 present the statistical results of the quantitative verification, which indicated a satisfactory consistency between the measured and simulated values from the proposed far-field simulation.
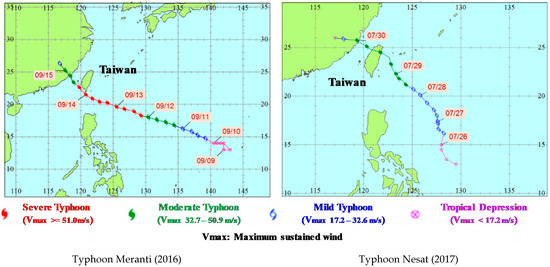
Figure 4.
Tracks of Typhoon Meranti (2016) and Typhoon Nesat (2017) (CWB).
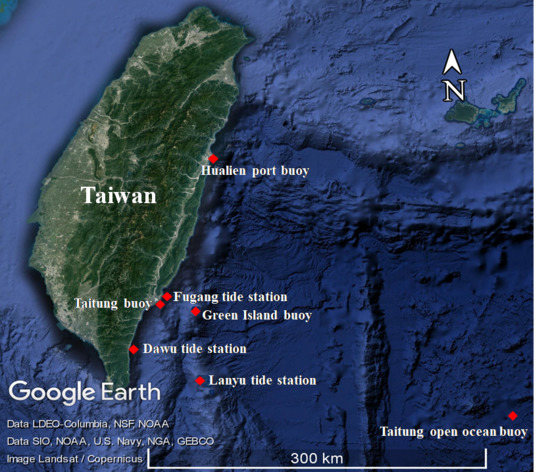
Figure 5.
Locations of tide stations and wave buoys.
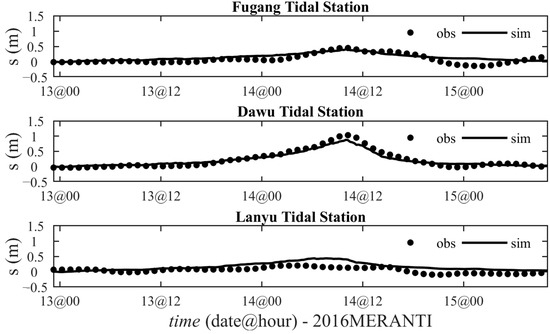
Figure 6.
Comparisons of storm surges between model hindcasts and observations (Typhoon Meranti September 2017). Refer to Figure 5 for observation site locations.
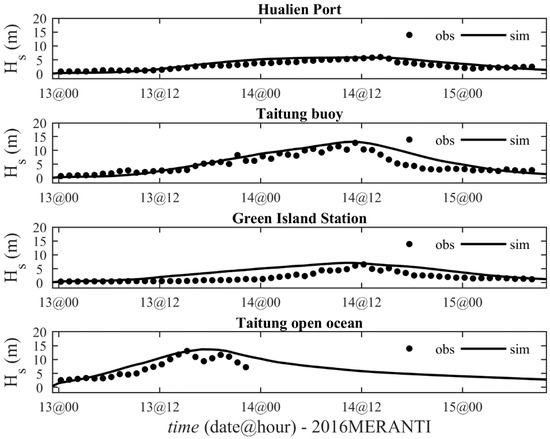
Figure 7.
Comparisons of significant wave heights between model hindcasts and observations (Typhoon Meranti September 2017). Refer to Figure 5 for observation site locations.
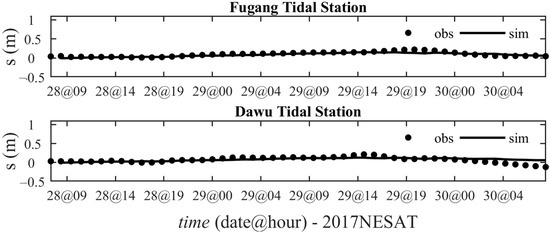
Figure 8.
Comparisons of storm surges between model hindcasts and observations (Typhoon Nesat July 2017). Refer to Figure 5 for observation site locations.
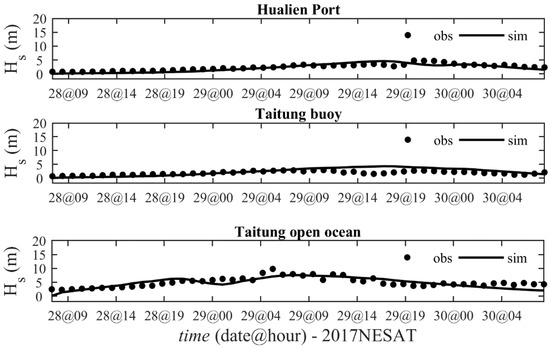
Figure 9.
Comparisons of significant wave heights between model hindcasts and observations (Typhoon Nesat July 2017). Refer to Figure 5 for observation site locations.

Table 1.
Statistical results of the quantitative verification in Typhoon Meranti.
Table 2.
Statistical results of the quantitative verification in Typhoon Nesat.
3.2. Wave-Current and Morphological Change Numerical Models (Medium-Field and Near-Field Steps)
3.2.1. Model Description
The medium-field simulation was used to investigate the current and wave fields in the water near the Provincial Highway. Figure 10 shows the scope of the medium-field simulation, which spanned 65 km in length, with the open boundary approximately 15 km offshore from the coastline. The coupled ADCIRC-SWAN model was also adopted for calculation in the medium-field step. The open boundary mesh had a resolution of 2 km, and those that formed the coast and river mouth had a resolution of 50 m. The total number of mesh nodes was 20,141, and that of the elements was 39,285. The design conditions that were obtained using the far-field simulation were employed as the wave-boundary and water level conditions in the medium-field simulation.
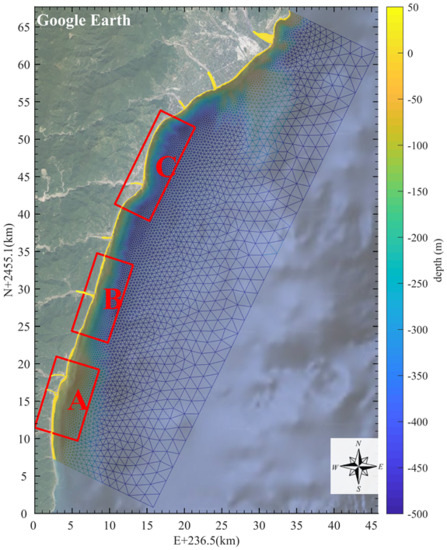
Figure 10.
Unstructured grid for Medium-field simulation.
The elevation data of the Provincial Highway were used to specify three regions for near-field simulation (Regions A, B, and C in Figure 10) (see Section 4.1). The near-field simulation involved a CMS and PTM to simulate hydrodynamic and morphological changes. The CMS is an integrated model that can simulate nearshore waves, currents, water levels, sediment transport, and morphological changes (Demirbilek et al. 2013; Sánchez et al. 2014) [30,31]. The CMS can be divided into CMS-FLOW and CMS-WAVE. CMS-FLOW is a two-dimensional, depth-averaged, and nearshore-current-field model that determines the current filed and water level changes. CMS-WAVE is a wave-spectrum model that uses finite-difference methods to solve the wave action conservation equation. CMS-WAVE provided conditions, such as the height, direction, period, frequency dispersion, and radiation stress of waves for field calculation in CMS-FLOW, which then feeds the flow speed, flow direction, and water level back to CMS-WAVE for calculation. CMS-FLOW also simulates sediment transport and morphological changes. In this study, CMS-FLOW was used to calculate the total load, bed load, and suspended load to simulate nearshore morphological changes in each near-field region. Regarding sediment transport by rivers, the PTM was adopted to simulate sediment transport by rivers in each region (Lackey and MacDonald (2007)) [32] with the resulting sediment deposition, incorporated into the calculation of the bed’s morphological change. By adopting CMS-FLOW and PTM, this study included bed morphological changes that were caused by hydrodynamic forces and sediment transportation by rivers into the simulation, thereby yielding a comprehensive simulation of morphological changes. In addition, this study analyzed the morphological change of each region in the medium-to-long term (10 years). To improve analysis efficiency, a MAF was adopted. A surface-water modeling system (SMS) was integrated with CMS-WAVE, CMS-FLOW, and PTM to simulate the hydrodynamic forces and morphological change in the near-field regions (refer to Appendix A for the detail description of CMS and PTM). Wave and hydrodynamic data were directly interfaced from the medium-field simulation as boundary conditions for the near-field model. Subsequently, a precise simulation of the hydrodynamic forces and morphological change in three near-field regions was conducted. Figure 11 depicts the topography in the three regions, and Table 3 illustrates the mesh specifications.
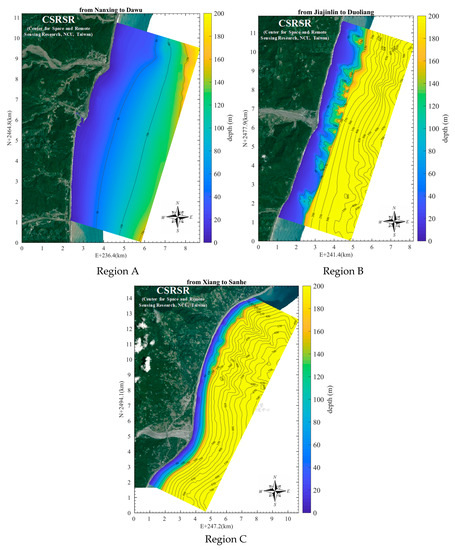
Figure 11.
Bathymetry for near-field simulation.
Table 3.
Mesh specifications for near-field simulation.
3.2.2. Model Verification
The hydrodynamic data used to verify the medium-scale simulation were observational data published by the Water Resources Agency (WRA) in 2010. These data included the water level and flow speed that were measured from 27 July to 21 August 2010 at an observation station named TMW1, which is situated 300 m away from the mouth of the Taimali River (Figure 12). The Japanese global ocean tide model NAO99b was employed as the tidal conditions to calculate the water level boundary conditions in the hydrodynamic model. Figure 13 shows the verification results, which indicated that the hydrodynamic calculation was satisfactorily consistent with the measured trend of nearshore currents. The quantitative verification results are presented in Table 4.
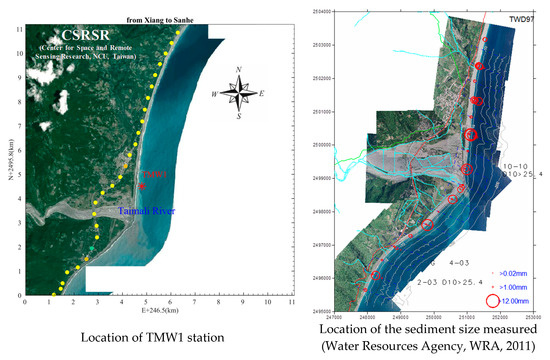
Figure 12.
Locations of TMW1 station and the sediment size measured.
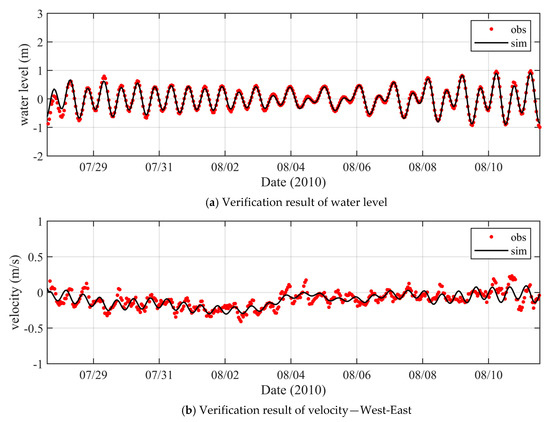
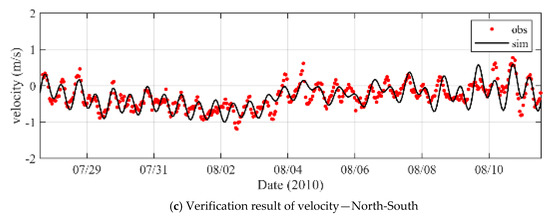
Figure 13.
Comparisons of water level and velocity between numerical model and observations at TMW1 station (refer to Figure 12 for location map).
Table 4.
Statistical results of the quantitative verification at TMW1 station.
The substrate size (D50) that was measured by the WRA in 2011 (the location of the sediment size measured in Figure 12) was employed as reference data for the simulation of morphological change. A high resolution (5-m) digital elevation model (DEM) data was used for the land area. The DEM data with a 200-m (50-m) resolution was adopted for the still water depth greater (lesser) than 30 m. The substrate size equalling 10 mm that was used in the numerical model was based on the measured data (WRA, 2011). The wave conditions were determined using the representative wave conditions (see Section 3.4.2). Figure 14 illustrates the morphological changes in the Taimali River mouth and compares the calculated result with the measured data from May 2017 to August 2018. The morphological changes due to Typhoon NESAT which attacked Taiwan from 28 July to 30 July 2017 were considered. Then, the period of the year-round representative wave condition was used to simulate the morphological changes upon the variation causing by Typhoon NESAT. Figure 14a,b were morphological changes for measured data and numerical results, respectively. The measured data revealed a deposition trend in the Taimali River mouth and an erosion trend in the north of the river mouth. Since the main trends of the morphological changes in the research site between the simulation and measurement were similar, the numerical model was able to evaluate the morphological changes. Furthermore, the bivariate density scatter was shown to quantify the difference between the simulation and measurement in Figure 14c. The higher density points are distributed near the 45-degree line, which means that most of the simulated results agree with the measured results. Additionally, the quantitative comparison showed that erosion and deposition could be underestimated in the numerical model.
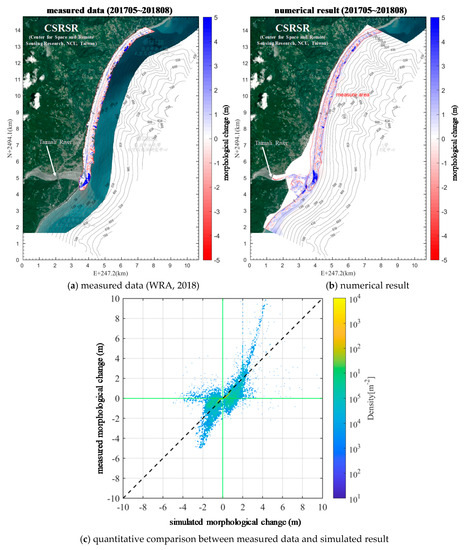
Figure 14.
Comparison of morphological change between measured data and numerical result in the Taimali River mouth. (a) measured data (WRA, 2018); (b) numerical result; (c) quantitative comparison between measured data and simulated result.
3.3. Analysis of Hazard Characteristics
The hydrodynamic forces and morphological change from near-field model were then used to determine the hazard characteristics of the Provincial Highway. This study divided hazards into two types; highway wave attacks and erosion. The following describes the analysis for each hazard type:
- Highway wave attacks: The Provincial Highway is protected by a revetment structure on the east and adjoins mostly mountainous slopes on the west. We analyzed the run-up and overtopping of nearshore waves along the Provincial Highway and used the result to produce a wave attack potential map. The run-up and overtopping analysis were conducted using the semi-empirical formula that was proposed by the United States Army Corps of Engineers (Coastal Engineering Manual [CEM], 2011) [33] as follows:where R is the run-up height; R2% is runup level exceeded by 2 percent of the incident waves; Hs the significant wave height at the seaward toe of the revetment; is the roughness coefficient of the revetment slope; is the influence coefficient of water depth on the run-up; is the incidence loss coefficient; and is the breaking wave parameter. Following Van der Meer and Stam (1992) [34], this study calculated the amount of wave-overtopping by obtaining the difference between run-up height and freeboard height (), and the equation is as follows:where Rc denotes the freeboard height, and q is the amount of wave-overtopping. The analysis begins by obtaining the distribution of nearshore wave set-up and height in the near-field simulation. According to the coastal substrate composition at the research sites, the parameter of roughness is set as 0.55 (CEM, 2011) [33], and the coastal slope conditions were calculated from the 5 m DEM. Subsequently, simulated marine data of the area that was 25 m (due to the 25-m resolution of the near-field triangles) away or farther from the Provincial Highway were extracted, and the wave height was employed as the incident wave height (H0), which was then substituted into Equation (2) to predict the run-up height in the cross-section at certain positions. The calculated run-up height, wave set-up elevation, and water level elevation could then be summed to predict the actual run-up height. The predicted total water level was then compared with the profile Provincial Highway revetment to determine the possibility of wave-overtopping at several cross-sections Then, Equation (3) was used to predict the amount of wave-overtopping in various cross-sections, the positions of which were determined according to the highway mileage. Tolerance levels of wave-overtopping for revetment and vehicle safety from CEM (2011) [35] were specified to remain below 5 × 10⁻² and 5 × 10⁻⁴ (l/s/m) separately determined the level of hazard in each wave attack potential area along the Provincial Highway by comparing the predicted overtopping with the tolerance threshold.
- Erosion hazard: Coastal erosion may not directly affect the safety of the Provincial Highway. However, long-term coastal erosion increases the possibility of waves directly attacking the Provincial Highway. This study employed the classification principles for coastal erosion as defined by the WRA in 2017 to analyze the potential of erosion along the Provincial Highway. The potential classification for coastal erosion hazards comprises two levels: high potential (a coastal erosion area where the high water line receded by an average of more than 5 m annually in the last 5 years) and medium potential (a coastal erosion area where the high water line receded by an average of more than 2 m but less than 5 m annually in the last 5 years). This study used the simulated medium-to-long-term near-field morphological change and potential classification principles to determine whether coastal erosion compromised the safety of the Provincial Highway. According to the simulated morphological change trend, the coast receded to a point that was less than 25 m away from the Provincial Highway, which satisfied the potential classification principle. A section of the highway was determined to have the potential for hazard only when the following two conditions are met: (1) The simulated result showed that the coastline receded to a position within 25 m from the highway, and (2) the section satisfied one of the potential classification standards (i.e., for medium or high potential). Then, sections that were defined as having the potential for hazard were marked as having medium or high potential according to the classification principles.
3.4. Calculating the Design Conditions and the Representative Wave Conditions
3.4.1. Calculating the Design Conditions for Storm Surges and Typhoon Wave Height
The design standard for coastal protection structures was set as a 50-year return period. The design conditions were determined by first simulating historical typhoons and then conducting a frequency analysis on the simulation result to obtain the storm surge and wave height conditions of various return periods. The verified ADCIRC-SWAN model was used for wave current-coupled simulation on the 101 typhoons to calculate the distributions of storm surges and wave heights in each typhoon. To determine the representative design for wave heights and storm surges for Taitung, this study conducted frequency analysis on the calculation result for an offshore location with a 1038-m water depth near Duoliang Village (offshore about 15 km). Because typhoon waves at this location were not affected by the nearshore bathymetry, they could be employed to determine the representative incident angle of typhoon waves when they entered the nearshore area. Extreme value analysis was then adopted to fit the peak values of storm surges and wave height over approximately 29 years. Regarding the fitting method, this study employed the Weibull cumulative probability distribution function. Figure 15 depicts the fitted distribution, and Table 5 illustrates the reliability test results for surge and typhoon wave heights that correspond to different return periods. The root-mean-square error was adopted as the reliability indicator. The goodness-of-fit was determined according to the root-mean-square error (RMSE) between the statistical distribution curve and the actual data, with an error indicating a high goodness-of-fit. The surge height and typhoon wave height with a 50-year return period were determined using Weibull distribution to be 0.59 and 15.71 m, respectively. However, surge height with a return period of 50 years revealed only the meteorological tidal level; therefore, the astronomical tidal level must have been incorporated to constitute the design water level condition that was required in this study. The astronomical tidal level which was determined to be the average high-tide level (0.73 m) of data that were published by the CWB Taitung tide station from 1976 to 2018 was added to the hindcasted result of surge height to obtain the design water level condition at 1.32 m. According to the empirical formula that was proposed by Bretschneider and Tamaye (1977) [35], (Hs is the typhoon wave height), the period of the design wave height was determined to be 15.18 s. These design conditions (including design wave height and design water level) were, respectively, used as the boundary condition and initial water level condition for this study’s analysis of wave attack potential in each section of the Provincial Highway.
Figure 15.
Frequency analysis of the surge heights and wave heights.
Table 5.
Reliability test results for surge heights and wave heights that correspond to different return periods.
3.4.2. Calculating the Representative Wave Conditions
To understand the characteristics of medium-to-long-term morphological changes along the Provincial Highway, this study performed numerical simulation on hydrodynamic forces and morphological change. Because morphological change is a long-term trend, representative wave conditions are typically employed to simulate such change. This study used wave conditions in the summer, winter, and for the entire year, and the year-round representative wave conditions were used with the MAF to simulate medium-to-long-term morphological change. An analysis of long-term historical observational data was conducted to hindcast the representative wave conditions. In the analysis, long-term wave observational data the CWB Taitung Open-Ocean Buoy from September 2010 to March 2018 were used (Figure 16). Figure 17 displays the wave rose diagrams for the entire year, the summer and winter. The height (Hs) and period (Tp) of the representative waves were hindcasted using the equations proposed by Sawaragi (1982) [36]:
where Cg is the group wave speed; P is the proportion of waves; Hi is the wave height; and Ti is the period of waves. The subscript i indicates the characteristic of a single wave, and subscript t indicates the characteristic of the representative wave. The rose diagram data were substituted into Equations (4) and (5) to obtain the height and period of representative waves. The analysis of the representative waves revealed that the height and period of the year-round representative wave were 1.62 m and 6.12 s, while waves during the the summer monsoon and the winter monsoon were 1.43 m (period is 5.81 s) and 1.74 m (period is 6.44 s), respectively. According to the rose diagram, the main wave directions throughout the entire year, in the summer, and in the winter were E, ESE, and E, respectively. These wave conditions were used as the boundary conditions for subsequent analysis of the erosion potential of the Provincial Highway.
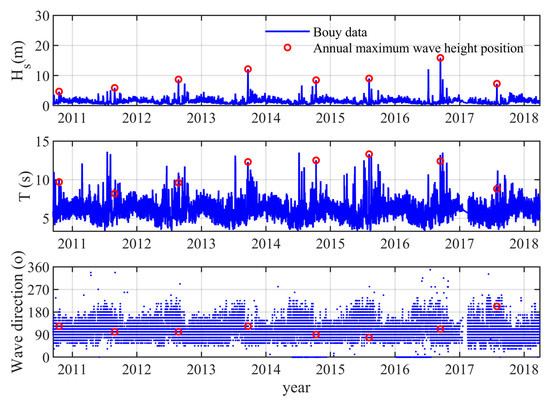
Figure 16.
Wave observational data of Taitung Open-Ocean Buoy.
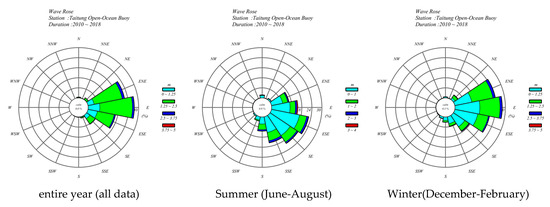
Figure 17.
Wave rose diagrams for the entire year, the summer and winter of Taitung Open-Ocean Buoy.
4. Results
4.1. Analysis of the Near-Field Regions
According to Section 3.3, this study analyzed the hydrodynamic forces and morphological change to explore hazard characteristics along the Provincial Highway. The study was divided into three near-field regions to establish a detailed model to which fulfilled satisfactory levels of computational efficiency. The near-field regions were delineated according to the elevation of the Provincial Highway and the medium-field simulation results. The Provincial Highway elevation was measured at the boundary fence. Figure 18 presents the Provincial Highway elevation, distribution of wave height, and distribution of nearshore wave height. The Provincial Highway’s elevation was relatively high in the section between Regions A and B and in the elevated section between Regions B and C. The sections within Regions A and B exhibited the lowest elevation (Figure 18a). Figure 18b depicts the simulated wave height distribution based on the design conditions and revealed that, because of the deep nearshore water in Taitung, the energy of the waves was not easily dissipated when the waves were transmitted from offshore to nearshore areas. On average, the level of wave height dissipation was low. Subsequently, the nearshore wave height along the Provincial Highway (Figure 18c) showed relatively high nearshore waves in the section from Jiajinlin to Duolin (Region B) and in the section from Xianglan to Sanhe (Region C). According to the Provincial Highway’s elevation and distribution of nearshore wave height, three regions with high potential of hazards were delineated in the research site: Region A (from Nanxing to Dawu), Region B (from Jiajinlin to Duoliang), and Region C (from Xiang to Sanhe). These areas were used for subsequent near-field simulation.
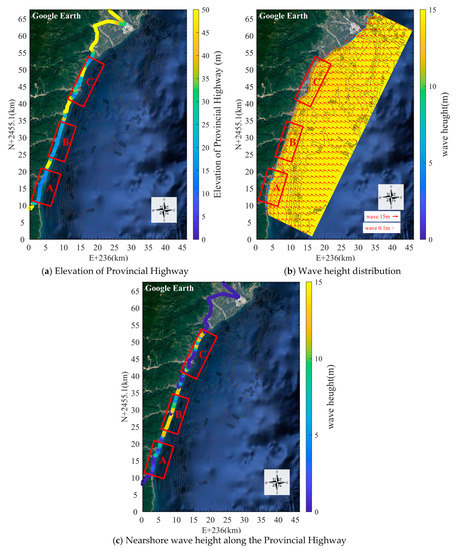
Figure 18.
Provincial Highway elevation, distribution of wave height, and distribution of nearshore wave height.
4.2. Analysis of Near-Field Waves and Water Level
To understand the coastal wave field and distribution of the water level along the Provincial Highway in relation to the design conditions, this study simulated the wave field and water level distribution in the three near-field regions by using a CMS in conjunction with the design wave conditions (please refer to Section 3.4.1). This part of the study predominantly used waves with normal incidence on the coast which is an extreme condition among various incident directions. Figure 19, Figure 20 and Figure 21 present the wave field and water level distribution in Regions A (Highway Mileage: 433K+000-443K+500), B (Highway Mileage: 418K+000-428K+500), and C (Highway Mileage: 395K+000-409K+000). Figure 19 is the wave field and water level distribution in Region A based on the design conditions. The simulated wave height decreased gradually from the offshore to the nearshore areas. Regarding the wave height distribution, the highest coastal waves (5–10 m) were observed in the area north toward the Dawu River. In the area south toward the Dawu Fishing Port, due to its relatively flat terrain and the dissipation and breaking of the waves, it exhibited a low coastal wave height of approximately 5 m. The wave height was slightly higher in the Nanxing section, at approximately 5–7.5 m (Figure 19a). The area north toward the Dawu River (Figure 19b), exhibited a relatively even water level distribution and less wave dissipation and wave attacks due to shoaling, because of its deep coastal water and steep coastal slope. The shallow water and flat terrain in the Dawu Fishing Port area resulted in a relatively high water level in this area. Therefore, wave breaking due to shoaling enhanced energy dissipation resulted in relatively low wave heights in this area.
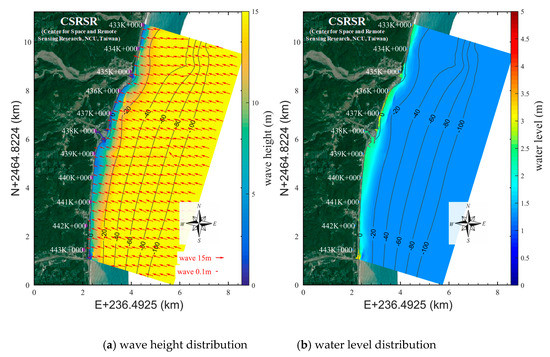
Figure 19.
Wave field and water level distribution in Region A.
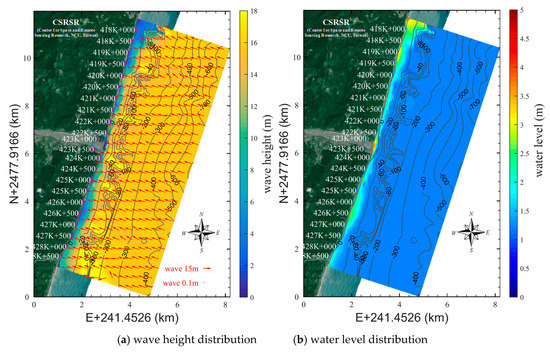
Figure 20.
Wave field and water level distribution in Region B.
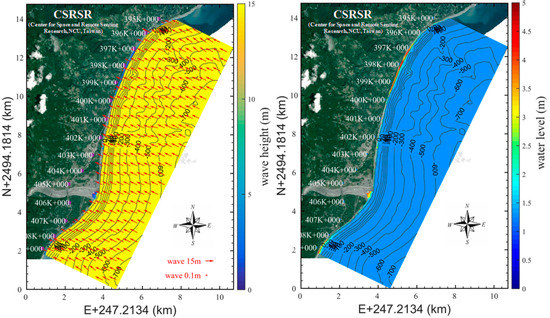
Figure 21.
Wave field and water level distribution in Region C.
Figure 20 presents the simulated wave field and water level distribution in Region B based on the design conditions. The wave height marginally decreased between the offshore and nearshore areas. Except for the area north toward the Dazhu River (section from 420K+000 to 418K+000) where wave dissipation was present in the nearshore area (wave height of approximately 3–5 m), the entire coast of Region B was affected directly by the non-dissipated nearshore waves (wave height of approximately 10–15 m). Accordingly, the low-elevation sections of the Provincial Highway were easily subject to wave-overtopping and thus to wave attacks (Figure 20a). According to the distribution of the water level (Figure 20b), the area north toward the Dazhu, due to its shallow coastal water and steep coastal slope, exhibited a relatively high water level. Therefore, wave breaking due to shoaling enhanced energy dissipation and resulted in relatively low wave heights in this area. The remaining sections in Region B had relatively even distributions of coastal water level.
Figure 21 presents the simulated wave field and water level distribution in Region C based on the design conditions. The decrease in the wave height was slightly noticeable when the waves traveled from offshore to nearshore areas, where the wave height was approximately 12–15 m. In addition, the flat coastal terrain in the road section from 396K+500 to 399K+500 facilitated wave breaking and dissipation and hence contributed to the relatively low height of the waves (Figure 21a). The distribution of the water level (Figure 21b) was even throughout the entire coast in Region C, except for the section between 396K+500 and 399K+500, where the water level was relatively high.
4.3. Analysis of Near-Field Coastal Current and Morphological Change
This subsection discusses the morphological change in the research site that was simulated using the representative wave conditions (refer to Section 3.4.2). The current field was calculated using the water level and flow speed that were obtained using the medium-field model and the median diameter of the substrate (10 mm) at the coast. Figure 22, Figure 23 and Figure 24 present the simulated coastal currents and morphological change. The simulation was conducted based on various representative wave conditions, facilitating a further understanding in the qualitative trend of year-round morphological change in the research site. According to Figure 22(a1–a3), the coastal current generally flowed northward in Region A during the summer. A southward coastal current was observed at the river mouth (435K+500) due to the terrain (Figure 22(a1)). Under the winter wave conditions, all coastal current flowed southward in Region A, with a markedly higher flow speed (Figure 22(a2)). According to the year-round trend, the coastal current flowed mainly southward (Figure 22(a3)). Figure 22(b1–b3) presents the simulated trends of erosion and deposition in Region A. In the summer, the sediment was transported predominantly to the sides of the river mouth 20 m deep in the water. The northernmost point of sediment transportation was at 433k+000, and the southernmost point was at Dawu Fishing Port. Sediment transportation did not reach the Nanxing area. Overall, the morphological change result revealed little coastal erosion during summer (Figure 22(b1)). According to the erosion and deposition for the winter (Figure 22(b2)), the river transported sediment mainly to the south, which reached the coast in the Nanxing section. Overall, erosion was most prominent at a height of sea level to 5 m depth. The year-round result (Figure 22(b3)) revealed that sediment transportation covered the entire coast of Region A, including Dawu Fishing Port. The coast in the Nanxing section, despite sediment being transported to the coast, exhibited an erosion trend because the sediment was predominantly deposited deep in the water.
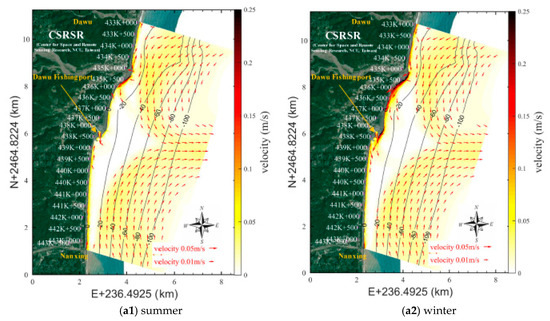
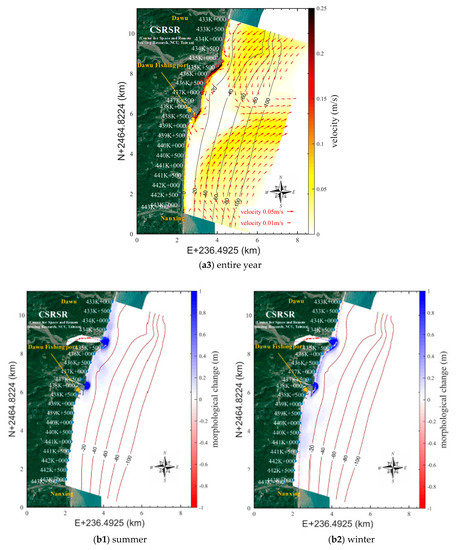
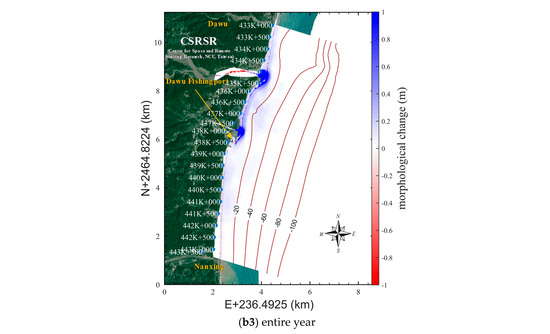
Figure 22.
Simulated coastal current and morphological change in Region A. (a): coastal current; (b): morphological change.
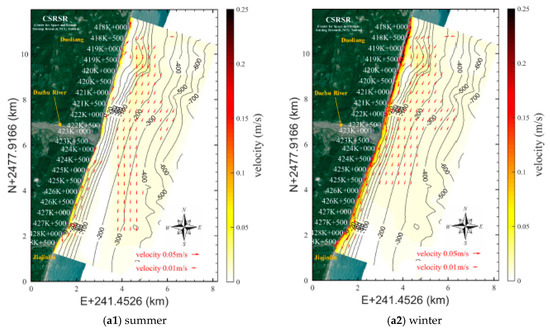
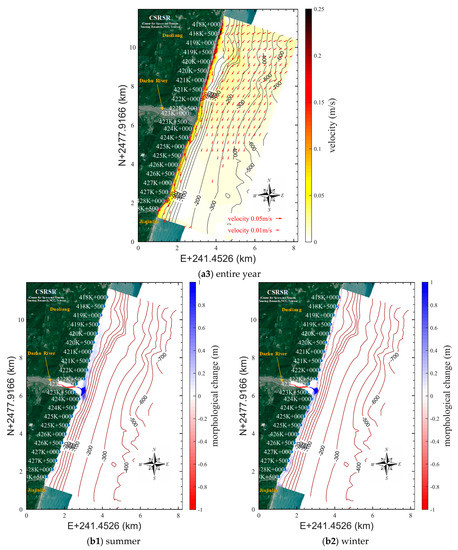
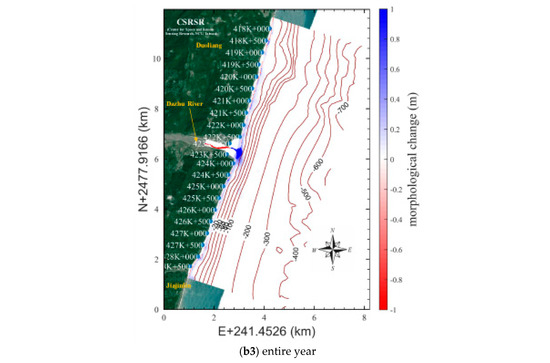
Figure 23.
Simulated coastal current and morphological change in Region B. (a): coastal current; (b): morphological change.
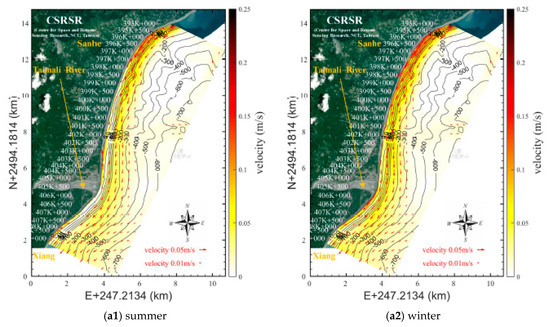
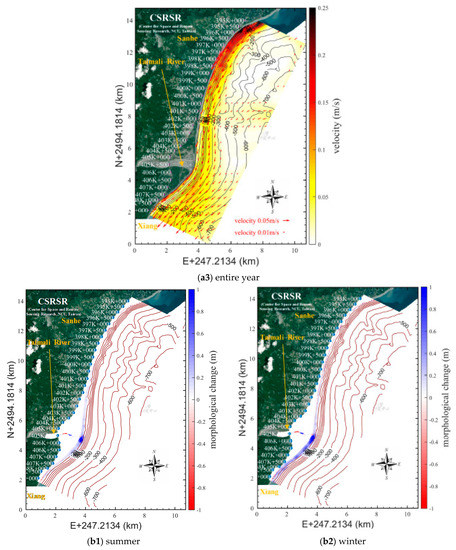
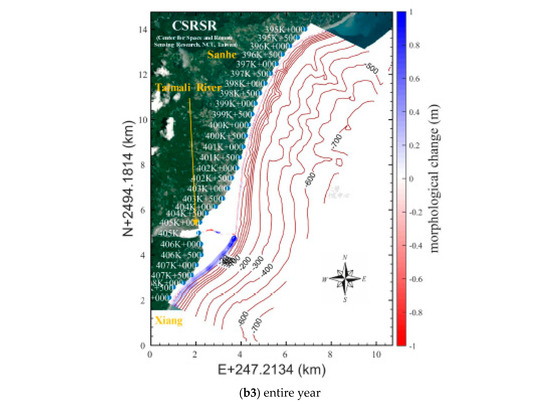
Figure 24.
Simulated coastal current and morphological change in Region C. (a): coastal current; (b): morphological change.
Figure 23(a1–a3) depicts the current field in Region B. According to Figure 23(a1) the coastal current flowed mainly northward in the summer. In the winter, the currents along the entire coast flowed southward at a considerably higher speed than that during the summer (Figure 23(a2)). The stronger southward coastal currents during the winter were attributable to the consistent direction between the nearshore and offshore currents that were induced by the winter wave conditions. Figure 23(a3) presents the year-round current field and revealed that the coastal currents flowed predominantly to the south, similar to the coastal current trend in the winter. Figure 23(b1–b3) shows the simulated erosion and deposition trends in Region B. As indicated in Figure 23(b1), sediment was transported by the river predominantly to the sides of the river mouth at 20 m deep in the water. The northmost sediment transport reached approximately 420k+000, and the overall morphological change revealed little erosion along the coast. The erosion and deposition that occurred during the winter revealed that the sediment was transported and deposited to the south. Erosion was noticeable on the north bank of the river mouth from sea level to 5 m into the water (Figure 23(b2)). The simulated year-round morphological change of Region B (Figure 23(b3)) showed that sediment was transported both northward and southward along the coast. The coast north to Dazhu River exhibited a more marked trend of erosion. Erosion was also simulated near the river mouth south toward the Dazhu River.
Figure 24(a1–a3) presents the current field result for Region C. In the summer (Figure 24(a1)), the nearshore current near the Taimali River mouth, flowed northward, whereas the offshore current in this area flowed toward the south. This phenomenon of opposite current directions was observed in the section between the river mouth and 399k+000. Except for this section, all currents along the coast flowed toward the south, which was possibly attributable to the southward offshore current in this area. In the winter, the nearshore currents all flowed southward (Figure 24(a2)) at a higher speed than that in the summer because of the consistent direction of nearshore and offshore currents that were induced by the winter wave conditions. The year-round current field (Figure 24(a3)) revealed an overall southward direction of the coastal currents in Region C. Figure 24(b1–b3) depicts the simulated erosion and deposition trends in Region C. The sediment was transported mainly to the north and south banks of the river mouth (400k+000-409k+000). Little coastal erosion was uncovered from the overall morphological change results (Figure 24(b1)). According to the morphological change in winter (Figure 24(b2)), the river transported sediment to the south; therefore, erosion was the most prominent at the north bank of the river mouth from sea level to 5 m in the water. The erosion trend was observed in the section from the north side of the Taimali River mouth to Sanhe. The simulated year-round morphological change (Figure 24(b3)) revealed a predominantly southward sediment transport by the river. A trend of deposition occurred in the area south toward the Taimali River, whereas an erosion trend was observed north toward the river. Overall, the morphological change result revealed little coastal erosion in the research site. Due to the steep slope of the coast in the study area, the erosion zone is limited to 5 m depth, which makes the erosion area narrow. Therefore, the erosion patterns in Figure 22, Figure 23 and Figure 24 were not obvious.
4.4. Analysis of the Potential for Wave Attacks along the Provincial Highway
Figure 25 presents a map of the potential for wave attacks along the Provincial Highway in Region A. A high potential of wave attacks was shown in two sections in the area north toward Dawu Fishing Port (i.e., 435K+000-435K+500 and 434K+000-434K+500). Because the two sections exhibited a run-up height of approximately 16 m and the Provincial Highway’s elevation was 8 and 10 m, they were subject to a high possibility of wave attacks. In the area between Dawu Fishing Port and Nanxing, the section from 439K+500 to 441K+000 exhibited a high potential of wave attacks. Although this section’s run-up height (10 m) was lower than that of the aforementioned two sections, the low elevation in this section of the Provincial Highway contributed to its high risk of wave attacks. According to the wave-overtopping result (Figure 25), the area near 435K+500 showed overtopping of over 10−3 (l/s/m). The remaining sections with the potential for wave attacks all exhibited overtopping ranging between 10−4 and 10−3 (l/s/m). Accordingly, the amount of overtopping in all potential sections was below the tolerance level of wave-overtopping for revetment (5 × 10⁻² (l/s/m)). However, regarding the tolerance level for traffic safety (5 × 10⁻⁴ (l/s/m)), except for the Nanxing section where the overtopping was near the tolerance level, all sections failed to meet the standard for traffic safety. The relatively high potential of wave attacks in Region A of the Provincial Highway was mainly caused by the low elevation in this part of the highway and its short distance from the shore. The Nanxing section, because of the long-term small amount of sediment that was transported there from groins built in Dawu Fishing Port, was subject to coastal erosion and beach loss. In addition, when typhoon waves occurred, the deep water and steep terrain, which are less effective in dissipating long waves, thereby attacking the Provincial Highway and causing hazardous driving conditions.
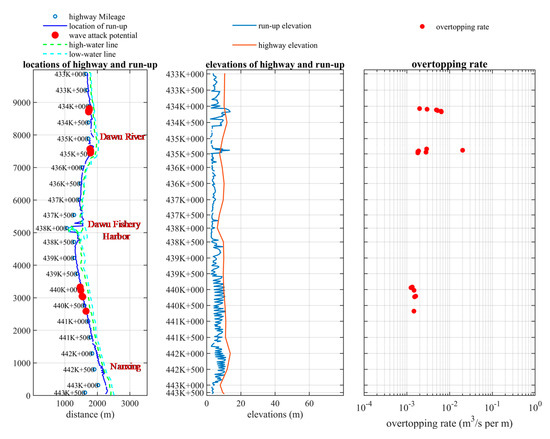
Figure 25.
Map of the potential for wave attacks along the Provincial Highway in Region A.
According to the figure that shows the potential for wave attacks in Region B (Figure 26), this region was subject to more wave attacks than Region A. Various locations with a high potential for wave attacks were observed in 417K+500-419K+000, 421K+000-422K+500, 423K+500-425K+500, and 427K+500-428K+500. Among these sections, the highest run-up height (approximately 18 m) occurred at 422K+000, which also had a relatively low elevation (the elevation of the lowest point was approximately 14 m) along the Provincial Highway. Therefore, the area near 422K+000, given its high risk of wave attacks, must be carefully monitored. According to the wave-overtopping result, the area near 422K+000 exhibited overtopping of approximately 6 × 10⁻³ (l/s/m), and the rest of the sections with the potential for wave attacks all had overtopping ranging between 10−3–10−2 (l/s/m). Accordingly, the overtopping in all sections was below the tolerance level of wave-overtopping for revetment (5 × 10⁻² (l/s/m)). However, regarding the wave-overtopping tolerance level for traffic safety (5 × 10⁻⁴ (l/s/m)), none of the sections met the standard for traffic safety. The high potential of wave attacks in Region B was attributable to similar reasons as those causing the high potential in the Nanxing section. The Provincial Highway had a relatively low elevation and short distance from the shore in Region B. Although the elevation in Region B was higher than that in the Nanxing section, the deeper water and steeper terrain hindered the dissipation of waves traveling to the nearshore area and thus contributed to the higher risk of wave attacks.
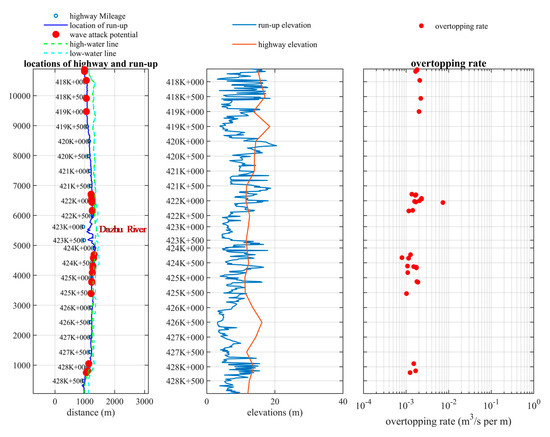
Figure 26.
Map of the potential for wave attacks along the Provincial Highway in Region B.
Figure 27 displays the map of wave attack potential in Region C, which exhibited the least potential among all three regions. Only one section with the potential for wave attacks was reported (395K+500). The overall low wave attack potential in Region C was mainly because of its generally high elevation, which alleviated the influence of run-up height on the Provincial Highway. The 395K+500 section exhibited the lowest elevation and closest distance from the shore in Region C and thus was determined to have the potential for wave attacks. The maximum run-up height and elevation in this section was 10 m and was slightly lower than 10 m, respectively. In addition, despite the relatively high run-up in the 407K+000 section, it was not determined as a potential area because it was situated far from the shore. According to the wave-overtopping analysis, the wave-overtopping in the 395K+500 section (2 × 10⁻³ (l/s/m)) was below the tolerance level for revetment (5 × 10⁻² (l/s/m)) but above the tolerance level for traffic safety (5 × 10⁻⁴ (l/s/m)). Therefore, drivers that travel on this section of the Provincial Highway during typhoons must pay close attention to the surrounding conditions to protect themselves from being injured by overtopping waves. Because of its relatively high elevation, Region C had a lower potential for wave attacks than did the other two regions, with the only potential area of wave attacks shown at the Sanhe coast. According to a field survey, the run-up height can come up to the Provincial Highway during an extreme event even though the swash zone in the Sanhe section is larger than the other two regions.
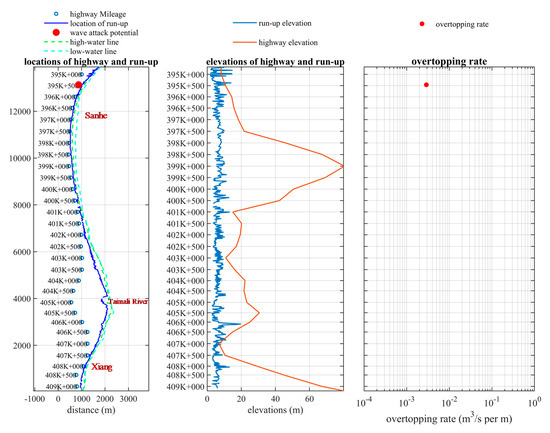
Figure 27.
Map of the potential for wave attacks along the Provincial Highway in Region C.
4.5. Analysis of Erosion Potential
Figure 28 presents the result of erosion potential in Region A. The section from 435K+000-438K+000 north toward Dawu Fishing Port indicated a high level of deposition. Erosion was revealed in the section from the south of Dawu Fishing Port to Nanxing in the medium-to-long term; however, this erosion did not reach the standard for hazard potential. A high level of deposition was observed in 438K+000 at Dawu Fishing Port, which reflected the common problem of deposition within the sheltered waters of fishing ports. In Region B, an overall erosion trend was observed (Figure 29). Because the coastline was straight, except for where the river mouth was located, the seasonal morphological variation was small. According to the long-term morphological change analysis, a moderate erosion trend was observed in sections 418k+000, 420K+000, and 428K+000-428K+500. Given their moderate erosion, regular inspection should be conducted on these sections. In Region C, an overall erosion trend was shown along the coast (Figure 30) except for south of the Taimali River mouth (404K+000-407K+000), where deposition was observed. The river mouth exhibited seasonal variation in erosion and deposition. The Sanhe coast (397K+500) was determined to be of medium erosion potential; furthermore, its proximity to the Provincial Highway made close attention to morphological change necessary.
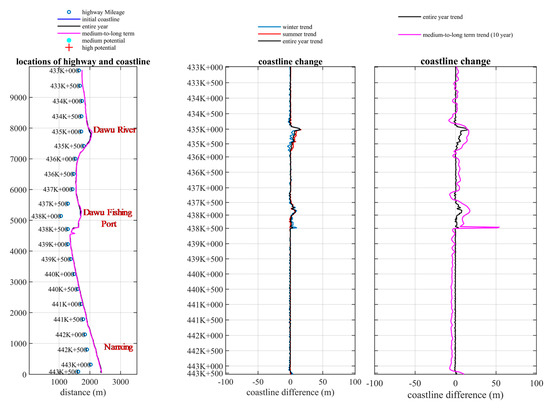
Figure 28.
Map of the potential for erosion in Region A.
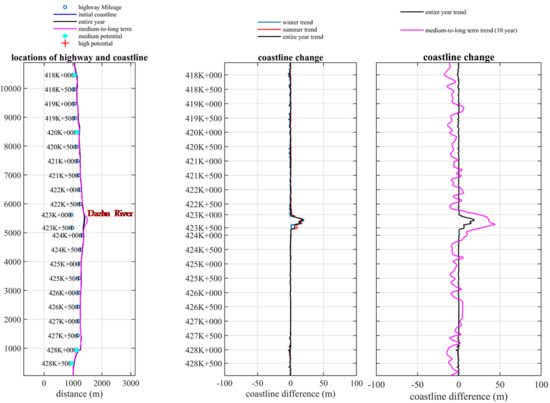
Figure 29.
Map of the potential for erosion in Region B.
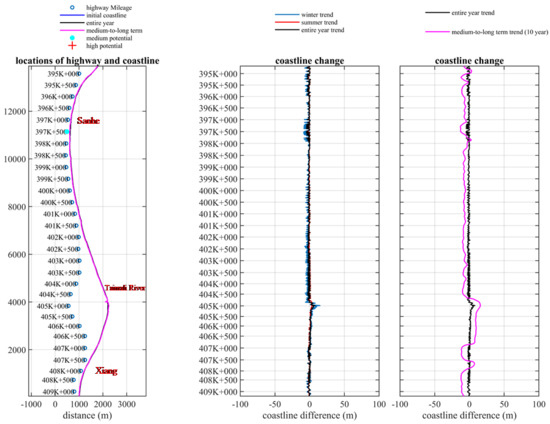
Figure 30.
Map of the potential for erosion in Region C.
5. Summary
This study examined the characteristics of coastal hazards along the Provincial Highway regarding extreme waves, storm surge and coastal morphological change. A suite of nested numerical models used to simulate the hydrodynamic forces and morphological change at far field, medium field and near-field grids along the south eastern Taiwan coast. Then, the characteristics of wave attacks and medium-to-long-term morphological change were explored to understand sections of the highway with relatively high vulnerability to coastal hazards. Such potential was determined through numerical simulation and comparison with field observations and site characteristics. These models all exhibited satisfactory performance according to comparisons between their simulated values and observational values. Hazard characteristics were analyzed based on the simulated results to determine the distribution of hazard potential (for wave attacks and erosion separately) along the Provincial Highway. The analysis result may provide insights into future construction works or hazard prevention operations.
- The numerical simulation and analysis on relevant data constituted a comprehensive and logical discussion on hazard characteristics along the Provincial Highway. The models (i.e., far-field, medium-field, and near-field simulations) were all verified and modified using the collected observational data. In addition, this study verified the ability of the model data including meshes, boundary conditions, and numerical terrain data to produce a reliable simulation of physical phenomena along the Provincial Highway.
- The hazard characteristics were analyzed from the simulated results to understand possible hazards on the Provincial Highway. Two types of hazard, attacks and erosion, were used in the analysis to mark sections with a high potential for hazard.
- By analyzing wave attack characteristics, this study focused on the influences of run-up and wave-overtopping on the Provincial Highway. The result revealed a high potential of wave attacks in the following sections of the highway: 440K+000-441K+000, areas near 424K+500, and 396K+000-396K+500.
- According to the analysis of erosion characteristics, the highest potential for erosion was shown in the areas near 418K+000 and 397K+500. Due to constant slope erosion, these areas had a risk of landslides in the medium-to-long term. In addition, a deposition trend was observed in Dawu Fishing Port, which may hinder the operation of public facilities in the long term.
This study is mainly aimed at investigating the potential risks, in terms of both wave attack and erosion, affecting a highway in Taiwan. Even though the work mainly focuses on the regional area, it provides an overview of an important coastal issue, as well as the description of a suitable methodology to be applied for coastal adaption to extreme conditions. Future work will consider various empirical formulas for estimating wave overtopping and the effect of typhoons. Moreover, long-term wave run-up and morphological changes monitoring for identifying the vulnerable areas are required to further verify the assessment in this study.
Author Contributions
W.-S.L., H.-L.W., K.-C.H., Y.-L.C., W.-B.C., S.-C.H., Y.H., C.-Y.C. and L.-H.T. conceived the research topic; W.-S.L., H.-L.W., K.-C.H., Y.-L.C., Y.H., C.-Y.C. and L.-H.T. performed the numerical simulations and data analyses; and W.-S.L., H.-L.W., S.-C.H., and W.-B.C. wrote the paper. All authors have read and agreed to the published version of the manuscript.
Funding
This study was financially supported by the Ministry of Science and Technology, Taiwan (MOST 109-2625-M-006-010, MOST 109-2217-E-006-002-MY3 and MOST 108-2221-E-006-087-MY3) and the Institute of Nuclear Energy Research (INER), Atomic Energy Council, Taiwan, under grant 109B010.
Acknowledgments
Special thanks to CECI engineering consultants, Inc. and Directorate General of Highways (DGH) for helping the recommendations.
Conflicts of Interest
The authors declare no conflict of interest.
Appendix A
PTM is a particle tracking model capable of introducing and following the trajectory of discrete particles in the flow field. It combines particle transport computations using both Lagrangian and Eulerian methods, depending on a Eulerian hydrodynamic model such as CMS-Flow for current velocities. In a Lagrangian framework, it computes the paths of sediment particles using the Lagrangian method through a geometric domain as the particles interact with the computational environment. The sediment particle can be of either cohesive or non-cohesive. The computational environment includes the hydrodynamic flow, wave conditions, sediment property, and land boundary. Therefore, water surface elevations and currents calculated by CMS-Flow and wave information by CMS-Wave drive the PTM computations in the same CMS domain. The SMS includes tools to generate the necessary information to define the PTM environment, such as sediment release method and sediment properties.
The default value of the bottom friction coefficient, a Manning’s N value of 0.025 as recommended by CMS, was used here. Grain sizes vary widely in the estuary presenting challenges for sediment transport models. Given this large range in grain size, a high degree of sediment transport specification is necessary. From the model sensitivity tests, the Van Rijn’s (1984ab; 2007ab) [37,38,39,40] transport formula were selected as the sediment transport equations for bedload and suspended load in CMS-Flow. An adaptation length, or scaling of the transport capacity, of 10 m was used for the NET (non-equilibrium transport) computation of transport. The grain size information of D35, D50, and D90 for each cell. In the CMS-Flow grid the values are 5 mm, 10 mm and 25 mm respectively, and as the Native Sediment Dataset for PTM.
Additionally, bed roughness calculations in the model are based on the surficial sediment grain size. The sediment grain size (D50) is used in the computation of bed forms, which produce form roughness. The sediment grain size (D90) is used in the computation of skin roughness. These values are input and assigned to each node in the domain and may vary across the domain. Non-erodible areas (e.g., rock outcroppings) can be specified with an effective skin roughness height in place of a grain size. In this case, sediment sources be specified as areas. An area source was designated to represent the nearshore placement of dredged materials from a barge. According to the field investigation data, the parameter D50 and the stand deviation of sediment grain size distribution is 10 mm and 2.0, respectively.
In PTM, the threshold of motion for bed sediments and particles resting on the bed is commonly defined by the Shields curve (Yalin, 1977) [41], which is given by the dimensionless Shields parameter. In the 2-D model, the sediment particles are independent of each other and do not interact with the native sediment. Erosion and deposition are controlled by the transport threshold (Shields curve or user-defined). This method neglects bed-particle interactions. The dimensionless mobility M with the ratio of the skin shear stress acting on the bed is key parameter for the particles are considered to be moving (M > 1) or standing (M < 1).
References
- EurOtop. Manual on wave overtopping of sea defenses and related structures. An overtopping manual largely based on European research, but for worldwide application. Eur. Overtopping Man. 2018. Available online: www.overtopping-manual.com (accessed on 21 November 2020).
- Sabino, A.; Rodrigues, A.; Araújo, J.; Poseiro, P.; Reis, M.T.; Fortes, C.J. Wave overtopping analysis and early warning forecast system. In Proceedings of the International Conference on Computational Science and Its Applications, Guimarães, Portugal, 30 June–3 July 2014; pp. 267–282. [Google Scholar]
- Mase, H.; Tamada, T.; Yasuda, T.; Hedges, T.S.; Reis, M.T. Wave runup and overtopping at seawalls built on land and in very shallow water. J. Waterw. Port Coast. Ocean Eng. 2013, 139, 346–357. [Google Scholar] [CrossRef]
- Shih, H.-J.; Chen, H.; Liang, T.-Y.; Fu, H.-S.; Chang, C.-H.; Chen, W.-B.; Su, W.-R.; Lin, L.-Y. Generating potential risk maps for typhoon-induced waves along the coast of Taiwan. Ocean Eng. 2018, 163, 1–14. [Google Scholar] [CrossRef]
- Chien, L.-K.; Chi’u, S.-Y.; Tseng, W.-C.; Hsu, C.-H. The Study of Coastal Risk Assessment of Planning and Management for Coastal Area in Taiwan. In Proceedings of the Twenty-second International Offshore and Polar Engineering Conference, Rhodes, Greece, 17–22 June 2012. [Google Scholar]
- Huang, W.-P.; Hsu, J.-C.; Chen, C.-S.; Ye, C.-J. The Study of the Coastal Management Criteria Based on Risk Assessmeant: A Case Study on Yunlin Coast, Taiwan. Water 2018, 10, 988. [Google Scholar] [CrossRef]
- Huang, W.-P.; Hsu, C.-A.; Kung, C.-S.; Yim, J.Z. Numerical studies on typhoon surges in the Northern Taiwan. Coast. Eng. 2007, 54, 883–894. [Google Scholar] [CrossRef]
- Chen, W.-B.; Chen, H.; Hsiao, S.-C.; Chang, C.-H.; Lin, L.-Y. Wind forcing effect on hindcasting of typhoon-driven extreme waves. Ocean Eng. 2019, 188, 106260. [Google Scholar] [CrossRef]
- Hsiao, S.-C.; Chen, H.; Chen, W.-B.; Chang, C.-H.; Lin, L.-Y. Quantifying the contribution of nonlinear interactions to storm tide simulations during a super typhoon event. Ocean Eng. 2019, 194, 106661. [Google Scholar] [CrossRef]
- Hsiao, S.-C.; Chen, H.; Wu, H.-L.; Chen, W.-B.; Chang, C.-H.; Guo, W.-D.; Chen, Y.-M.; Lin, L.-Y. Numerical Simulation of Large Wave Heights from Super Typhoon Nepartak (2016) in the Eastern Waters of Taiwan. J. Mar. Sci. Eng. 2020, 8, 217. [Google Scholar] [CrossRef]
- Southgate, H.N. The effects of wave chronology on medium and long term coastal morphology. Coast. Eng. 1995, 26, 251–270. [Google Scholar] [CrossRef]
- Walstra, D.; Hoekstra, R.; Tonnon, P.; Ruessink, B. Input reduction for long-term morphodynamic simulations in wave-dominated coastal settings. Coast. Eng. 2013, 77, 57–70. [Google Scholar] [CrossRef]
- Fayyaz, M.; Shafieefar, M.; Dastgheib, A. Evaluation of the effects of sediment characteristics on long-term estuarine morphological modelling driven by waves and tides. Appl. Ocean Res. 2019, 92, 101919. [Google Scholar] [CrossRef]
- Moerman, E. Long-Term Morphological Modeling of the Mouth of the Columbia River. Master’s Thesis, Delft University of Technology, Delft, The Netherlands, 2011. [Google Scholar]
- Knaapen, M.; Joustra, R. Morphological acceleration factor: Usability, accuracy and run time reductions. In Proceedings of the TELEMAC-MASCARET User Conference 2012, Oxford, UK, 18–19 October 2012. [Google Scholar]
- Styles, R.; Brown, M.E.; Brutsché, K.E.; Li, H.; Beck, T.M.; Sánchez, A. Long-term morphological modeling of barrier island tidal inlets. J. Mar. Sci. Eng. 2016, 4, 65. [Google Scholar] [CrossRef]
- Tsoukala, V.K.; Chondros, M.; Kapelonis, Z.G.; Martzikos, N.; Lykou, A.; Belibassakis, K.; Makropoulos, C. An integrated wave modelling framework for extreme and rare events for climate change in coastal areas—The case of Rethymno, Crete. Oceanologia 2016, 58, 71–89. [Google Scholar] [CrossRef]
- Gaeta, M.G.; Bonaldo, D.; Samaras, A.G.; Carniel, S.; Archetti, R. Coupled wave-2D hydrodynamics modeling at the Reno river mouth (Italy) under climate change scenarios. Water 2018, 10, 1380. [Google Scholar] [CrossRef]
- Postacchini, M.; Lalli, F.; Memmola, F.; Bruschi, A.; Bellafiore, D.; Lisi, I.; Zitti, G.; Brocchini, M. A model chain approach for coastal inundation: Application to the bay of Alghero. Estuar. Coast. Shelf Sci. 2019, 219, 56–70. [Google Scholar] [CrossRef]
- Postacchini, M.; Ludeno, G. Combining numerical simulations and normalized scalar product strategy: A new tool for predicting beach inundation. J. Mar. Sci. Eng. 2019, 7, 325. [Google Scholar] [CrossRef]
- Torresan, S.; Gallina, V.; Gualdi, S.; Bellafiore, D.; Umgiesser, G.; Carniel, S.; Sclavo, M.; Benetazzo, A.; Giubilato, E.; Critto, A. Assessment of climate change impacts in the North Adriatic coastal area. Part I: A multi-model chain for the definition of climate change hazard scenarios. Water 2019, 11, 1157. [Google Scholar] [CrossRef]
- Apollonio, C.; Bruno, M.F.; Iemmolo, G.; Molfetta, M.G.; Pellicani, R. Flood Risk Evaluation in Ungauged Coastal Areas: The Case Study of Ippocampo (Southern Italy). Water 2020, 12, 1466. [Google Scholar] [CrossRef]
- Jang, D.; Joo, W.; Jeong, C.-H.; Kim, W.; Park, S.W.; Song, Y. The Downscaling Study for Typhoon-Induced Coastal Inundation. Water 2020, 12, 1103. [Google Scholar] [CrossRef]
- Central Weather Bureau (CWB). Available online: http://scweb.cwb.gov.tw/Twenty.aspx?ItemId=4&loc=tw (accessed on 29 September 2020).
- Booij, N.; Holthuijsen, L.; Ris, R. The “SWAN” wave model for shallow water. Coast. Eng. 1996, 1997, 668–676. [Google Scholar]
- Westerink, J.; Luettich, R. Tide and Storm Surge Predictions in the Gulf of Mexico Using Model ADCIRC-2D; Contract Report for the US Army Engineer Waterways Experiment Station: Vicksburg, MS, USA, 1991. [Google Scholar]
- Luettich, R.A.; Westerink, J.J.; Scheffner, N.W. ADCIRC: An Advanced Three-Dimensional Circulation Model for Shelves, Coasts, and Estuaries. Report 1, Theory and Methodology of ADCIRC-2DD1 and ADCIRC-3DL. 1992. Available online: https://erdc-library.erdc.dren.mil/jspui/handle/11681/4618 (accessed on 21 November 2020).
- United States National Geophysical Data Center. Available online: https://www.ngdc.noaa.gov/mgg/global/ (accessed on 21 November 2020).
- Willmott, C.J. On the validation of models. Phys. Geogr. 1981, 2, 184–194. [Google Scholar] [CrossRef]
- Demirbilek, Z.; Li, H.; Lin, L.; Beck, T.M.; Moritz, H.R. Preliminary Analysis of Morphology Change, Waves, and Currents for Navigation at Tillamook Inlet, Oregon; Army Engineer Research and Development Center, Coastal and Hydraulics Laboratory: Vicksburg, MS, USA, 2013. [Google Scholar]
- Sánchez, A.; Wu, W.; Li, H.; Brown, M.E.; Reed, C.W.; Rosati, J.D.; Demirbilek, Z. Coastal Modeling System: Mathematical Formulations and Numerical Methods. 2014. Available online: https://usace.contentdm.oclc.org/digital/collection/p266001coll1/id/3570/ (accessed on 21 November 2020).
- Lackey, T.; MacDonald, N. The particle tracking model description and processes. In Proceedings of the XVIII World Dredging Congress 2007, Lake Buena Vista, FL, USA, 27 May–1 June 2007. [Google Scholar]
- Engineers, U.A.C.O. Coastal Engineering Manual; US Army Corps of Engineers: Washington, DC, USA, 2011. [Google Scholar]
- Van der Meer, J.W.; Stam, C.-J.M. Wave runup on smooth and rock slopes of coastal structures. J. Waterw. Port Coast. Ocean Eng. 1992, 118, 534–550. [Google Scholar] [CrossRef]
- Bretschneider, C.L.; Tamaye, E.E. Hurricane wind and wave forecasting techniques. Coast. Eng. 1976, 1977, 202–237. [Google Scholar] [CrossRef]
- Sawaragi, T. Sediment and Coastal Erosion; Morikita Publishing Co., Ltd.: Tokyo, Japan, 1982; Volume 124, p. 125. [Google Scholar]
- van Rijn, L.C. Sediment transport, part II: Suspended load transport. J. Hydraul. Eng. 1984, 110, 1613–1641. [Google Scholar] [CrossRef]
- Van Rijn, L.C. Sediment transport, part I: Bed load transport. J. Hydraul. Eng. 1984, 110, 1431–1456. [Google Scholar] [CrossRef]
- Van Rijn, L.C. Unified view of sediment transport by currents and waves. I: Initiation of motion, bed roughness, and bed-load transport. J. Hydraul. Eng. 2007, 133, 649–667. [Google Scholar] [CrossRef]
- Van Rijn, L.C. Unified view of sediment transport by currents and waves. II: Suspended transport. J. Hydraul. Eng. 2007, 133, 668–689. [Google Scholar] [CrossRef]
- Yalin, M. Mechanics of Sediment Transport. Pergammon. Received: 6 January 2000 Accepted: 31 March 2001 Amended: 27 April 2001. 1977. Available online: https://catalogue.nla.gov.au/Record/469363 (accessed on 21 November 2020).


Publisher’s Note: MDPI stays neutral with regard to jurisdictional claims in published maps and institutional affiliations. |
© 2020 by the authors. Licensee MDPI, Basel, Switzerland. This article is an open access article distributed under the terms and conditions of the Creative Commons Attribution (CC BY) license (http://creativecommons.org/licenses/by/4.0/).