1. Introduction
The analysis of river flood risk is a basic aspect in any attempt to integrate river management, and it is included in the European Flood Directive (60/2007/EC). Flood risk analysis has multiple approaches based upon the type of elements at risk. These elements could be classified as tangible and intangible (thus bringing the analysis into the areas of economic or social risk, respectively) or as direct or indirect. However, elements such as cultural heritage (archaeological sites, historical buildings, artworks, etc.) are often located somewhere between both categories. This means they can be assigned an economic value (market value), while at the same time they represent the record of the history of human civilization, whose value is intangible.
This previously mentioned duality, but also mainly the irreversibility, of flood damage on cultural heritage (which cannot be reproduced once it has been destroyed) makes the prediction and assessment of the flood risks that may affect these sites a critical task for their preservation. Given this situation, the first natural disaster management strategies that included cultural heritage among its objectives began to be developed in the 90s. Among these initiatives, one could highlight the “Carta del Rischio” [
1], developed by the Italian Central Institute for Restoration since 1992, or the “Noah’s Ark” [
2] project of the European Union, launched in 2002.
There are many processes (natural or not) that can affect cultural heritage sites. Thus, references [
3,
4] classify them into two major categories: unpredictable disasters and predictable deterioration. The former group would include Natural Disasters, and this subgroup, in turn, would include River Floods. These natural disasters, more frequent in recent years possibly due to global climate change, have a strong impact on cultural heritage [
5,
6], much more than the predictable deterioration linked to cultural heritage elements of hundreds of year in age. For this reason, in 2009 the European Union financed the project “Cultural Heritage Protection against Flooding” with the aim of developing preventive strategies for the conservation of cultural heritage.
As these cultural heritage conservation projects began to develop, the first studies on the interaction between flood risk and cultural heritage began to appear. Lanza [
7] was possibly the first to analyze this relationship in detail, focusing on the historical city of Genova. Subsequently, and also on a scale of analysis that considers the effects of river floods on historic cities with a high number of cultural heritage elements, mention should be made of the work in the city of Prague [
8]; in the Thai city of Ayutthaya [
9,
10]; in the Iranian archaeological sites of Persepolis and Naghsh-e-Rostam [
11]; in New Taipei, Taiwan [
12]; in the city of Seville [
13]; in the archaeological site of Mogao Grottoes, located southeast of the Chinese city of Dunhuang [
14]; and in the city of Florence [
15]. With a different approach, works such as [
16] evaluate different physical processes associated with floods and the most common damages that these processes can cause on heritage elements (e.g., Díez-Herrero [
17]). Meanwhile, Herle et al. [
18] analyze the effect of floods on cultural heritage not from the point of view of the effect of surface water but from that of the structural problems associated with changes in the conditions of the terrain subsurface.
Most of the studies mentioned above focus on the damage to the cultural heritage associated with a single flood event (e.g., [
8,
9,
10,
11,
13]), or the possible damage level to heritage due to floods with different return periods (e.g., [
12,
14,
15]). Among the assessments that consider the “return period” variable in their analyses, most are based on the use of hydrological models for the simulation of the transformation process “precipitation-runoff” for the estimation of peak flows. While the analysis of Arrighi et al. [
15] uses the coupled hydraulic 1D-2D model HEC-RAS to determine the flooded area, flow depths and flow velocities, [
11,
13] both try to analyze the effects associated with extreme events, with periods of flooding recurrence over 500 years.
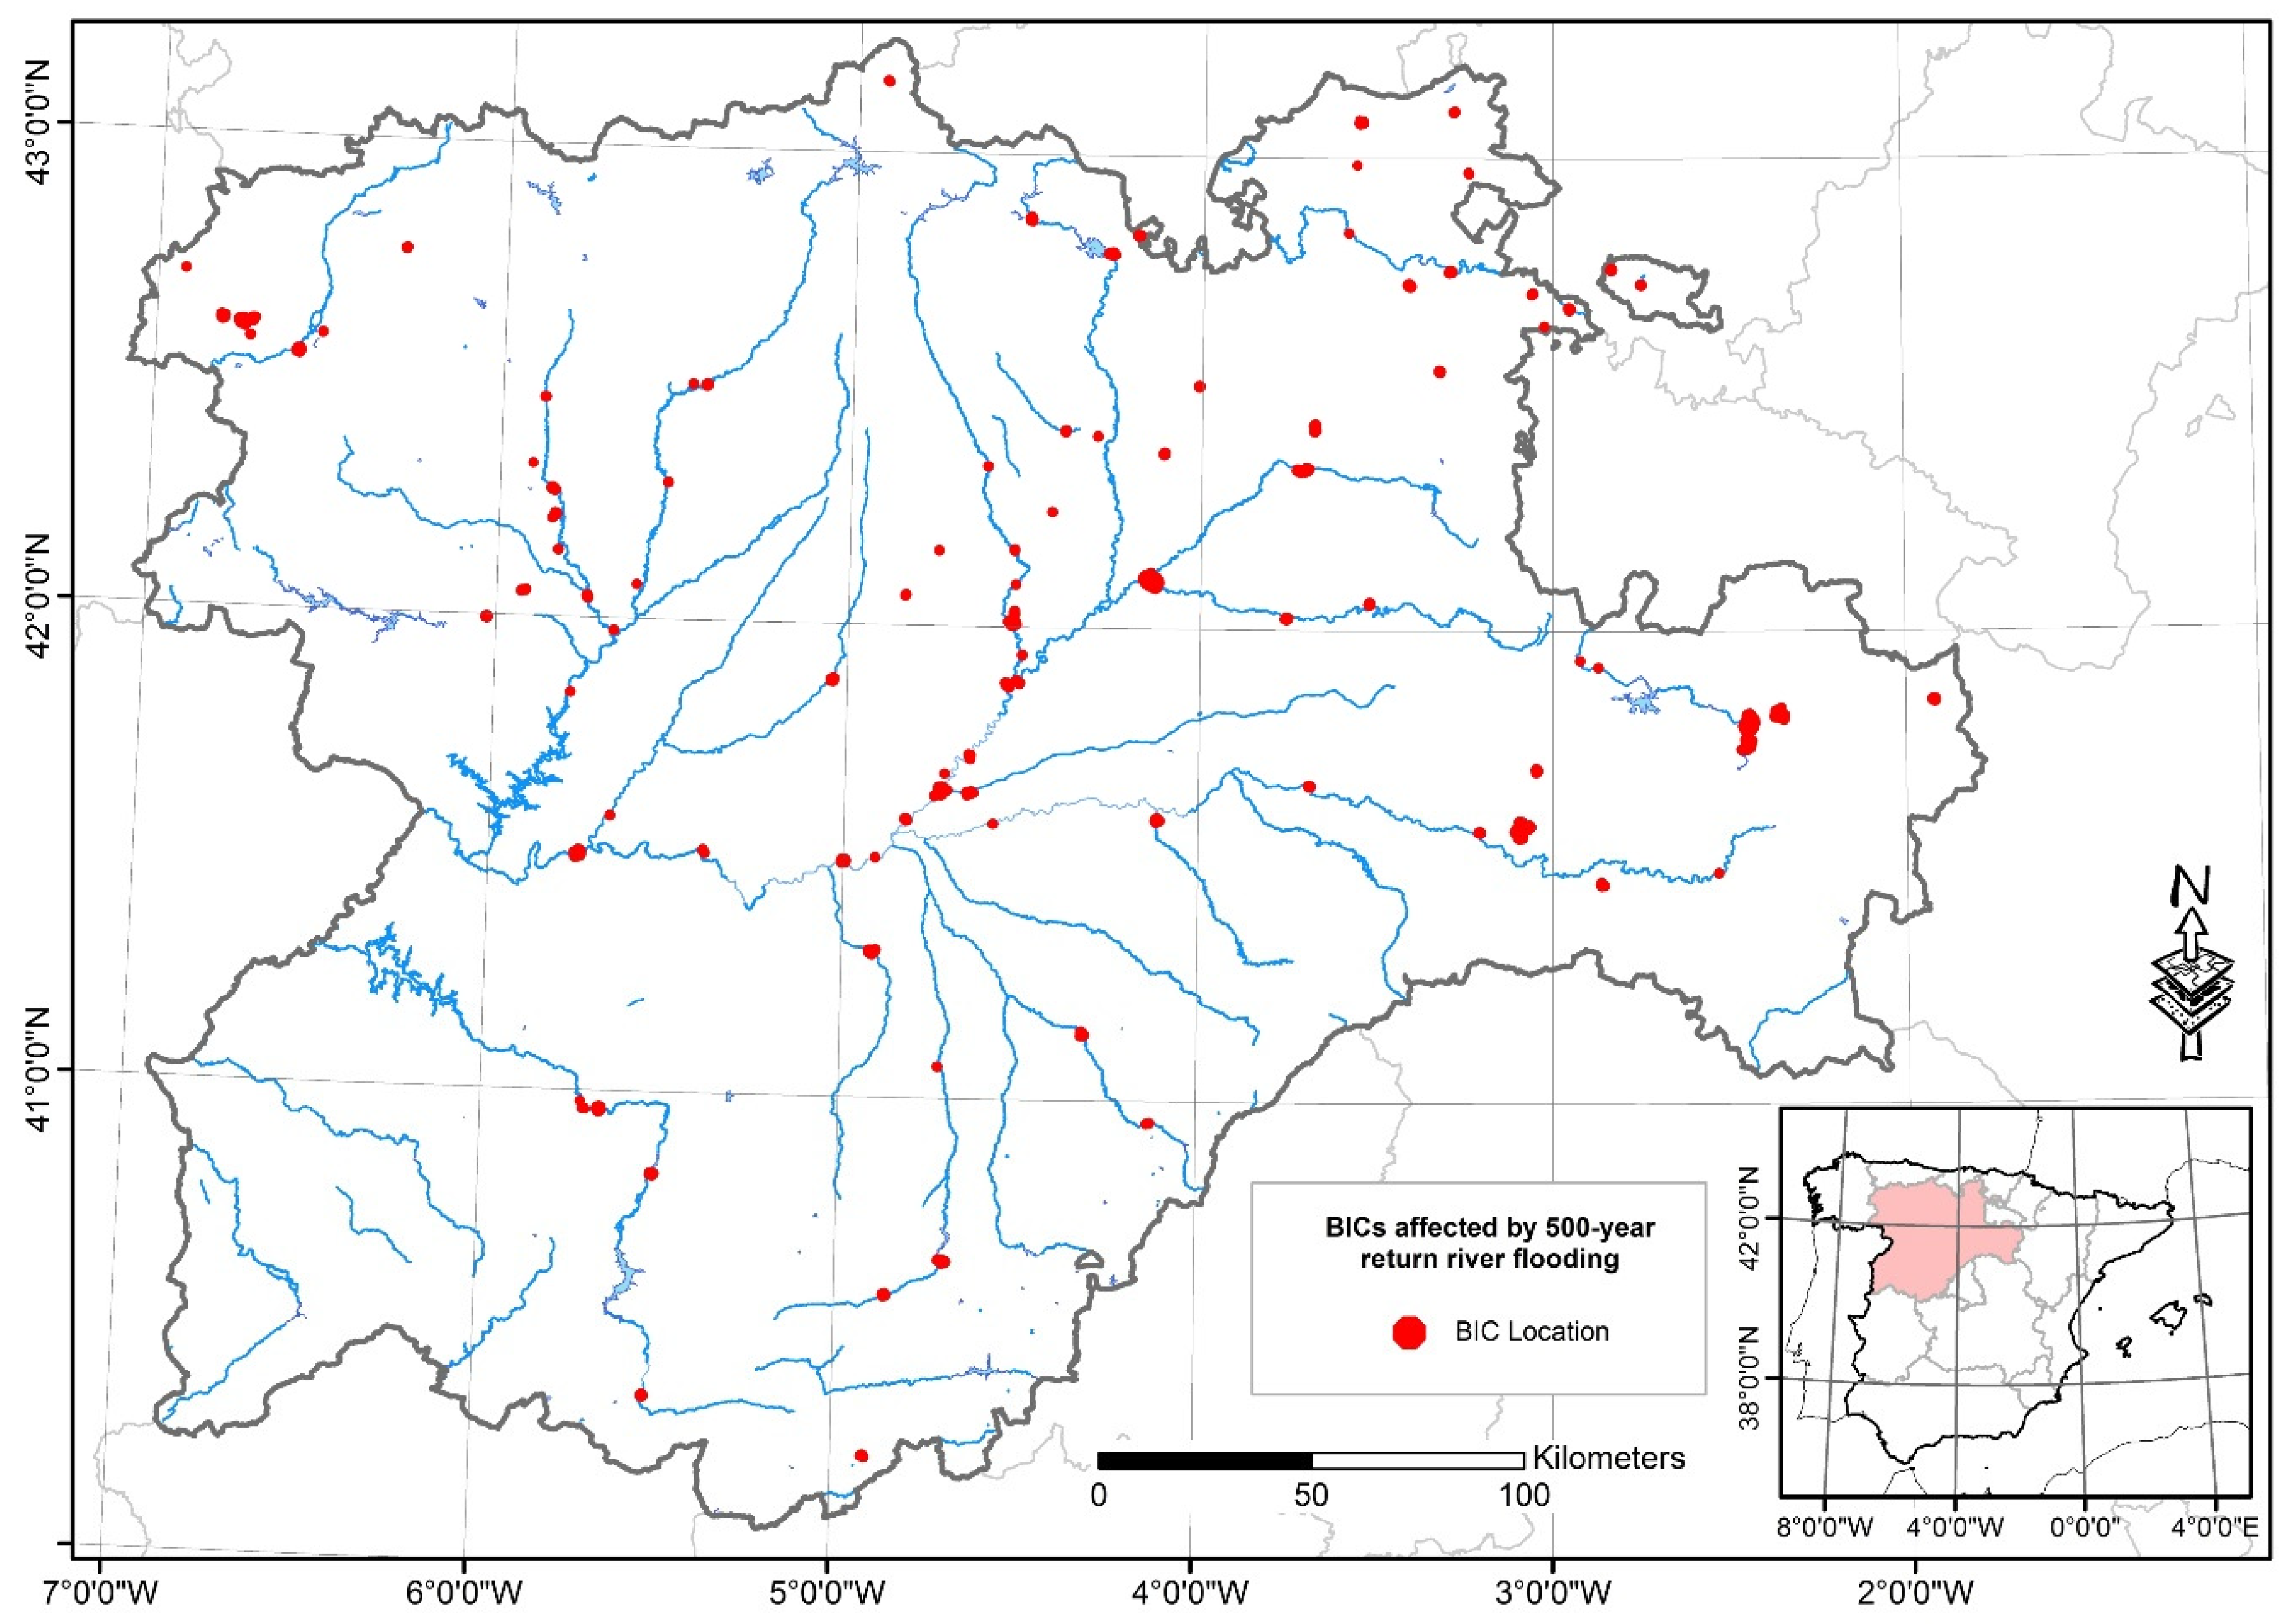
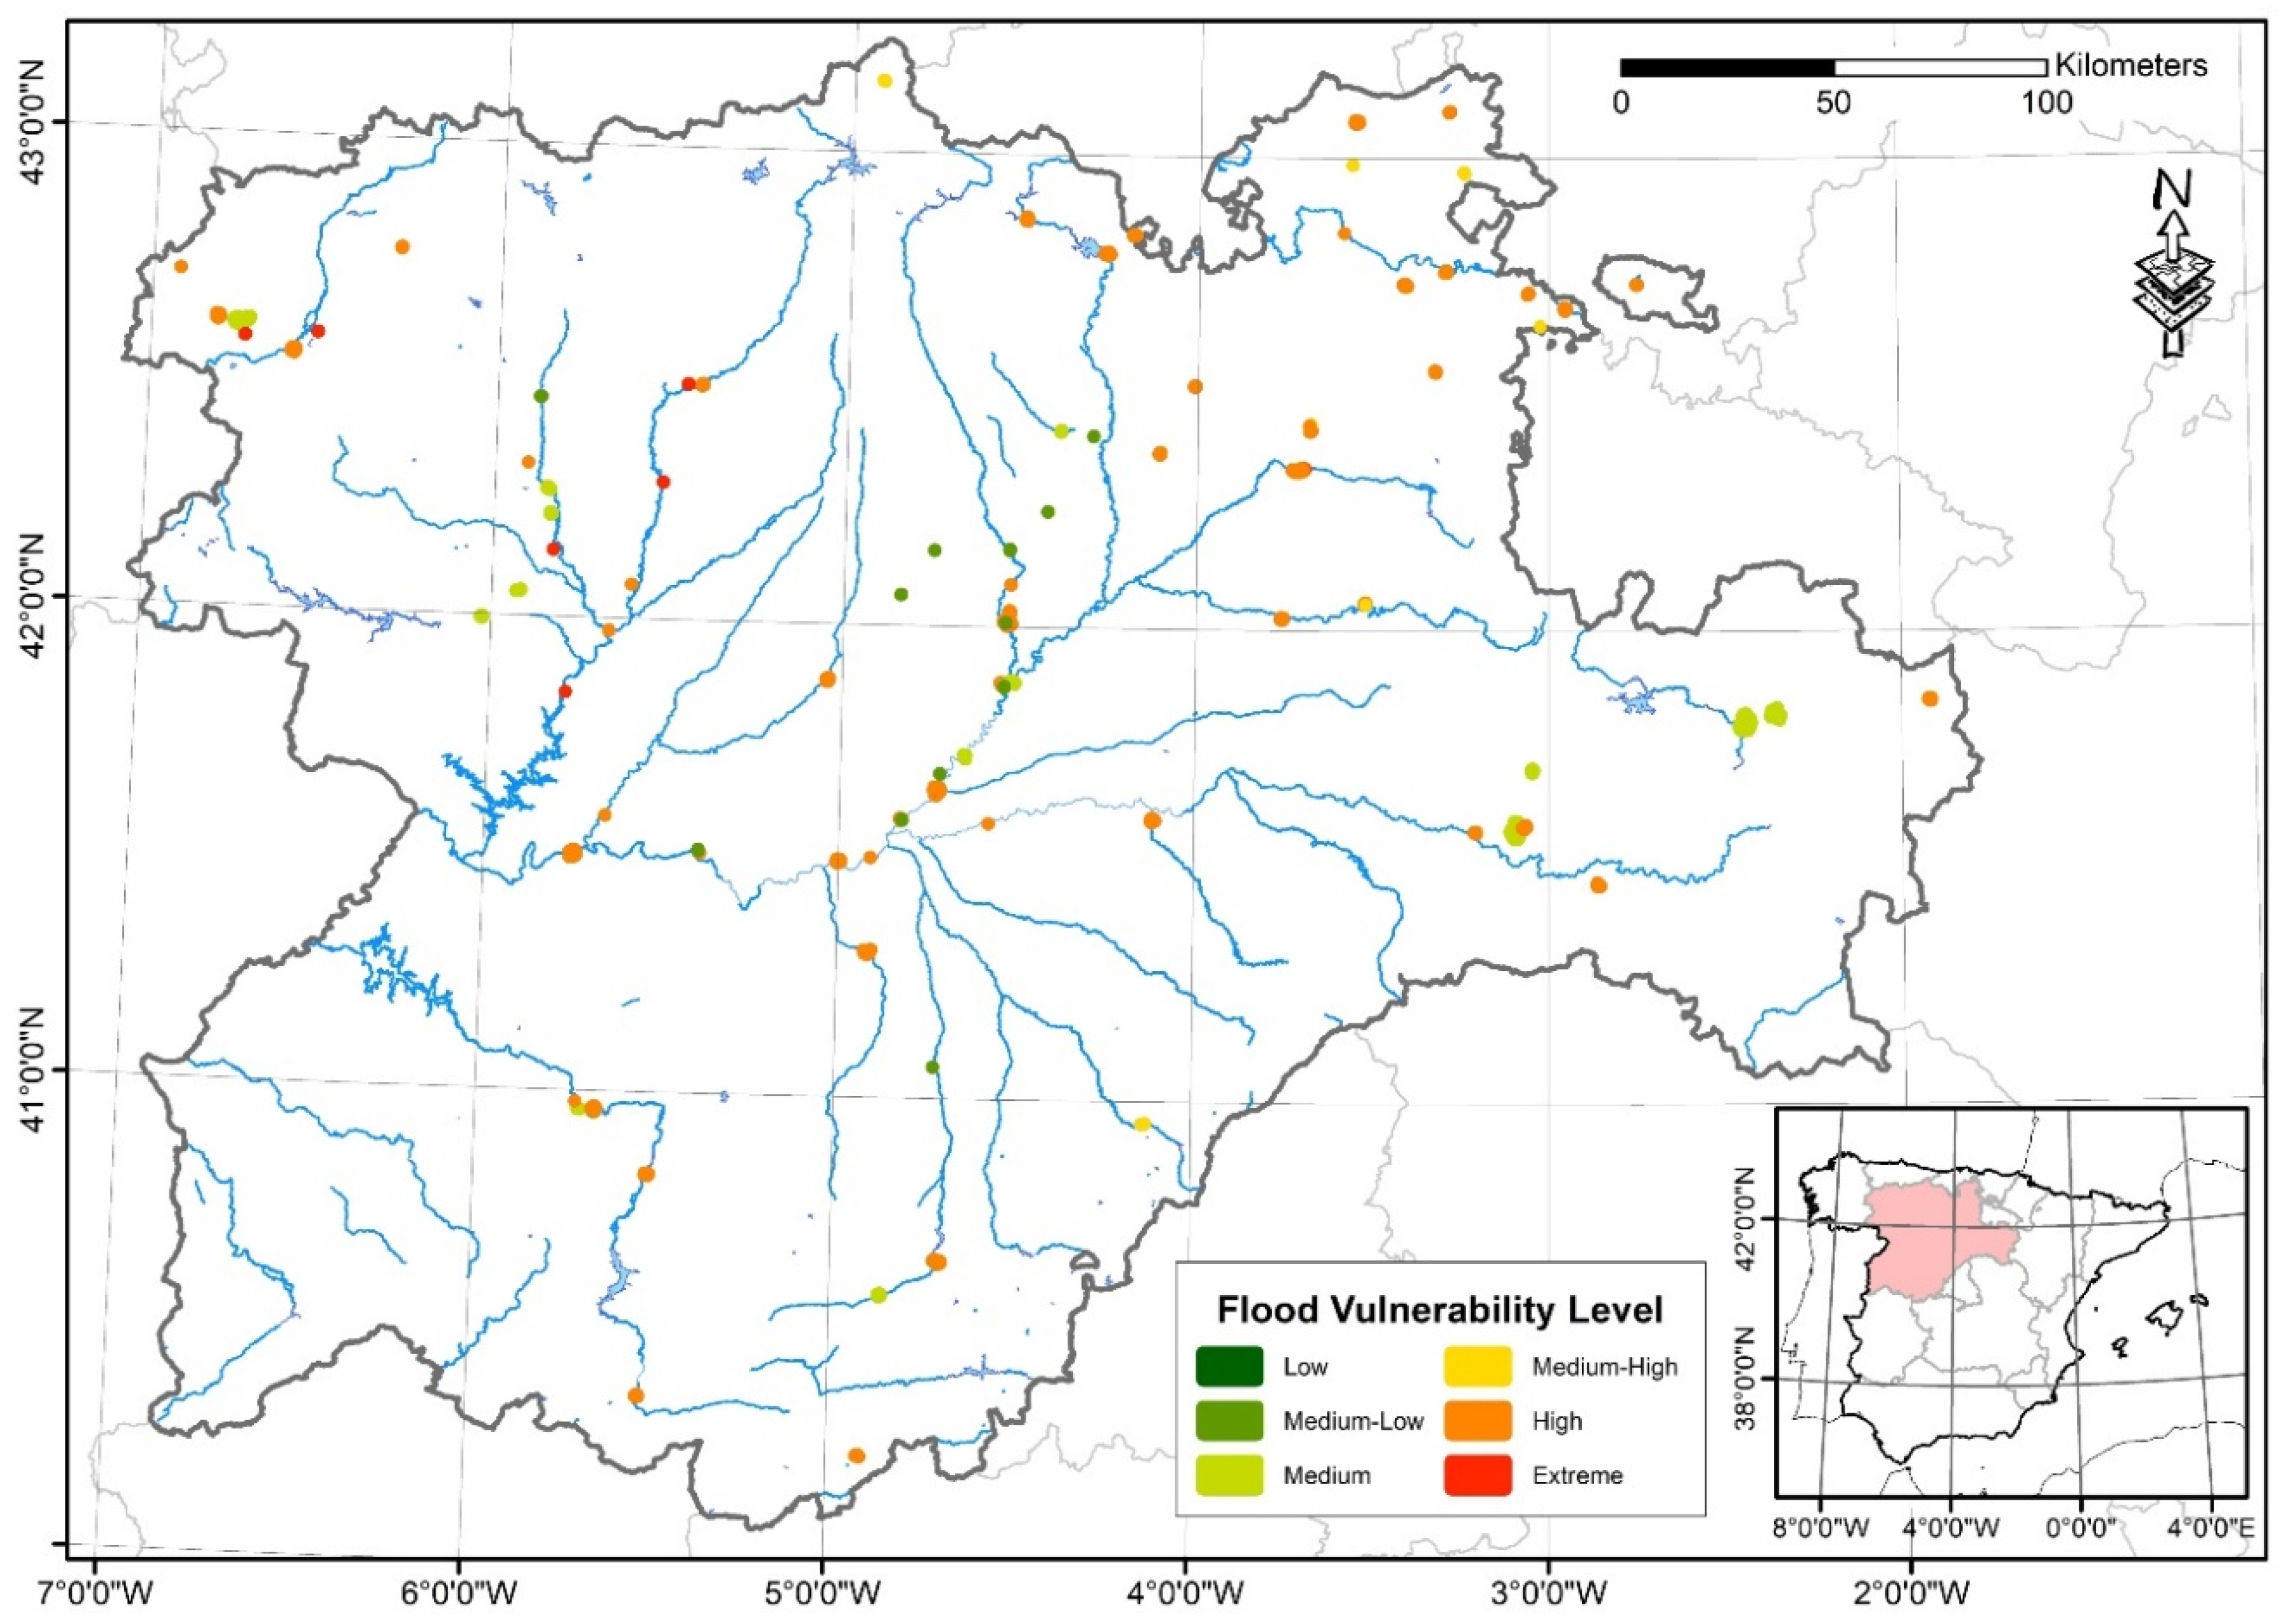
The present assessment tries to overcome some of the limitations found in previous works, with the aim of defining the level of potential flood risk (even qualitatively) for the cultural heritage sites of a wide region, such as the Autonomous Community of Castile and León (Central Spain). To achieve this objective, the flood hazard associated with different return periods will be analyzed, as well as the flood vulnerability of the different types of cultural heritage catalogued within the studied region. Another type of vulnerability analysis, social and economic vulnerability against flash flood risk, has recently been done for this region [
19,
20].
As mentioned above, some previous assessments of cultural heritage vulnerability have lags and uncertainties (subjectivity in used criteria, generalized BICs or “cultural heritage site” classifications, etc.), which do not render them invalid. Therefore, as improvements to the previously made assessments, the data considered for flood hazard assessment will be both hydrological–hydraulic as well as historical–documental and geomorphological (all of them linked to the information available in the Flood Prone Areas Cartography National System). From the point of view of flood hazard analysis, taking into account not only the return period of flooded areas but also the water depth and time lag, which improve the quantification of flood hazard. From the point of view of flood vulnerability analysis, taking into account the variety of cultural heritage elements catalogued, the approach has focused on the typology of the cultural heritage elements and its relationship with the hydraulic environment. Based on these variables, a matrix of potential flood risk has been developed for a flood risk categorization of cultural heritage sites. A GIS geodatabase helps us to integrate flood hazard and vulnerability values for each cultural heritage site. The quantification of the flood risk level in each cultural heritage site has allowed us to analyze the spatial distribution of this risk (clustering of flood risk results), as well as the ordered categorization of the patrimonial elements according to their risk level. All this will allow a scientifically based selection of single or geographically-linked groups of cultural heritage sites for the micro-scale assessment of their flood risk.
4. Discussion
To estimate the potential flood risk in the elements classified as Cultural Heritage sites in the Castile and León region, three matrices have been developed to encompass the analysis of flood hazard, flood vulnerability, and potential flood risk. When considering the proposed potential flood risk model, it must be considered that the approach of the present methodological framework has a regional and qualitative focus, albeit with quantitative classes for the matrix. This regional approach will therefore determine the variables to be used in each of the risk components, prioritizing the use of easy estimation variables, regional scope, and the possibility of being easily integrated into a GIS environment, which has been used as a key tool for the analysis.
Thus, from the point of view of the flood hazard analysis, the variables used were the flood return period, the flow depth, and the time lag of the drainage basin in which the flood occurs: all of them easily derivable variables from DTMs and hydrodynamic models. In this selection of variables, those that are more difficult to obtain on a regional scale have been left out, even if their use at a micro-scale or in analyses of individual buildings could be feasible (analyses of dynamic loads in structures, distribution of pressures, and structural deformations due to the fluid-structure interaction), as shown by [
29].
Another aspect to be taken into account is the value associated with the flow depth variable and its relationship with the flood hazard analysis (10, 100, and 500 years return period) at the locations of cultural heritage sites. From the different approaches for the representation of buildings in hydrodynamic models (e.g., [
30,
31]), the one used in this work uses the elevation of the cells where the buildings are located. Thus, in order to obtain the flow depth value, one polygon feature that delimits the extension of the cultural heritage site (with a neighborhood buffer of 1 m around it) has been used.
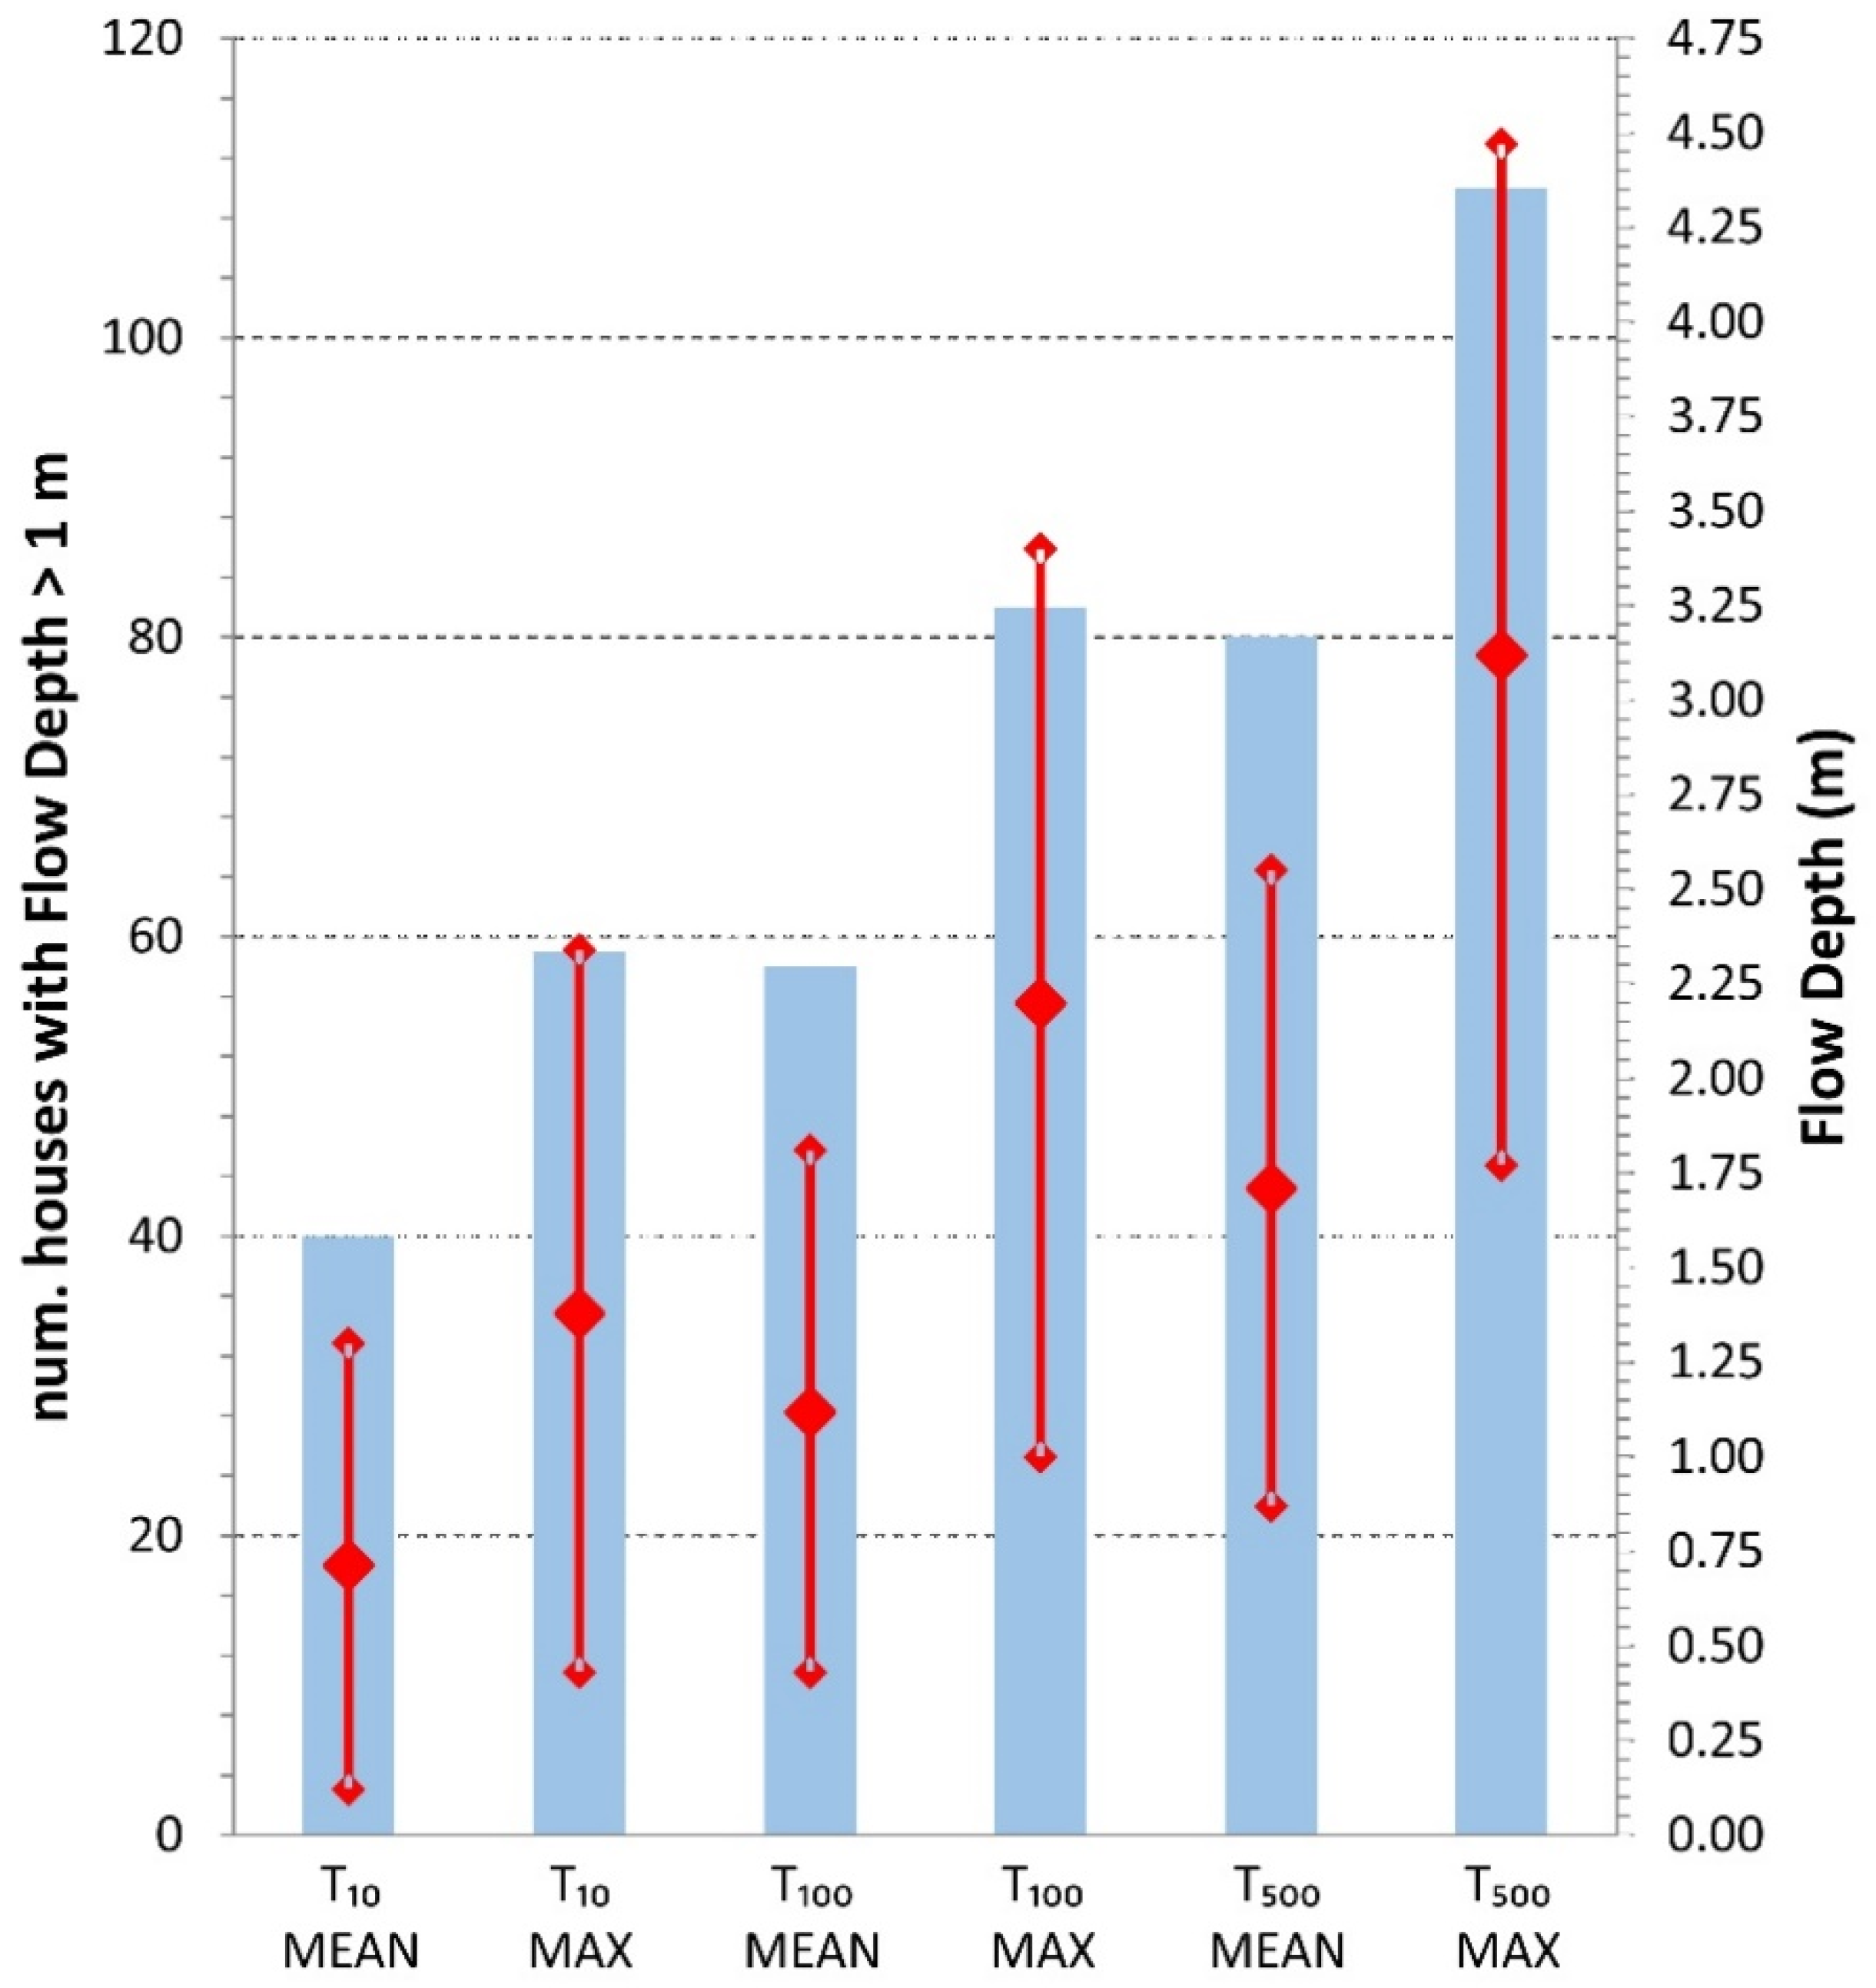
In the present analysis, the flow depth used is defined as the mean value for each Cultural heritage site. However, this average value does not represent the maximum possible flow depth, and the difference between those values will depend on the topographic variability inherent in the terrain. Therefore, it would be appropriate to consider the optimum value of flow depth to be used for the flood hazard assessment. The minimum and maximum values would take us to the extremes of security, and therefore, when dealing with patrimonial elements of difficult recovery or reproduction, the option of the minimum value does not seem optimal or desirable. At the same time, the use of the maximum value would lead us to work within the worst possible scenario, a situation that could be considered viable or optimal depending on the importance of the elements at risk. However, the use of the maximum value can also lead us to consider extreme flood hazards supported by errors in the hydraulic model or, what may be more common, the terrain topography represented through an DTM. In this sense, as indicated by Vaze et al. [
32], the use of LiDAR data has significantly improved the terrain representation in the DTMs. However, the urban areas (the majority in the location of cultural heritage sites) remain the most problematic and have the highest uncertainty, both in the correct representation of urban areas (e.g., References [
33,
34,
35]) and in the results of the hydrodynamic models used to estimate flood hazard (e.g., References [
31,
36]).
Due to the above, the estimation of the flood hazard from flow depth values should use average or modal values, which indicate the most frequent or probable value within the cultural heritage site under consideration. Under this approach, it is possible that the most optimal option was the modal value. However, this option clashes with the type of flow depth data (real numbers with two or three decimal digits), which does not allow a correct estimation of the modal value because it would require categorization and provide less accurate results. Furthermore, when the water depth data available for a BIC are scarce (due to the fact that the BIC is not affected by flood in all its extension), the use of average water depth value may reduce the uncertainty about a possible error in water depth estimation. All in all, the option of the average value has been viewed as the optimum indicator for flow depths value related to each cultural heritage site. This average value should be considered representative of the flow depth in most cases, and only in situations of clearly bi-modal distributions with the maximums located at the extremes of the distribution, could we regard the mean value as a non-representative measure of this variable.
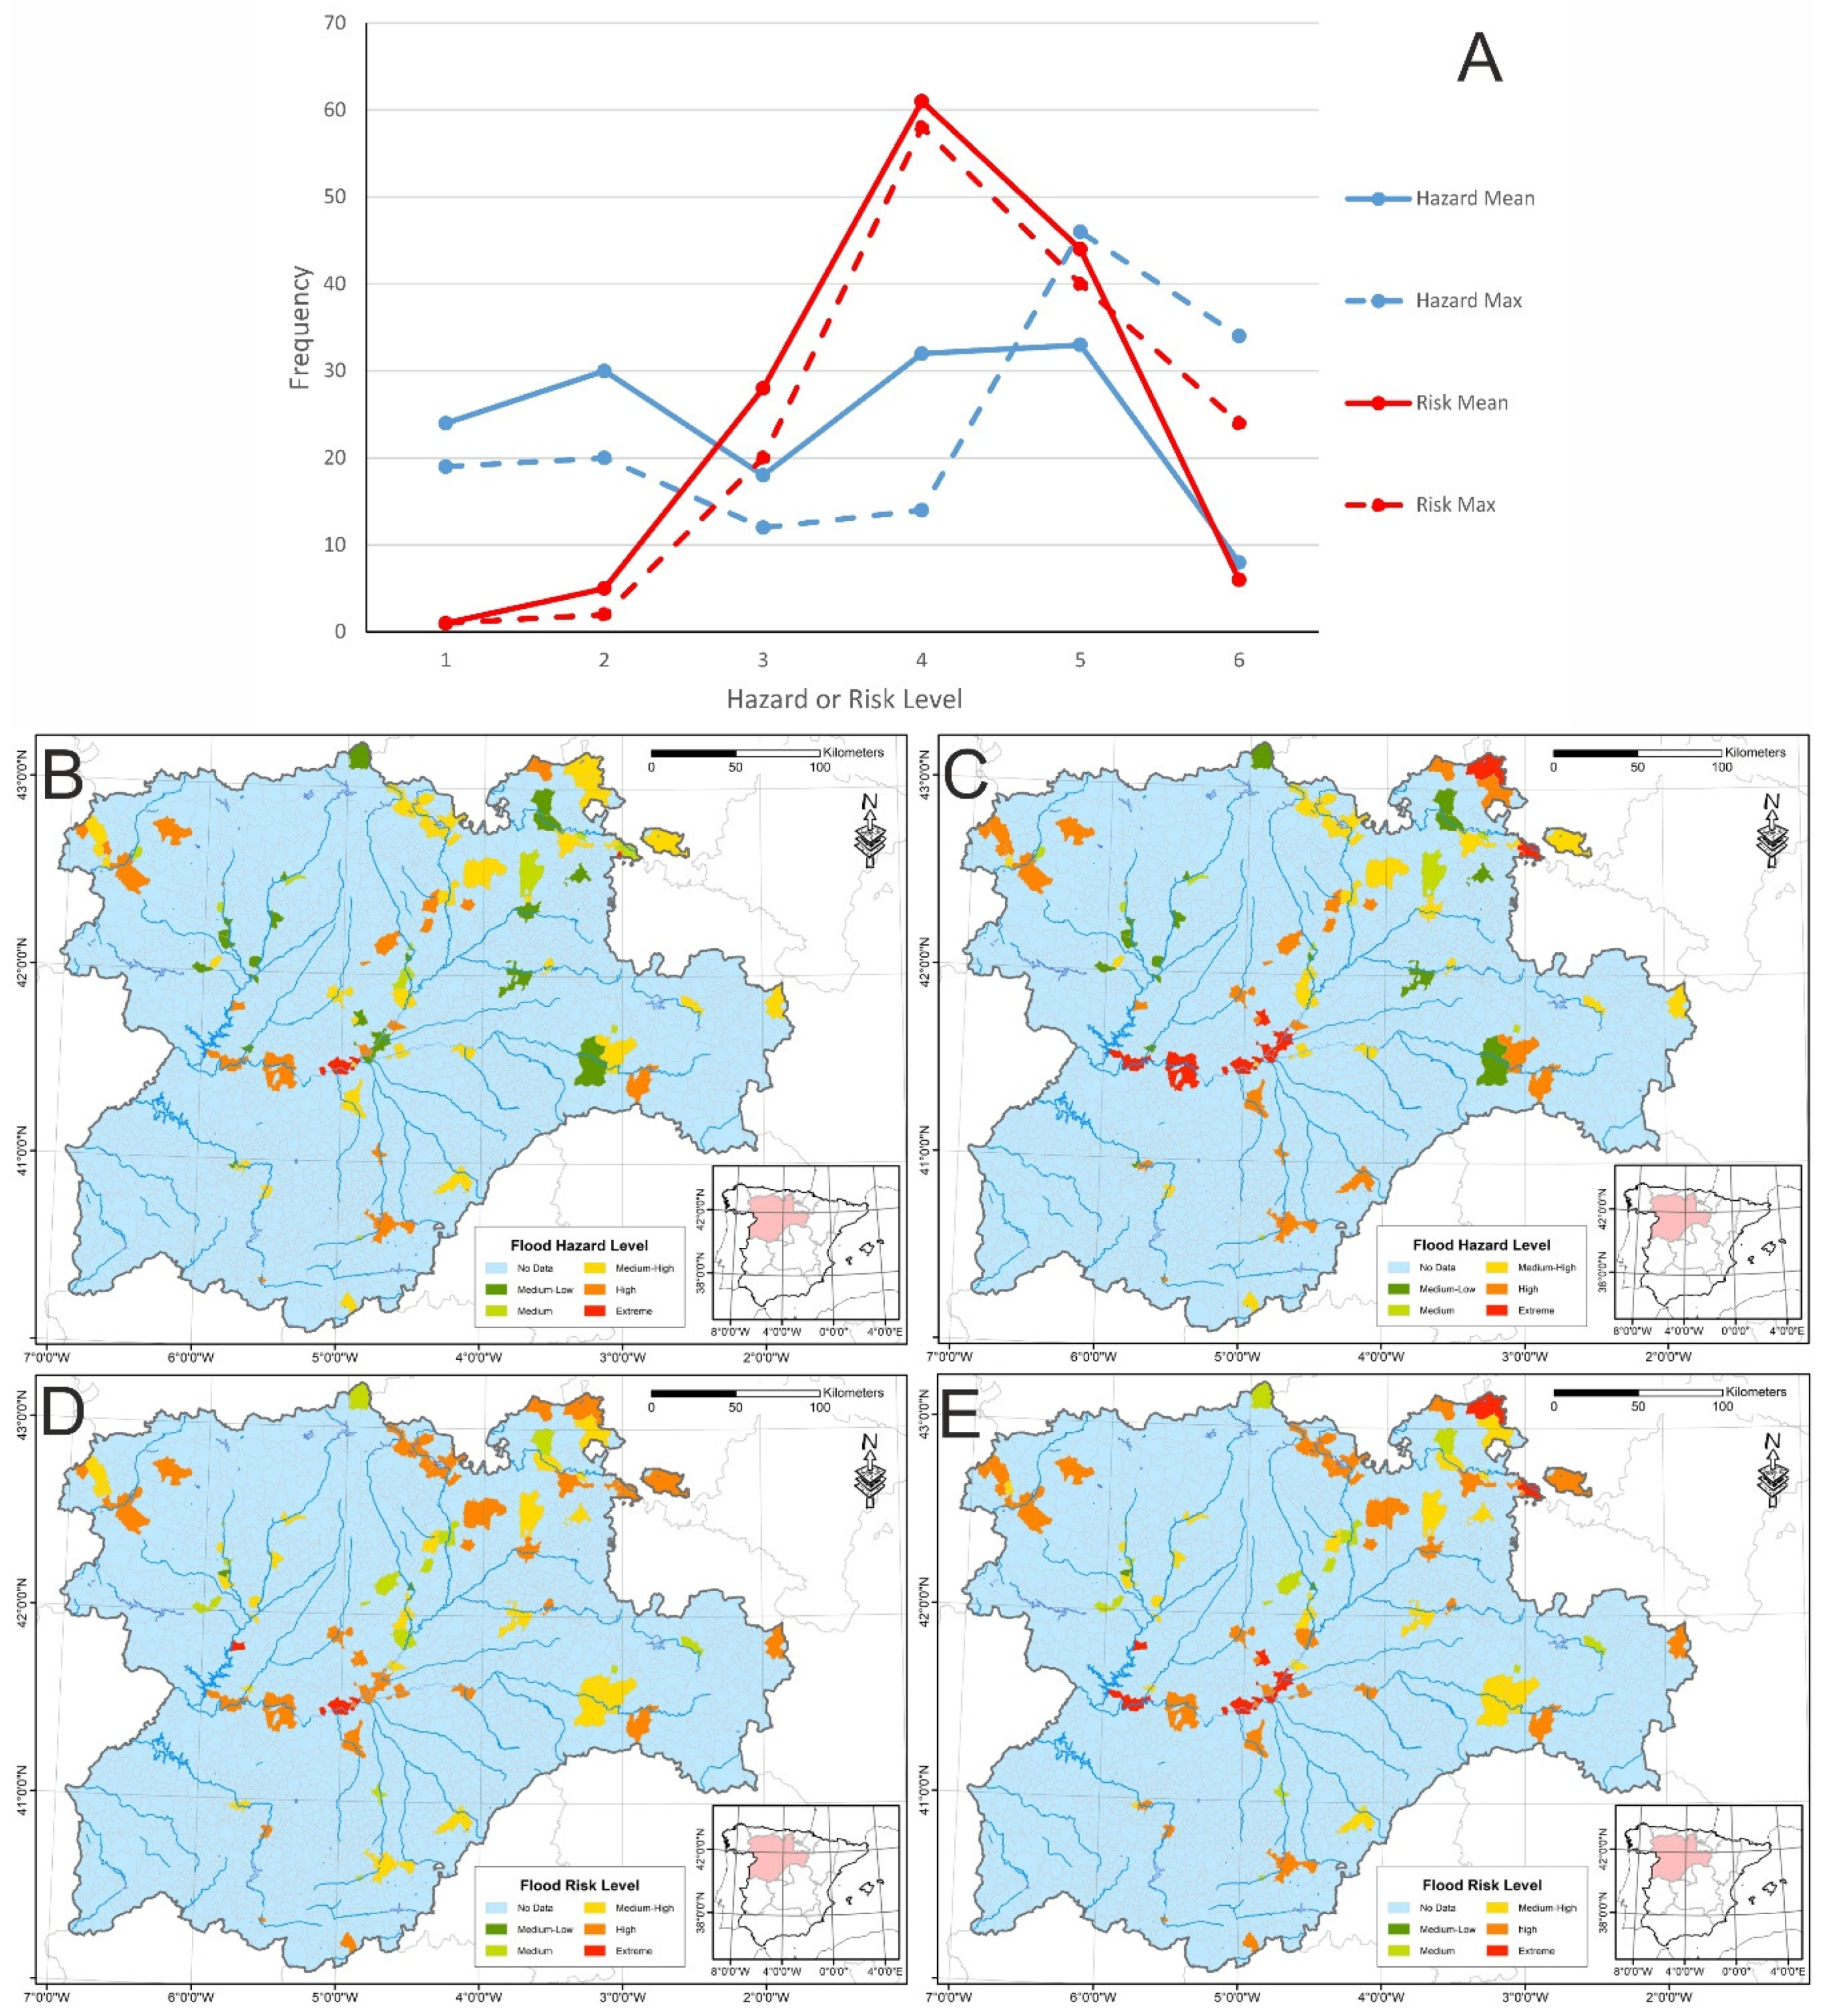
Even when regarding the average flow depth value as optimal, we proceeded to analyze the change in the results that would occur if the flood hazard estimate was based on the maximum flow depth values for each cultural heritage site.
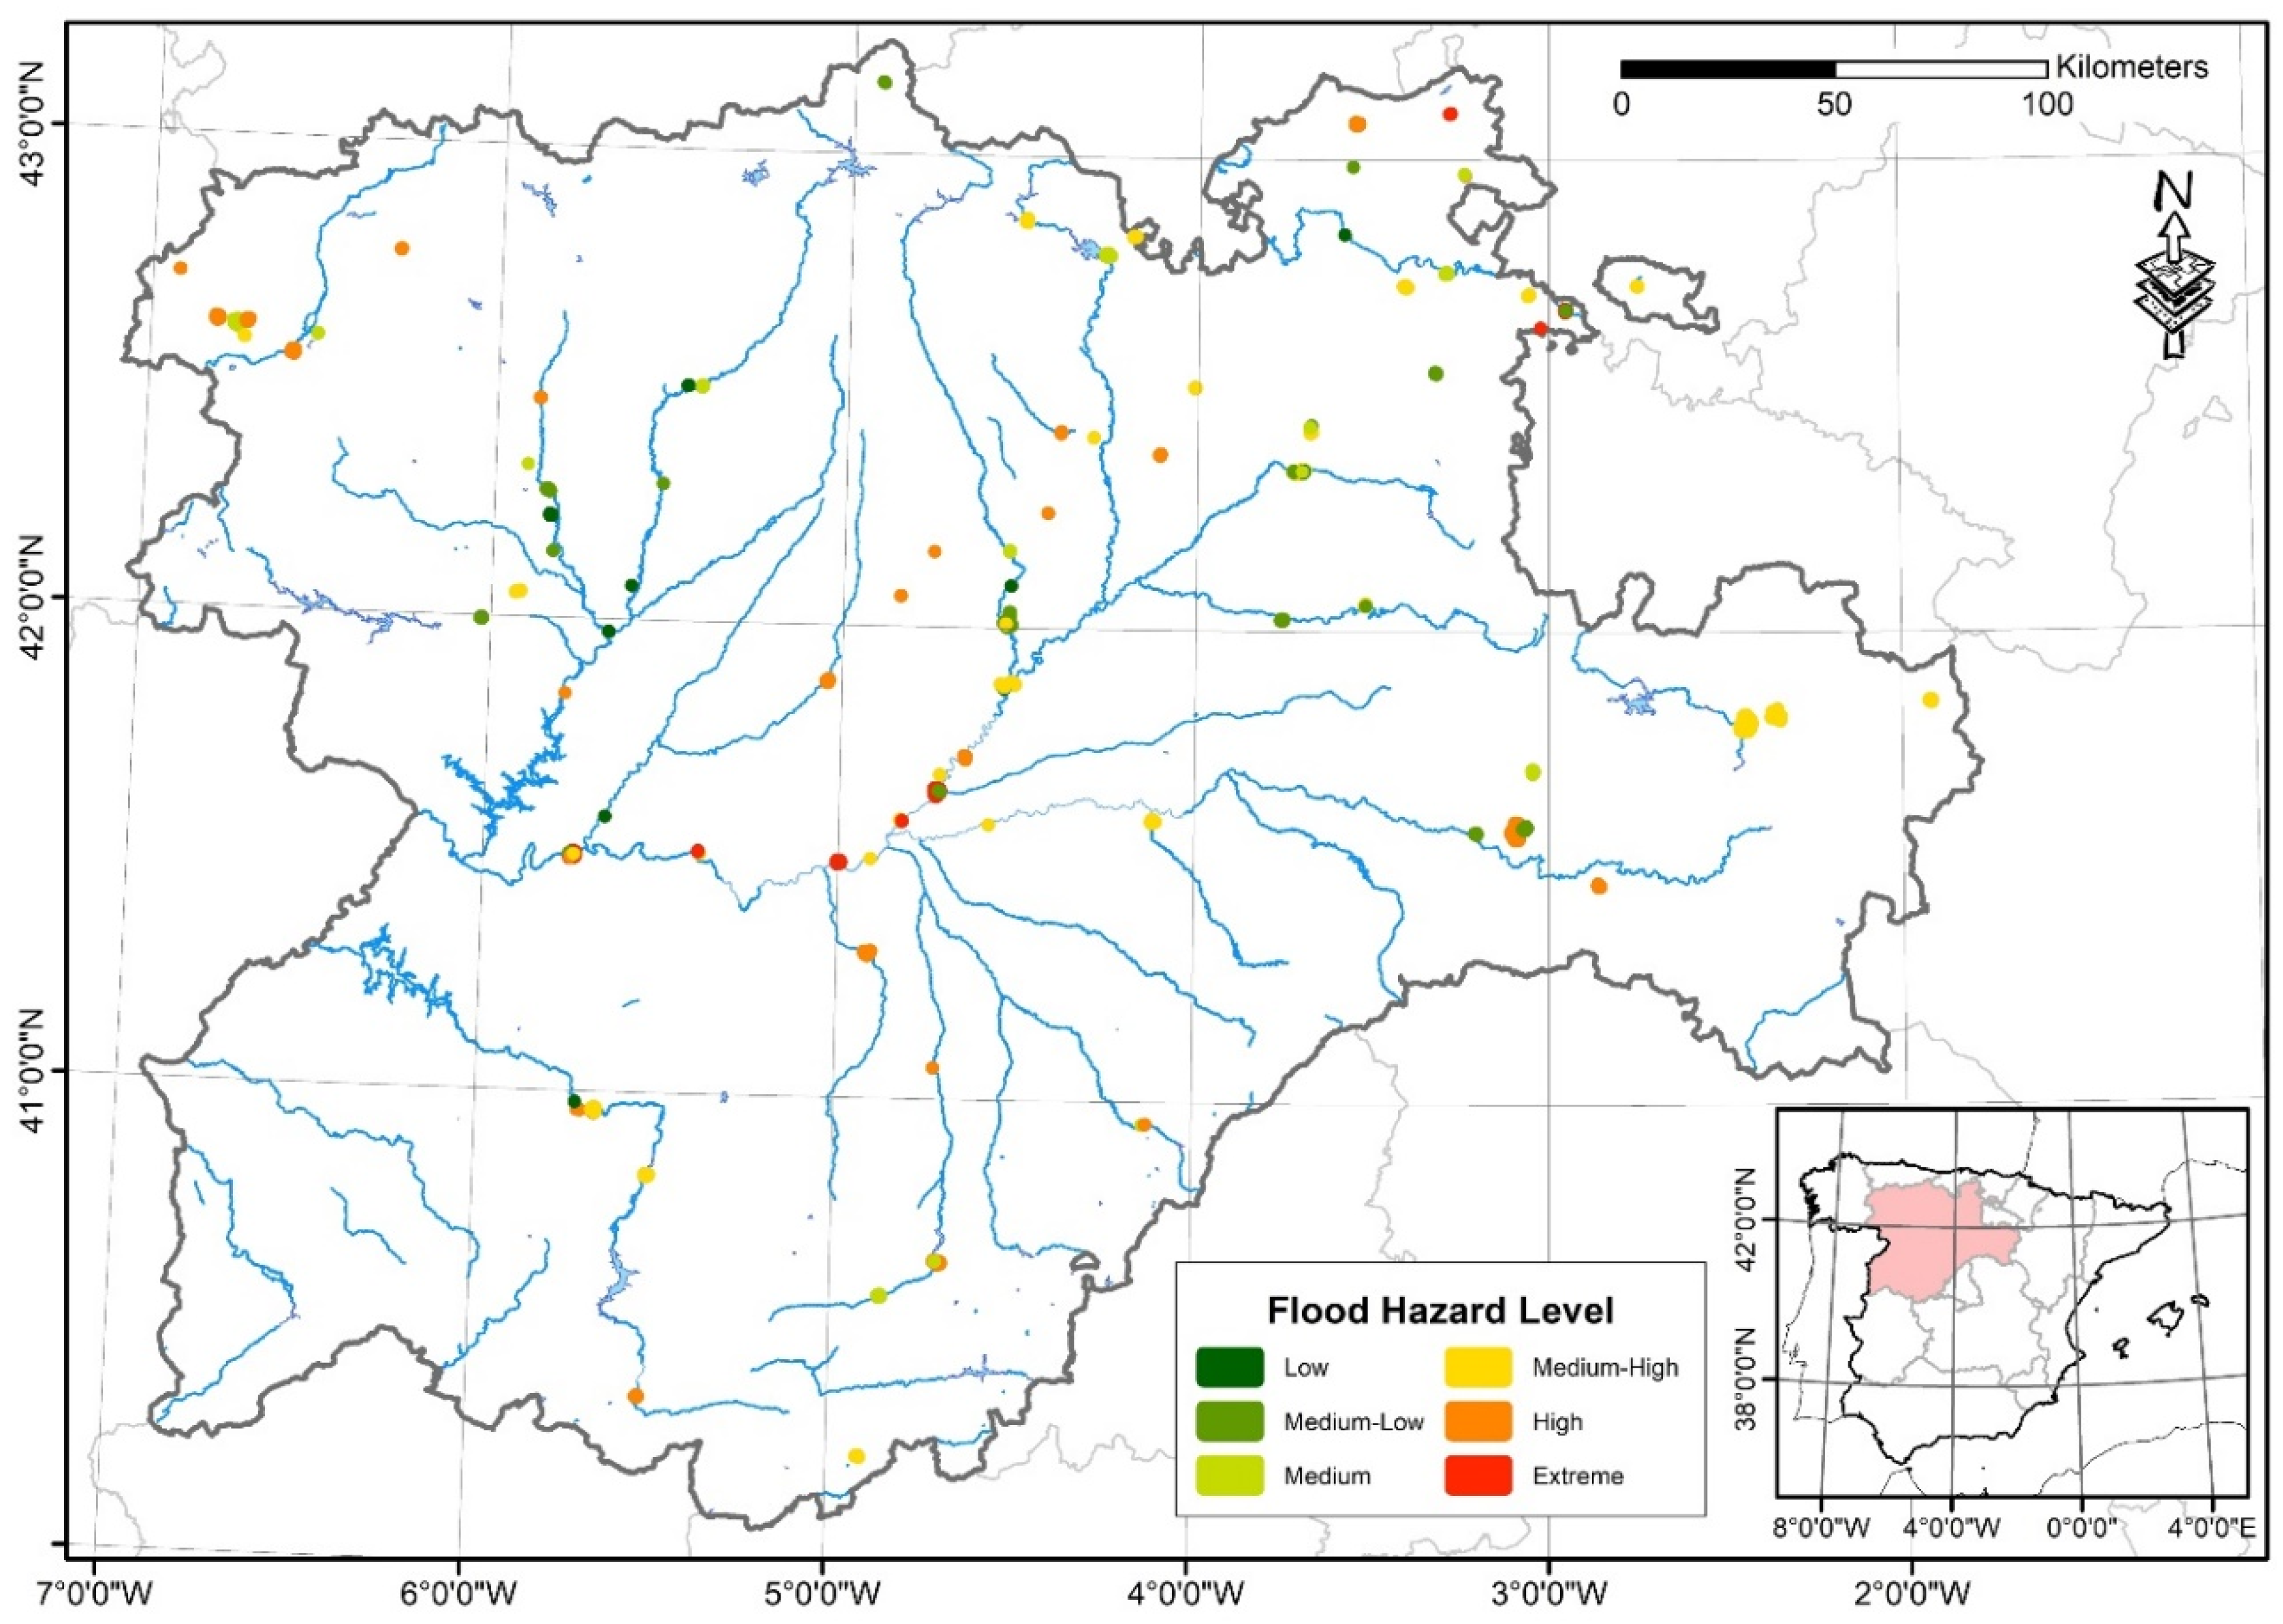
Figure 9 shows the variations in the distribution of flood hazard and potential flood risk values for cultural heritage sites based on the use of the mean or maximum flow depth values. In general, and as it would be logical to use the maximum flow depth value instead of the average value, the flood hazard in cultural heritage sites increases. For flood hazard data, a clear change in BIC hazard level distribution is observed where the number of BICs in levels 5–6 (High and Extreme) increase against the number of BICs in hazard levels 1–4. In the case of potential flood risk, the shape of the distribution of BICs into risk levels remains similar, with the curve distribution for maximum flow depth always under the curve distribution for average flow depth. This distribution shape drastically changes for the highest flood risk level, where the curve associated to maximum flow depth sharply increased. Therefore, using average or maximum flow depth does not draw a completely different results scenario, but a clear difference can be pointed out between them. Maximum flow depth data leads us to an increase of high flood risk, although the possibility that these results are due to errors in the data sources used is also higher than if we use average flow depths.
These tendencies are in line with what was pointed out by [
31], although here it is observed that the influence on the flood hazard estimate does not undergo modifications as significant as those shown in that study, which focused on the assignment of the flow depth to each building. In addition, the results obtained in the present work would support: (1) the consistency of the use of average flow depth as a key factor for flood hazard assessment; and (2) the negligible influence of possible anomalous flow depth point values in the study area.
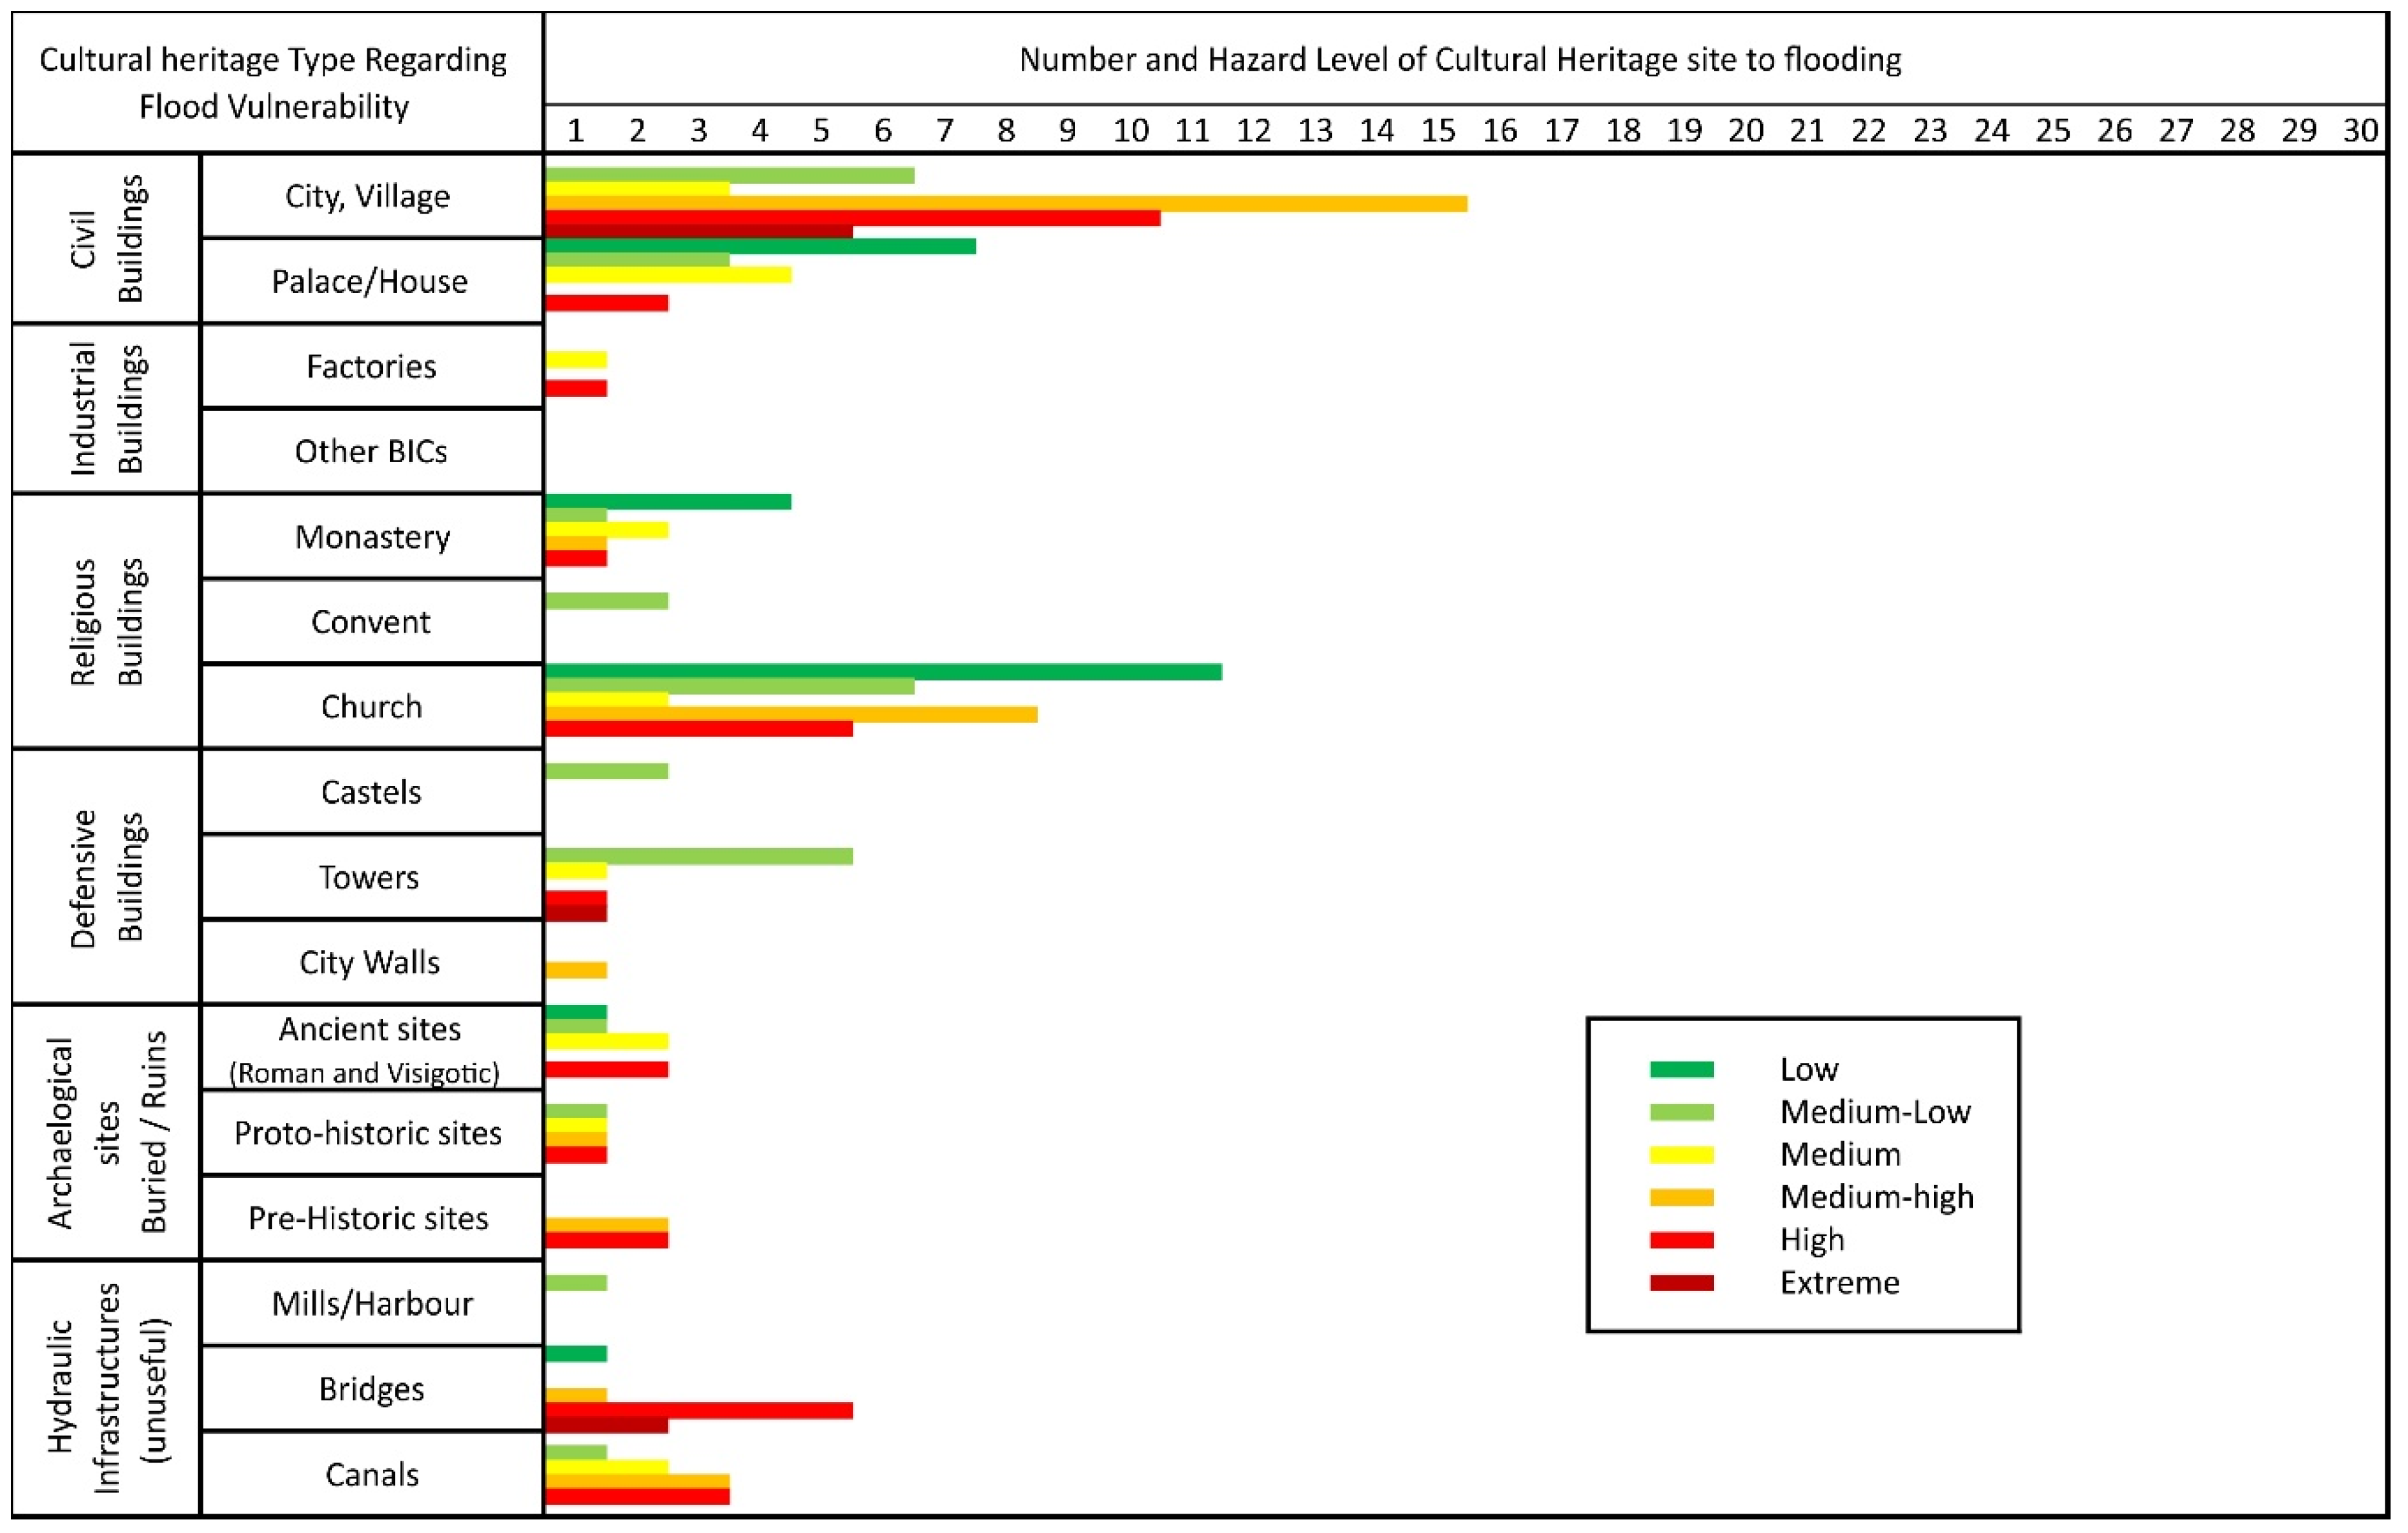
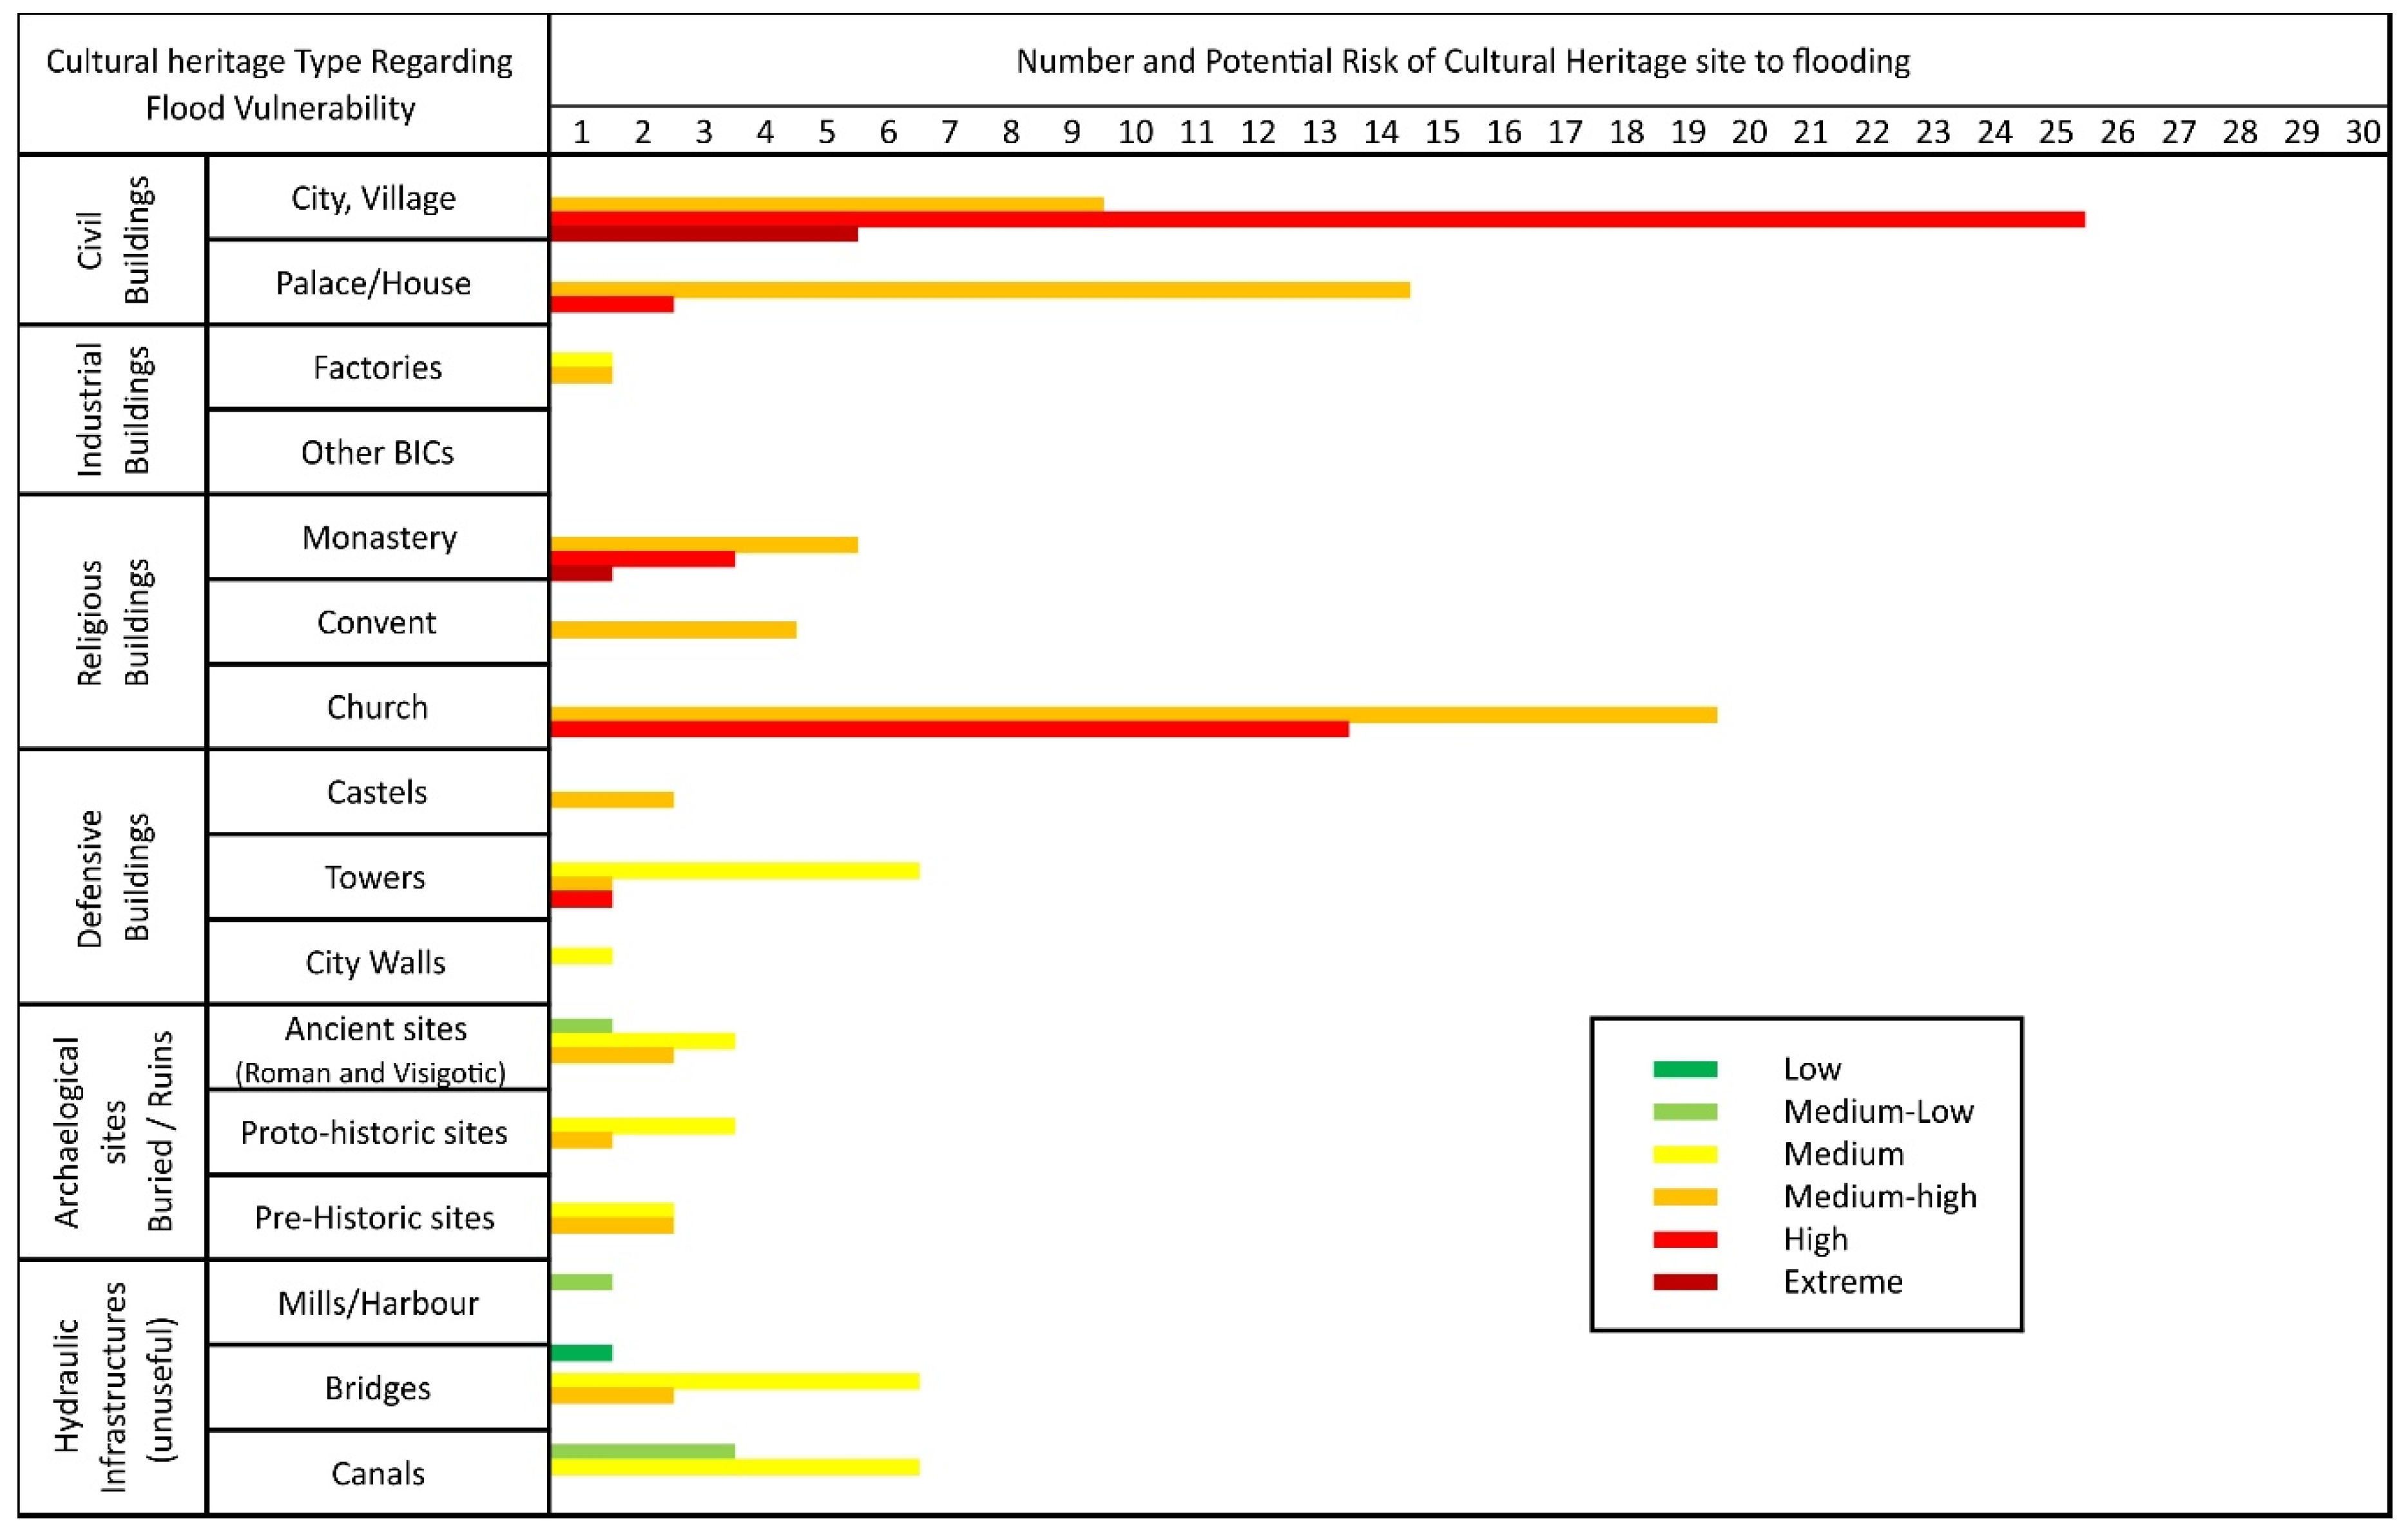
Regarding the analysis of the flood vulnerability for cultural heritage sites, a qualitative approach has been proposed that takes into consideration, on the one hand, the building materials and structural relationship with the hydraulic parameters, and on the other hand, the different continent elements of each BIC. This is an approach that is undoubtedly less detailed than others (e.g., References [
37,
38]) previously used for the study of the vulnerability of buildings to flooding, which focuses on the analysis of vulnerability at a building scale (through the use of magnitude-damage functions in which the magnitude is associated with the variable flow depth and flow velocity or through physical models that analyze the impacts and fluid-structure interactions). The previously cited vulnerability models focus mainly on residential buildings, without the particular characteristics of cultural heritage sites.
A variable that has sometimes been introduced in the analysis of flood hazard and flood vulnerability is the flow velocity. In this study, it has not been considered relevant for two reasons: (1) in a regional study and using such generic categories of cultural heritage types, it is very difficult to estimate the incidence of the average speed on their structural stability; (2) almost all the analyzed cultural heritage sites are in the flood-prone area, although they can be affected by high flow depths, but not by flow velocity; since they are usually located outside the path of the floodway, especially the oldest ones.
In those previous assessments in which the flood risk analysis took into account elements of cultural heritage (e.g., [
13,
15]), the variables used are similar to those used in the present study (flood return period, potential vulnerability depending on the type of cultural heritage). However, and because the present study focuses specifically on the risk of heritage elements, the flood hazard and flood vulnerability matrices generated are more complete and complex, since they include other variables such as flow depth, flood time lag (time lag), or a more detailed classification of the cultural heritage elements and its relationship with the hydraulic environment. This means that the results obtained can be considered to be more detailed, even if the work scale is similar to the previous proposals (city or regional scale).
An up-scaling process has been made, using the boundaries of the municipalities as the unit for display (
Figure 9B–E). For both, flood hazard and potential risk, and increase in High and Extreme values is observed. Those changes are mainly concentrated along the Duero basin main river, and they are much less evident in the rest of the basin. Average and maximum flood hazard for each municipality (
Figure 9B,C) do not show great differences, but the same patterns linked to the use of maximum values previously noted. Same situation is observed for flood risk (
Figure 9D,E). Anyway, due to the variability of BICs types and vulnerabilities in a municipality, up-scaling process does not allow great advantages in analysis results beyond a simplification in its mapping.
For the working scale used here, it is possible, however, to include other variables, mainly related to the vulnerability component that would improve the estimation of the potential flood risk. These would be variables such as: (1) the structural conservation state of the cultural heritage, (2) the behavior of the construction material in contact with flood water, (3) the presence of mitigation measures against floods, etc. In relation to the experience in the region of Castile and León, however, this type of data is not included systematically in the databases of the Catalogs of Cultural Heritage Sites. To do so would require costly field and laboratory work that is not viable for analyses at the regional scale. Those data, however, are considered essential for local or micro-scale analysis.
At the assessment working scale, the limitations of the analysis come from data availability. Both hydrodynamic data (water depth, flow velocity, spatial resolution data, etc.) and vulnerability data (stored data about cultural heritage sites such as materials, structure, content, conservation, etc.) All those limitations are very similar to those pointed out by previous approach [
39]. About hydrodynamic data, the scarce availability of data limits the possibility of regional analysis, and the data from European or Global projects have a spatial resolution not useful for cultural heritage sites flood risk analysis. From the point of view of vulnerability data, the limited number of tabulated variables (with much more information as plain text) makes difficult [
39] a more complex and complete assessment of cultural heritage sites vulnerability to flooding.
We must keep in mind that the proposed methodological framework is a subjective proposal, based on the knowledge and authors’ experience in both flood hazard and cultural heritage vulnerability. In this sense, the subjectivity of the proposal follows the line of previous proposals [
40], in which the vulnerability of the cultural heritage and the flood hazard are also defined based on the authors’ criteria.
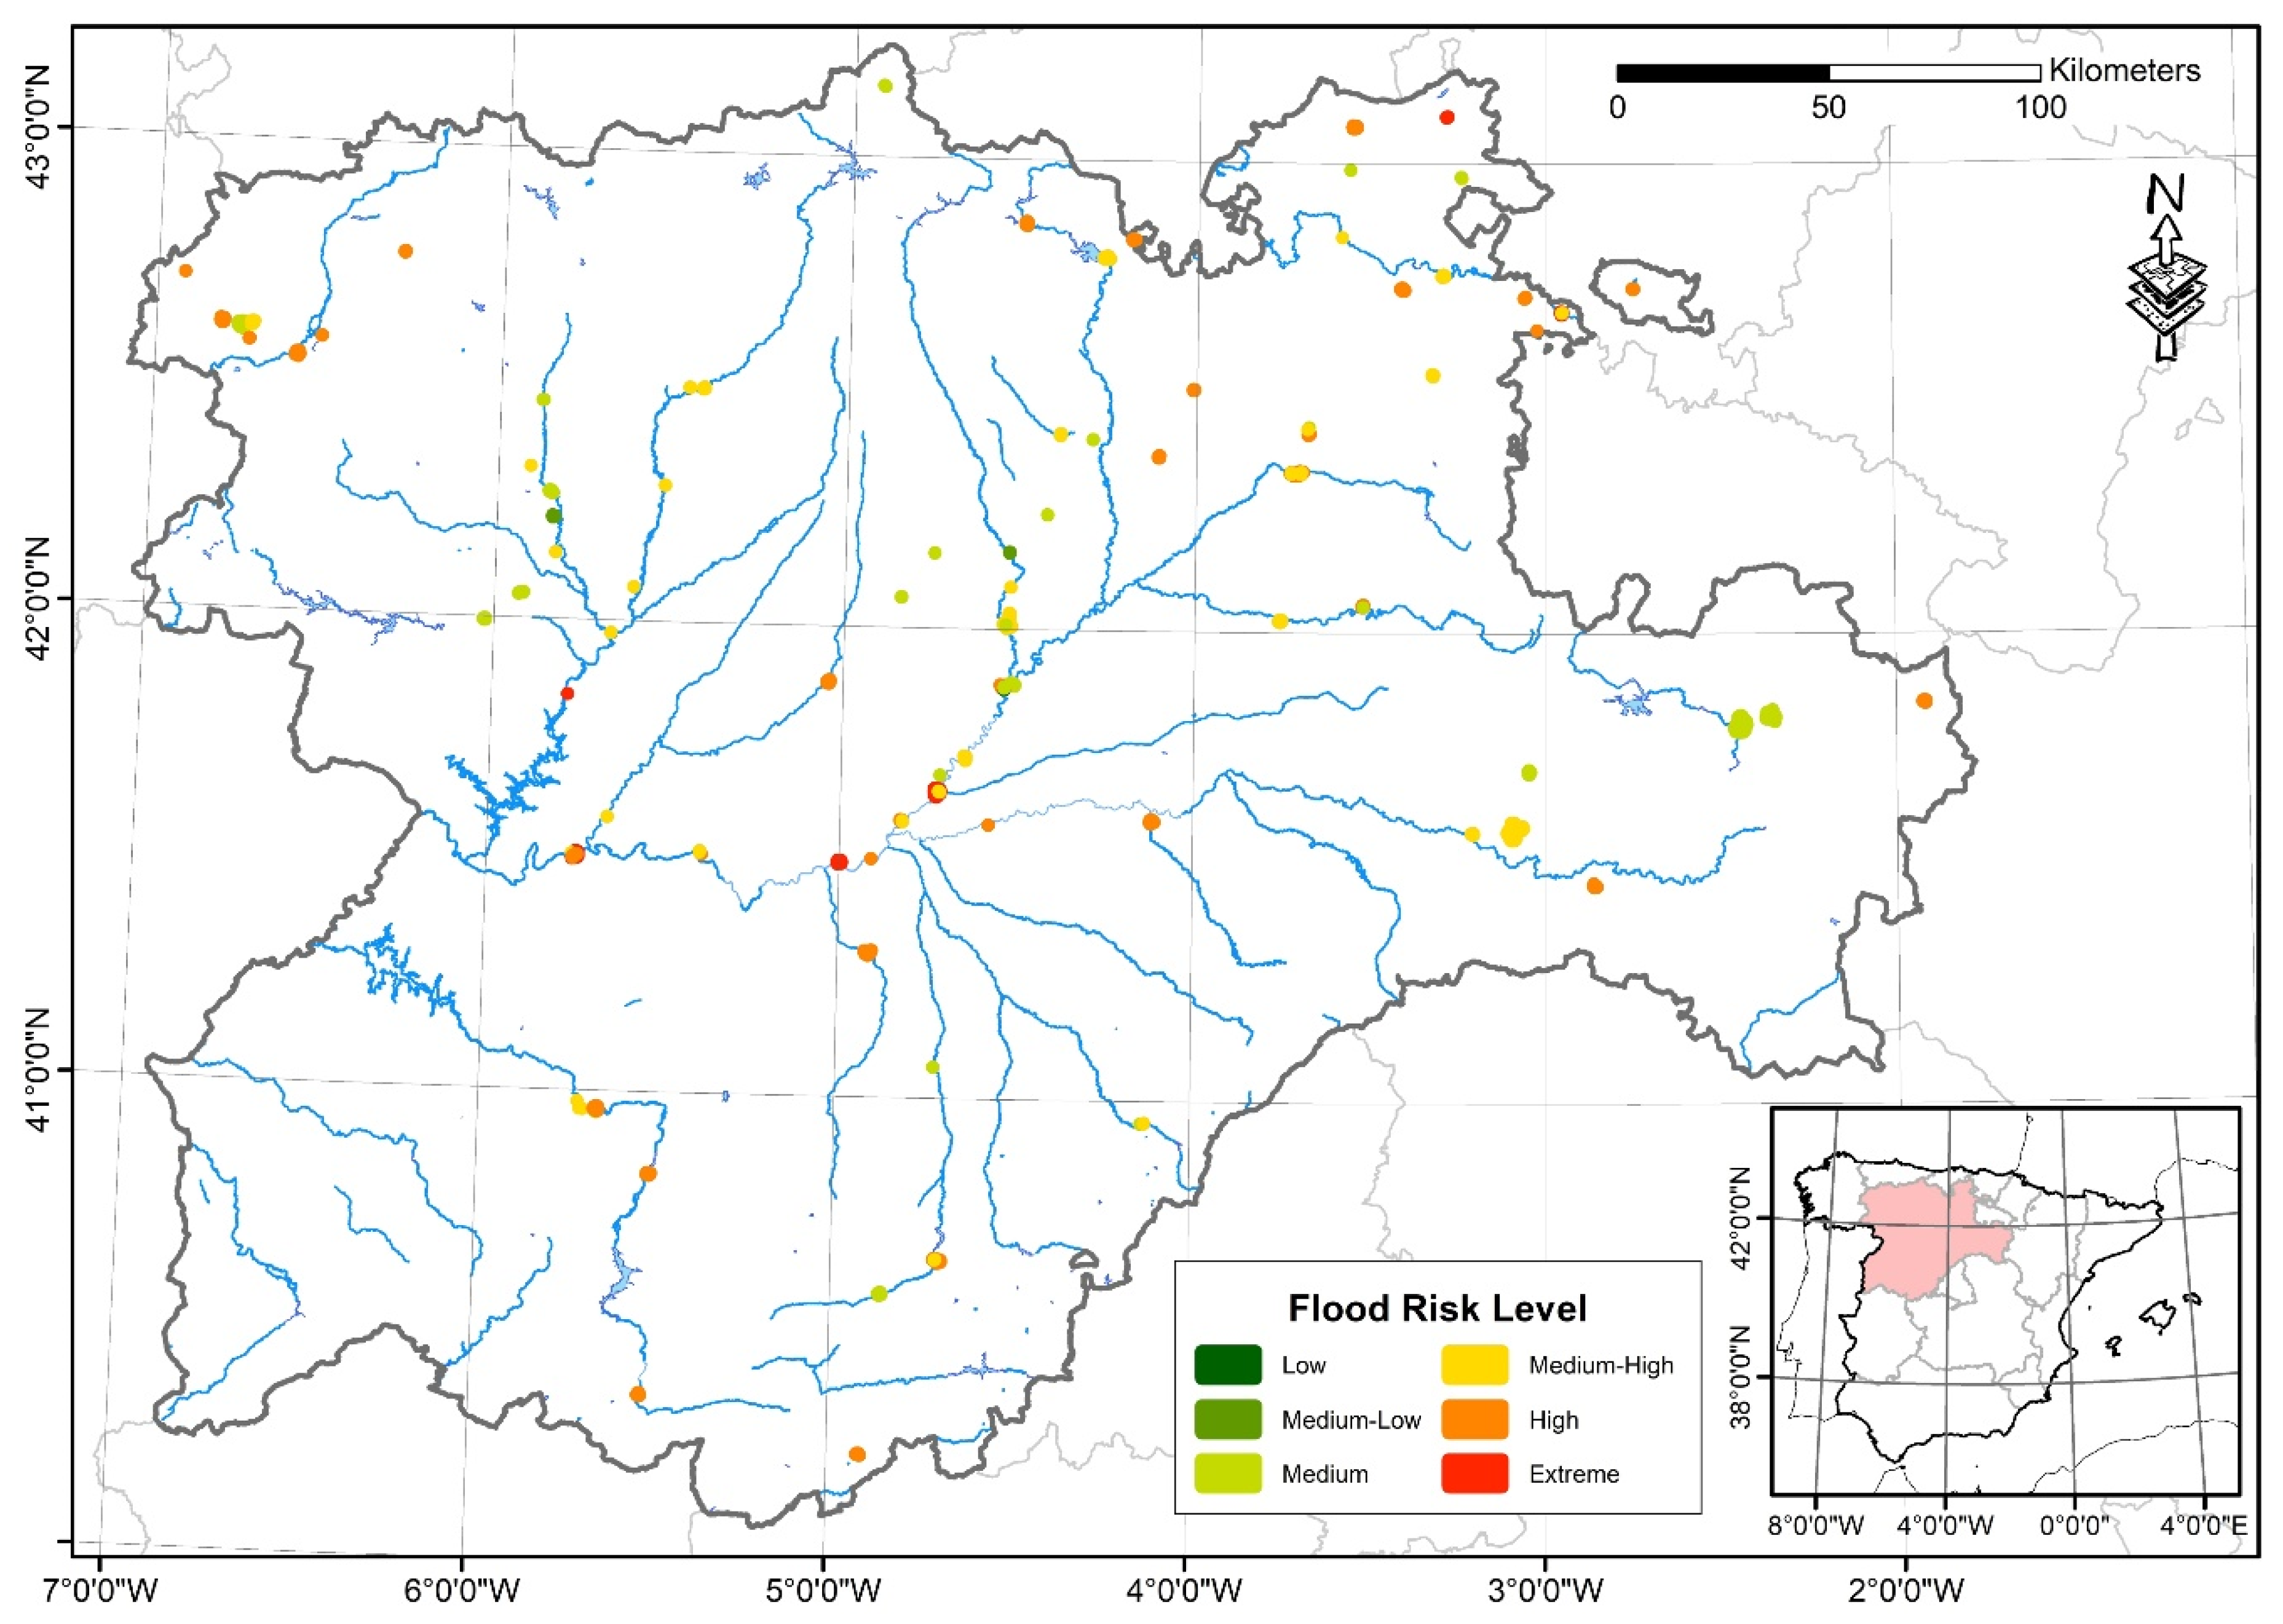
The combination of the flood hazard and vulnerability matrices has made it possible to generate a matrix of potential flood risk that is easily implemented in a GIS environment and allows a quick visual analysis of the spatial distribution of the different levels of flood risk for cultural heritage elements and the identification of possible high flood risk “clusters” within them. However, a real clustering analysis may not be available due to the irregular spatial distribution of BICs and its dependence of the existence of associated flooding data. This visual analysis is also a perfect starting point for those flood risk and cultural heritage managers responsible for managing and safeguarding this irreplaceable heritage. These results can help to prioritize micro-scale flood risk analyses or directly implement flood mitigation measures in those places of greatest interest. For preventive conservation assessments at a regional scale, rather than use a high or extreme flood risk for an individual heritage site, it is convenient to look at high-risk clustering, which justifies a more detailed analysis at the local scale.
Finally, the methodological framework present here has the characteristic of being easy to replicate in other territories and settings. Flood hazard analysis may be replicated anywhere, and flood vulnerability too. About vulnerability, the matrix presented here may be used directly or may be adapted to the local characteristics of the cultural heritage sites where it will be applied. The vulnerability of each different building material, structure, or building content should be kept unchanged, but the vulnerability linked to each cultural heritage class could be different if the building material and structure or building contents have changed.
Calibration and Validation of the Methodological Proposal and the Obtained Results
The calibration and validation of the methodological proposal of this work, through its results, is very complex because it involves validating potential risk situations and not tangible and measurable scenarios, whose maps could be calibrated with the usual techniques for quality control in thematic cartographies. Therefore, in the international scientific literature, the calibration and validation of potential risk is usually addressed indirectly, through secondary risk variables and indicators [
41,
42]. However, in this case, the systematic quantitative validation of the results correlating them with indirect sources of past damage is also not feasible. This is due to the lack of correlation between the assigned risk and the volume and quality of documentary sources; having this lack of correlation a double cause: the scarcity and spatio-temporal bias of documentary information and the different spatial resolutions of the results and contrast information.
Regarding the scarcity of information, not even the Spanish National Catalog of Historical Floods collects a significant number of past events (only 308 historical records, between 181 BC and 2010, throughout the whole Duero basin), which allow representative statistical analysis at BIC scale. The spatial bias is manifested in the fact that BICs that are located in municipalities with smaller populations and in rural areas (villages), have less historical documentary information, transmitting a false sense of lower potential risk; while the opposite occurs in the large populations of historical importance (towns and cities), which were important political, religious, or military populations in the past and, therefore, with a great capacity for documentary production. The temporal bias is manifested in the greater information on recent floods (19th and 20th centuries) compared to the old ones (prior to 18th century), due to the increased recent documentary availability (historical press since the mid-19th century) and regarding the perception of risk by populations over time.
The hazard and risk results of this study (analyzed at the BIC scale) have different spatial resolution regarding the available documentary sources, ranging from the BIC (damage technical reports and repair works), to the location (village, town, or city), to the municipality or region affected by past events. Therefore, there is no certainty that past documented events will affect the BIC or only its environment (“location” and “municipality” spatial resolution documentary sources). This uncertainty affects calibration and validation analysis.
As an alternative to systematic validation using all documentary production in bulk, the only feasible strategy is the in-depth study of specific examples representing high and low risk situations among the results of this work.
To begin with the BIC with high values of flood hazard and risk, the Royal Old Mint of Segovia is an architectural complex that has an extensive documentary record on historical floods and their consequences, from descriptions of damages to machinery and facilities for more than 30 historical floods, collected in the manuscripts of archives and libraries (General Archive of Simancas), to technical reports of detailed analysis of flooding (historical floods, [
43,
44]) and possible mitigation solutions. There is also a good qualitative correlation between another of the higher risk BICs, as “certain areas of the city of Medina de Rioseco” and the existence of technical reports on damage conditions by floods. Another positive example is the San Francisco convent in the city of Medina de Rioseco (medium risk) and how the mitigation actions carried out have reduced the flooding of this BIC [
45].
In the opposite situation, that is, BIC with lower flood hazard and risk and few conditions and past damages, it is complex to find reliable examples, due to the mentioned space-time bias of the documentation. In that way, there are some BICs, such as the Roman villages of Camarzana de Tera (Orpheus) or Quintana del Marco (Los Villares), which are located in the flood zone for T500 years, and apparently have not suffered significant flood damage in the last 1600–1700 years since their construction (as evidenced by the conservation of very vulnerable elements, such as mosaics), so their flood risk must have been low or very low, as they have been assigned in the results of this study.
In summary, it can be considered that the methodology used and the results obtained have an acceptable agreement with the historical and actual flood risk of Castile and León BICs, not so much for a complete systematic validation but for the timely analysis of the results for representative singular BICs, which makes them useful as a qualitative approach to risk.
5. Conclusions
An easy-to-implement and low-cost methodology is presented here to determine the potential flood risk of cultural heritage sites at a regional scale. The methodological framework improves previously proposed approaches to cultural heritage flood risk assessment.
The methodological framework (with a focus on analysis at a regional scale) has been implemented in the region of Castile and León (Spain), which has a Catalog of Cultural Heritage Sites composed of more than two thousand elements that have different degrees of administrative protection. Although the model calibration and validation are not fully available due to the scarce data on historic flood events and damages, cultural heritage sites with different potential flood risk have been used to check the reliability of the model results, having obtained a good agreement between them.
The implementation of the three proposed matrices (flood hazard, flood vulnerability, and potential flood risk) in a GIS environment allows the estimation of the flood risk level presented by the cultural heritage elements and its classification.
The matrices implemented in the present assessment are based on a series of variables related to flood risk that are generally available or can be easily derived from DTMs. These characteristics make the study and proposed methodological framework easy to replicate.
The qualitative characterization of the potential flood risk for the heritage site and its spatial distribution, both direct results of the methodological framework proposed here, can and should serve as a key tool for cultural heritage managers at a city, region, or state administrative level. This should be presented in a way that facilitates the tasks of prioritization and allocation of economic items for the protection of cultural heritage, through preventive conservation.
Finally, the results obtained through the methodological framework proposed can and must also make it easier to prioritize flood risk analysis on heritage elements at a local or micro-scale level. The micro-scale analysis, due to its inherent level of detail, may use specific or ultra-detailed magnitude damage functions (in which the magnitude is defined from the combination of flow depths–flow velocities–flooding times–flood sediment) or physical models that analyze the interactions between fluid and structure (distribution of pressures, deformations, thresholds of collapse of structures, etc.).


