1. Introduction
Small plastic particles have become abundant in the environment due to the mass production of plastics and the low recycle rates for plastic products. Microplastics are defined as plastic particles having a size in the range of 100 nm to 5 mm. There is some disagreement amongst researchers as to the size of nanoplastics with some defining nanoplastics as those with at least one dimension less than 100 nm, and others defining nanoplastics as less than one micron [
1,
2,
3]. The latter definition was adopted in this study. Larger microplastics that are in the mm size range are relatively easy to remove during water and wastewater treatment with settling and filtration-based processes, but plastics that are smaller than 1 µm may escape treatment in significant quantities in the effluent. Wastewater treatment plants are one of the main pathways of microplastic pollution, and treated wastewater discharges are an important source of nanoplastics, microbeads and synthetic textile fibers to surface waters [
4,
5]. Microplastic discharges from wastewater treatment plants have been reported to reach up to 15 million particles [
4,
5] and of particular concern for aquatic ecosystems are the nanoplastics in effluent discharges. Stormwater systems are also an important source of microplastics and provide a direct pathway to terrestrial microplastics into surface waters [
6]. Stormwater ponds were reported to contain up to 22,894 microplastics/m
3 [
7].
The prevalence, fate, and environmental effects of microplastics have been studied to some extent in recent years, but nanoplastics have been much less studied, due primarily to difficulties quantifying and characterizing nanoplastics in environmental samples. Microplastics are ingested by a wide range of fresh and saltwater species and can result in injury, disturbed feeding, disturbed swimming, immune responses, altered metabolism, tumors, and mortality among other effects [
8]. There are very few studies on nanoplastics but they have been shown to have many of the same effects [
3]. In fact, their small size, high surface curvature, and high surface area may increase their risk to wildlife. Their small size allows them to pass biological barriers and penetrate tissues, and they have been shown to interfere with algae photosynthesis [
9].
Micro and nanoplastics can also pose a risk to aquatic environments through desorption of sorbed chemicals and/or transport of pathogens [
8,
10]. During wastewater treatment, nanoplastics can adsorb a wide range of chemicals resulting in particles with high concentrations of these chemicals which may later be desorbed after discharge into the environment. There is some debate over whether sorbed organic chemicals from microplastics are a significant threat to aquatic life, which are exposed to organic chemicals from other sources as well. However, bench-scale studies have shown adverse effects [
11]. The larger surface area to volume ratio of nanoparticles increases their adsorption efficiency, but also increases the amount of adsorbed organic chemicals per particle if those particles escape treatment.
The fate of nanoplastics through wastewater treatment plant processes remains unknown. This is due to difficulties measuring nanoparticles in environmental samples. Methods for measuring nanoparticles, such as microscopy and spectroscopic tools, are time consuming and can disturb the characteristics of the particles [
9,
12]. Tools such as dynamic light scattering and nanoparticle tracking analysis can be used without disturbing the samples, but are unable to distinguish between plastic and naturally occurring nanoparticles [
12]. The fate of microplastics in wastewater treatment has been more widely studied. For particles between 125 and 400 μm, Carr et al. [
4] observed complete removal from wastewater treatment plants with tertiary gravity filtration, but incomplete (1 microplastic particle/1.14 thousand L) removal for plants with secondary treatment. Talvitie et al. [
13] also found that although secondary treatment removed 98.4% of microplastics, the effluent had a fiber concentration 25 times and a particle concentration 3 times that of the receiving waters.
Due to difficulties in measuring nanoparticles in environmental samples, accompanied by the need to understand the fate of nanoplastics through treatment processes, this study investigated the removal of nanoplastics with gravity-based and mechanical separation processes on a bench-scale using synthesized nanoplastics (<400 nm). Physical separation methods were investigated and particle size profiles following treatment were used to provide additional information about the behavior of the particles. The selected separation processes are commonly employed for water, wastewater, and stormwater treatment, and the objective of the study was to determine and compare their effectiveness and further improve their performance in removing nanoplastics (<400 nm) from water.
2. Materials and Methods
This study investigated the removal of nanoplastic particles with common water and wastewater treatments, as well as the effects of these treatments on the particle size distribution of the remaining particles. Filtration, centrifugation, and ballasted flocculation were all evaluated. Uniform nanoplastic particles were prepared for this study, and turbidity was used to measure removal.
2.1. Overview
The nanoplastic particles used in this experiment were created in the lab using the procedure described in
Section 2.2, below. They were then measured for size using scanning electron microscope (SEM) images as described in
Section 2.3. Filtration (
Section 2.6), centrifugation (
Section 2.7), and ballast flocculation (
Section 2.8) were all evaluated for their ability to remove the nanoplastic particles. Gravity settling tests were also conducted for comparison purposes (
Section 2.9). Turbidity measurements (
Section 2.4) were used to determine the removal efficiency for each of these processes. Zetasize measurements (
Section 2.5) were used to determine changes in size distribution occurring during each removal process.
2.2. Preparation of the Nanoplastic Solution
Polymeric plastics were created containing carboxylic acid functional groups [
14]. These plastics would be a good surrogate for polyethylene terephthalate (PET). Functional monomer methacrylic acid (MAA) (Sigma-Aldrich; Oakville, ON, Canada) and cross-linker ethylene glycol dimethacrylate (EGDMA) (Sigma-Aldrich; Oakville, ON, Canada) were dissolved in a porogen with a molar ratio of 1 mmol:8 mmol:6.7 mmol [
15]. The porogen was composed of 40 mL of 1:3 (v:v) acetone (Fisher Scientific; Ottawa, Canada), and acetonitrile (Fisher; Ottawa, ON, Canada). 2% (w:w) of 2-isobutryonitrile (AIBN) was added as the initiator (Sigma-Aldrich; Oakville, ON, Canada). The mixture was mixed with a vortex mixer (Fisher Scientific Vortex Mixer, Chicago, IL, USA), deoxygenated with nitrogen for five minutes, and then placed in a 60 °C hot water bath for 24 h (Isotemp 220, Fisher, Chicago, IL, USA). The resulting nanoplastic particles were dewatered using a centrifuge (Thermo Scientific Sorval Legend RT+, Fisher Scientific, Chicago, IL, USA) at 10,000 rpm, air dried at room temperature, and ground manually.
Briefly, a nanoplastic solution was prepared by weighing 5 mg of nanoplastic particles and sonicating them (Vibracell Sonics, Sonics and Materials Inc., Newtown, CT, USA) in 1 L of deionized water for 15 min to disperse the plastic. The solution was stirred thoroughly before being dispensed.
2.3. Scanning Electron Microscope (SEM) Images
A Tescan Vegall XMU SEM instrument was used to obtain SEM images. The nanoplastics were coated with gold prior to imaging using RF (radio frequency) sputter (Anatech Hummer, Union City, CA, USA). The images were collected at a working distance of 7–8 mm.
2.4. Turbidity Measurements
The amount of nanoplastics removed was evaluated using before and after comparisons of turbidity. Turbidity measurements were taken using a Hach 2100 AN turbidity meter (Hach USA, Product Number: 4,700,100, Distributed by Hach Canada, London, ON, Canada).
Turbidity was chosen to measure particle removal because turbidity meters are most sensitive for nanoparticles with diameters close to the wavelength of visible light, and the nanoplastic particles had an average size of 217 ± 4 nm. A study with latex particles of varying sizes found that the maximum sensitivity occurred at a wavelength of 0.2 µm [
16]. All turbidity measurements were higher than 0.5 NTU (nephelometric turbidity units) in this study. Additionally, a high initial particle concentration of 5 mg solids/L was chosen to enable the study of the behavior of nanoplastic particles through various water and wastewater treatments. At these concentrations, alternative methods such as counting under a microscope were not feasible; however, the turbidity was well above the 0.03 NTU detection limit identified by Gregory et al. [
16], and turbidity presented a quick and straightforward means of measuring relative particle concentrations before and after treatment [
16].
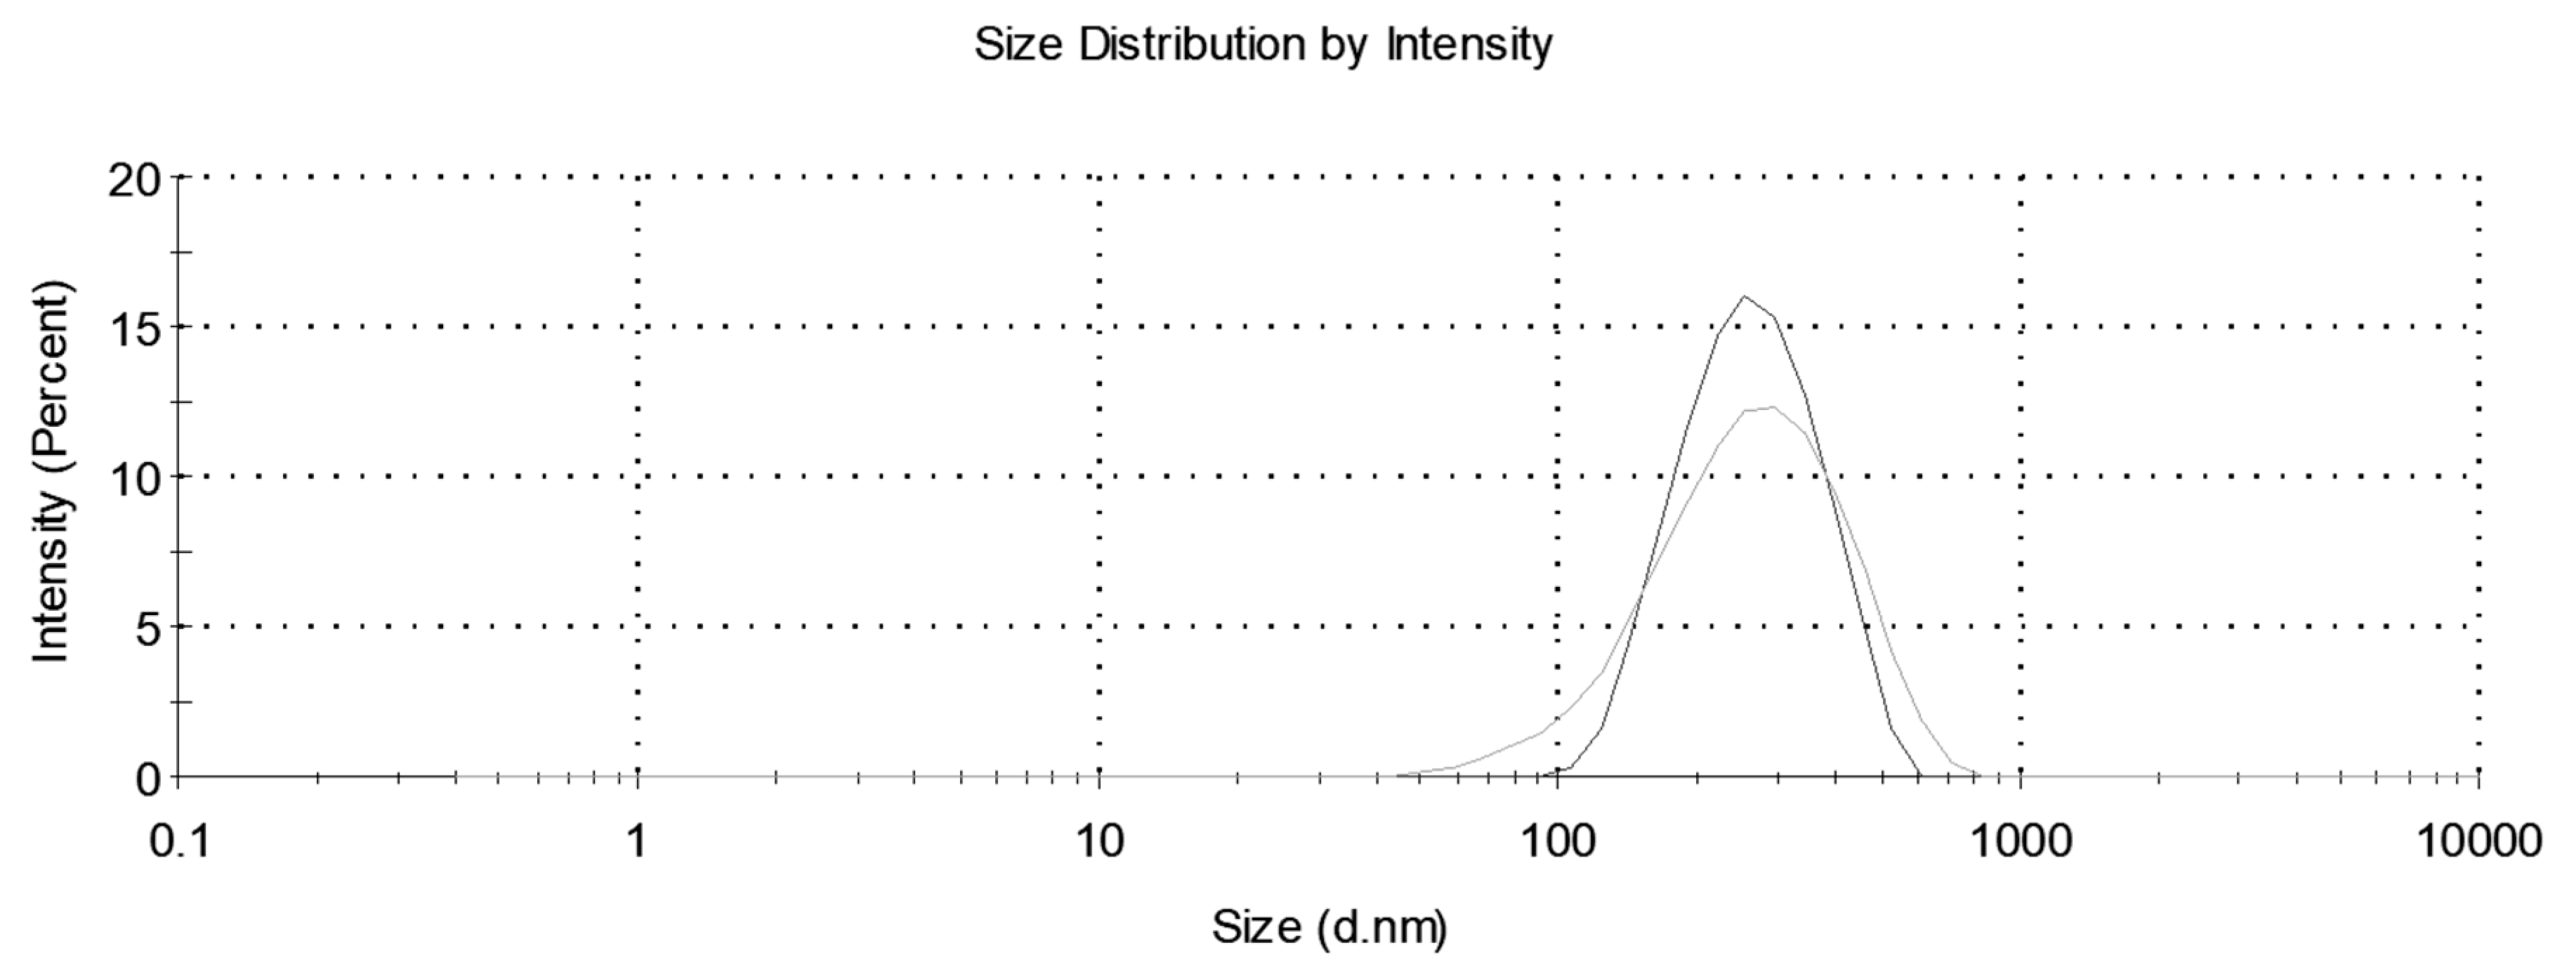
2.5. Particle Size Measurements
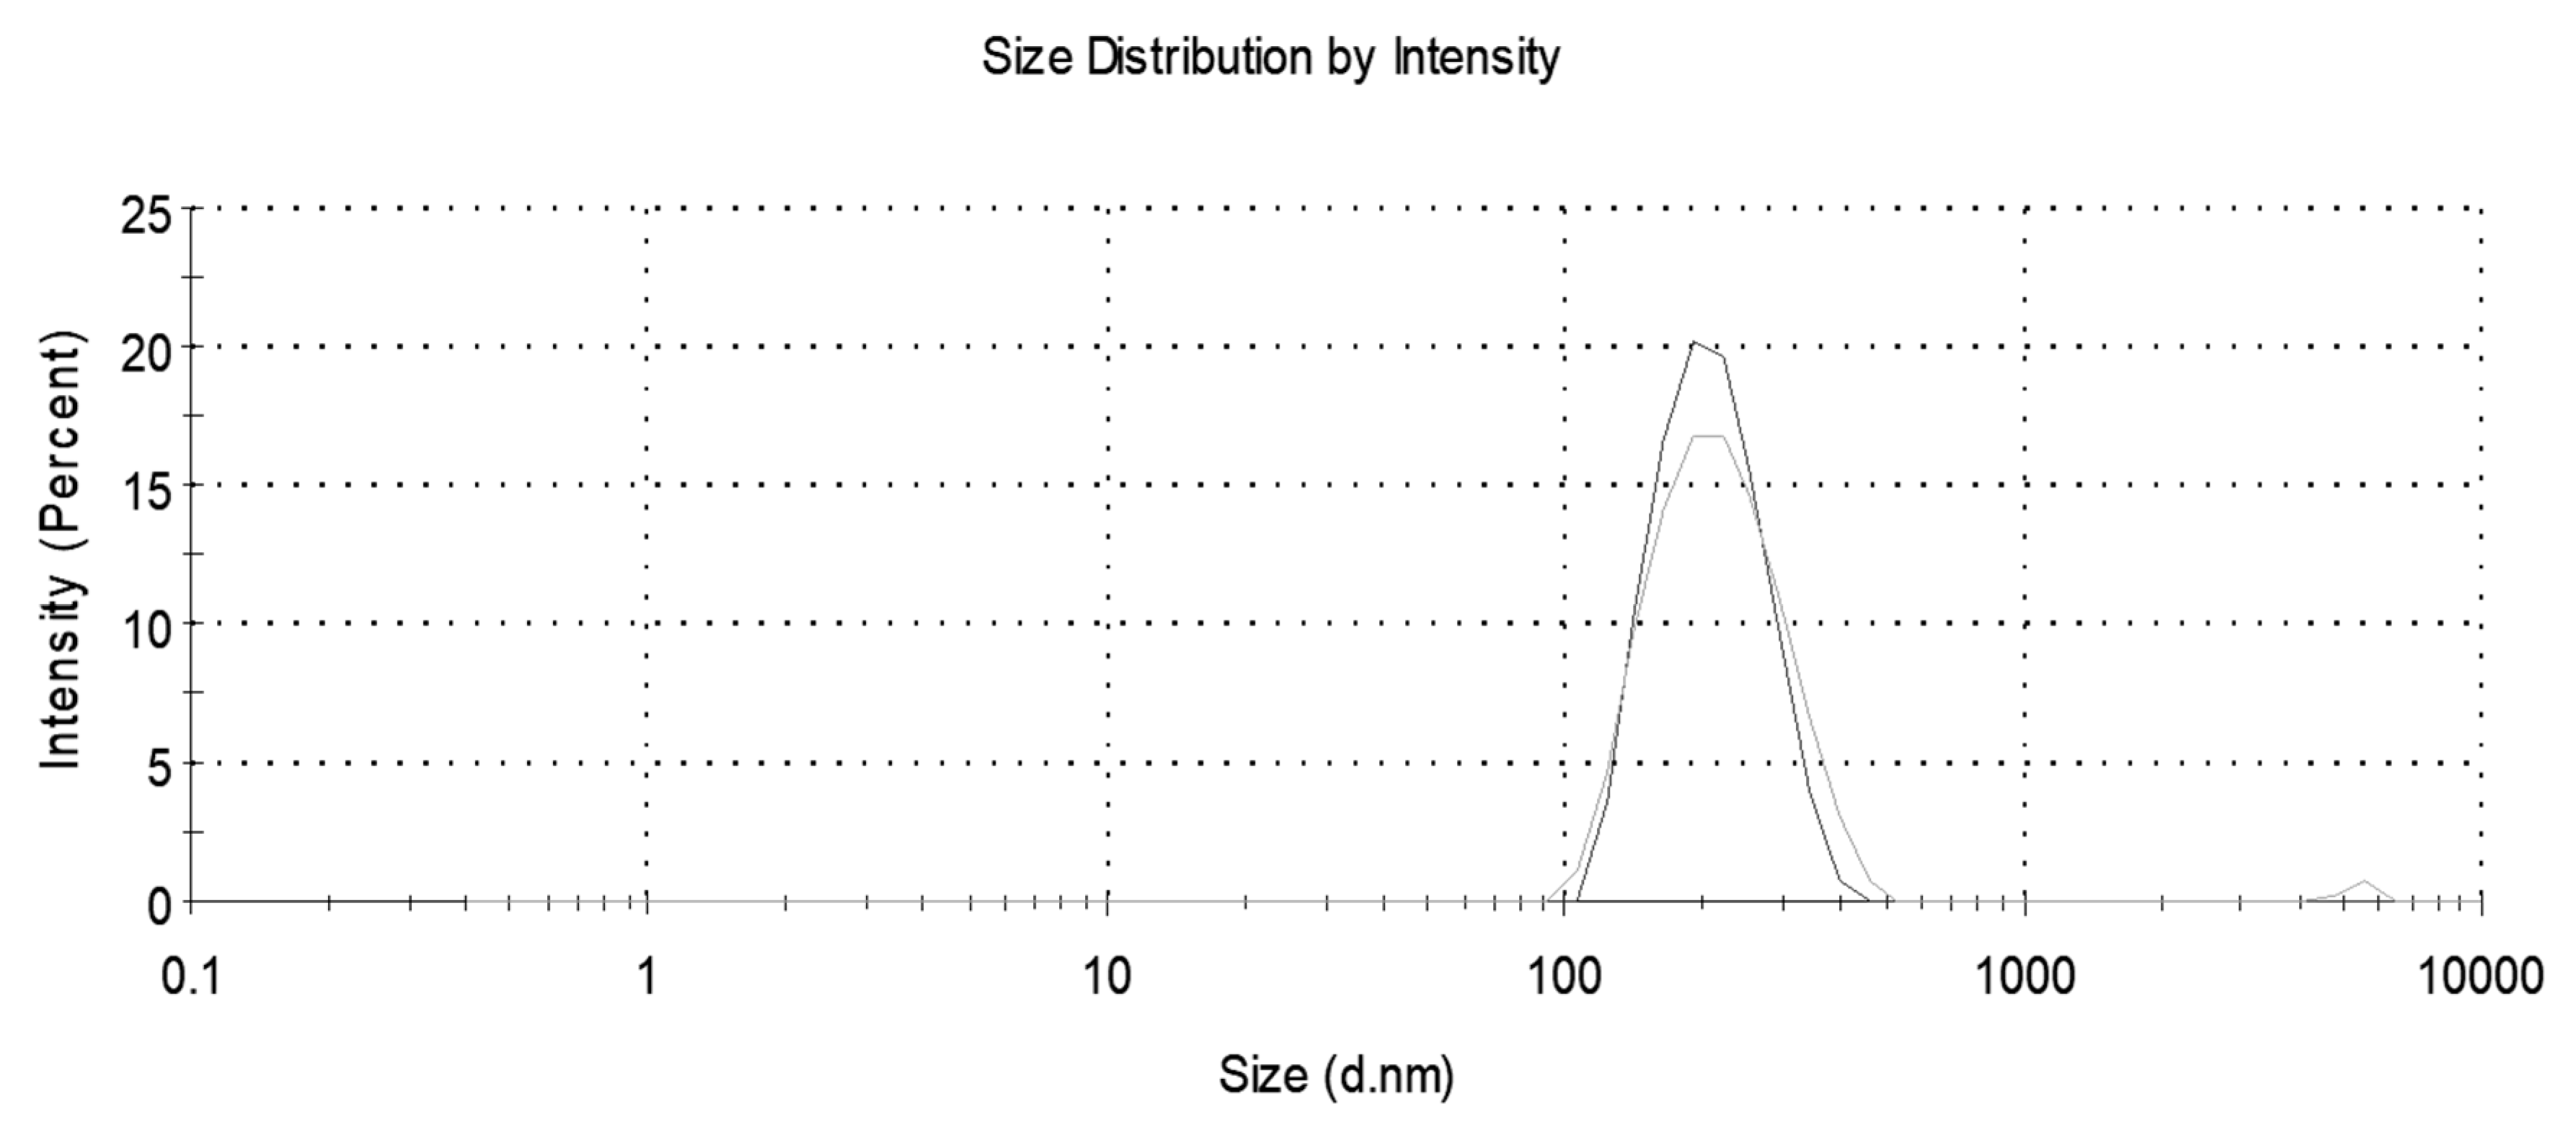
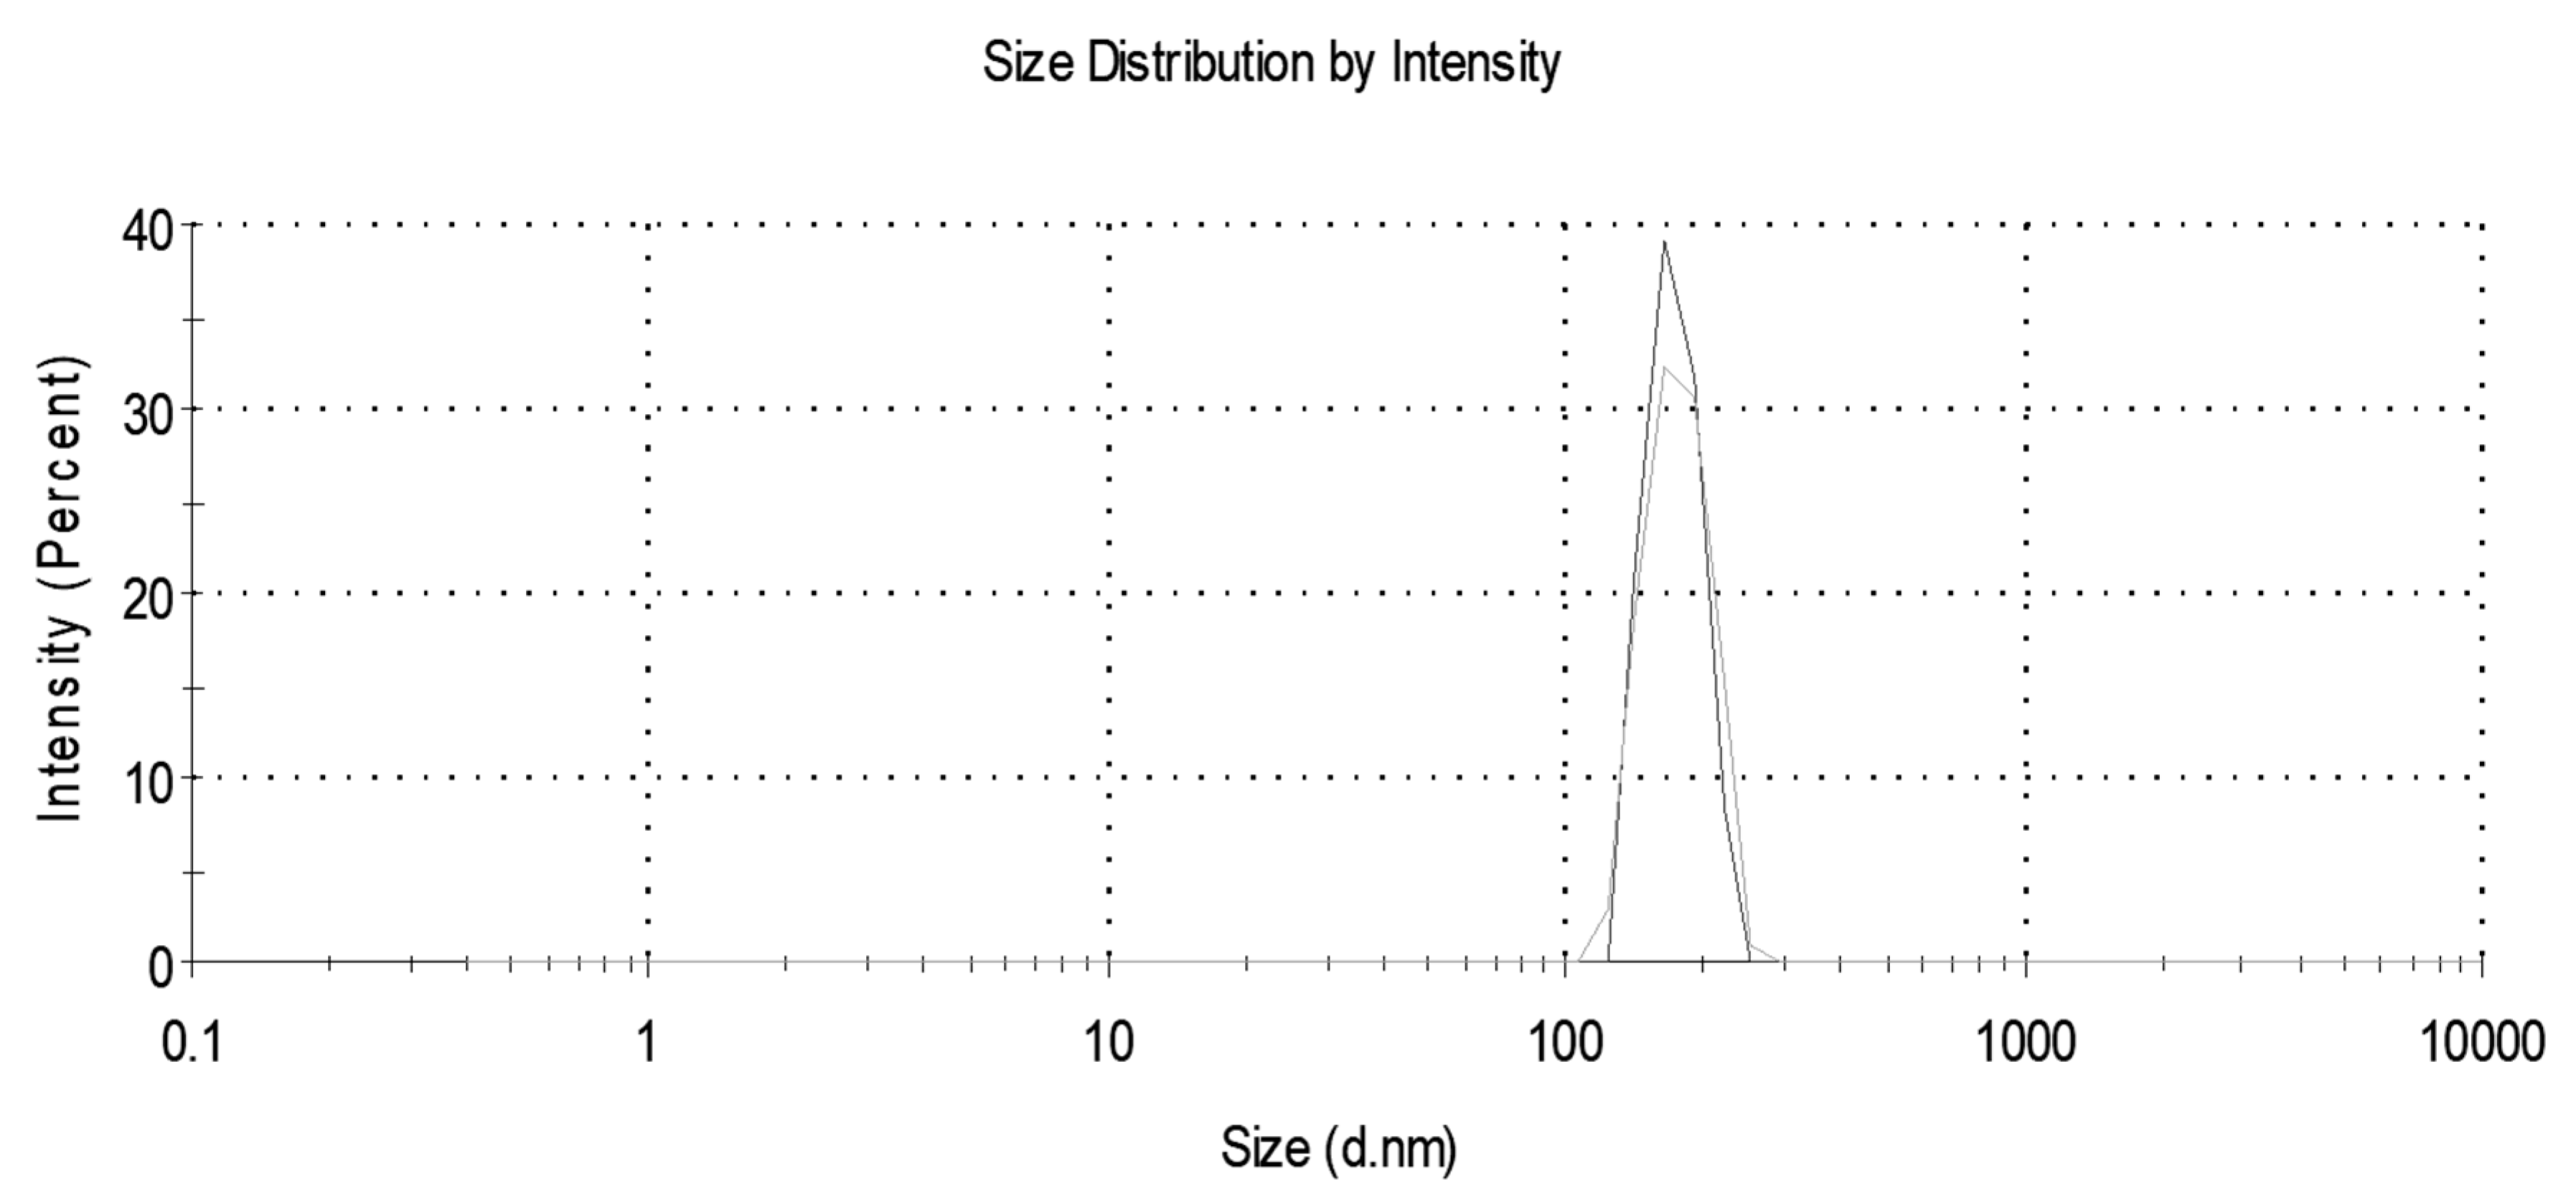
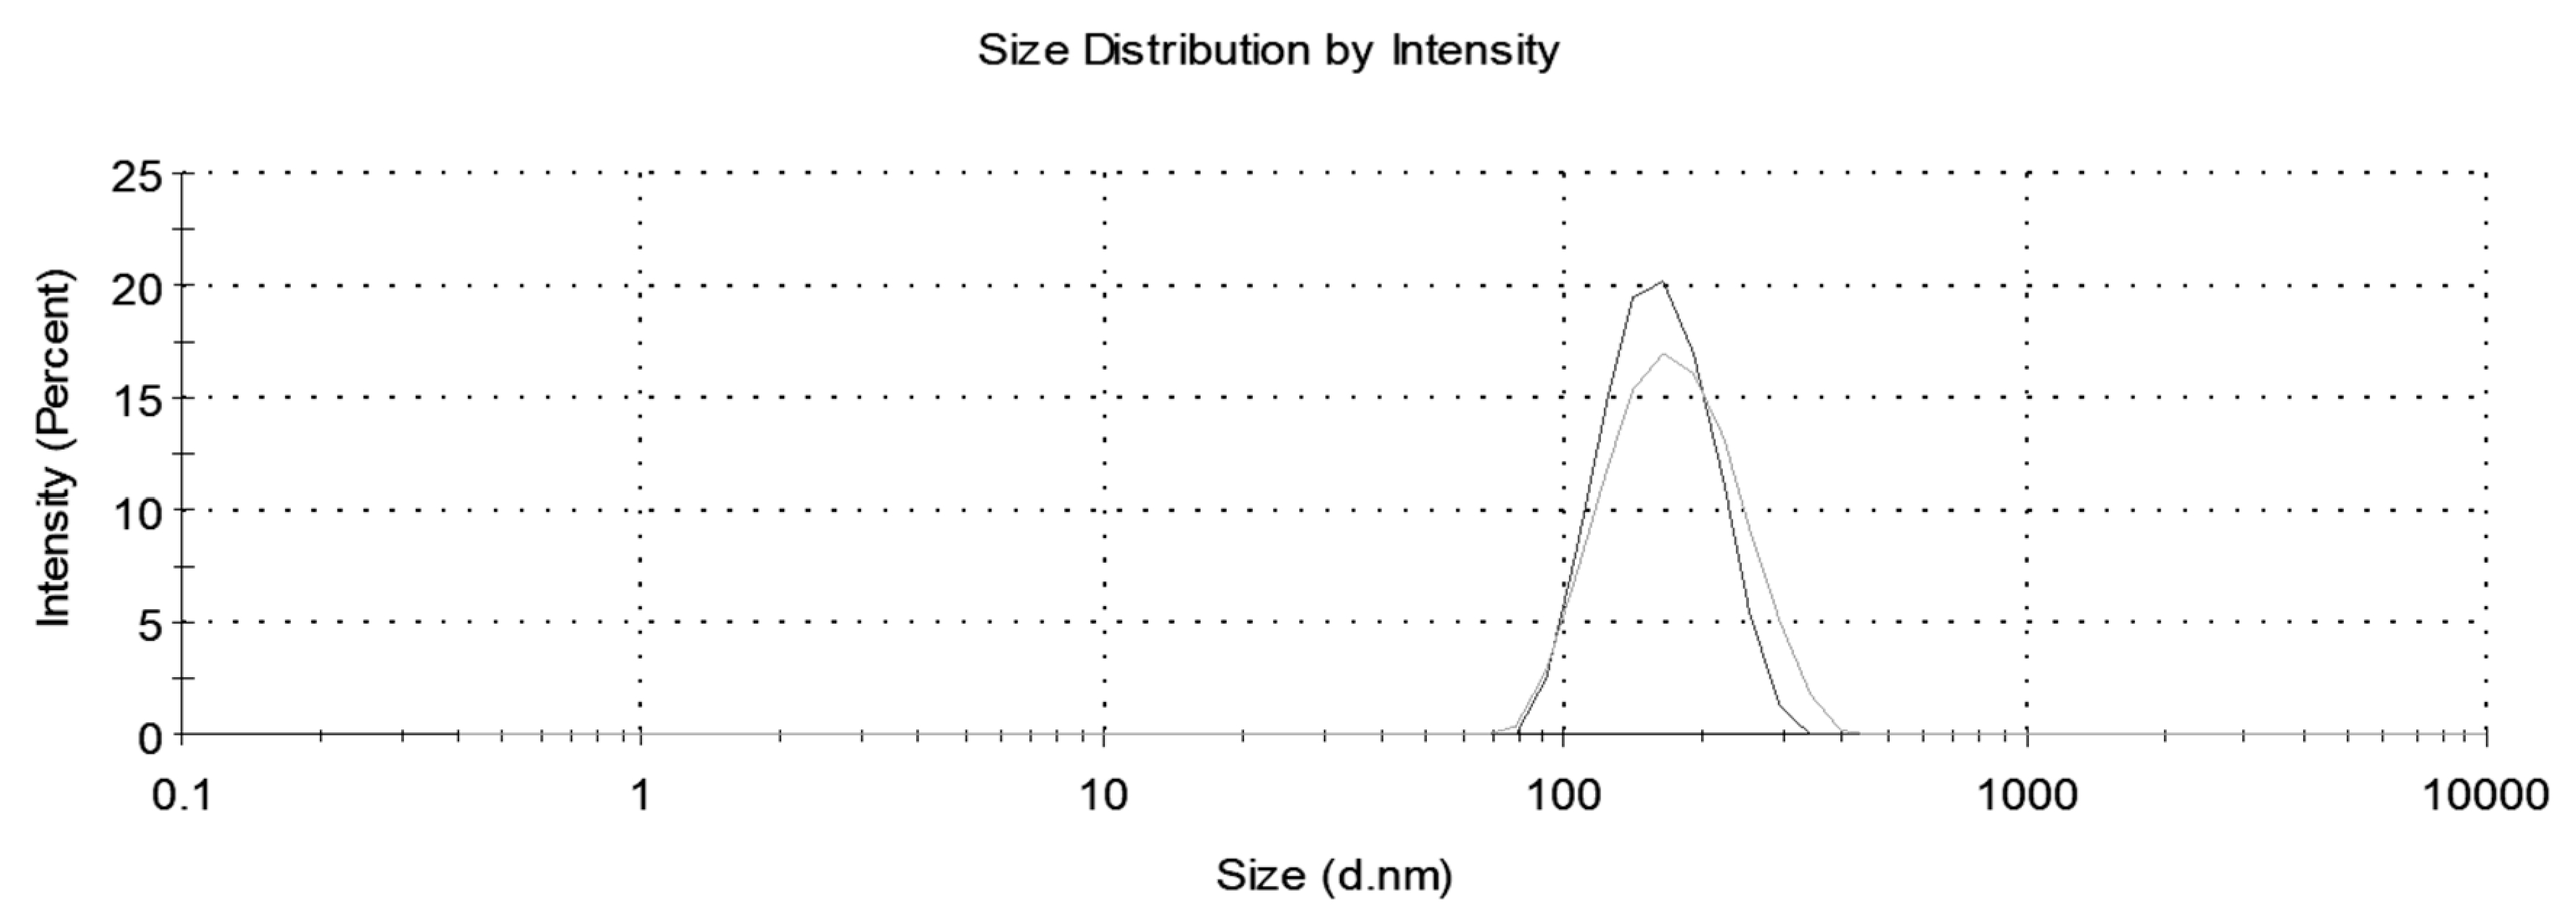
A Malvern Nano ZS Zetasizer (Malvern Instruments, St. Laurent, QC, Canada) was used to obtain particle size distributions and measure the average particle size before and after nanoplastics removal. Two experimental replicates, each consisting of two analytical replicates, were conducted.
2.6. Removal of Nanoplastics with Filtration
A bench-scale vacuum filtration set-up was used to evaluate the effectiveness of varying filter pore sizes on nanoplastic removal. The pore sizes investigated were: 0.22 µm (using a nylon syringe filter from Derian), 0.7 µm (GF/F glass microfiber filters, Whatman, Mississauga, ON, Canada,), 1 µm (GF/B glass microfiber filters, Whatmann, Mississauga, ON, Canada), 1.6 µm (G6 glass fiber circles, Fisher), and 3 µm (Grade 6 qualitative filters, Whatmann, Mississauga, ON, Canada). Three experimental replicates, evaluated with turbidity, were used for all removal experiments.
2.7. Removal of Nanoplastics with Centrifugation
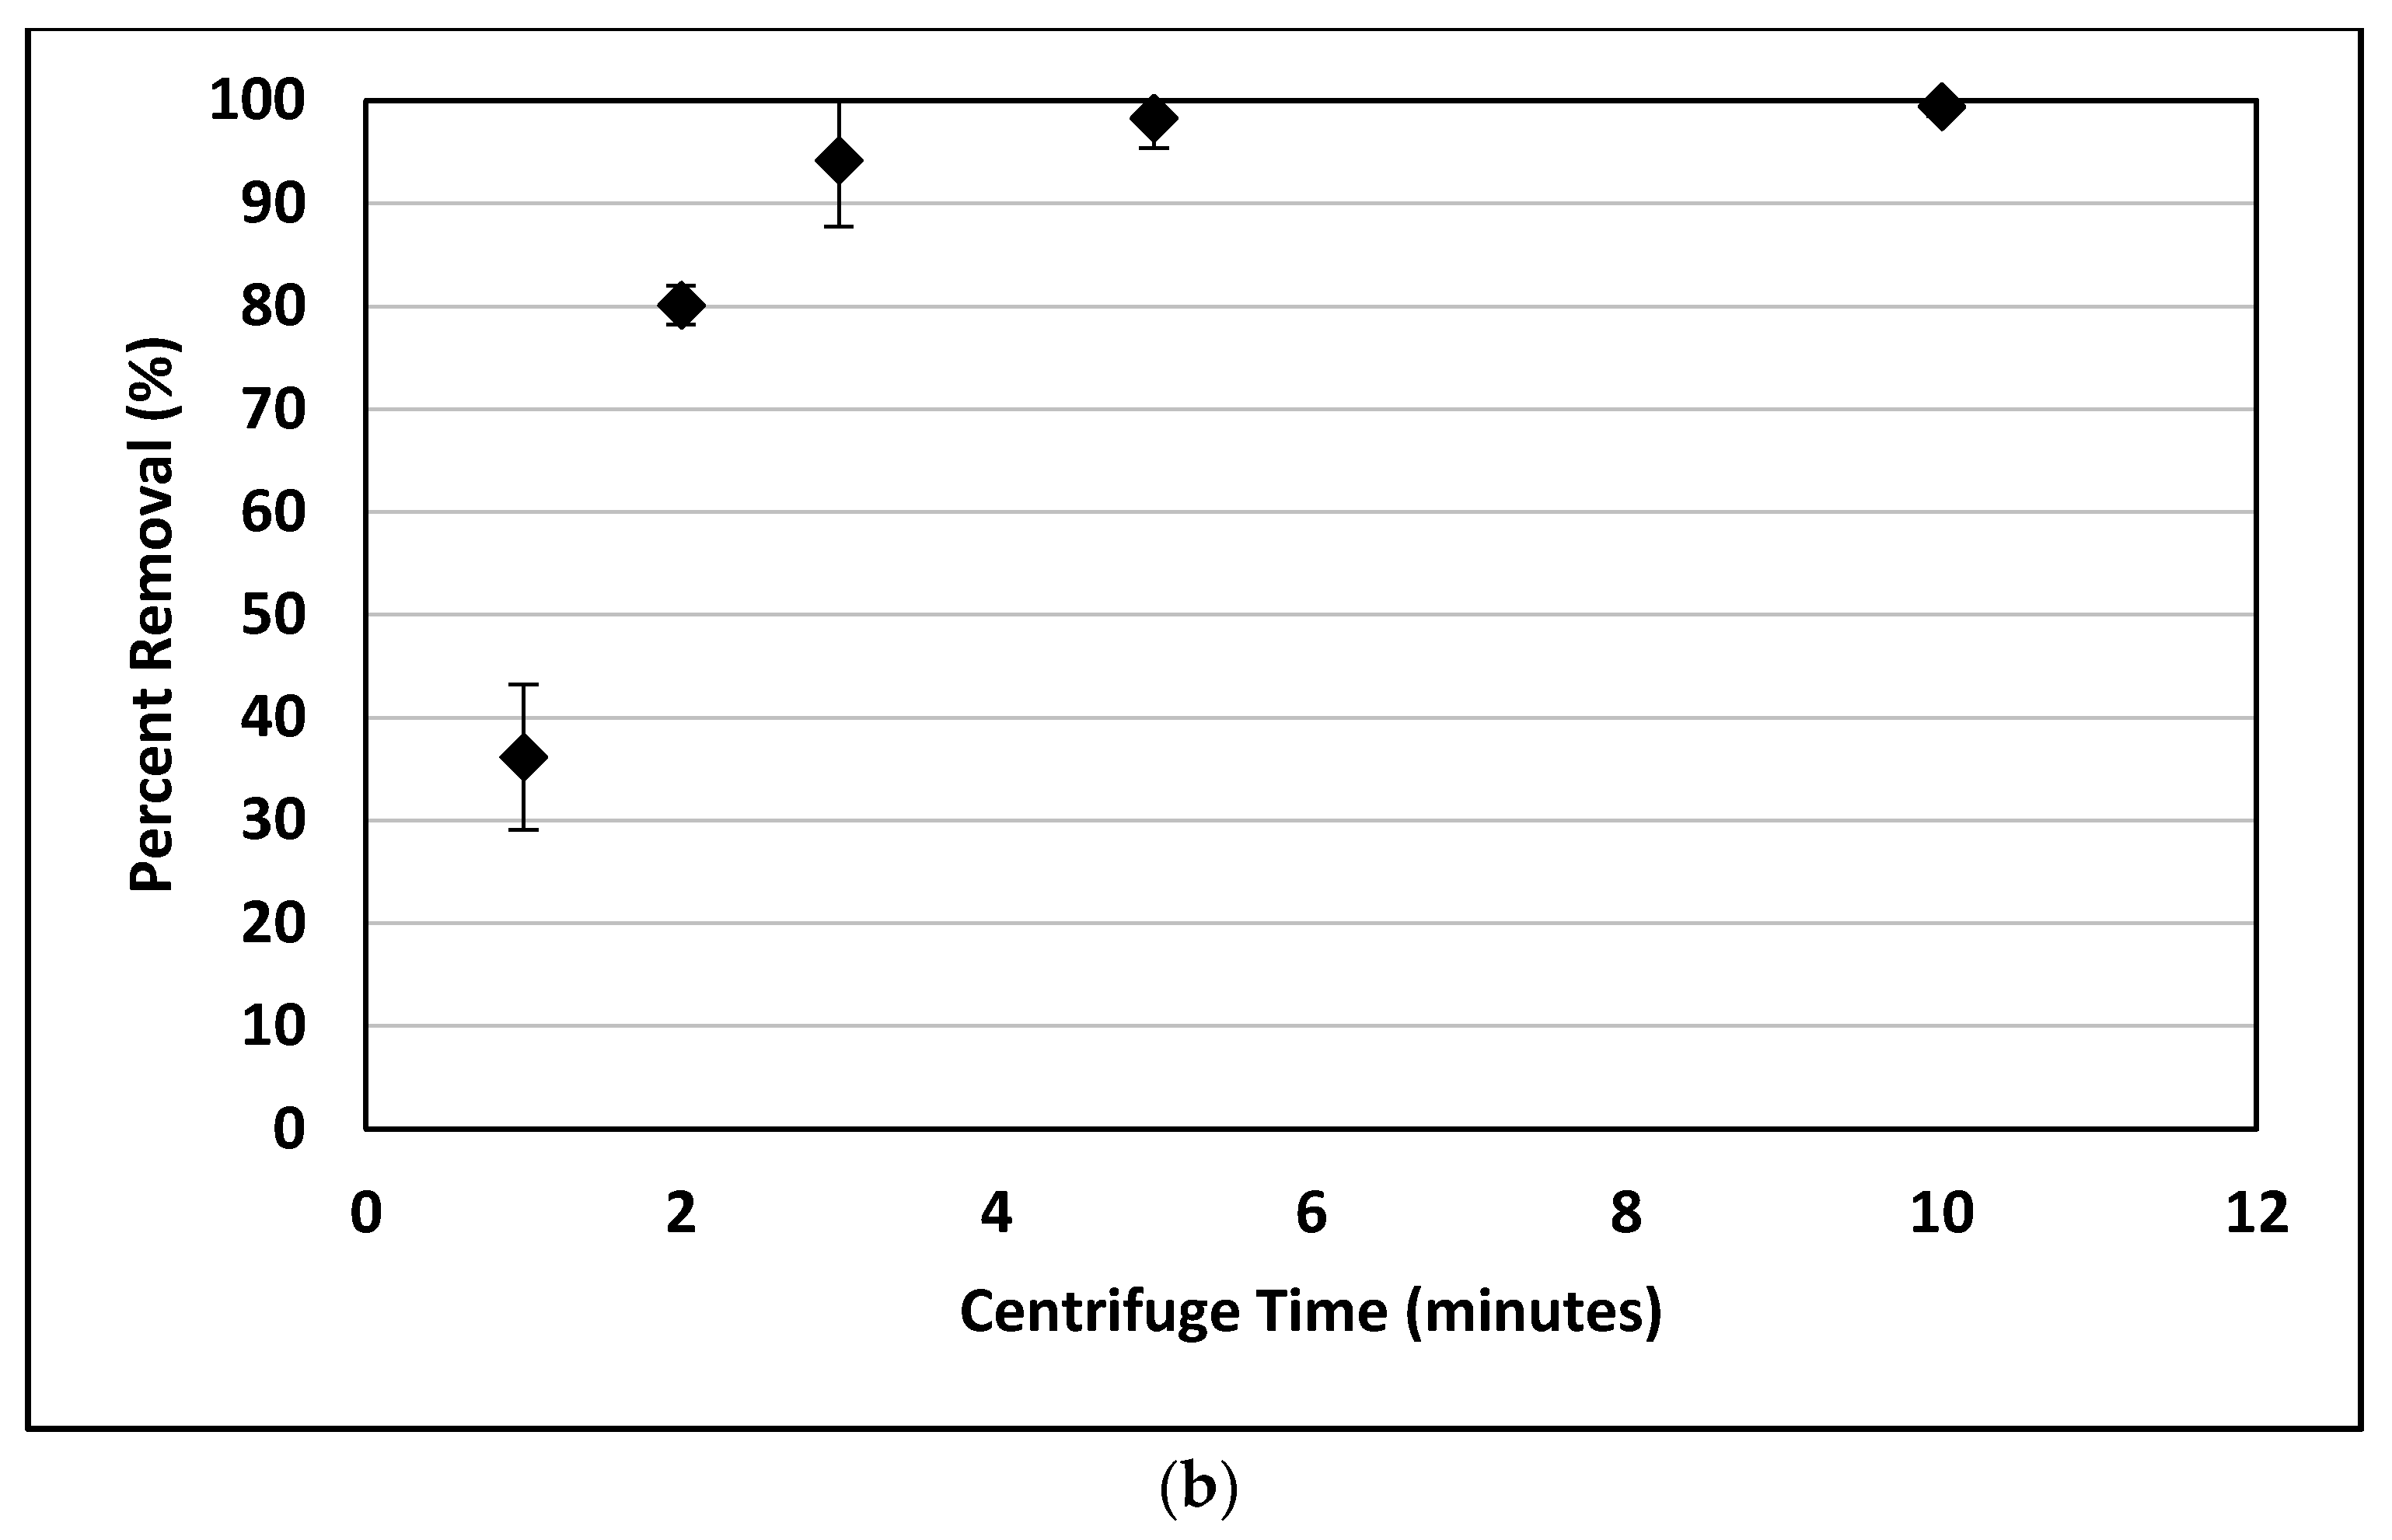
Centrifuge time and speed were varied to determine optimum conditions for removal of nanoplastics. The nanoplastic solution was prepared as outlined above and poured into three 50 mL tubes. The centrifuge (Thermo Scientific Sorval Legend RT+, Fisher Scientific, Chicago, IL, USA) was run for varying times and speeds. Then a 20 mL sample was pipetted from the surface. In the first set of experiments, the centrifuge time was varied for a constant speed of 10,000 rpm corresponding to 670,800 times the force of gravity (g). In the second set of experiments, the centrifuge speed was varied for a constant time. Three experimental replicates, evaluated with turbidity, were used for all removal experiments.
2.8. Removal of Nanoplastics with Ballasted Flocculation
The jar test procedure for ballasted flocculation was followed as described by Desjardins et al. [
17]. A jar test apparatus from Phipps and Bird (Richmond, WV, USA) was used with a flat blade impeller. The mixing speed was kept constant at 150 rpm throughout and the coagulants, microsand, and polymer were added as follows: (1) at time
t = 0, the coagulant was added and the jar tester started; (2) at time
t = 2 min, the microsand and a percentage of the polymer were added; (3) at time
t = 4 min, the remainder of the polymer was added; (4) at time
t = 10 min the mixing was turned off and the nanoplastics were allowed to settle by gravity; and (5) at time
t = 13 min, a sample was taken approximately 5 cm below the surface. The times were varied in some cases to achieve optimum performance, but the order of the additions was maintained. The speed of impeller rotation for the jar-tester remained constant throughout. Three experimental replicates, evaluated with turbidity, were used for all removal experiments.
2.8.1. Chemicals and Sand for Ballasted Flocculation
The coagulant used for ballasted flocculation was aluminum sulfate (CAS 7784-31-8) (Anachemia, Montreal, QC, Canada). The polymer was Flopolymer CA4800 (SNF, Trois Rivieres, QC, Canada). Microsand samples were obtained from John Meunier Inc. (St. Laurent, QC, Canada).
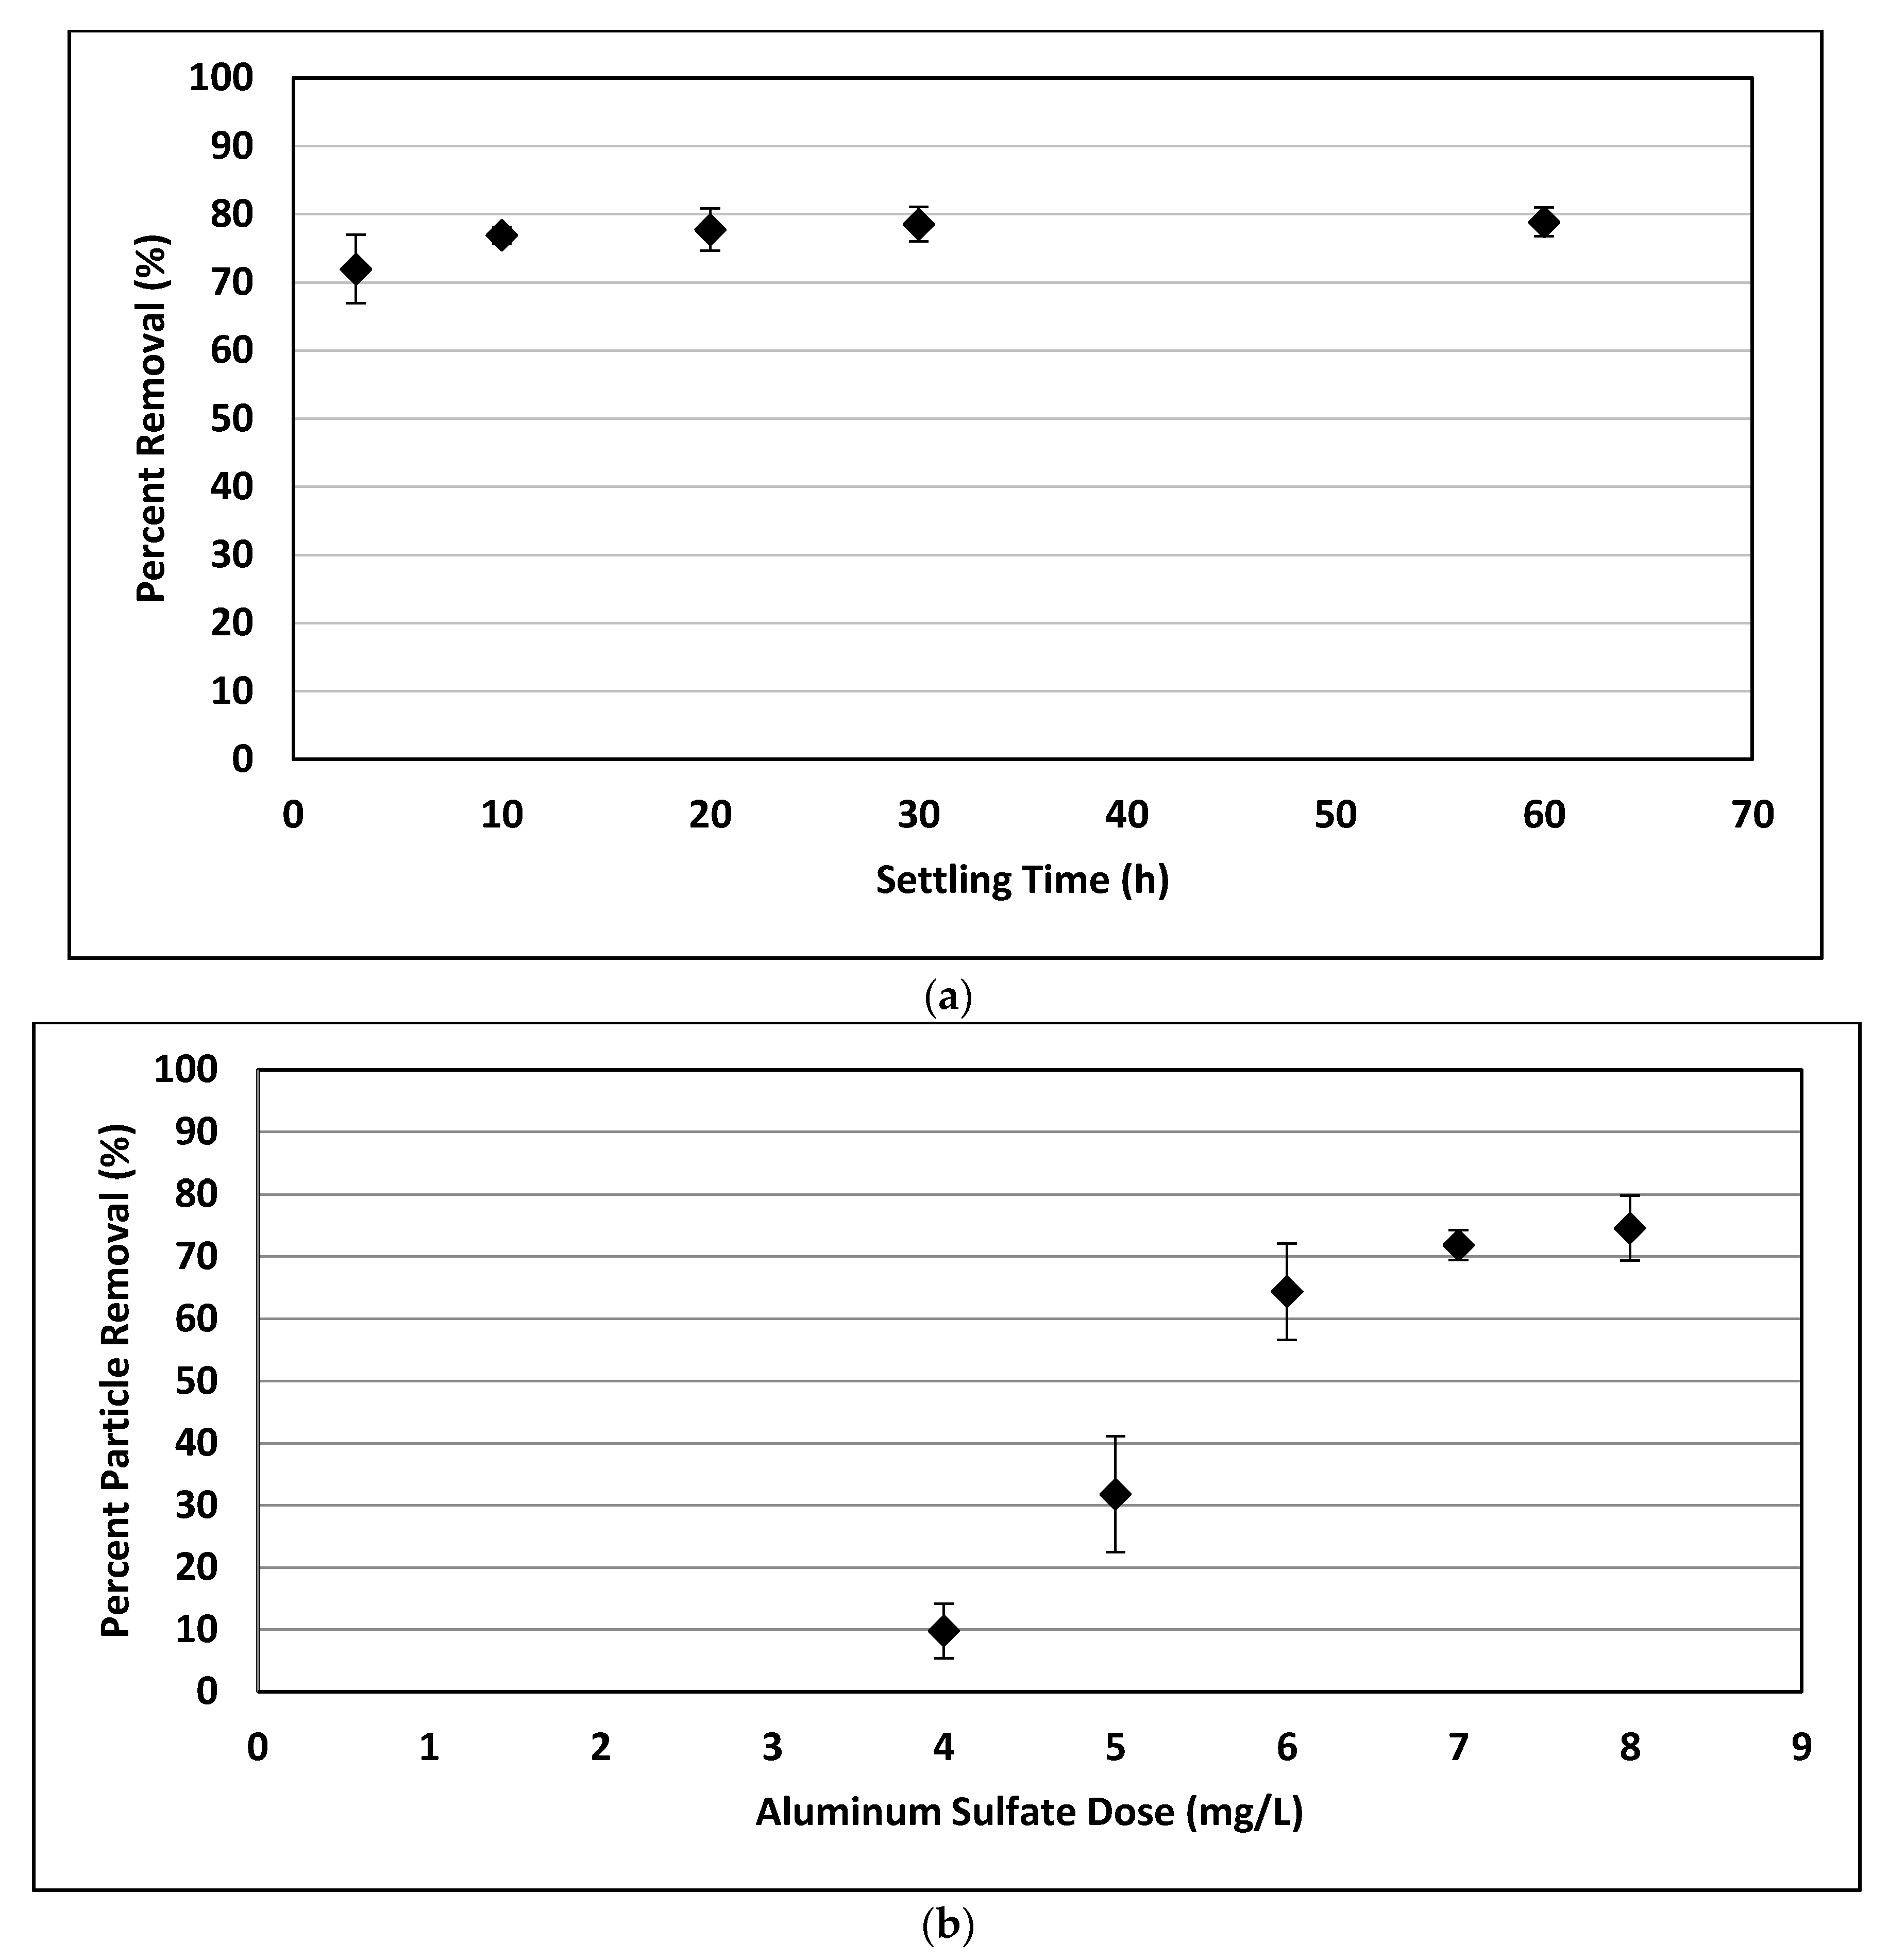
2.8.2. Effect of Settling Time
To illustrate the effect that ballasted flocculation had on nanoplastic settleability, the nanoplastic solution was allowed to settle for 1 h following treatment, and the turbidity was monitored over time.
2.8.3. Control Parameters
Since there were many factors (alum dose, polymer dose, the percent of the polymer added initially, sand dose, mixing intensity, coagulation time, flocculation time, and settling time) capable of influencing the effectiveness of the ballasted flocculation treatment, a statistical approach employing a 28−4 factorial design was used to determine which factors had a significant impact on performance. A linear regression model was obtained from the results.
2.8.4. Optimization of Ballasted Flocculation Conditions
Using the linear regression model obtained from the factorial design experiments, a path proportional to the coefficients in the regression model was followed until an increase in turbidity was observed. The conditions corresponding to the step before the increase in turbidity were taken as the optimum conditions.
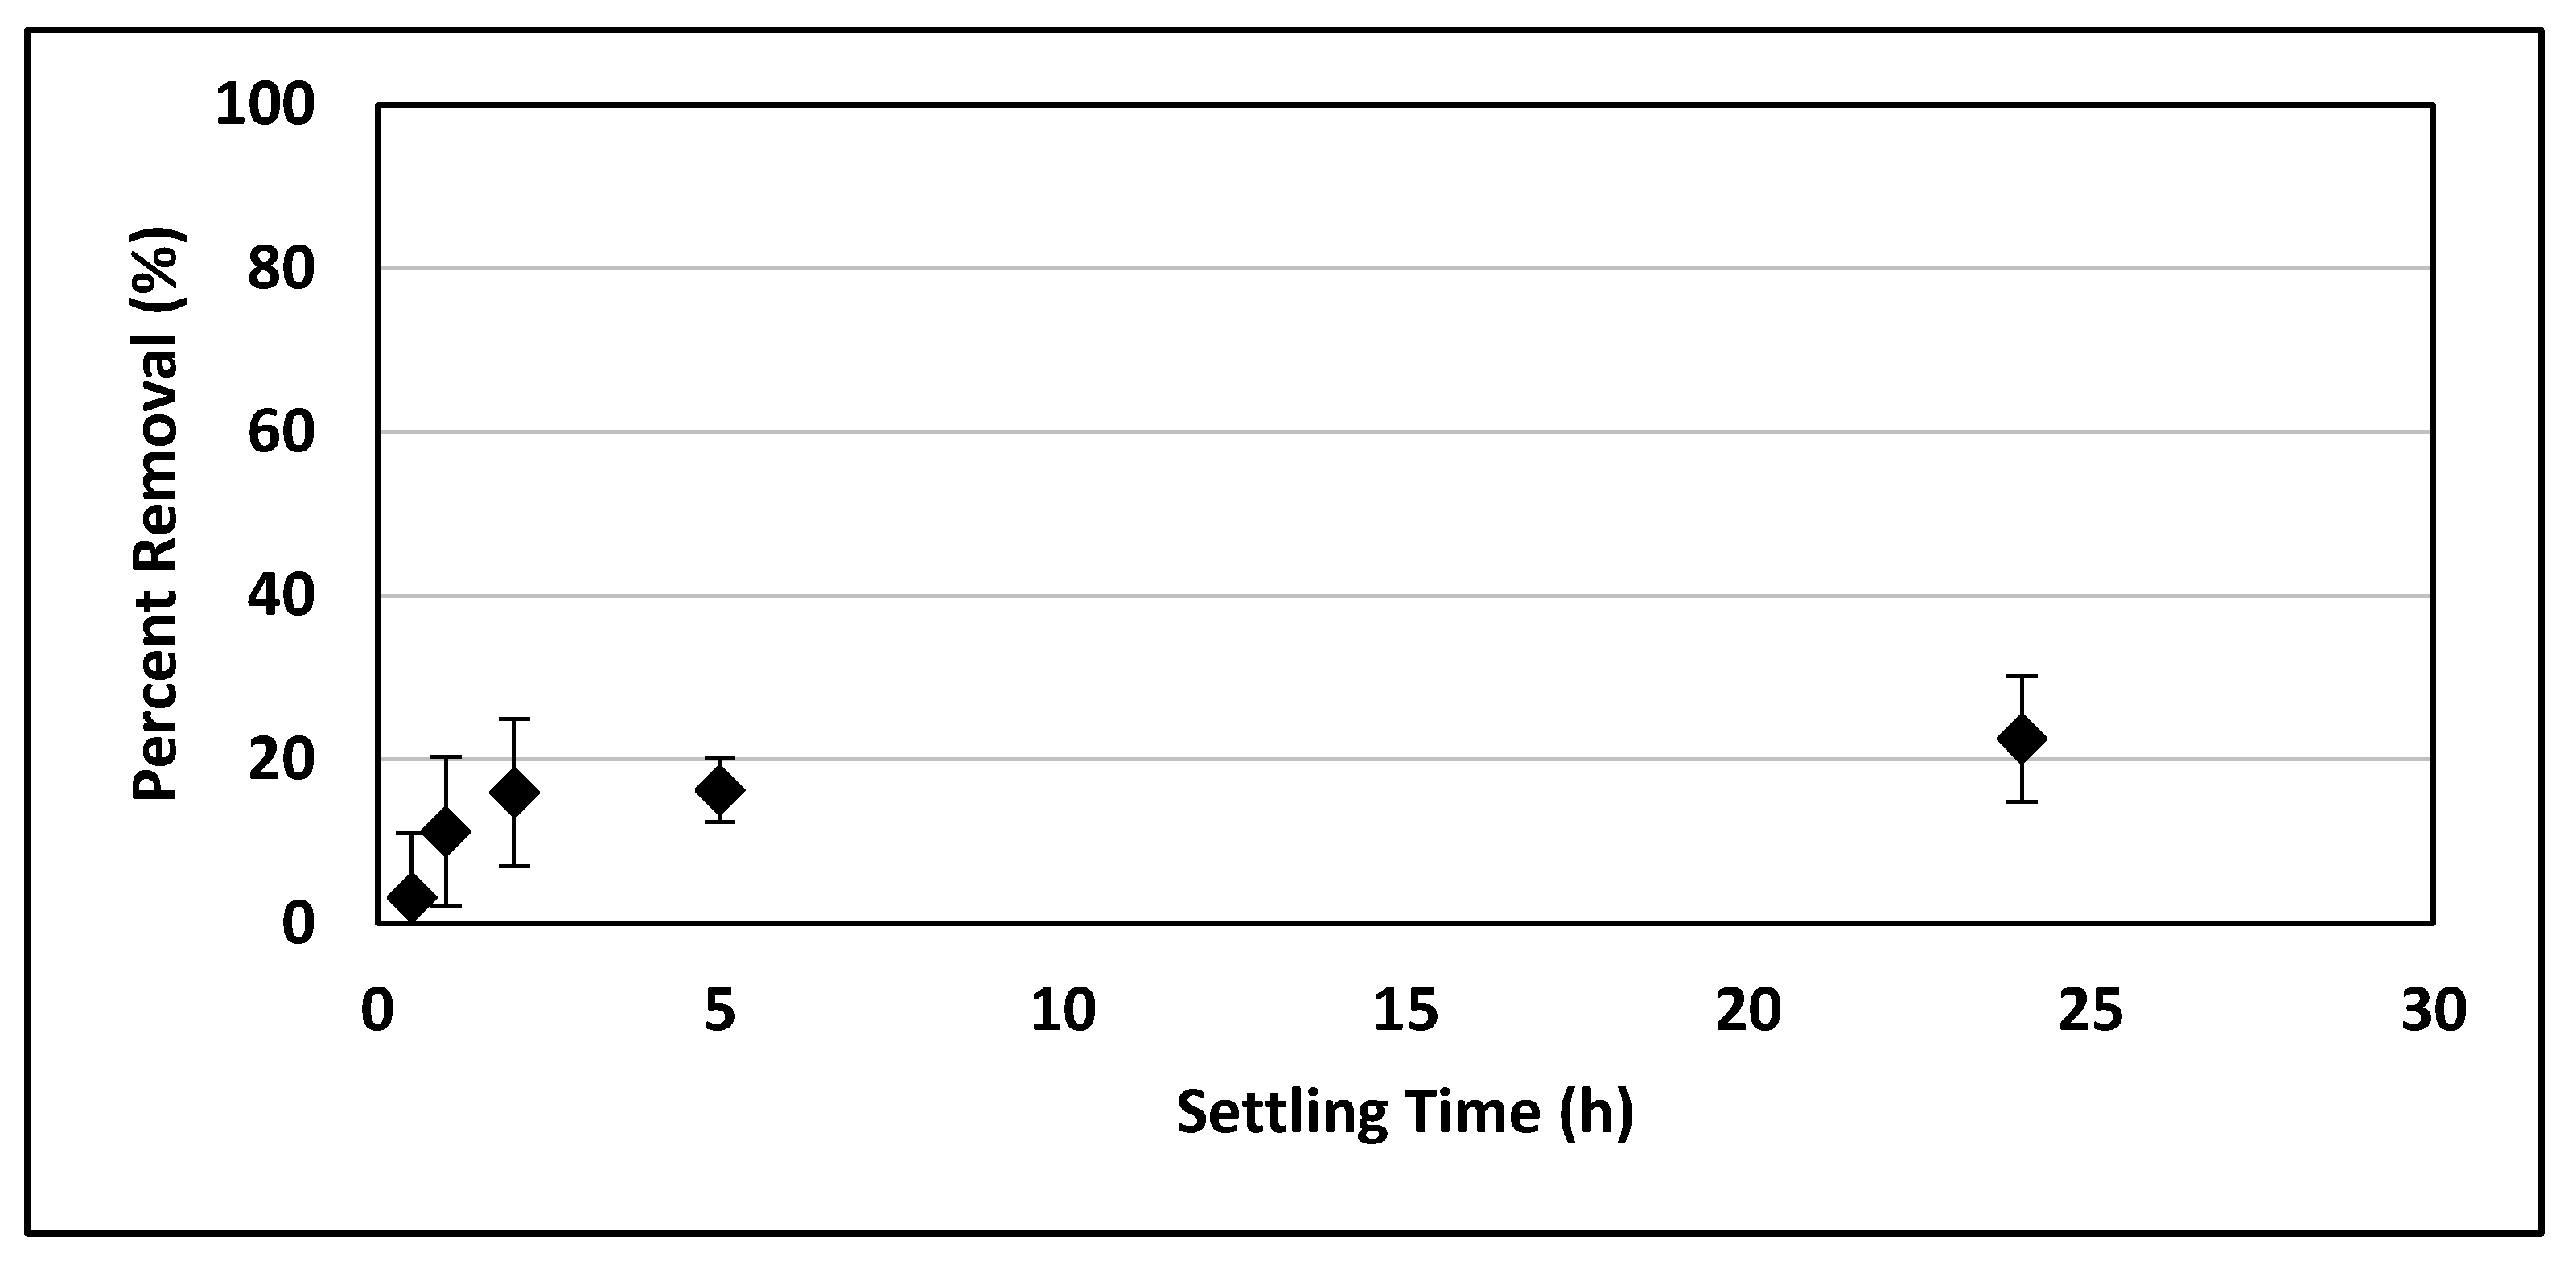
2.9. Removal of Nanoplastics with Gravity Settling
To determine the settleability of the nanoplastic particles with no treatment, three 1 L beakers of the 5 mg/L nanoplastic suspension in tap water were monitored for 24 h. Samples were taken 5 cm below the surface of the water and measured for turbidity. Three experimental replicates, evaluated with turbidity, were used for all removal experiments.
4. Conclusions
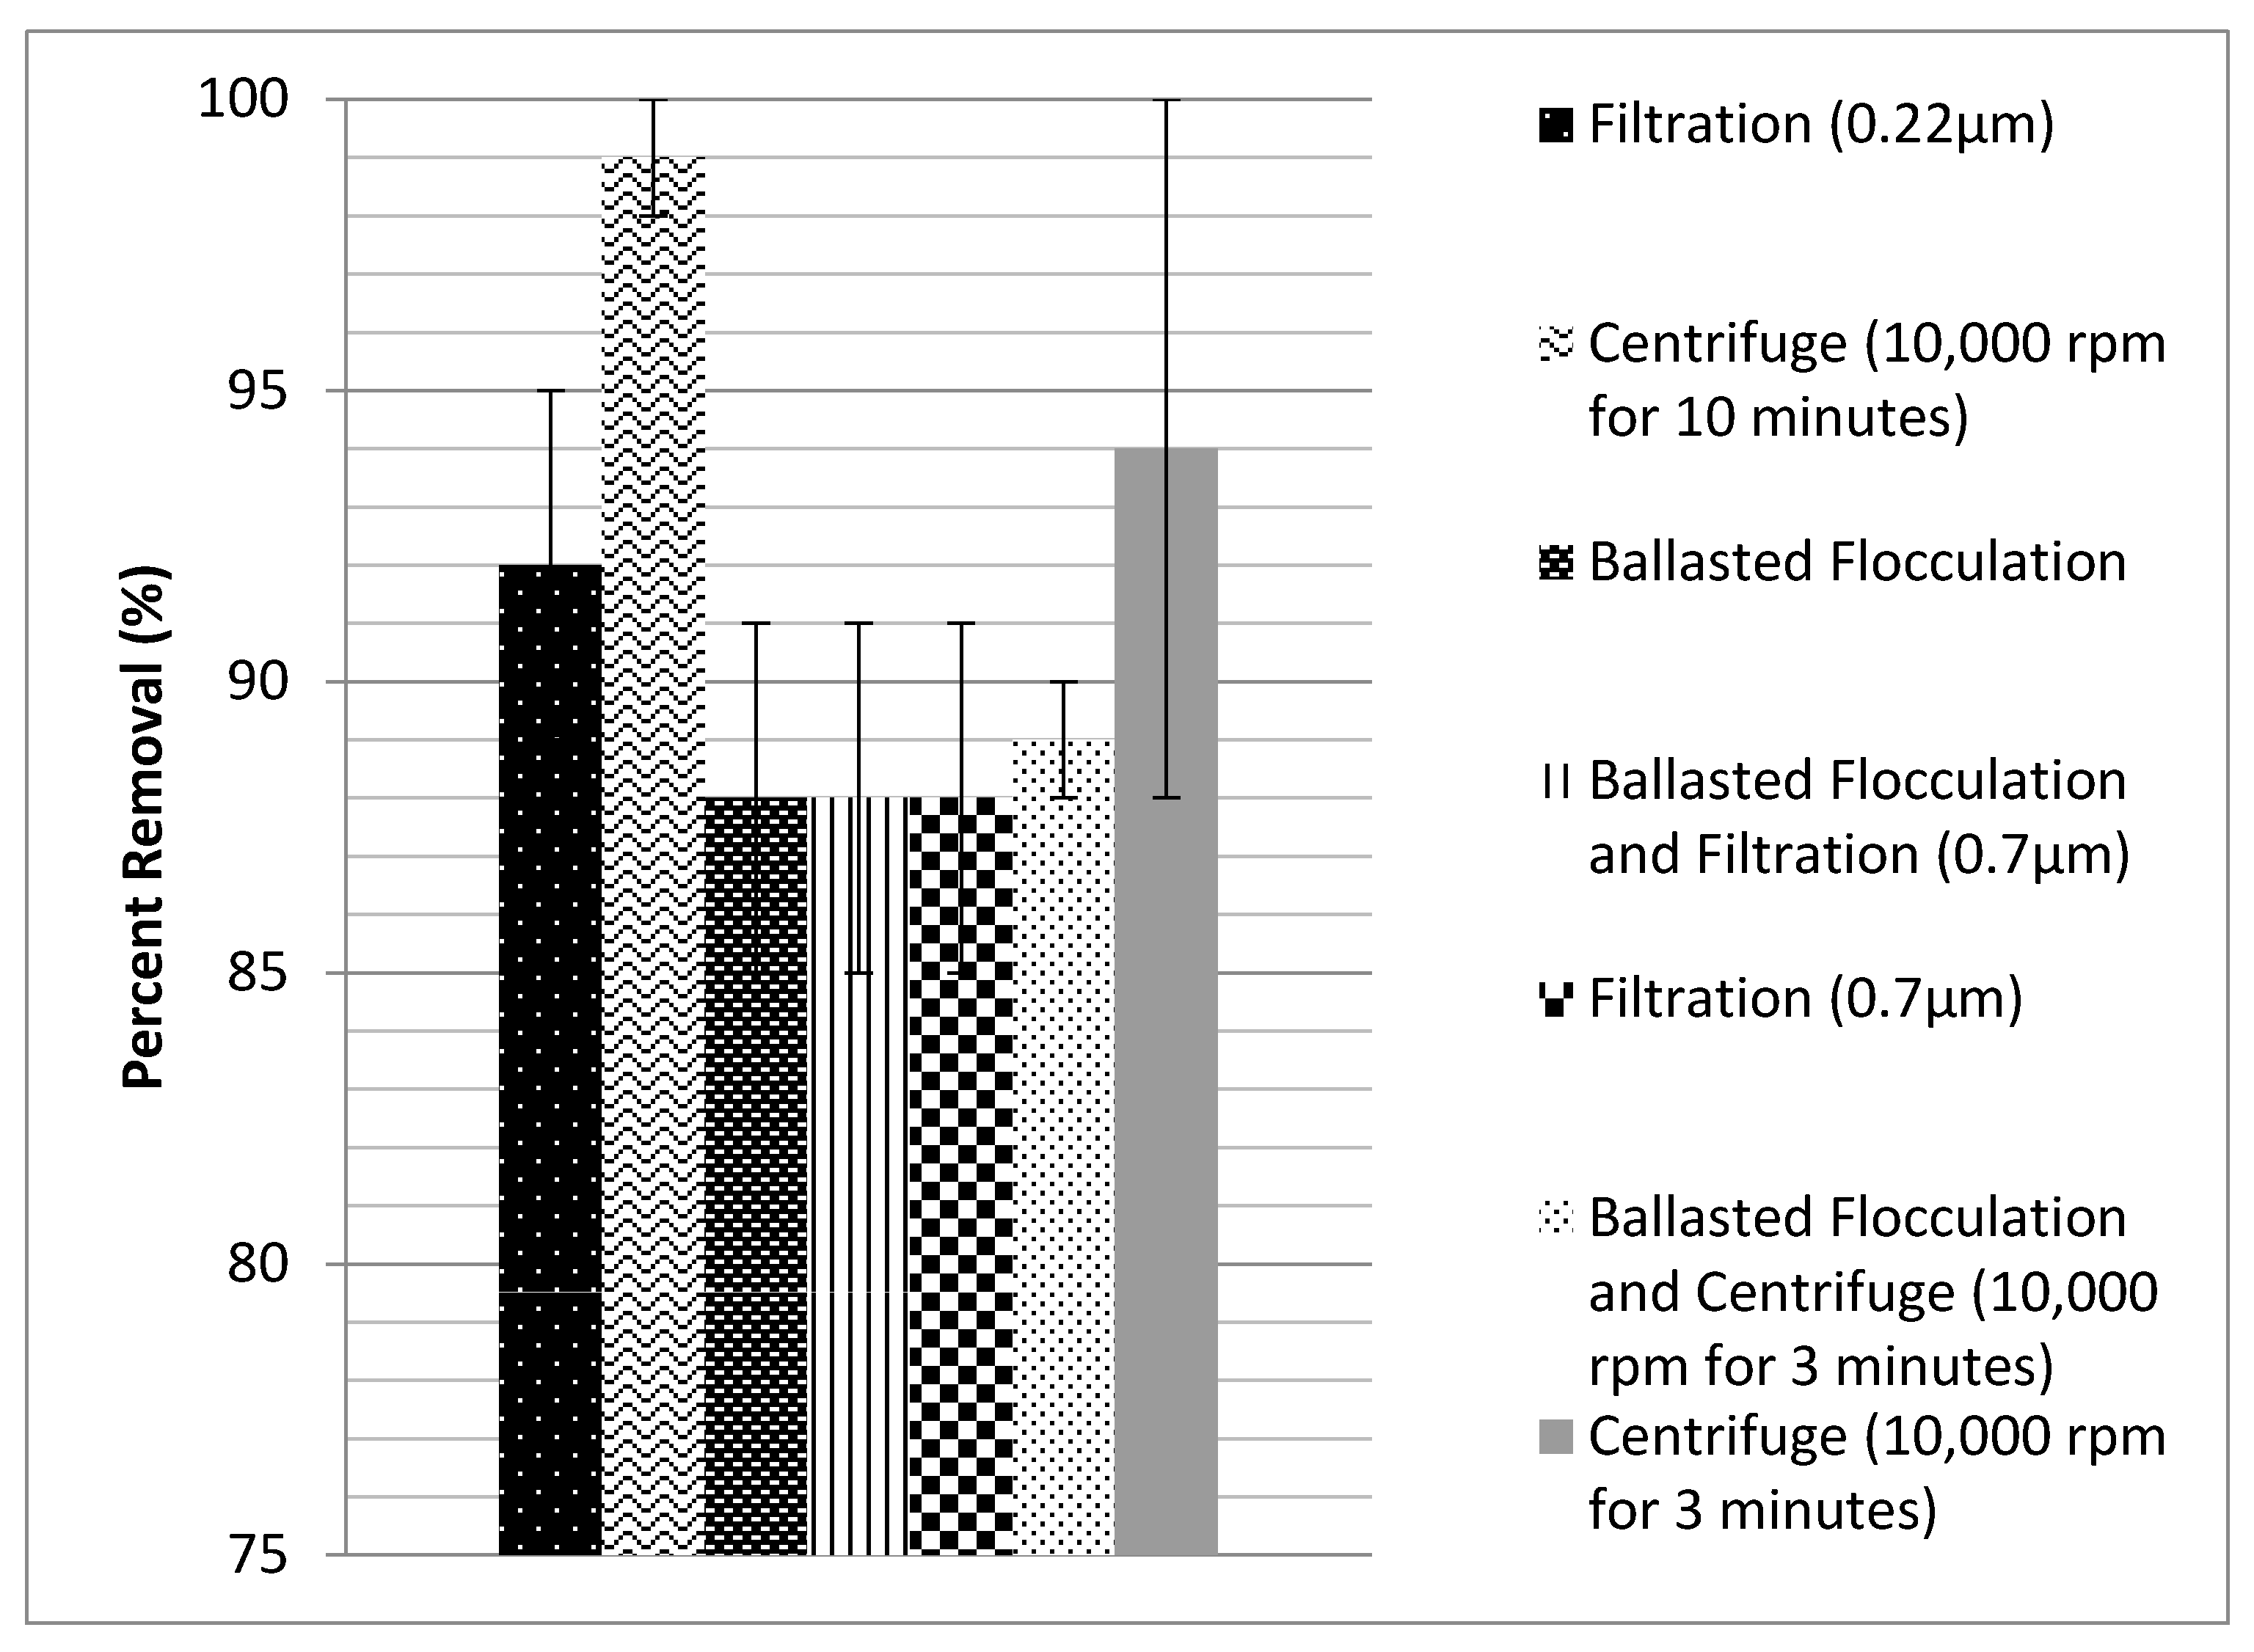
This study investigated removal of nanoplastics (<400 nm) from water, at a bench-scale and using filtration, centrifugation, and ballasted flocculation. Filtration with 0.22 μm filters removed 92 ± 3% of the particles, and importantly did not show a size preference or change the distribution of the particles. Centrifugation at 10,000 rpm (670,800 g) for 10 min removed 99 ± 1% of the particles but did preferentially remove larger particles. This is a potential area of concern because smaller particles may have a greater environmental impact. Ballasted flocculation was able to remove 88 ± 3% of the particles. These results provide a general idea of the magnitude of removal of nanoplastics smaller than 400 nm with separation processes used for water, wastewater, and stormwater treatment. The removal was good using all three treatments, but it is important to note that even a small number of particles escaping treatment can increase the nanoplastics concentration of receiving water bodies. More work is recommended to determine the degree of removal with full-scale unit processes.


