1. Introduction
Cyanobacteria are photosynthetic bacteria that occur naturally in fresh, brackish, marine waters, and terrestrial environments [
1]. Cyanobacteria are a worldwide problem [
2] for their ability to form massive blooms that can produce a wide range of harmful toxins [
3]. Bloom events are likely to be promoted by eutrophication and climate change, and the number and intensity of these blooms increased globally over the last decades [
4]. Cyanobacteria can cause a whole range of problems for human health and the environment. Fish killed by anoxia caused by the decay of the cyanobacteria biomass is a notorious effect of cyanobacteria blooms [
5]. Moreover, in some conditions, cyanobacteria can produce cyanotoxins (that includes hepatotoxins, neurotoxins, cytotoxins, and dermotoxins) negatively impacting the survival of aquatic organisms [
6]. In addition to wild animals, intoxication can also occur for domestic animals and humans, either by direct ingestion of cyanobacteria cells and/or through consumption of drinking water containing cyanotoxins [
7], leading to public health concerns [
3]. Cyanobacteria blooms also generate bad-smelling mucilaginous scum that both impact the recreational use of water bodies and prevent their use for drinking water. Considering the negative impacts of cyanobacterial blooms on ecological, economical, and human health, their monitoring and forecast is of paramount importance for lake management [
8]. Several monitoring approaches and predictive models were developed to provide accurate and timely information regarding the development of cyanobacterial bloom in the waterbodies.
Different modeling techniques are known and used for algal bloom prediction, the most common being multiple linear regression (MLR) and artificial neural networks (ANNs). MLR is the simplest technique used to develop linear models and used, for example, to predict cyanobacteria [
9,
10] or chlorophyll-a [
11,
12,
13] abundance, while ANNs are complex machine learning techniques, which mimic the neural adaptation behavior in order to “learn” how to solve a problem.
Eutrophication has been cited as a major cause of increasing harmful cyanobacterial/algal blooms, in particular in the Mediterranean area [
14], and factors including light, temperature, quiescent water and nutrients, mainly total nitrogen (TN) and total phosphorus (TP), are considered among the main drivers of cyanobacterial blooms [
15,
16]. Albeit, it is well known that important predictors for cyanobacteria dominance and biomass are TP and TN [
17,
18], there are increasing evidences that water temperature (WT) is an important factor [
9,
19,
20,
21,
22,
23,
24]. Warming waters intensify the vertical stratification and lengthen the period of seasonal stratification, which is one of the main physical variables determining the occurrence of algal bloom outbreaks [
25]. The most evident effect of stratification is the changing availability of nutrients, which may be accumulated in surface layers or mixed in the entire water column. The increasing global air temperature may increase the strength and depth of stratification, with possible influences on the seasonal timing and changes in the phytoplankton phenology and community succession. Stratification leads cyanobacteria to outcompete other phytoplankton groups, both because of their buoyancy regulation ability [
26,
27] and because cyanobacteria are positively affected by the increase of water temperature [
22]. In addition, it has been shown that the meteorological variables as air temperature, wind speed, and relative humidity, could be drivers of hypolimnetic anoxia, which is an indirect consequence of thermal stratification [
28].
Previous studies found conflicting results on the response of cyanobacteria to climate and nutrients [
23,
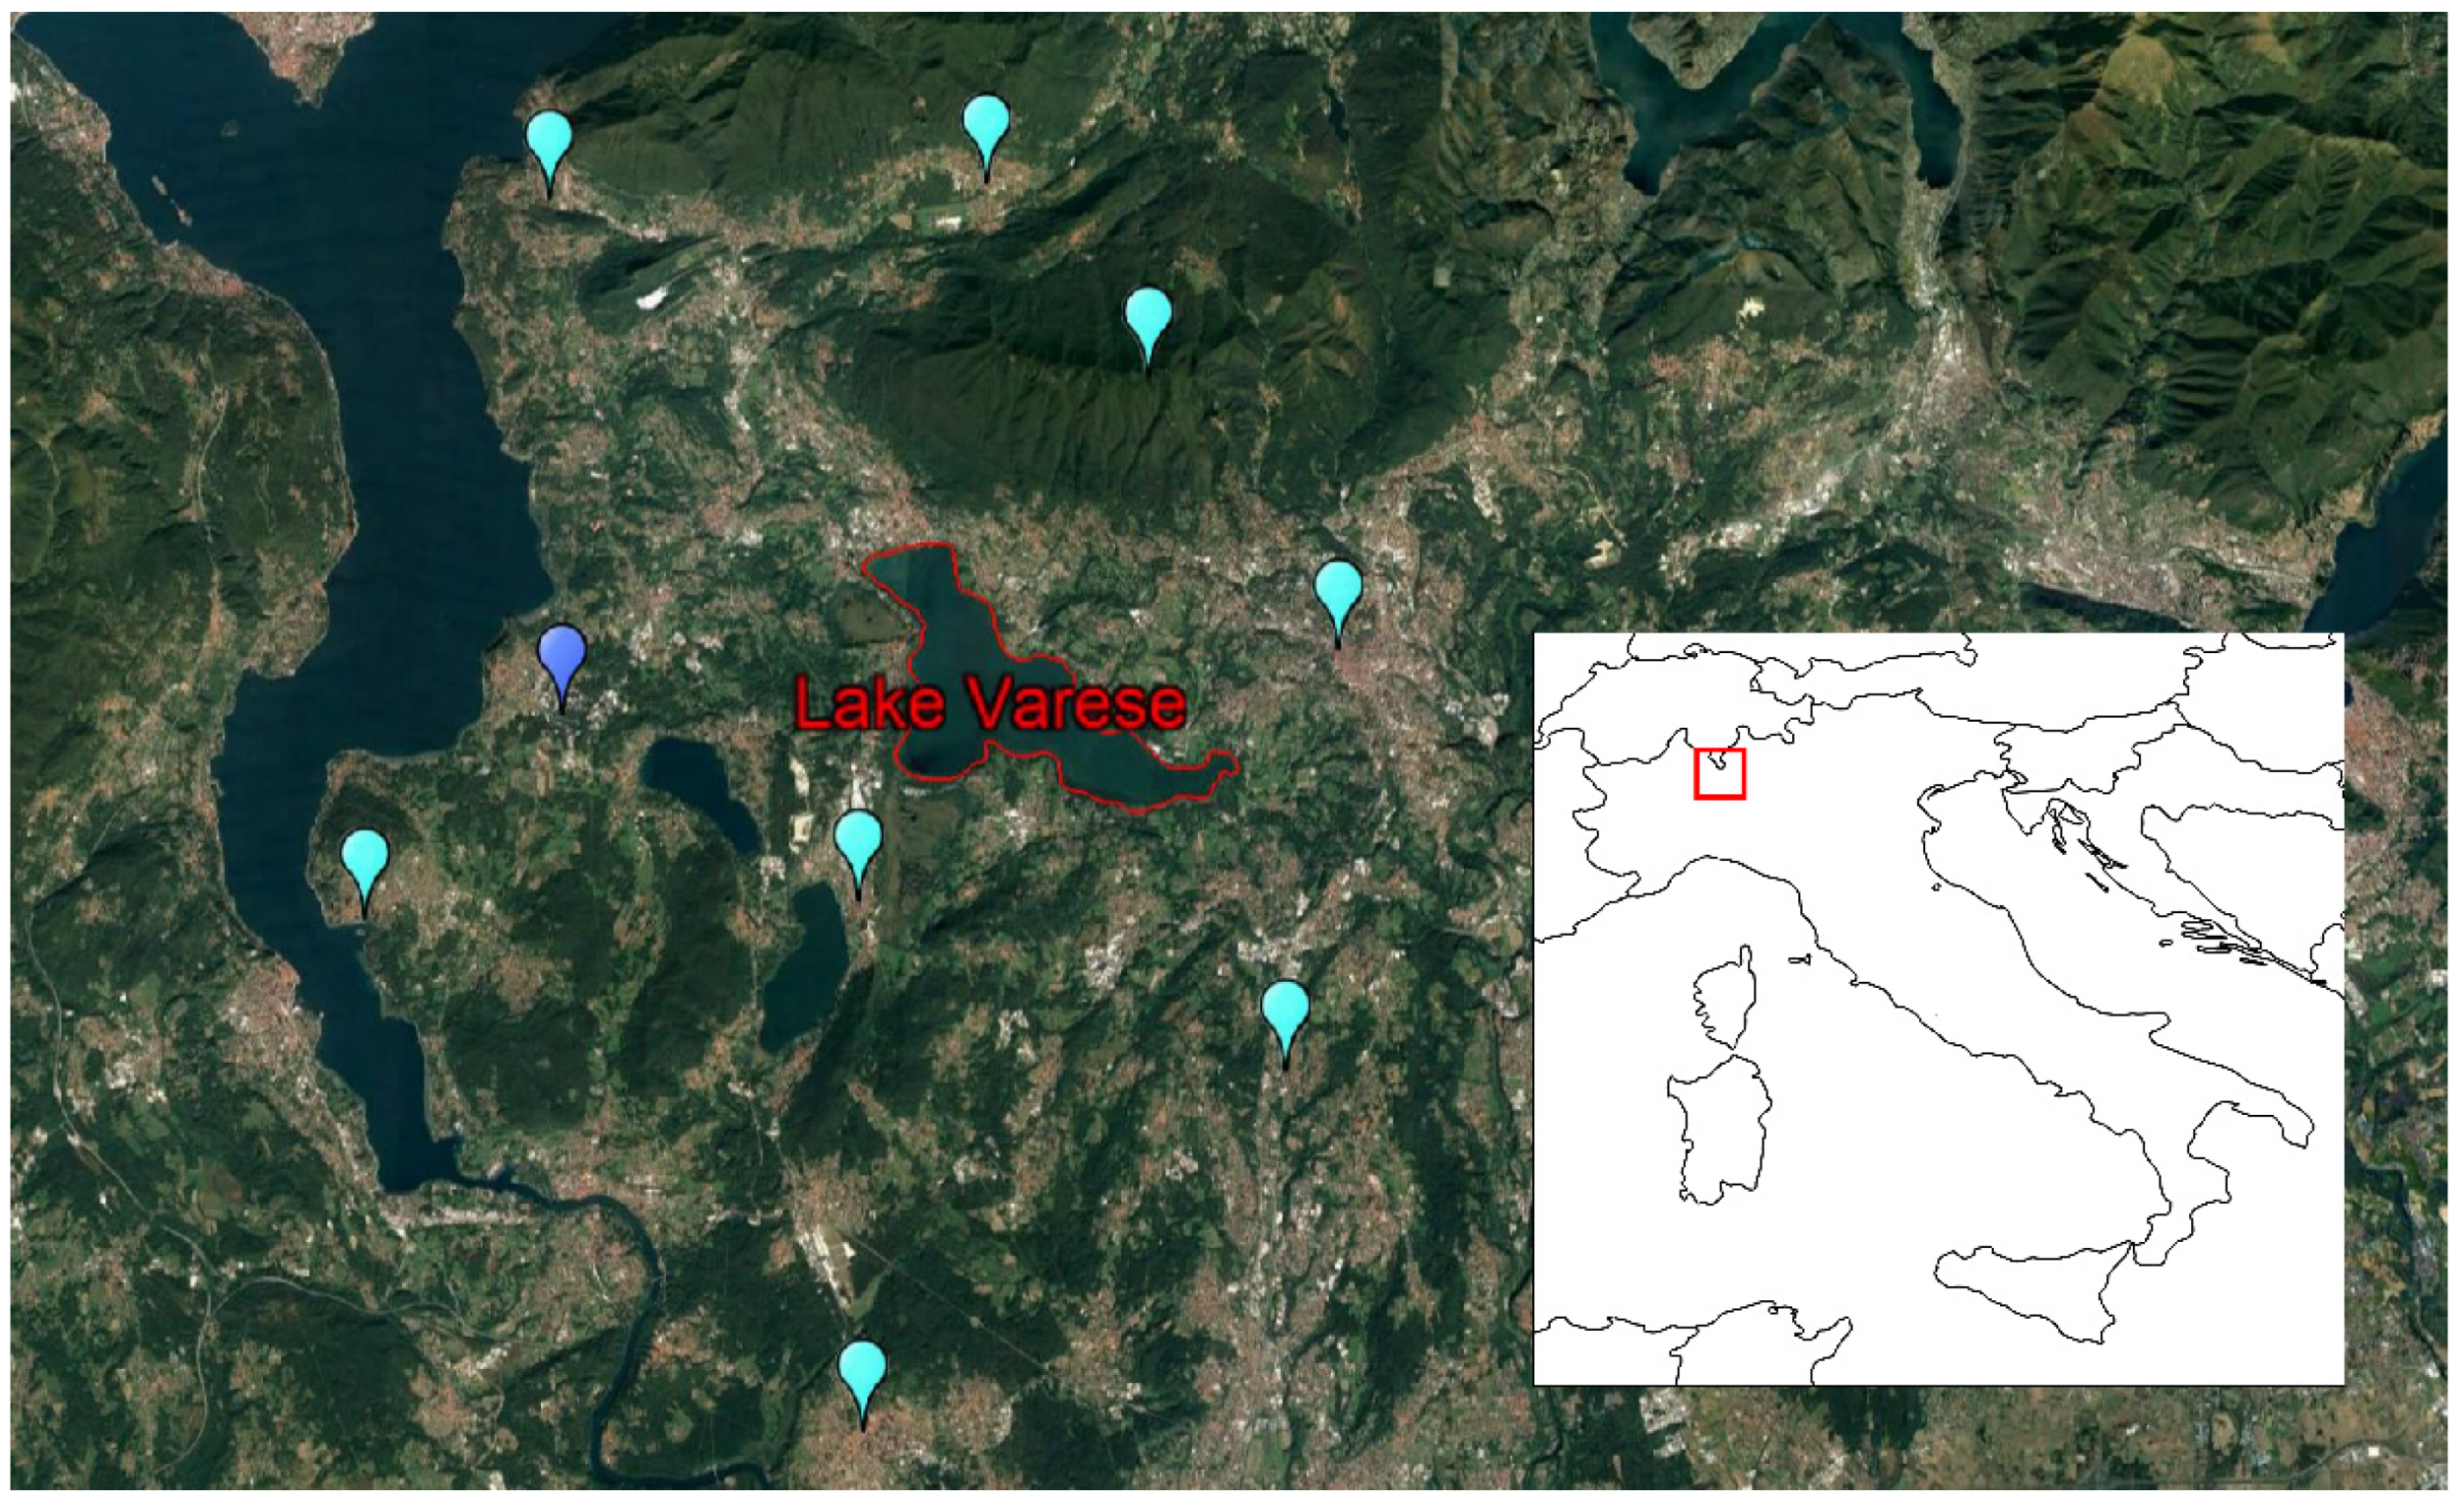
29]. Here, we aim to identify the most important and efficient predictor for cyanobacteria blooms in Lake Varese, an eutrophic lake in northern Italy and one of the first and most glaring examples of eutrophication in Europe [
30]. Initially classified as hypertrophic lake, following remedial actions aimed at reduction of the P loading, the lake is now in eutrophic status with bloom events occurring every year during the summer and early autumn. Lake Varese is “naturally productive” due to its morphometric characteristics and the geology of its drainage basin [
31]. However, the further increase of human activities in the area accelerated the degradation of its water quality. The analysis of carotenoid stratigraphy of the sediments showed also that some phytoplanktonic groups are particularly well adapted in environments with high organic content.
The first signals of summer anoxia in the Lake were documented in 1957 and the fishery activities ended in 1975 [
32]. Albeit, many studies testified the deterioration of the water quality, phytoplankton studies in Lake Varese were carried out only occasionally [
33]. The first detailed analysis dates back to 1979 [
34] and ten years later a further comprehensive study [
35] showed that the eutrophication process was not showing any sign of reversion, and that the P release from sediments is a major factor constraining the recovery of lake ecosystems [
36].
In this study, we firstly analyzed the cyanobacteria community with a detailed ten-year picture of the dynamic composition. We further explored the possible role of chemical and physical parameters triggering cyanobacteria blooms, introducing a novel approach to find possible relationships between meteorological data, lake stratification, and cyanobacteria abundance. We developed a simple approach that can be applied to other lakes using relatively few data and weather forecast data to put in place an early warning system for cyanobacteria blooms.
4. Discussion
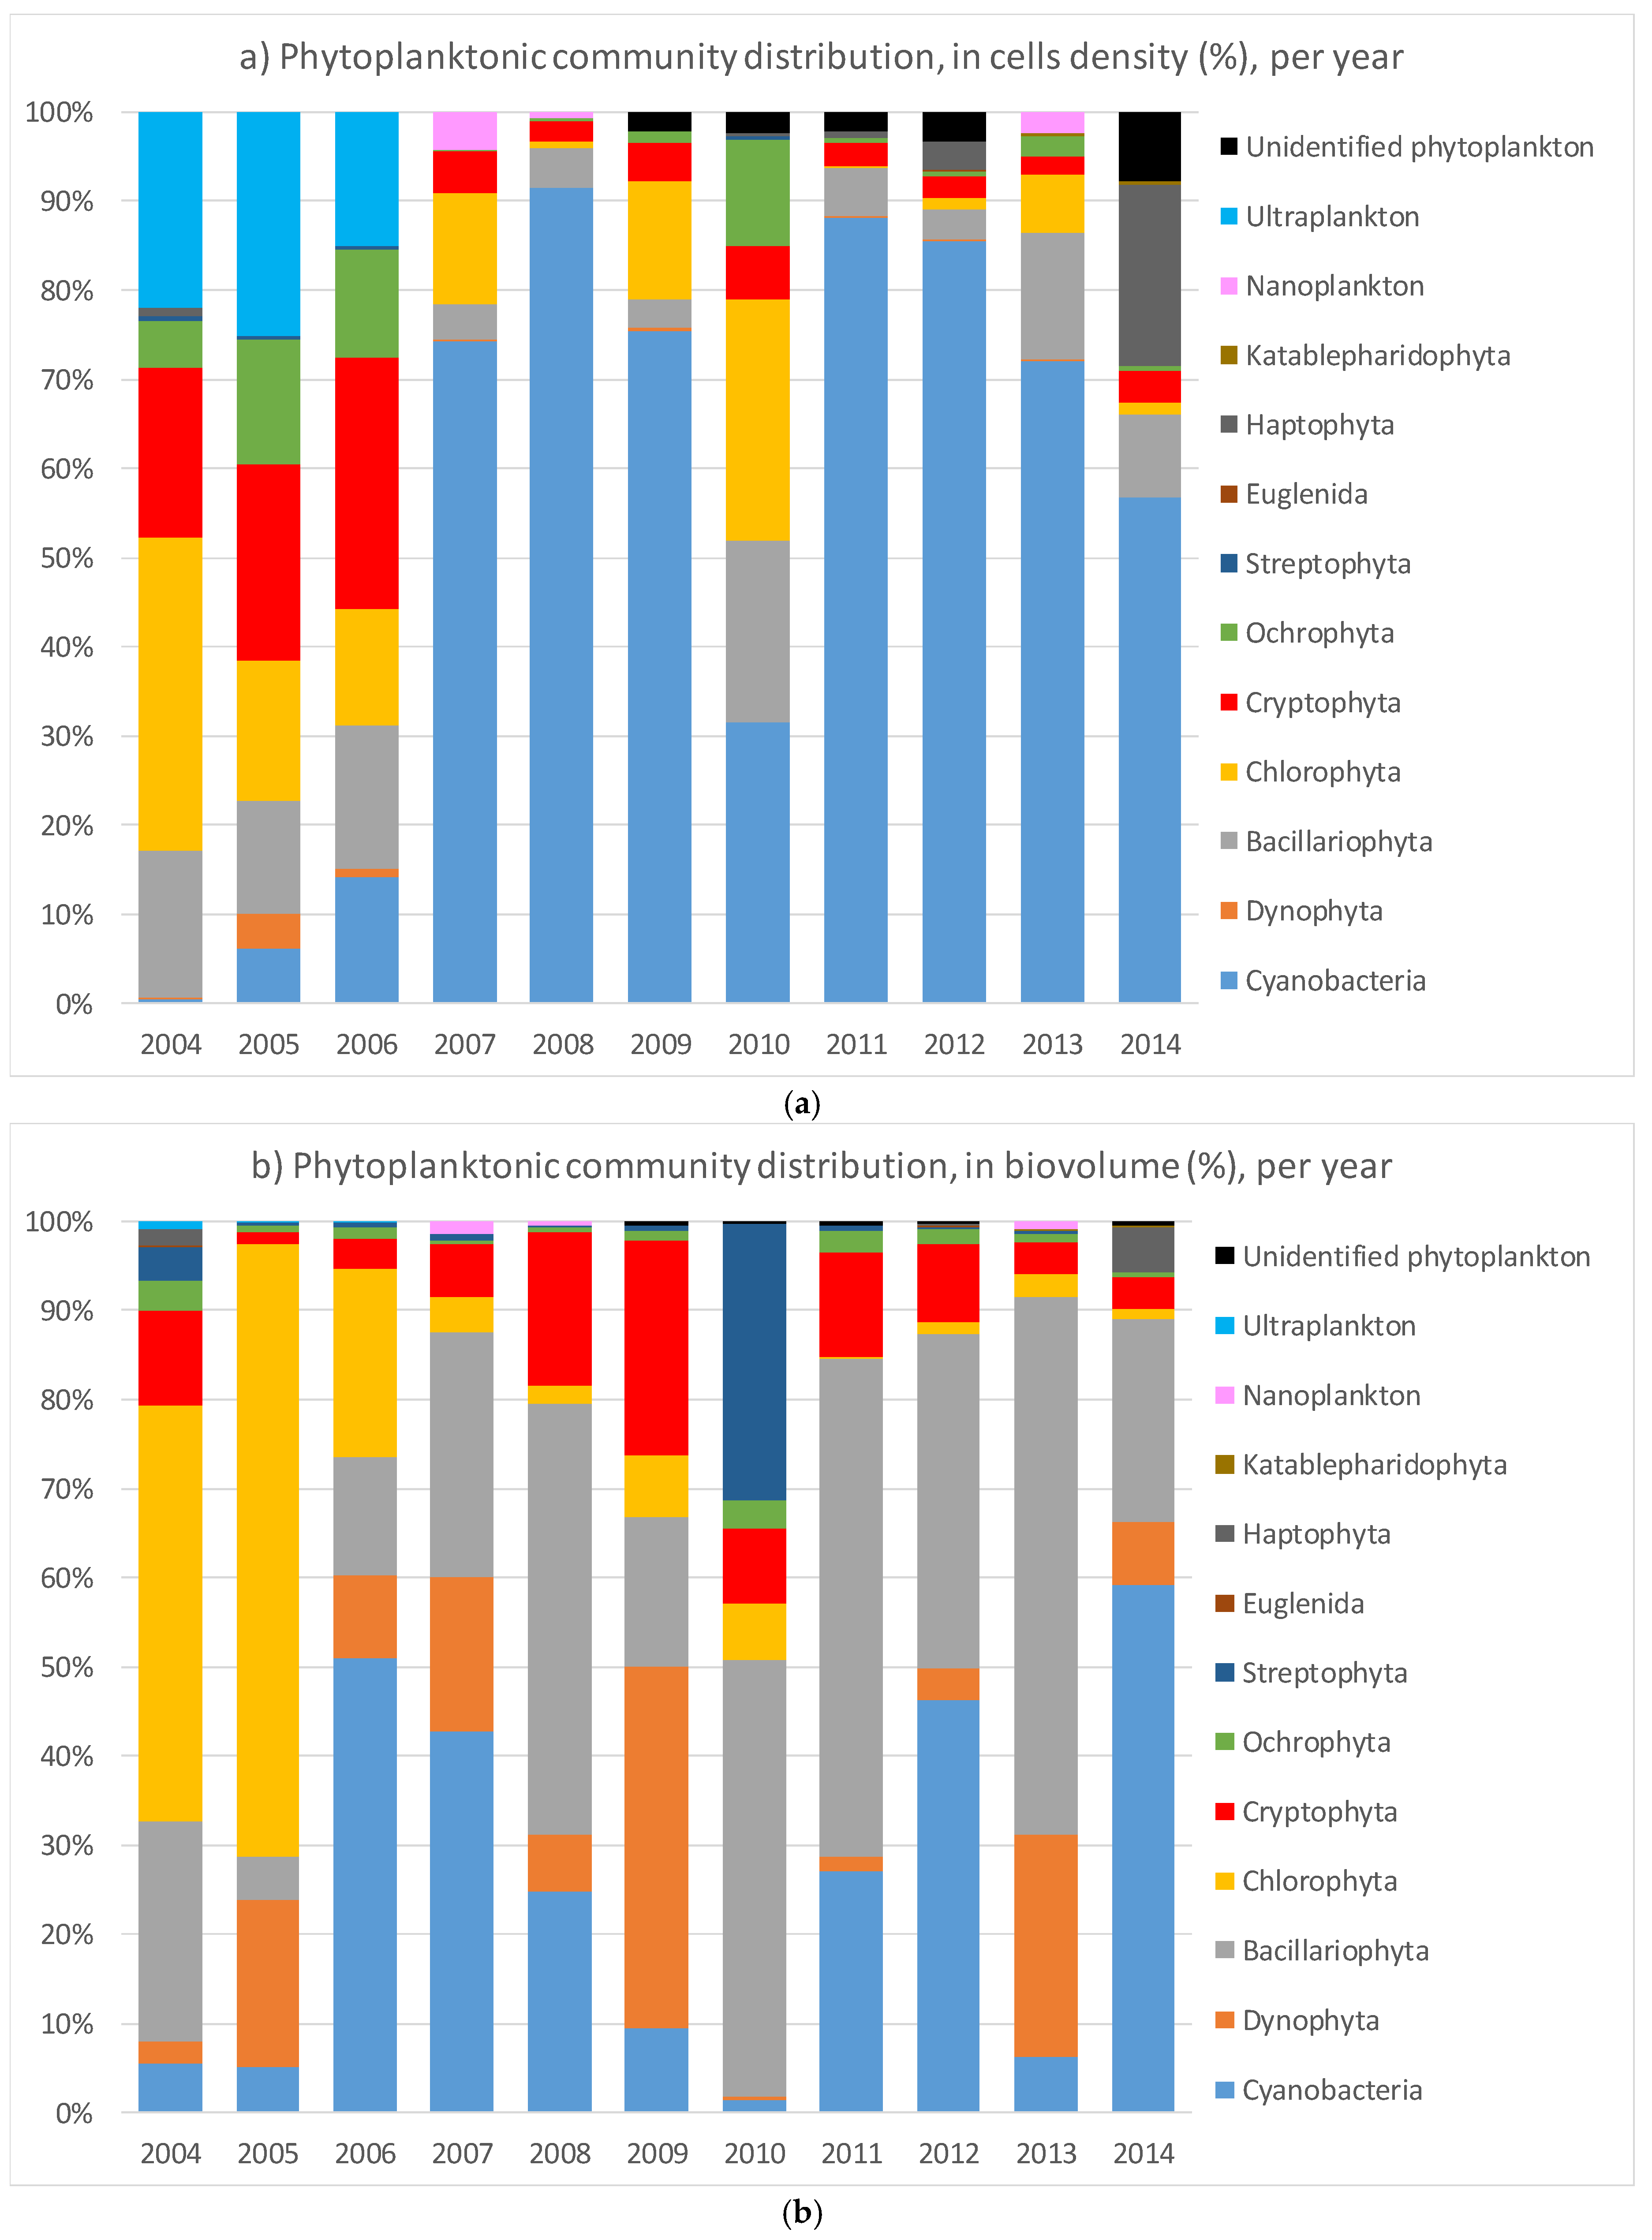
The aim of this study was to analyze the temporal patterns in cyanobacteria dominance in Lake Varese over a period of ten years (2004–2014) and to investigate the possibility to predict their abundance as a function of a set of meteorological data and water physical–chemical parameters. Overall, the picture of the phytoplankton community showed a change from 2006 with an increase of the cyanobacterial cells that accounted for more than the 50% of the total community, except in 2010. The community shift was also observed by the biovolume distribution, however, not so strongly dominated by the cyanobacteria particularly in 2008 and 2009 where the main contribution was due to the Bacillariophyta and Dynophyta, respectively as confirmed also by the other studies [
50]. The different distribution in 2010 could be explained by a pilot study performed in 2009 to reduce the Phosphorus (P) loading by applying a lanthanum-modified bentonite clay to bind the P [
32]. The authors showed a sharp reduction (more than 80%) of the P concentrations along the water column during 2009–2010 which may be the consequence of the dropped concentration of the cyanobacteria. However, the trend seems to be reverted with an increase of the cyanobacteria during the 2011–2014 years (
Figure 2).
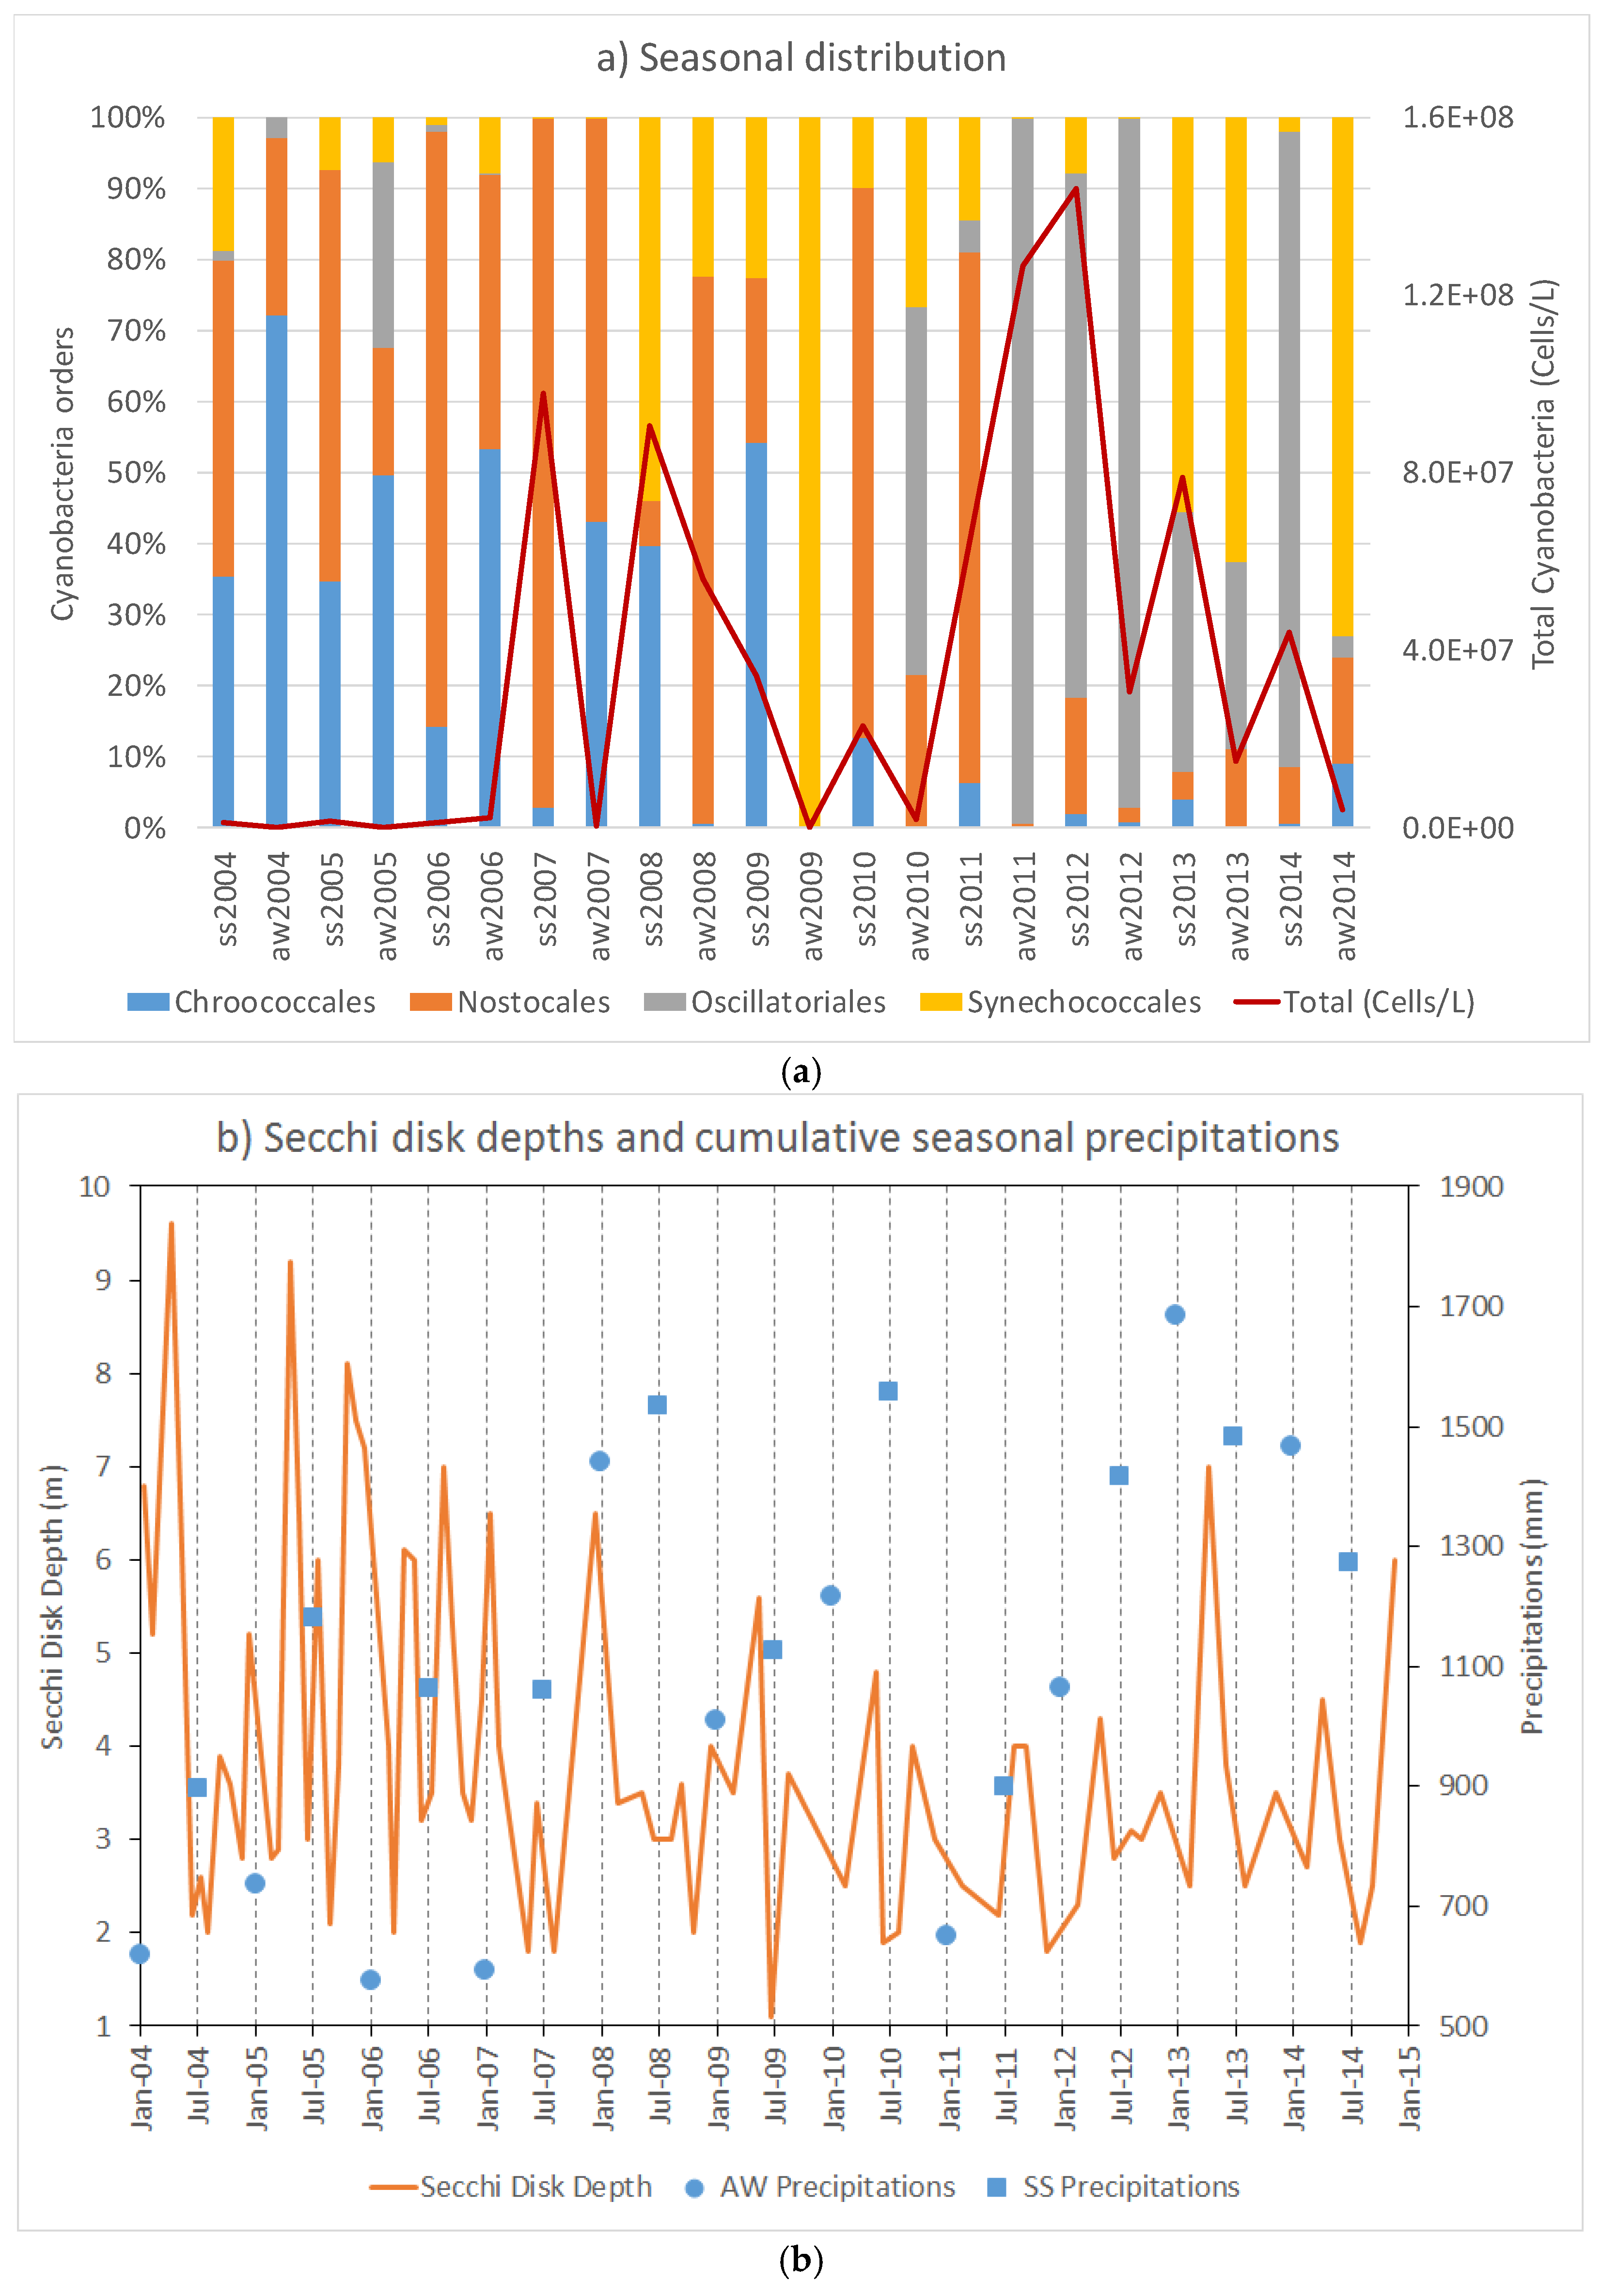
The cyanobacteria composition showed two distinct dominances; Chroococcales/Nostocales were mainly detected in the period from 2004 to 2009, while Oscillatoriales/Synechoccoccales increased after the 2010. In temperate regions, Oscillatoriales and most Chroococcales are associated with the increasing of temperature and water column stability; Nostocales, without the potential to fix nitrogen (Aphanizomenon), are associated with increasing TP concentration, while Synechoccoccales dominance is influenced by lower temperatures and water stability [
4]. We could not have a clear picture of the dynamic distribution due to scarce periodicity of the sampling which would lead to a misinterpretation. After 2010, we observed an increase of the precipitation which may influence the shifting, however, Oscillatoriales have been reported to often dominate shallow polymictic eutrophic lakes showing cyclic successions between Microcystis (Chroococcales) and Planktothrix (Oscillatoriales). To get insight to the cyanobacterial biodiversity and spatio-temporal dynamic changes, it would need more frequent samplings such as weekly combined with the microscopy analysis and the metagenomics technique which allows a more deep analysis by sequencing the whole community (microbiome).
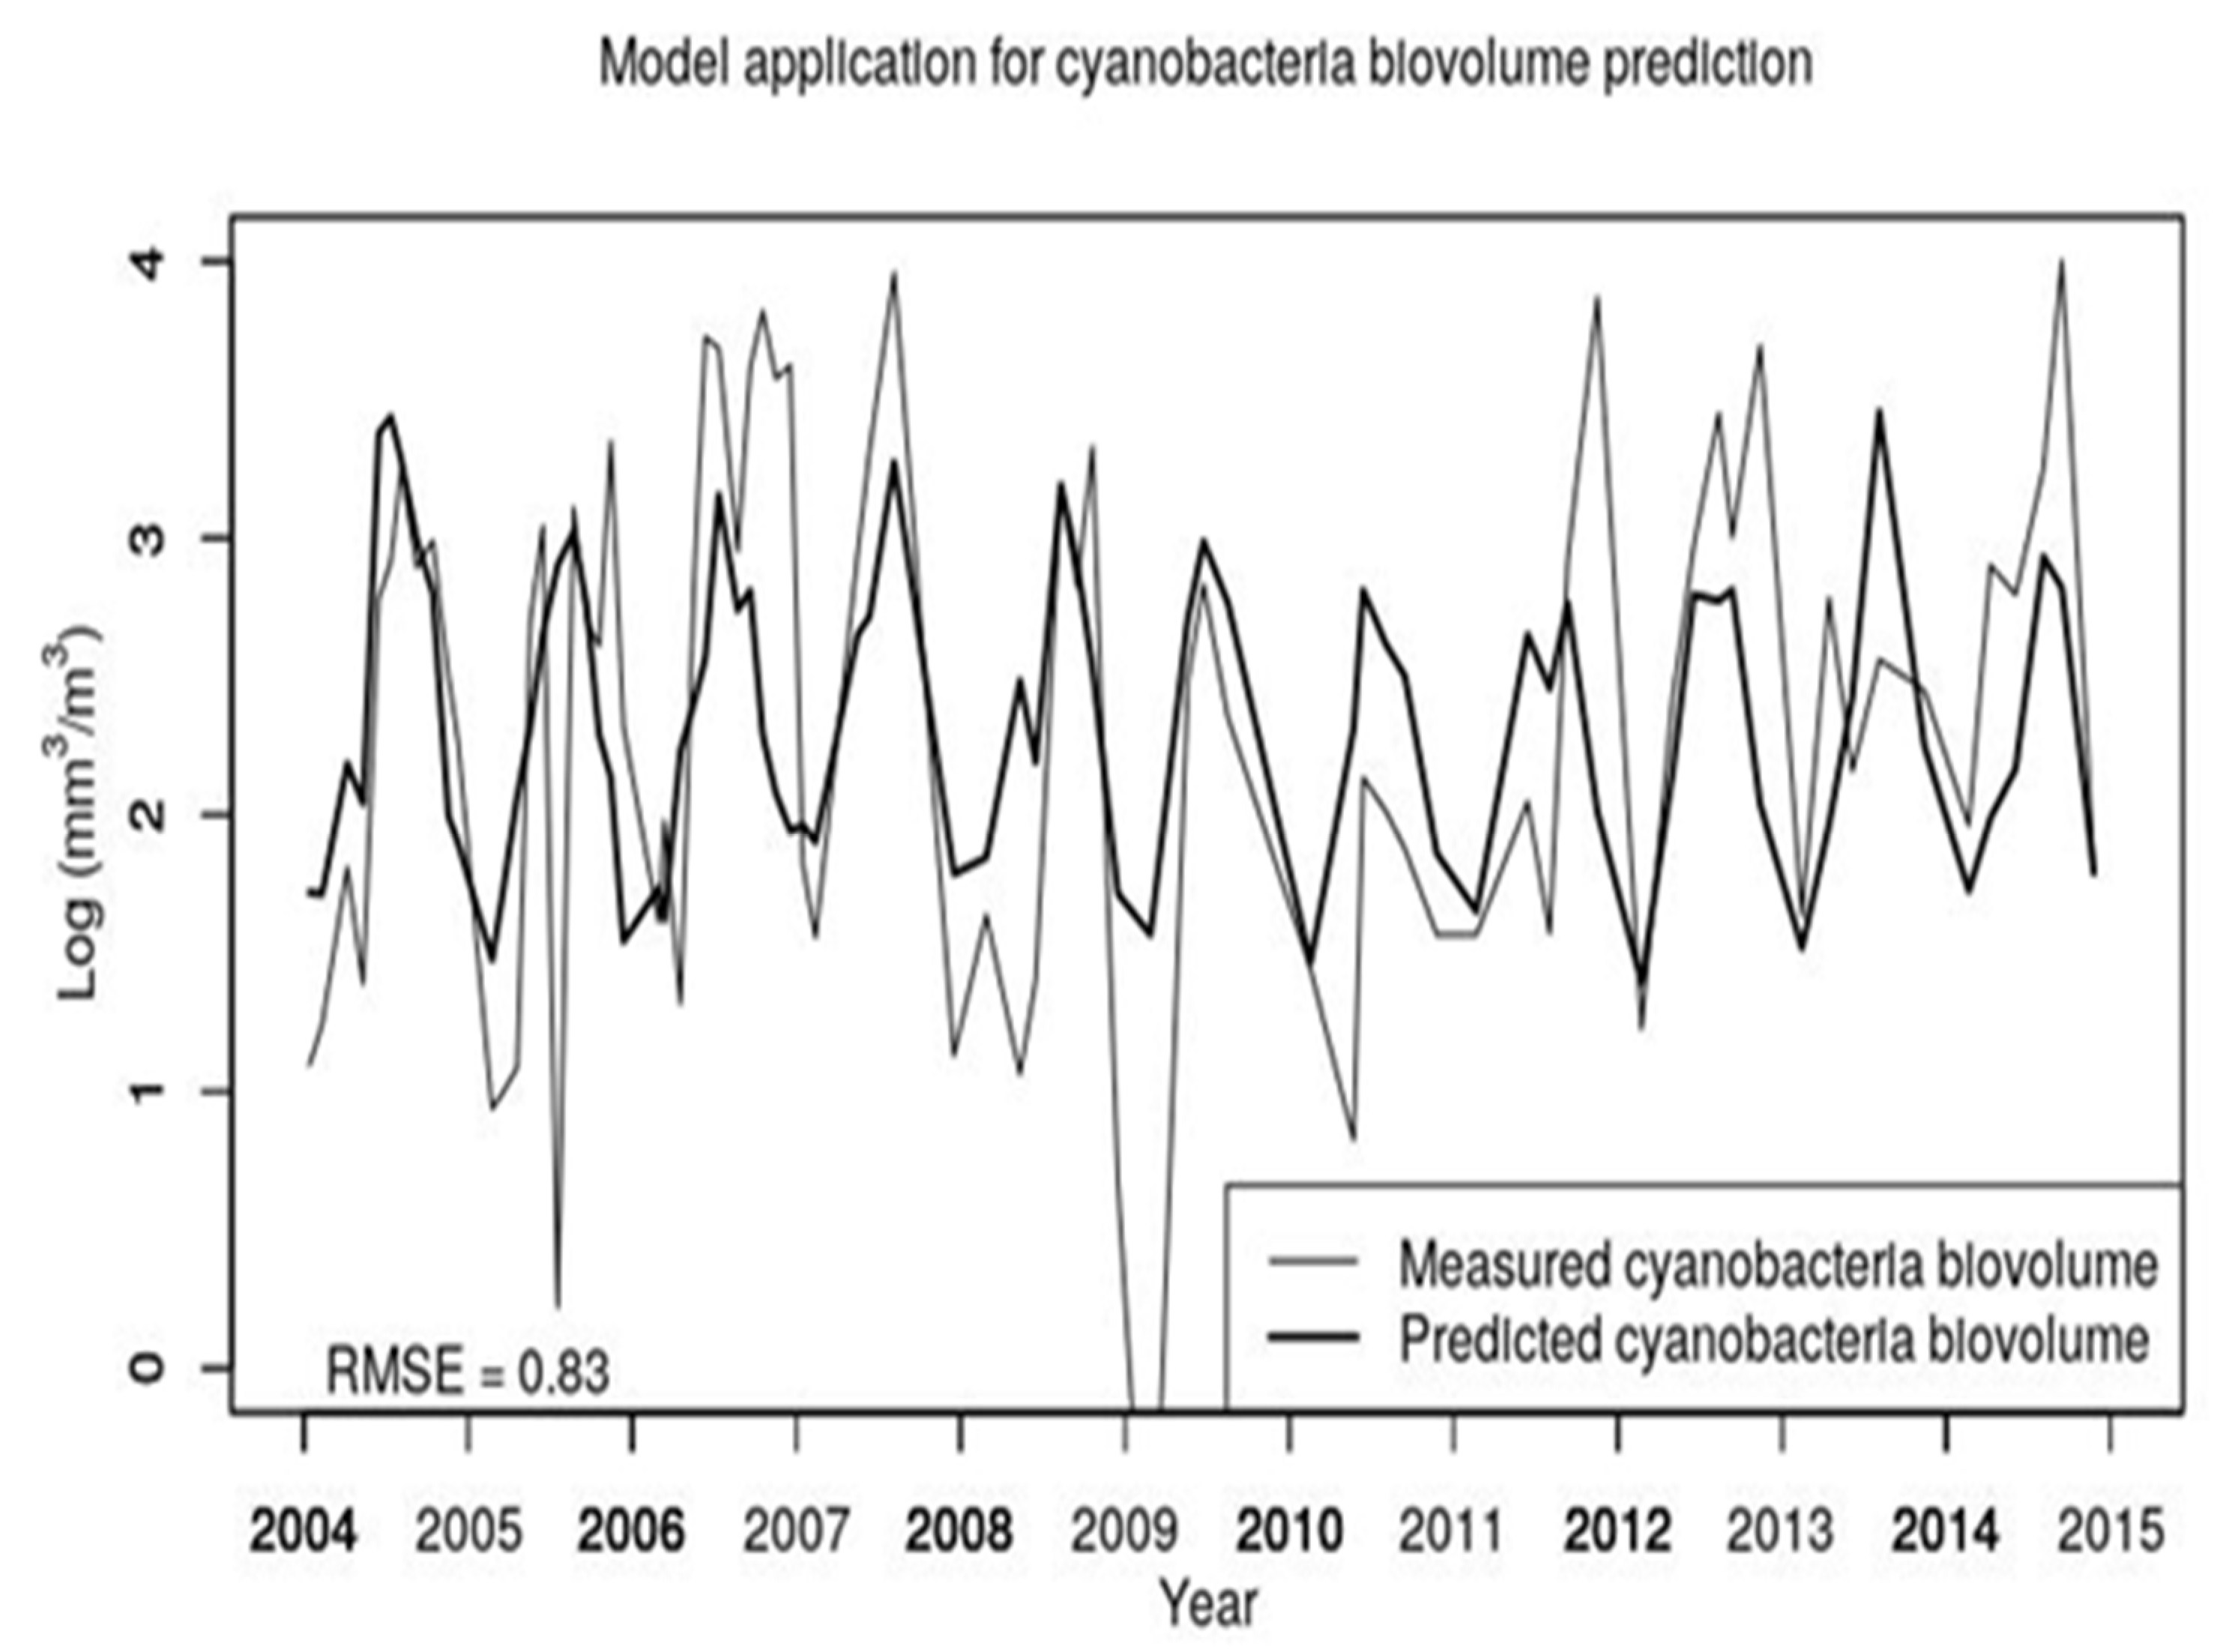
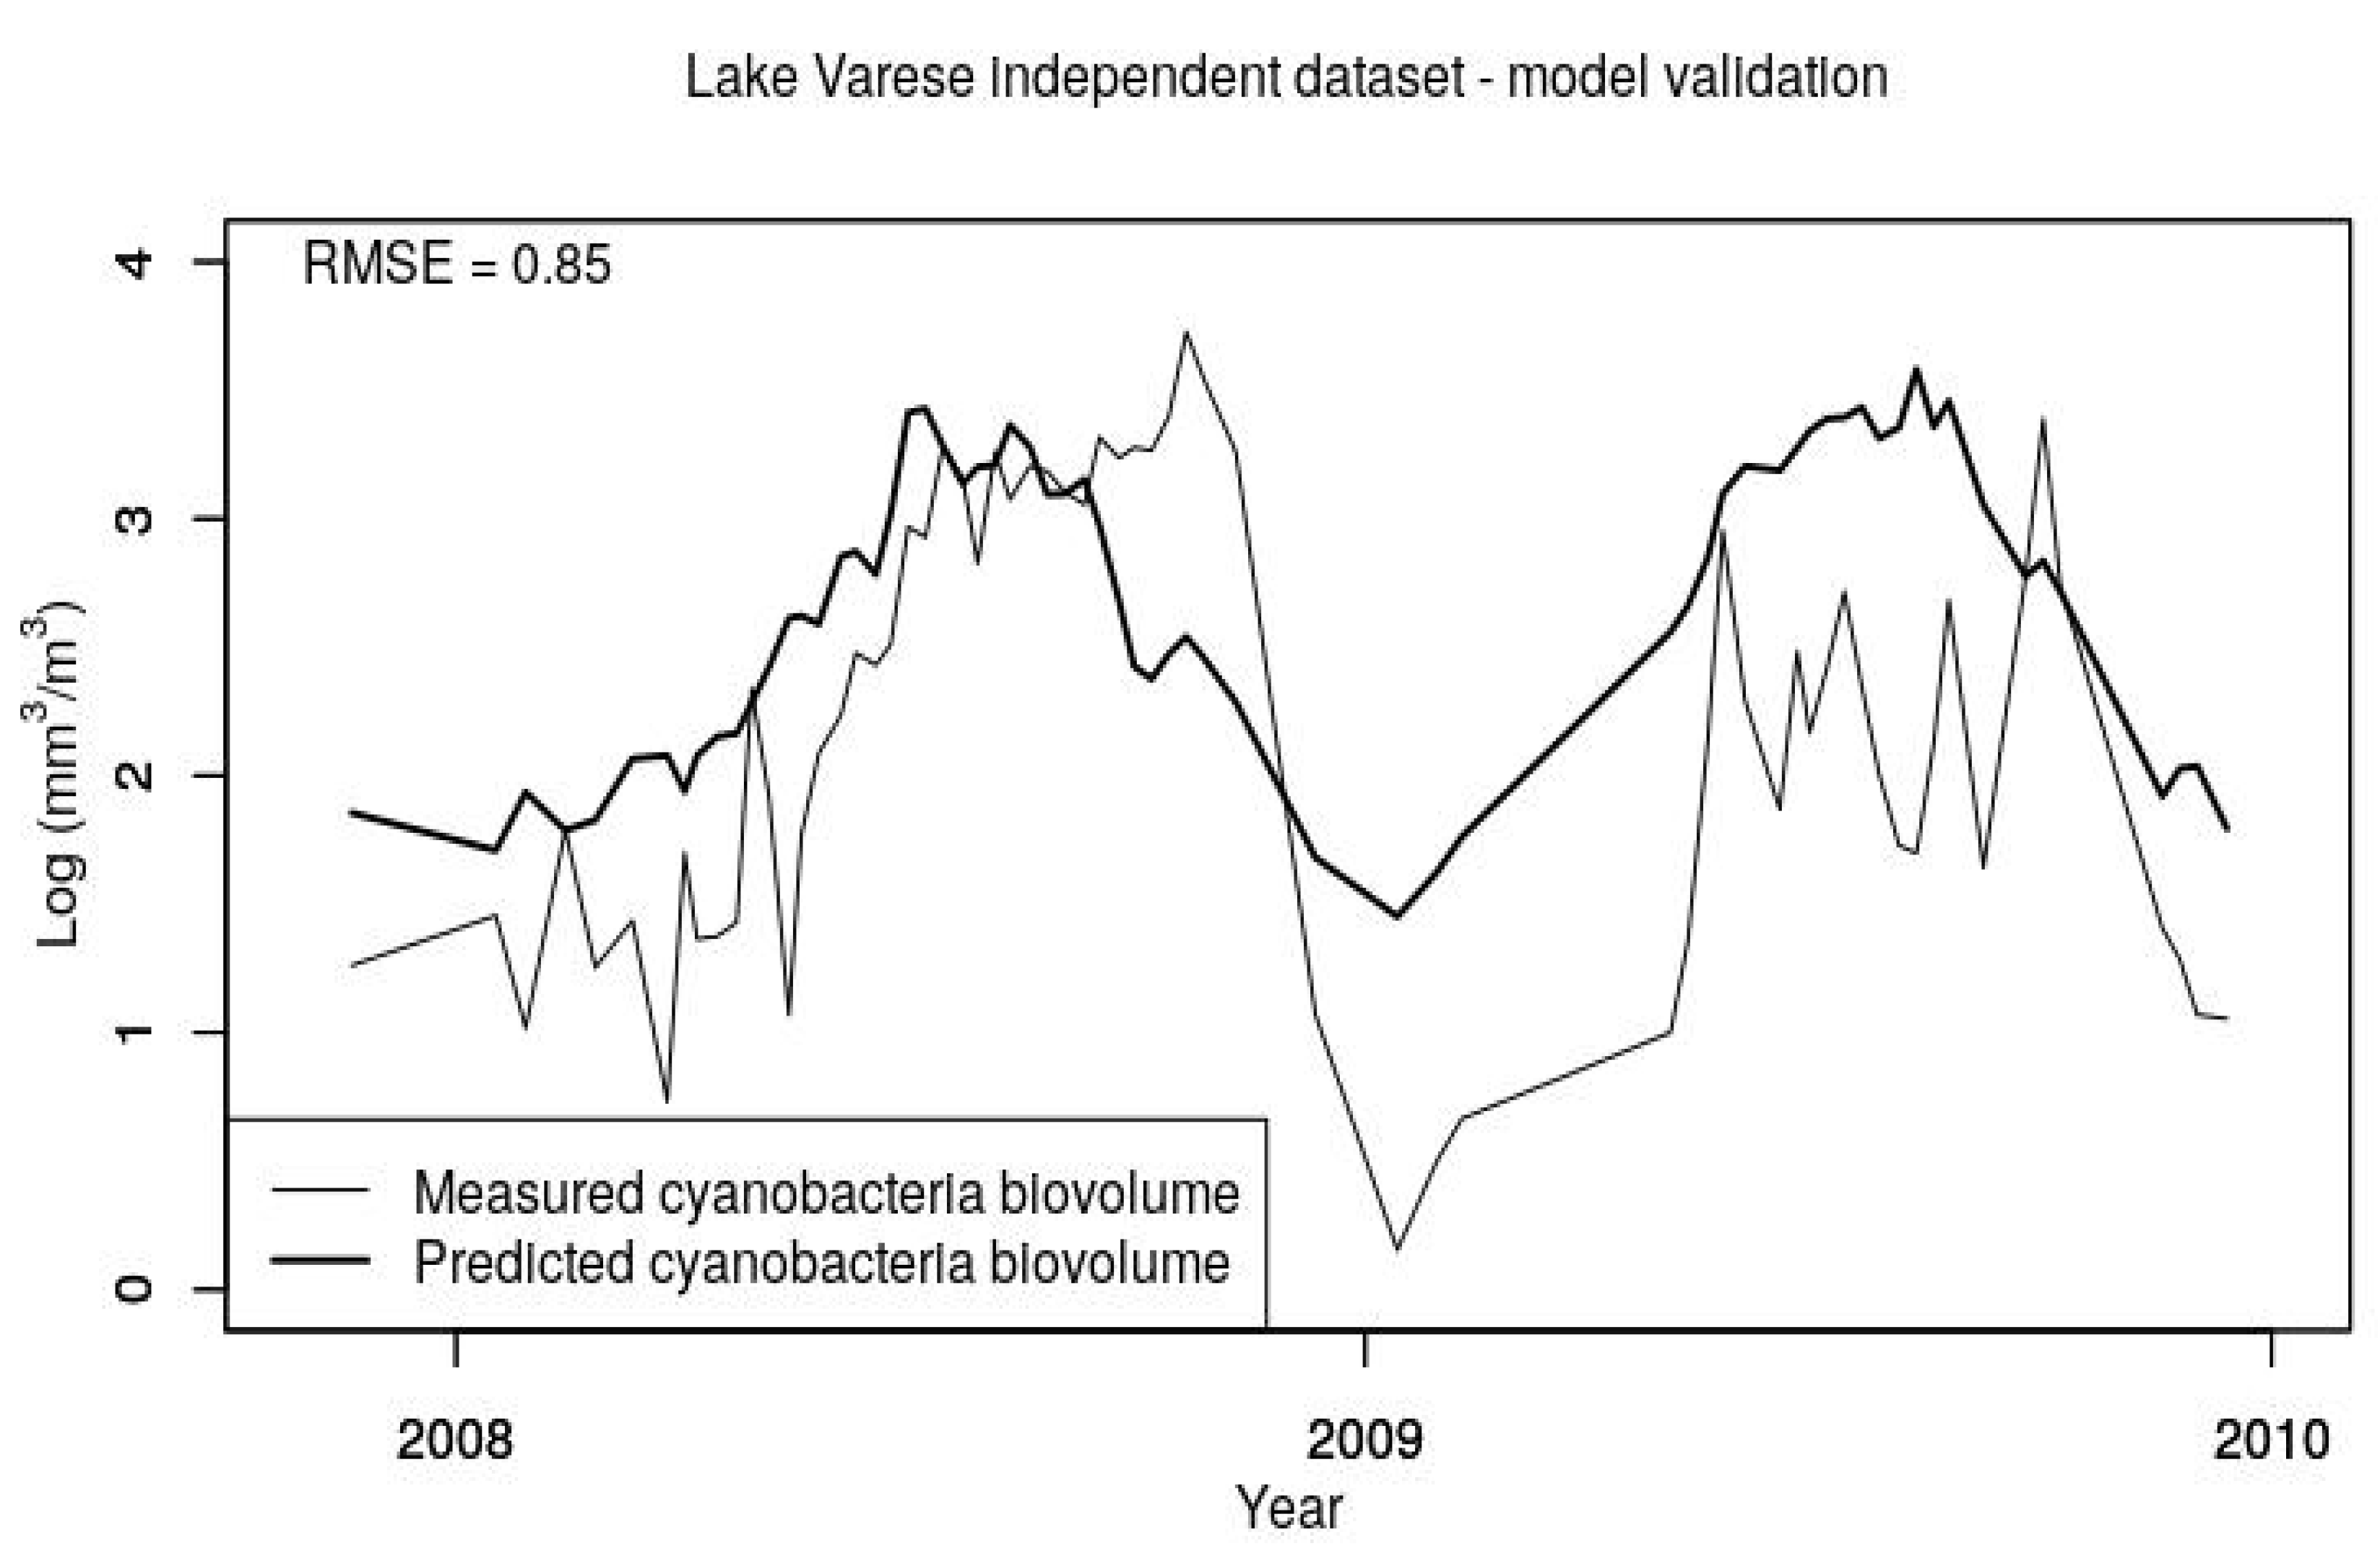
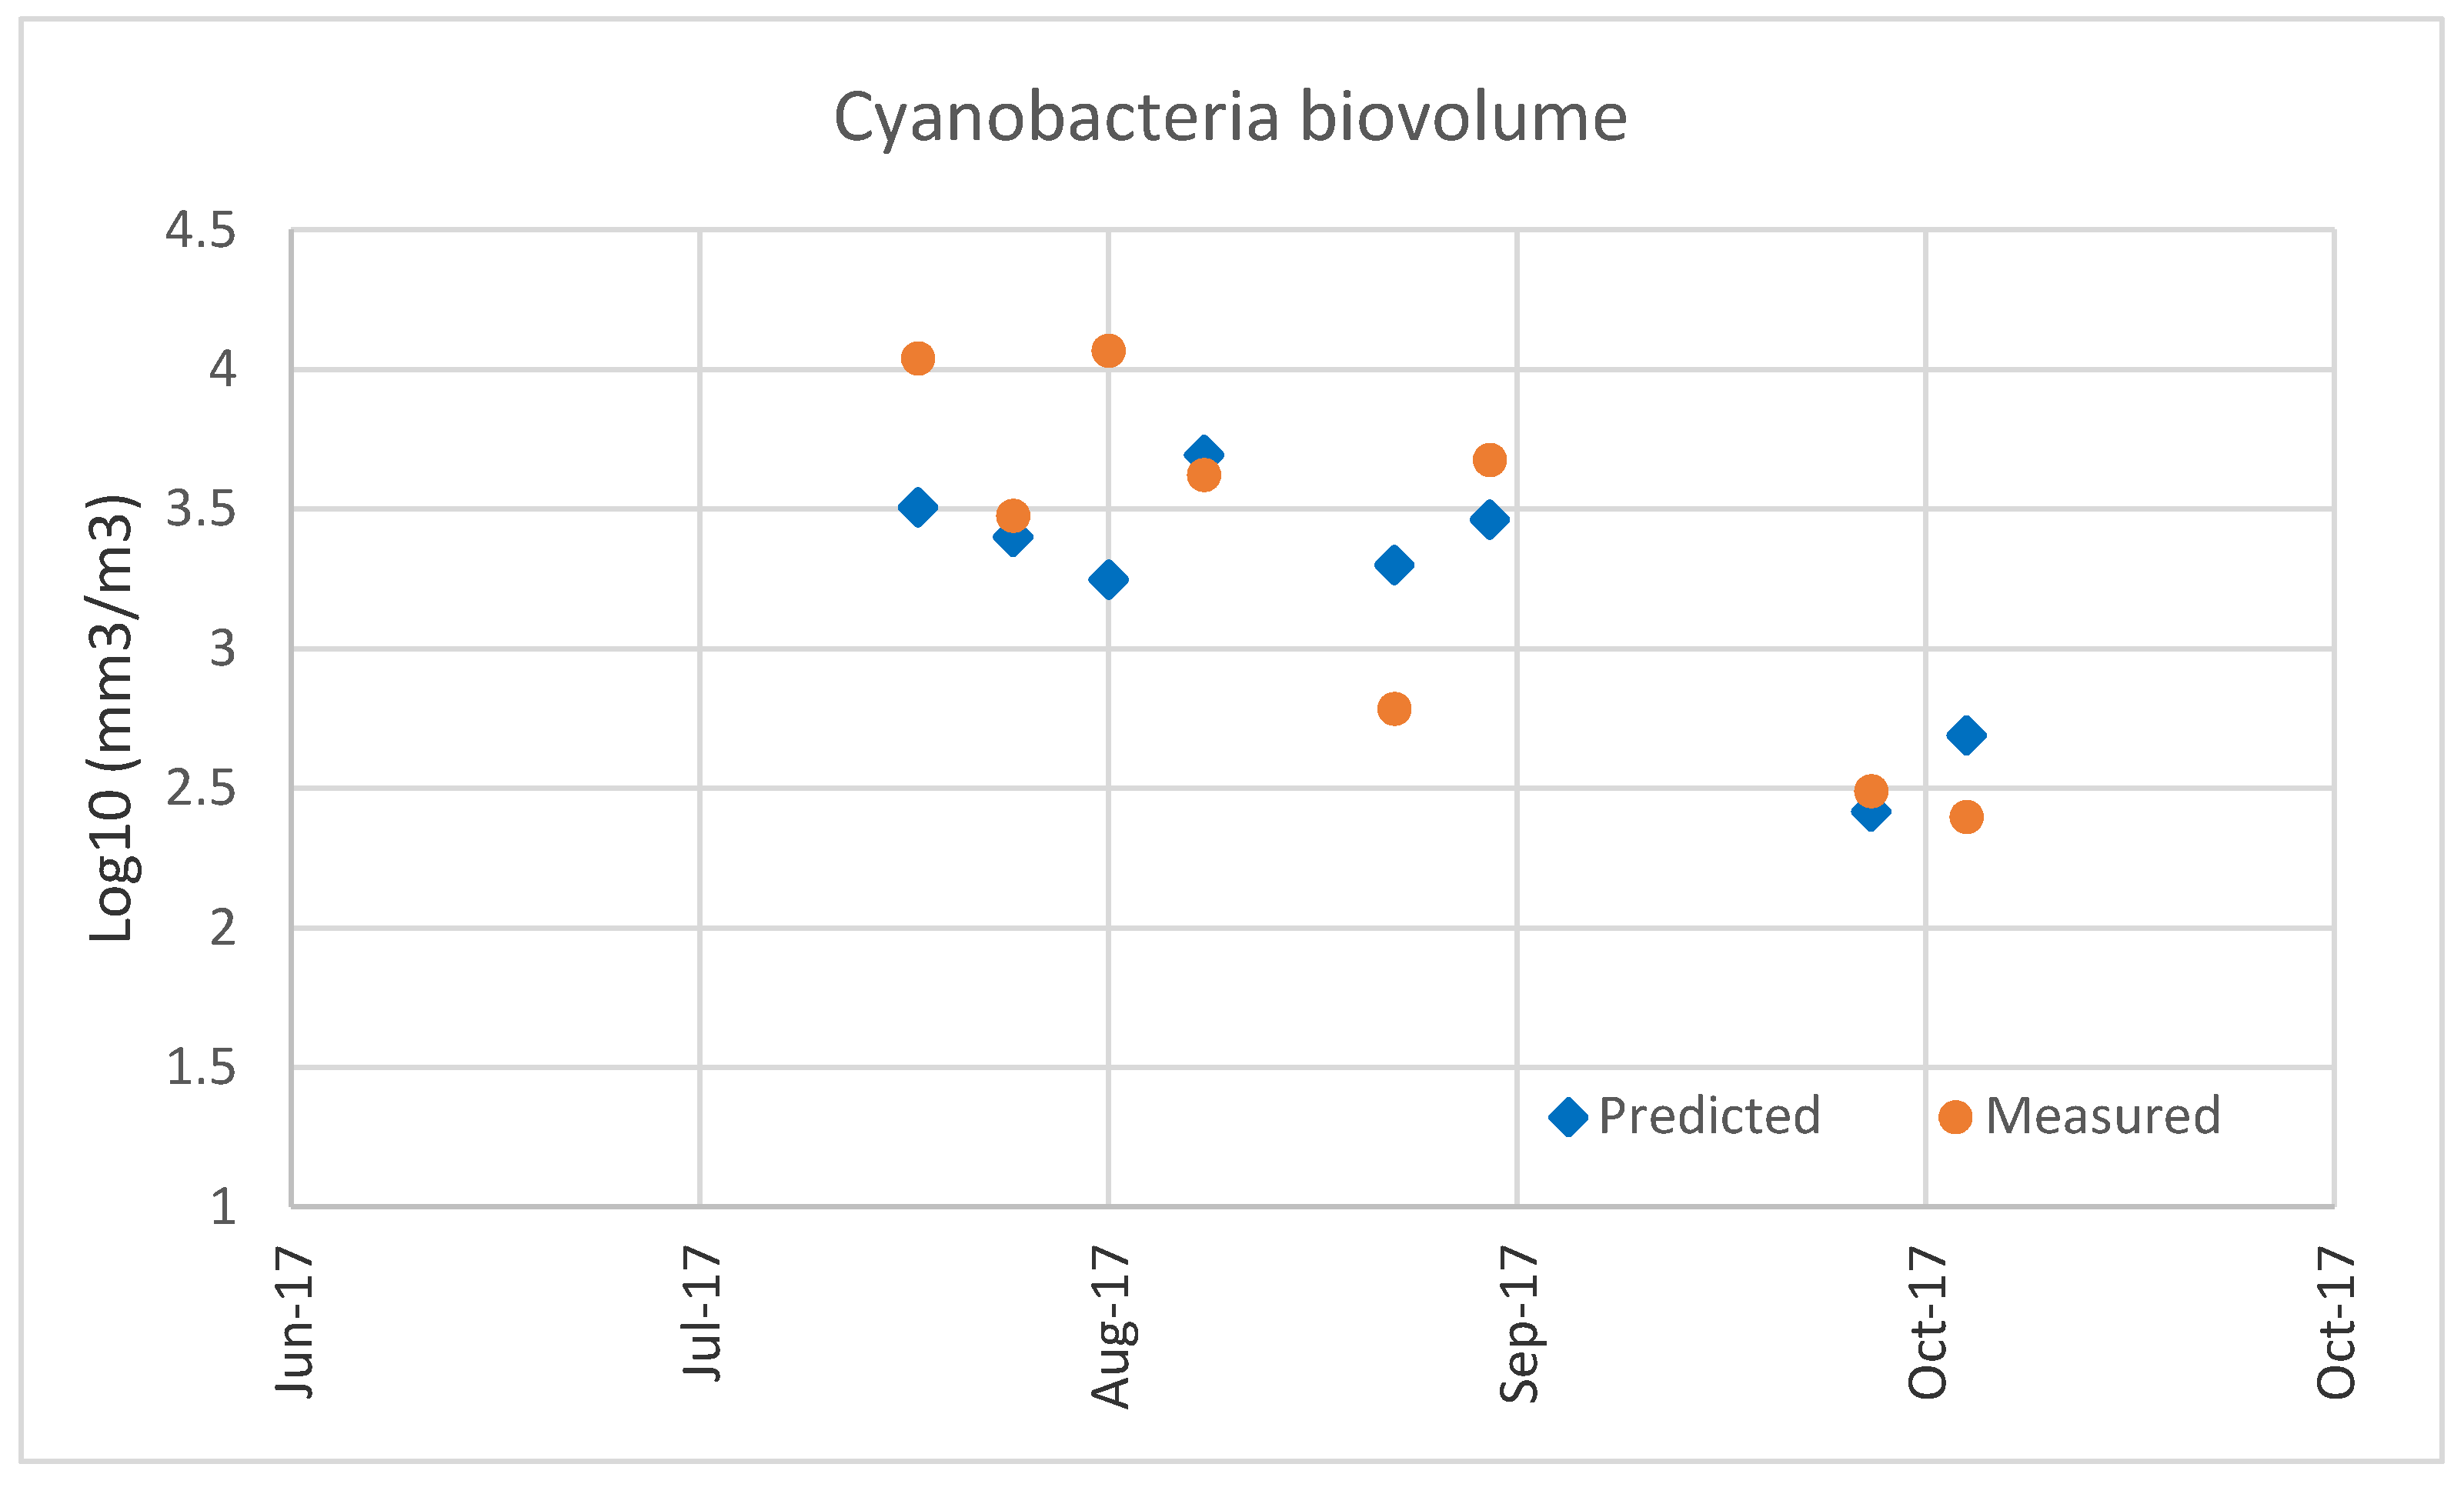
In the modeling studies, we did an attempt to develop an ANN using our data, but it resulted in an overfitted model while the selected MLR with just two predictors suggests that a general relationship has been captured as also confirmed by the validation step (see
Figure 6), further supporting the robustness of the model as an accepted predictor. In our studies, we did not use the cell density as parameter (although available for the data set as shown in
Figure 2) because the cell size can vary considerably within and between species, and toxin concentration relates more closely to the amount of dry matter in a sample than to the number of cells. In addition, cell identification by optical microscopy may underestimate the real value of cyanobacteria cells, indeed, smaller species may be (classified) reported as ultraplankton [
51]. Therefore, the biovolume was selected as a more appropriate parameter. Furthermore, the biovolume measurements require less time for the microscopic analysis than cell identification and enumeration providing data with lower uncertainties. The parameters selected in this work such as the water temperature, DO, nutrient availability, and the water transparency measured as SD, play a key role in the occurrence of cyanobacterial blooms [
19,
20,
22,
23,
26,
27,
52,
53,
54]. In addition to these factors known to be good predictors for cyanobacteria abundance, we tried to evaluate whether the air temperature could be considered as parameter. Indeed, air temperature is one of the main factors driving the evolution of water temperature in a lake [
55] and influencing as well the vertical temperature profile and lake stratification [
56], which are both important parameters for the occurrence of algal bloom outbreaks. In Lake Varese and generally in monomictic lakes, during spring, when air temperature rises, water stratification normally starts to build-up, stabilizes during summer until fall, when decreasing air temperatures break the stratification. Another factor which may lead to changes in water turbulence is the wind stress.
Taranu et al. has shown conflicting results on the response of cyanobacteria to climate and nutrients for dimictic (lakes that mix from top to bottom in two water mixing periods within a year) and polymictic lakes (mix from top to bottom for more than two water mixing periods) [
23]. In dimictic lakes the stronger predictor was water-column stability, while for polymictic lakes, was nutrients loading. Journey et al., focusing on two monomictic lakes (mix from top to bottom during one mixing period per year), found strong correlations between cyanobacterial biovolumes and water stratification, while an opposite relationship was found with the nutrient levels [
29]. In addition, it has been shown that the meteorological variables as air temperature, wind speed, and relative humidity, could be drivers of hypolimnetic anoxia, which is an indirect consequence of thermal stratification [
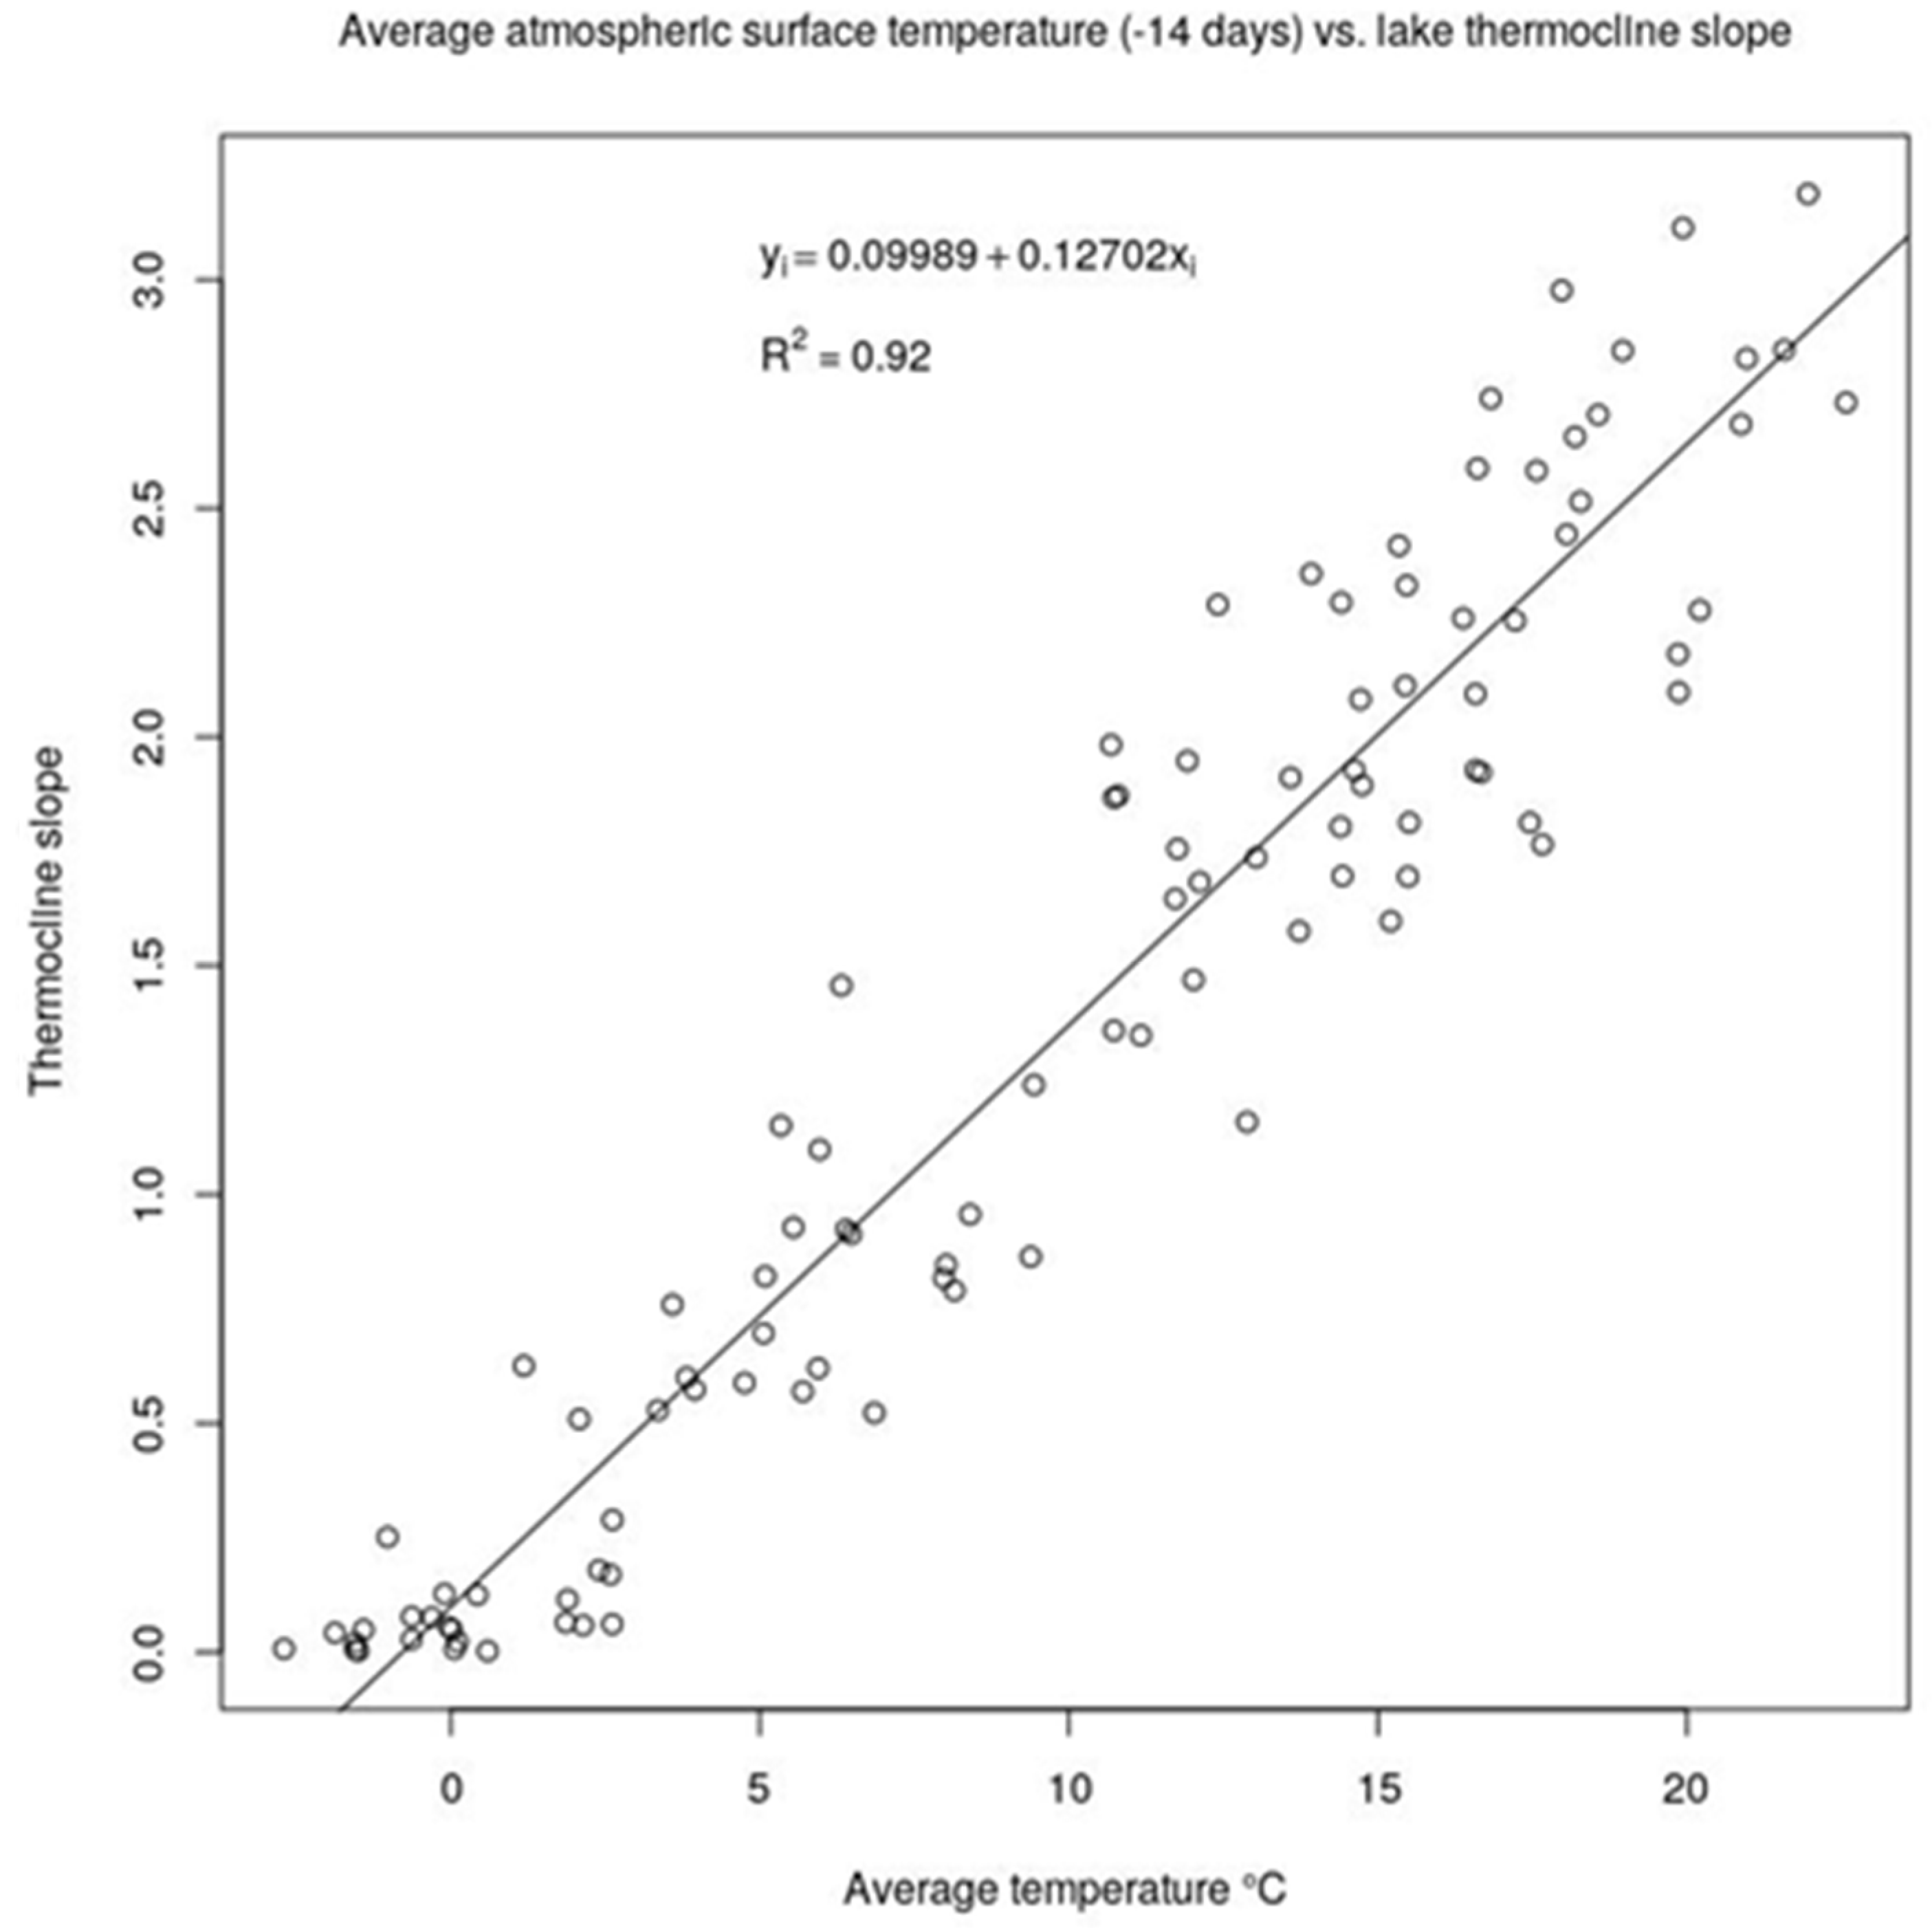
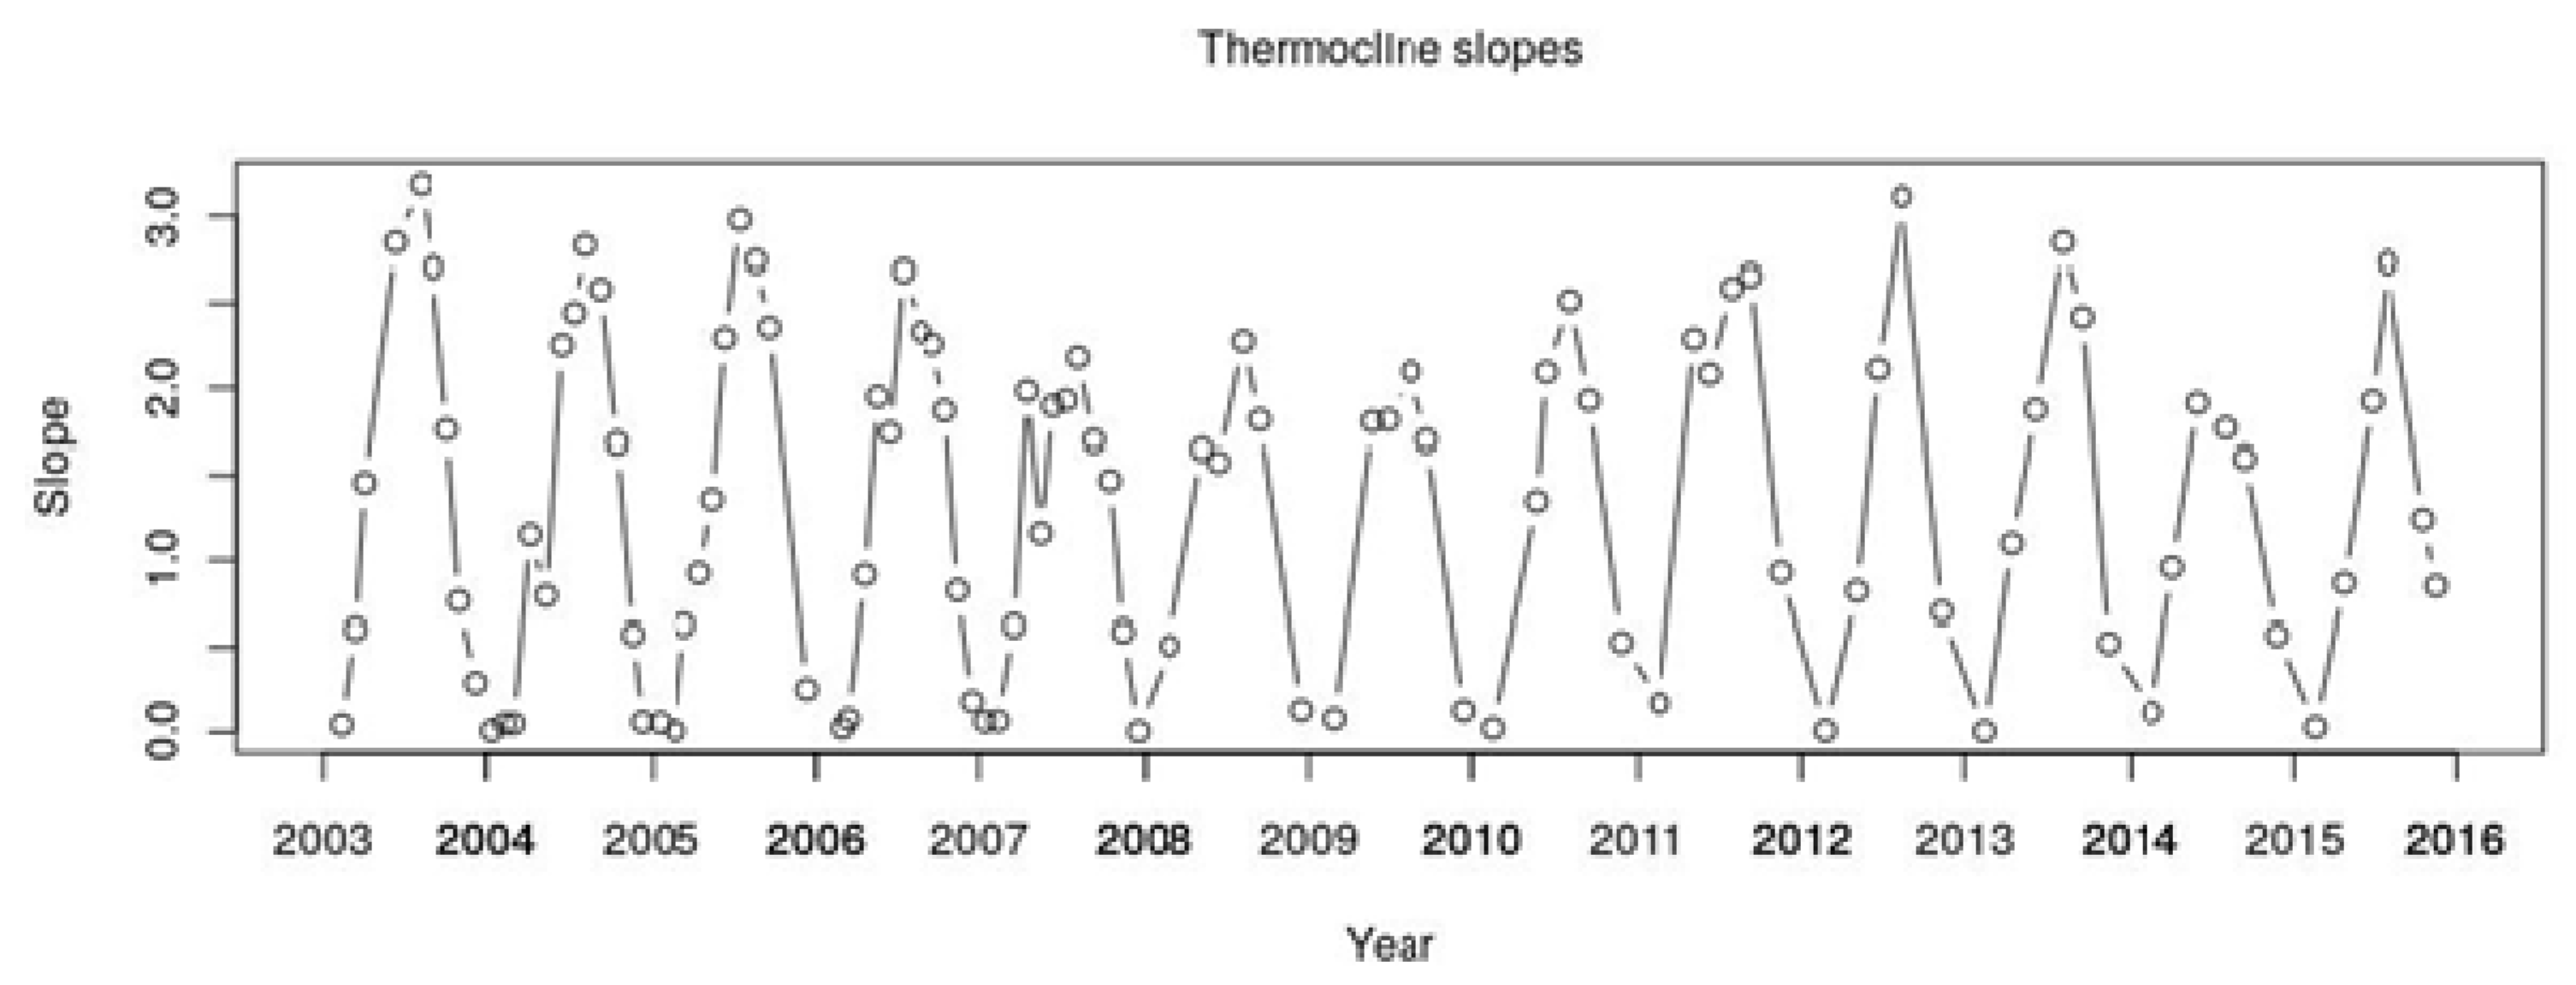
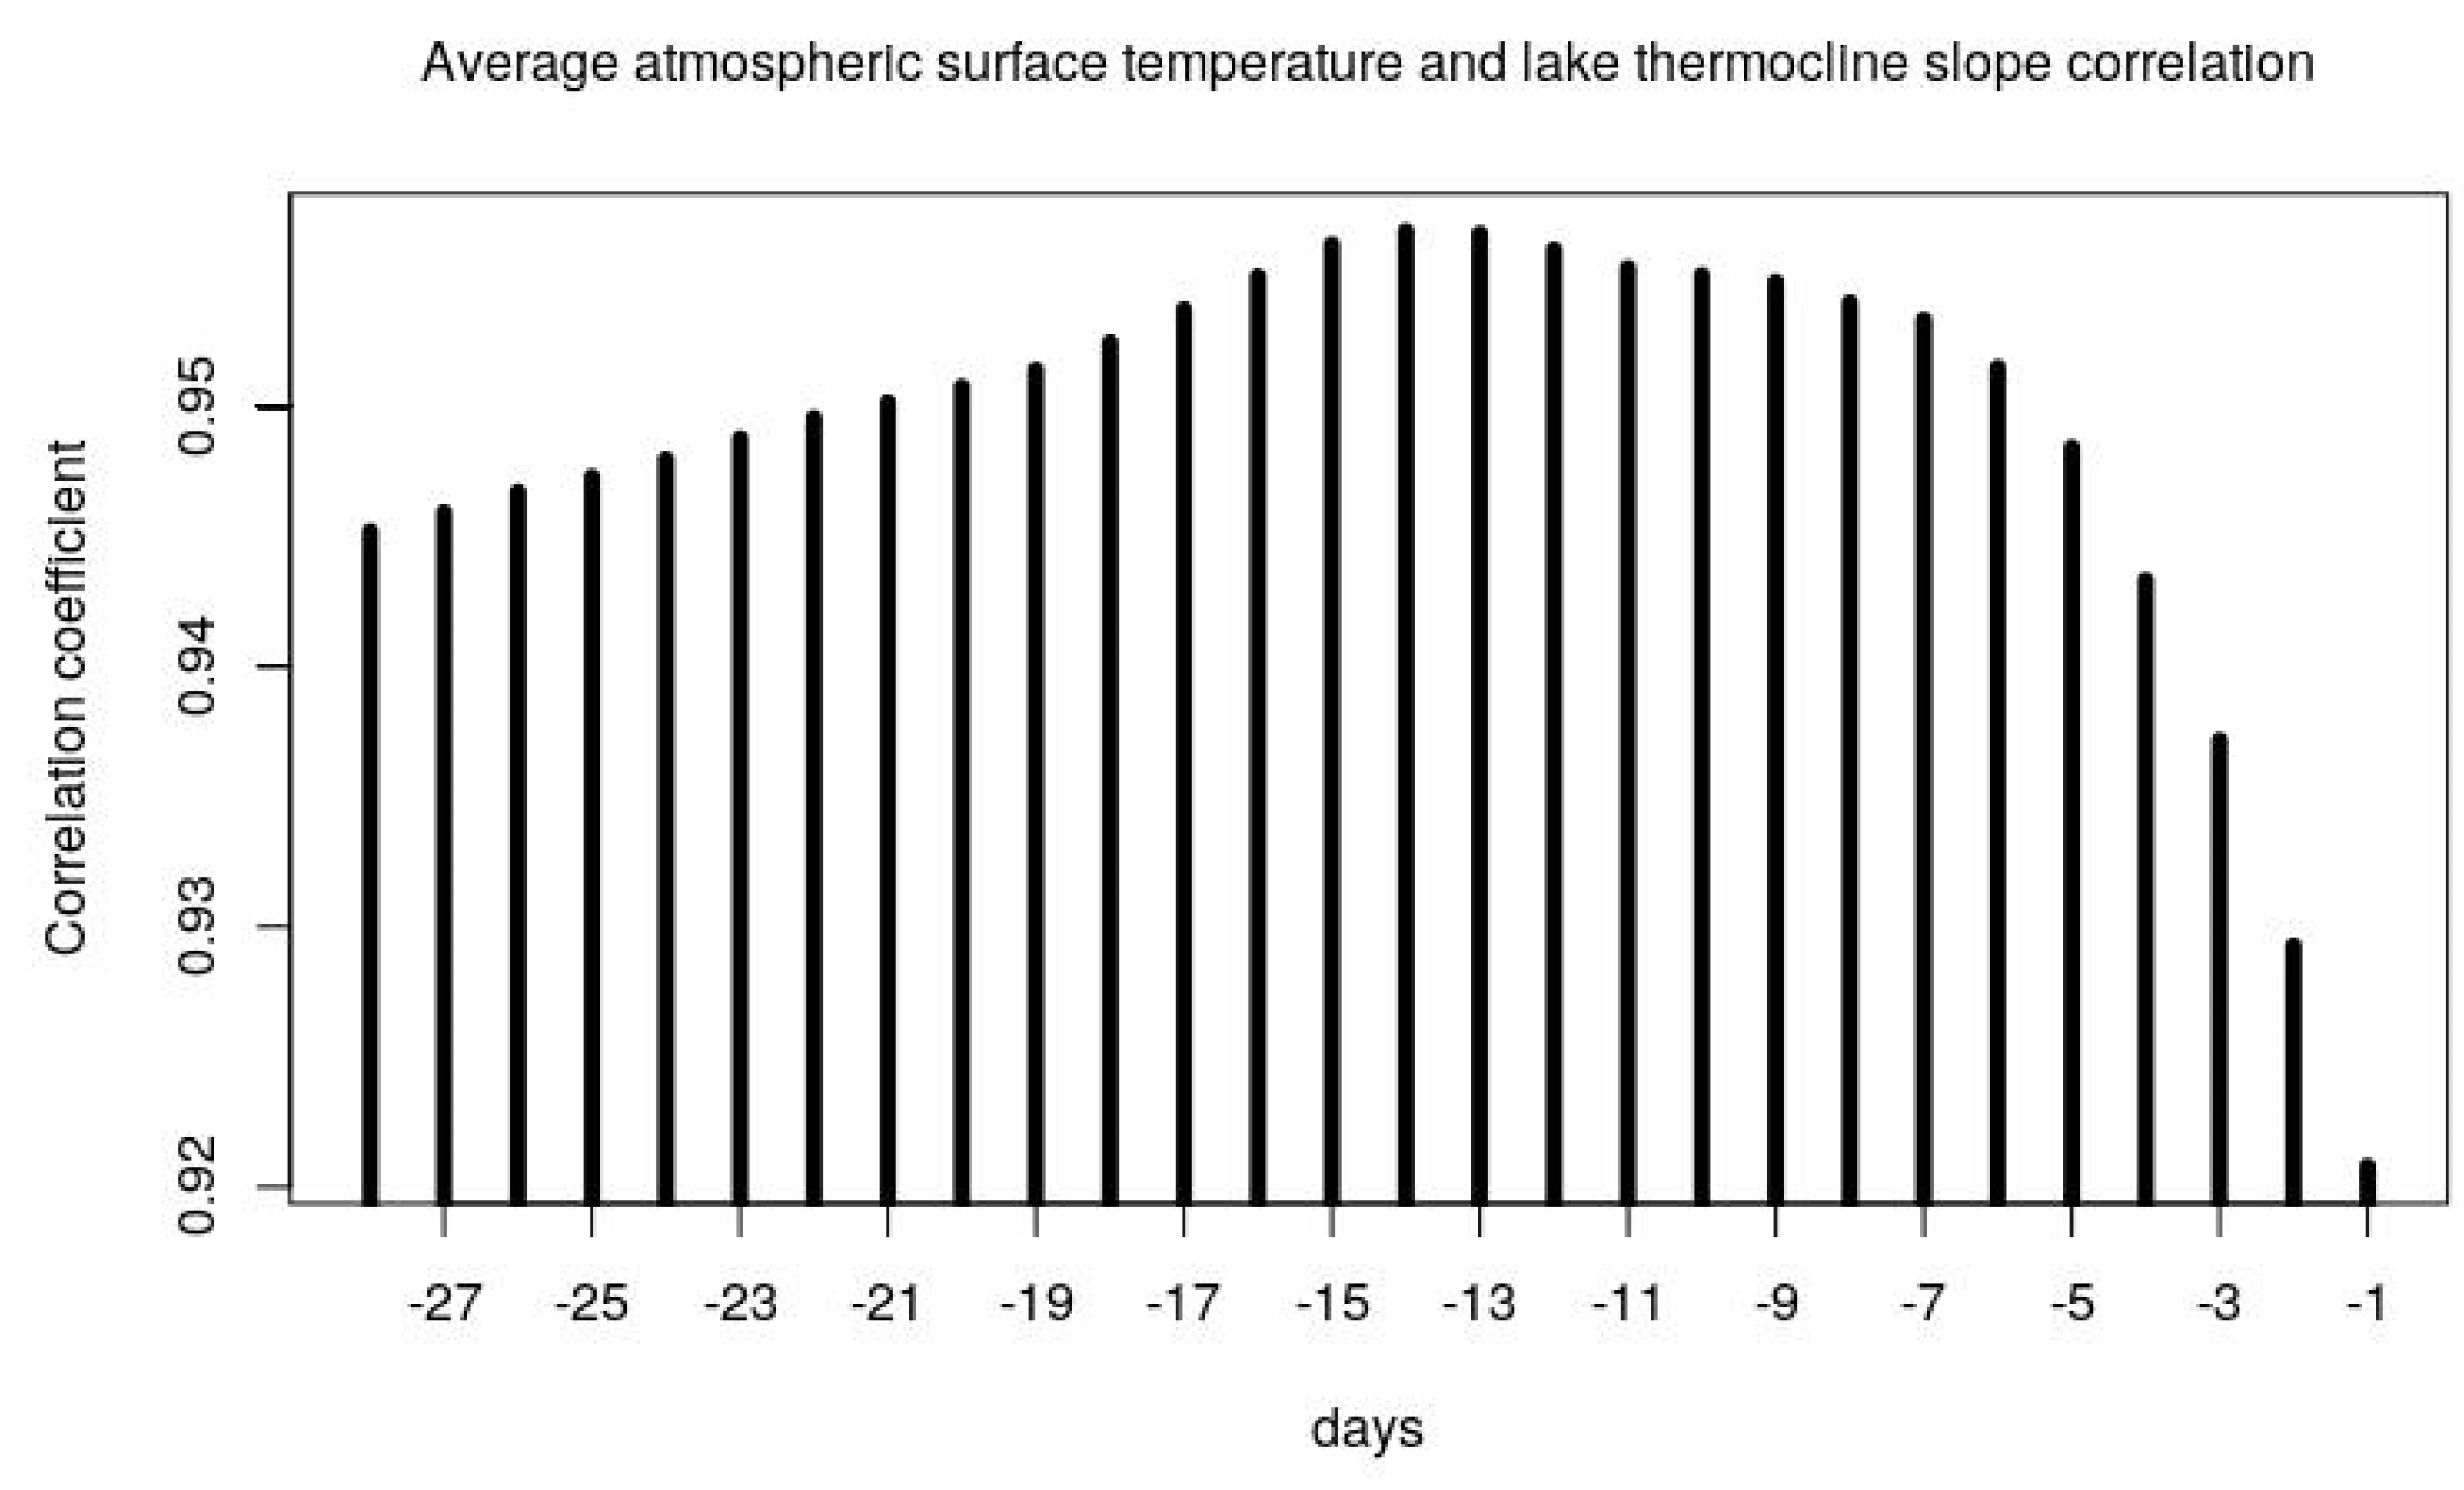
28]. Indeed, temperature and stratification are cross-linked factors, with stratification forming and strengthening at higher air and water temperatures. In this paper, based on this correlation, we have demonstrated that 14-days average air temperature can be used as a proxy of the stratification strength for Lake Varese (
Figure A3 in
Appendix A and
Figure 4). Indeed, the strongest correlation was found at 14 days (T14) preceding the current water temperature and the parameter T14. Despite wind speed being generally a physical variable influencing lake stratification [
57], the lack of relationship with the thermocline slopes can be explained because the Lake Varese area usually does not experience strong wind speed. Based on that and considering that phosphorous is one of the most important factors for lake management [
17], the model using T14 and total phosphorous (TP, model No.2 in
Table 3) was chosen in this work as the best candidate to predict the Cyanobacteria biovolume at Lake Varese. In our analysis, the model using ammonium nitrogen (AN) as predictor (model No.5 in
Table 3) was not considered further because AN is only one form of available nitrogen in water while it is known that all bioavailable forms of nitrogen (ammonium nitrogen, nitrate nitrogen, urea, and alanine nitrogen) influence the cyanobacteria abundance [
58].
Nevertheless, the predictive power of this model is rather low, representing only about 30% of the total variability. The difficulty of predicting cyanobacteria blooms using physico–chemical environmental variables is a common problem highlighted also by previous studies [
17,
23,
59]. On the other hand, as reported by Janssen et al., it is urgent and challenging to provide an algal bloom prediction at global level for the lakes [
21]. The 14-days average air temperature together with total phosphorus can be, therefore, used to predict an algal outbreak two weeks in advance and, eventually, to adopt management actions to reduce their occurrence in monomictic and eutrophic shallow lakes.
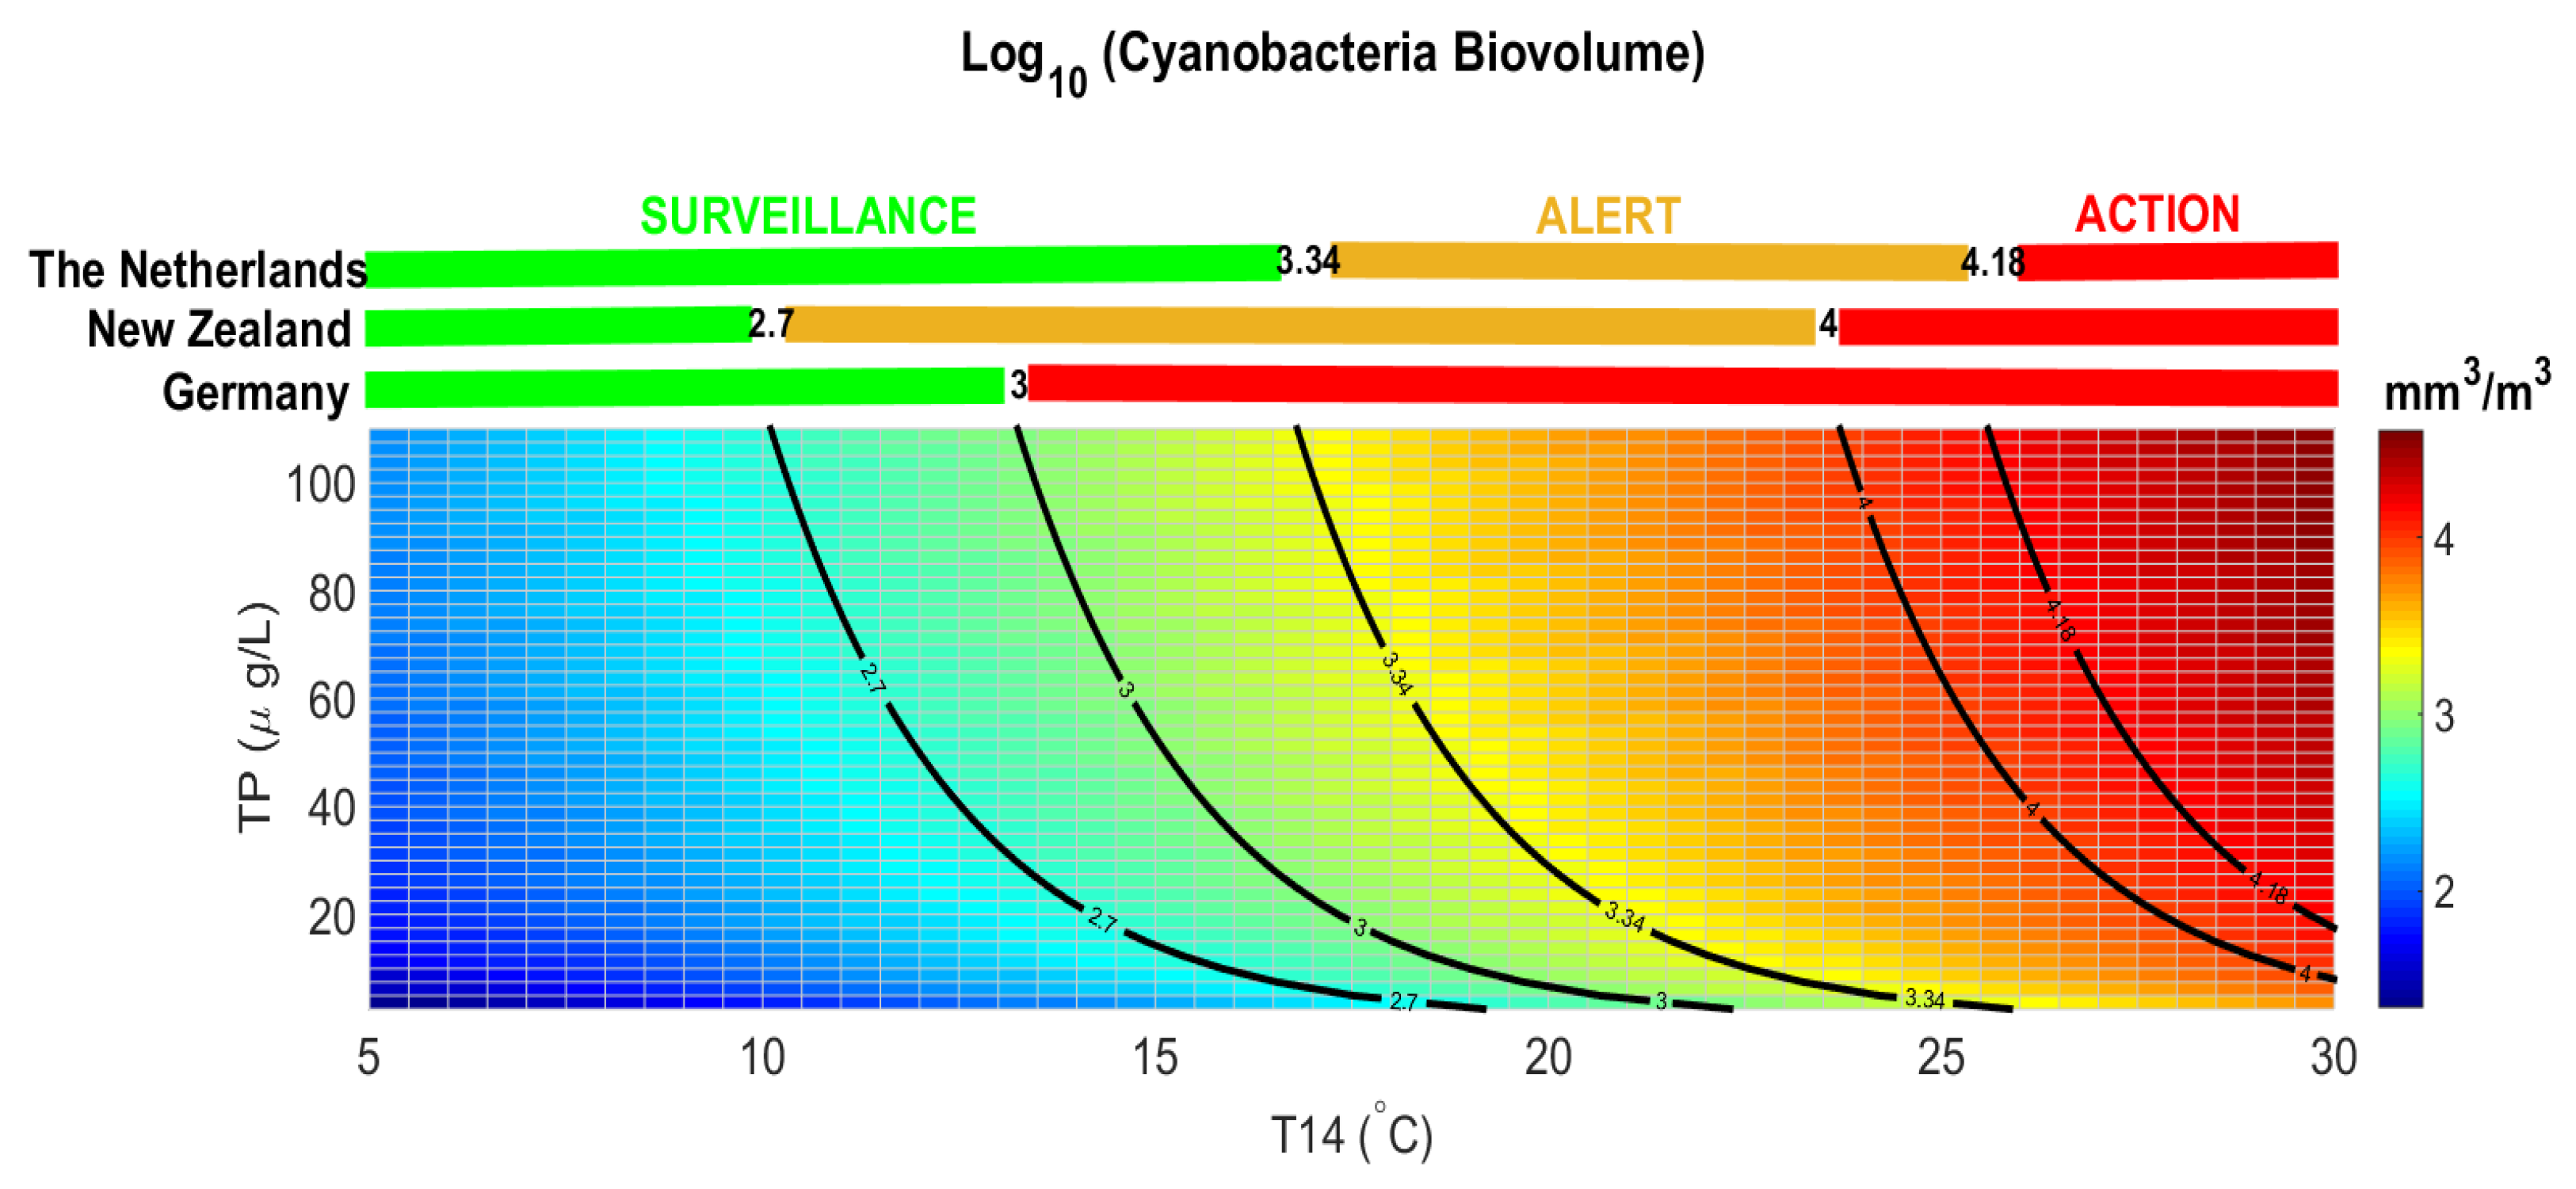
The threshold for health alert in recreational waters is normally defined for cyanobacterial density in many countries. A density of 100,000 cyanobacterial cells per ml (which is equivalent to approximately 50 µg/L of chlorophyll-a if cyanobacteria dominate) is a guideline for a moderate health alert in recreational waters [
60], although the regulated threshold varies at national level. The conversion of cyanobacteria cell density into biovolume is not simple, as measurements of the cyanobacteria genera/species are needed [
41]. Each country is free to define the alert values for the presence of cyanobacteria either in cell abundance or in biovolume [
61], only few countries defined thresholds in terms of cyanobacterial biovolume (
Figure 7). The Netherlands and New Zealand defined a surveillance level for cyanobacetria biovolume below 2.5 mm
3/L (LOG CyanoBV = 3.34 mm
3/m
3) and 0.5 mm
3/L (LOG CyanoBV = 2.7 mm
3/m
3), respectively. An alert is set above these thresholds requiring weekly monitoring and issue warning to the public. Above 15 mm
3/L (LOG CyanoBV = 4.18 mm
3/m
3) and 10 mm
3/L (LOG CyanoBV = 4 mm
3/m
3) The Netherlands and New Zealand authorities set an action level, continue the monitoring, notify the public of a potential risk to health, and if potentially toxic taxa are present, consider testing samples for cyanotoxins. Germany defined a single threshold for surveillance and alert level at 1 mm
3/L (LOG CyanoBV = 3 mm
3/m
3), above which local authorities must publish warnings, discourage bathing, and consider temporary closure.

 ,
, 


