3.1. Model Evaluation
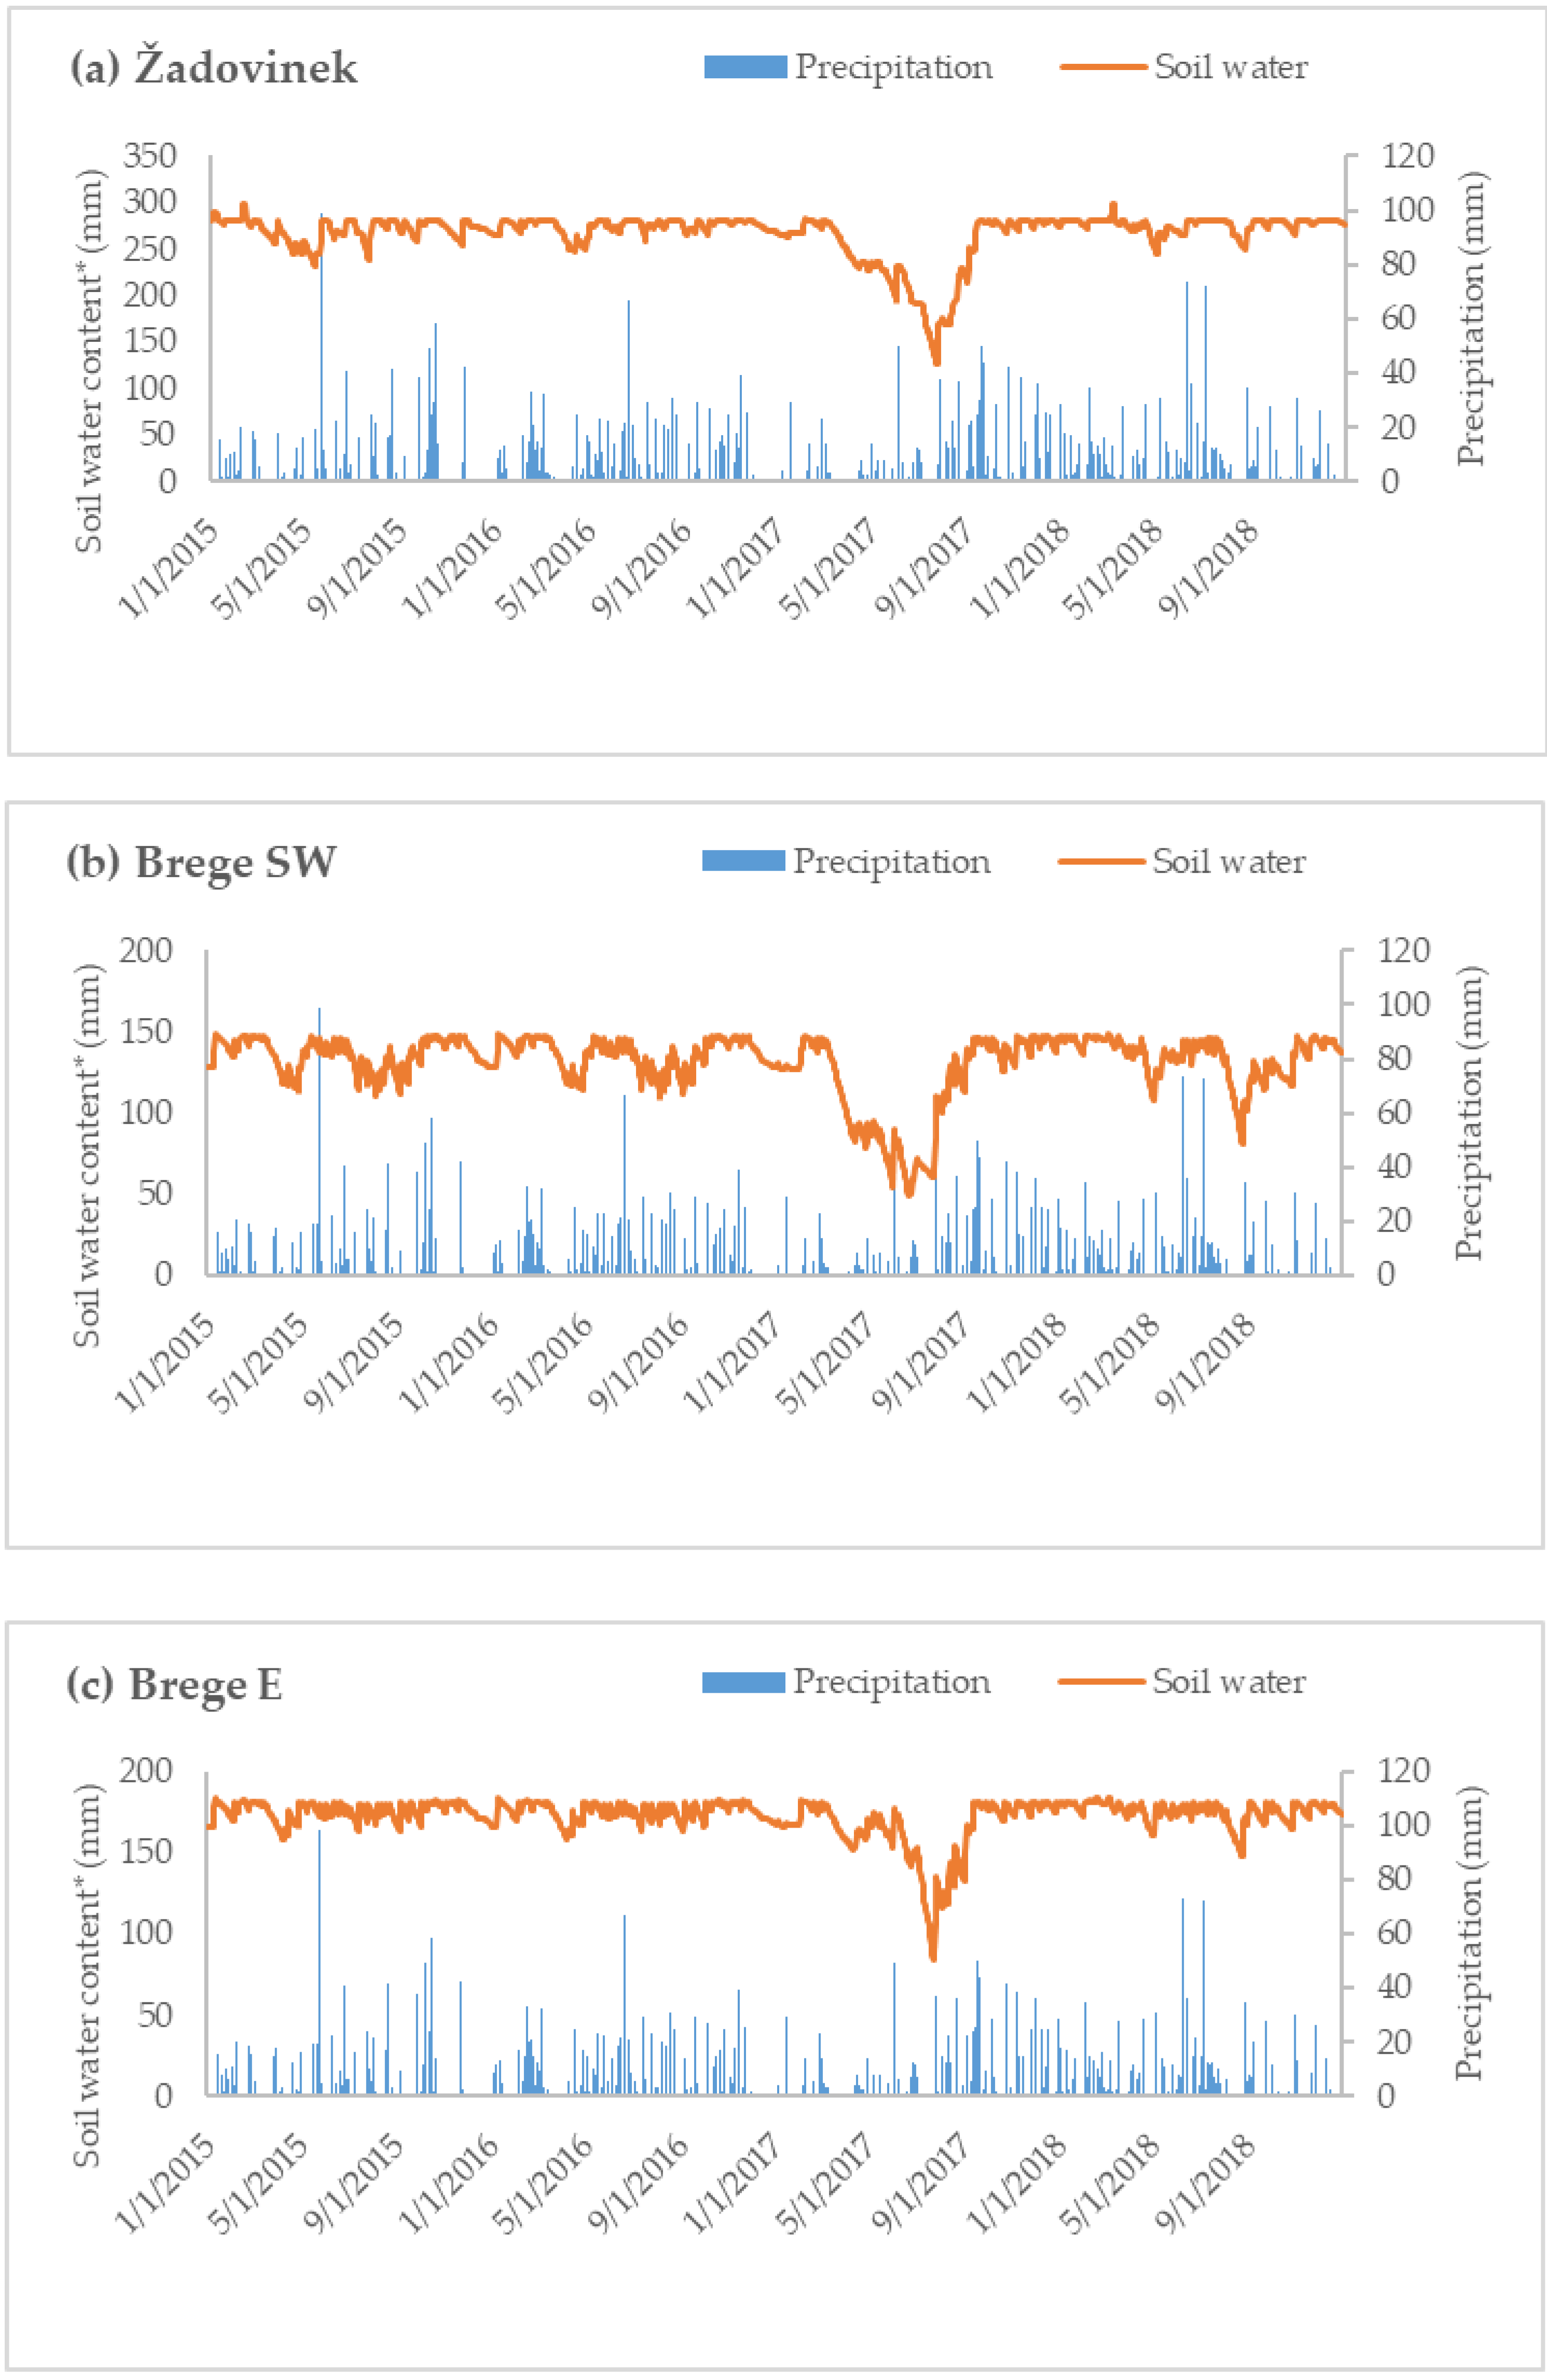
Soil water simulation results from SWAT model are reasonable, both when comparing it to precipitation measurements (
Figure 2) and to measured soil water data from the sites (
Figure 3). Comparison with precipitation is useful because we can visually see how soil water in the model responds to rain. Drought in the year 2017 is visible in all three sites, and it is also noticeable that soil water storage differs between soil types. The soil in Žadovinek has the best storage capacity, which is in line with measured soil properties such as texture and depth (
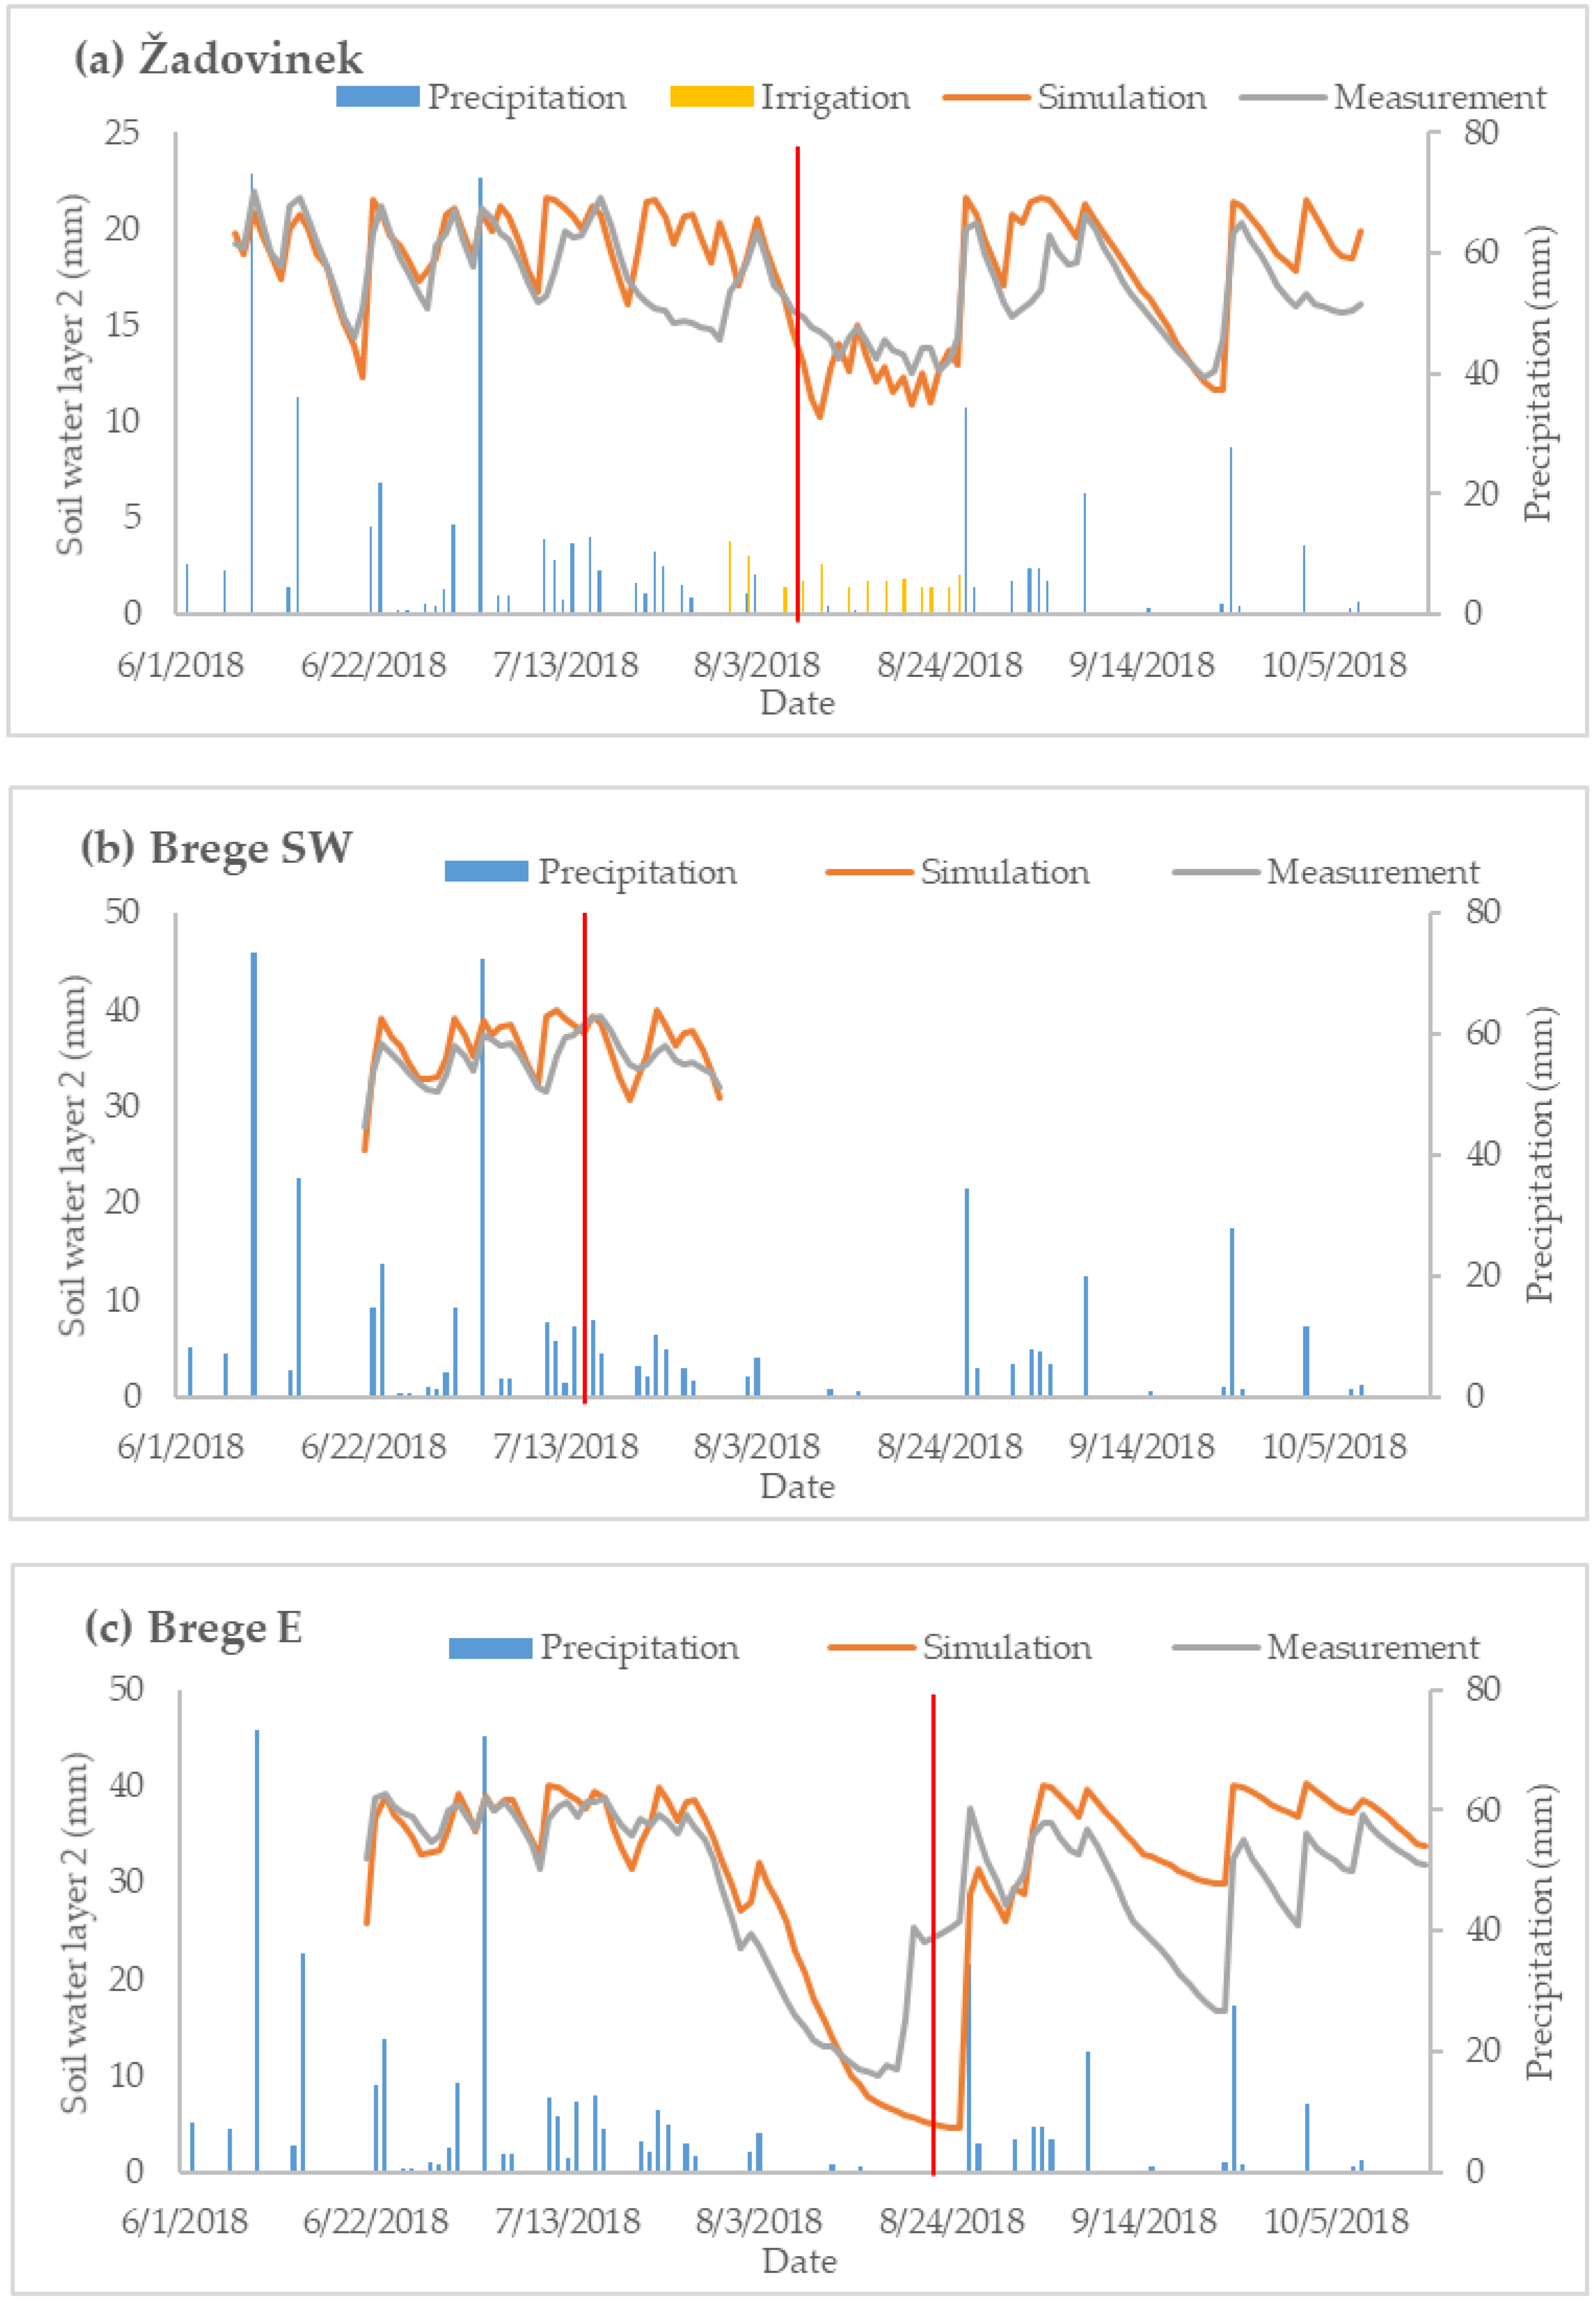
Table 1). In
Figure 3 we can observe an increase of soil water storage after rain events, and a decrease during a drought in the second part of September. August drought was successfully prevented by irrigation in Žadovinek, but in Brege E the soil water levels dropped significantly. The irrigation was not applied in further scenario analysis on purpose, to eliminate the differences in precipitation amounts, which could give a false comparison of nitrogen leaching between the sites. It would be interesting to study the use of irrigation as a nitrate leaching mitigation measure, as nitrate leaching usually occurs during strong rainfall after a period of drought [
21]. As plants are not able to use as much nitrogen in periods of drought, it accumulates, only to be washed out of the soil profile with later rain events. Slow and uniform water flow from irrigation, though, might decrease such extremities, but more research should be done on this in the future to verify it.
The PBIAS coefficient was under ±25% for all sites both in calibration and validation periods: for Žadovinek 8.6% (calibration) and 8.2% (validation); for Brege SW 2.6% (cal.) and −0.3% (val.); and for Brege E −1.0% (cal.) and 12. (val.). From what we can observe, the model performance seems adequate for our needs, both by visual evaluation and by statistics [
33]. Still, it has to be noted that the calibration and validation periods were quite short, thus not capturing all of the possible weather conditions of the area. Such an example might be the validation period for Brege E, which shows simulated soil water continuously higher than measured. This might be caused by a combination of factors. Precipitation distribution might not have been the same in the two sites, and since precipitation was measured in Žadovinek, actual weather might have differed somewhat in Brege E (local storms are known to vary in intensity, even in small areas). Crop development might be another source. Crop development stages could differ between model and real conditions, which influences evapotranspiration (and consequently soil water storage). It is unclear why the simulated soil water decreases rapidly during drought in August (following measurements), but during the drought in September it decreases much slower. We believe this could be connected with development stage of the crop, as described above. Based on this we figured the bias was caused by uncertainties connected with data, but also the rather simplified conversion of measured data from % to mm.
3.2. Water and Nitrogen Balance
Soil water and nitrogen balance results are daily time step variables from the SWAT output files for each HRU. They are presented in
Table 6. Simulated evapotranspiration (ET) is expectedly somewhat lower than the estimated potential ET (650–750 mm) for the area and in the range of findings from a study in a nearby catchment [
15]. Daily soil water content responds well to the seasonal distribution of precipitation (
Figure 2) in terms of it increasing with rain events and decreasing during droughts. During serious drought soil water in SWAT can be shown as 0 mm, which is impossible in nature, but is not an error, since SWAT only outputs water content above wilting point. The soil water simulation results for the three sites show that soils in the area definitely react differently even under the same weather conditions. The soil hydraulic conductivity characteristics influence the way water moves so this is expected. The profile depths are also different, which plays an important role as well.
Nitrogen balance is more closely connected to different management regimes in use, and as we can see from the top section of
Table 6, nitrogen fertilizer applications (N_APP) are quite diverse in the three trial sites. Applied fertilizer amounts slightly exceed the actual fertilizer inputs shown in
Table 2, because by this the model accounts for the slow release of N from organic fertilizers. Nitrogen fixation (NFIX) only occurs in scenarios with the arable management regime, because of the use of red clover as winter cover crop. Mineralization (F-MN) is also the most significant in the arable regime, because of larger quantities of cattle manure applied almost every year. Despite the biggest applications of nitrogen in the arable rotation, average yearly nitrogen leaching (NO3L) is greater in the vegetable rotation by nearly a factor of 2, either because inputs of fertilizer are not done in several rations, which causes leaching and consequently a lower plant nitrogen uptake (NUP), or because no winter cover crop was grown in this scenario. No measured data was available for comparison of results with realistic leaching amounts for the area, but simulated results were in line with findings from another modeling study done in a similar area nearby [
15] and with local expert estimations. Models, despite being quite reliable for evaluating possible trends, are still not able to predict future, and in order to get a better understanding of how fertilization influences yield, field trials are still a more definite way to go. They are also very important because they show us the quality of yield, which cannot be neglected if a farmer is planning to sell his vegetables to the costumer. Here is where the balancing of ecosystem services really shows its importance: we cannot influence water quality without impacting food production in such areas, and vice versa.
3.3. Scenario Analysis
In the scenario analysis, each of the management regimes was tested on each of the soil types in the area.
Table 6 shows us the results. The highest difference in average yearly nitrate leaching was more than 60 kg N/ha, depending on scenario. The highest leaching (102.5 ± 16.7) was observed in the base scenario combination of vegetable production on deeper Fluvisol, while the lowest (27.9 ± 28.9) was simulated for combination orchard on Cambisol. Of the three management regimes, vegetable production was the most prone to leaching losses, while average results for orchard were the least prone to leaching. Of the soil types Cambisol, probably because of its shallow depth, was the most susceptible to leaching, while the Fluvisols fared quite equally. The differences are small though, thus, further research (possibly field trials) should be considered. Vegetable production showed similar results in a study in one of the other alluvial plains in Slovenia [
15], thus, the current practices of vegetable producers in Slovenia do not seem to be very effective for groundwater protection. This does not mean, however, that vegetable production should not be considered in these areas, because many other factors (fertile soil, proximity of irrigation water sources and market etc.) make it a highly suitable choice. As Slovenia’s self-sufficiency with vegetables (only 39%), but also fresh fruits (21%) [
34], is very low, limiting such production is not sustainable. Considering the low self-sufficiency with fruit in light of this study’s results, more orchards could be another way to deal with this problem as a whole. At least one field trial has previously evaluated the impact of vegetable production on groundwater quality in Slovenia [
21], but to better evaluate the influence of reduced fertilizer inputs on yield and quality of the vegetables, more field trials should be established. Without knowing how reduced fertilization impacts quality of produce, we cannot know if such vegetables would be marketable at all, even if we managed to reduce the nitrate leaching.
Similar conclusions can also be observed in a monthly distribution (
Figure 4). The highest leaching peaks can be observed in vegetable rotation, though the Arable rotation on shallower Fluvisol also features a significant peak in July. The nitrate loads have three common peaks—in February, probably because of warmer weather, in July (probably because of fertilization) and another one in the autumn after harvest. Overall, the results seem to prove our hypotheses that with careful adjustment of management operations to each soil type nitrate leaching could be diminished. Furthermore, it might be necessary to discuss the current WPZ delineation, was not done with focus on nitrate leaching, but rather on point source contamination. Current WPZs in the area are located only in the NW, thus, only the field trial in Žadovinek is protected (under zone 2). In the future, we are planning to study the spatial extent of WPZ in the area in order to also consider the soil factors, as previously suggested by other authors [
15,
34,
35].
Soil conditions play a major role in leaching processes, thus, good understanding of local soil conditions is crucial for the adjustment of agricultural practices to achieve the best environmental effects. It is important to note that soil conditions also reflect partially the crops that grow there; for example, the topsoil in an orchard is better structured, while an arable field can be cracked, which influences the hydraulic conductivity. Actual leaching in different scenarios might therefore vary, not only because of unavoidable measurement errors (as in TDR soil water measurements, soil sampling etc.), but even more so because of the use of modeling.
Use of modeling for scenario analysis is a common approach [
36], but results should never be looked upon as definite, as a degree of error is always present when simulating complex processes. In this regard we are using nitrate loads or other results for comparative purposes only. Another possible source of uncertainty is the lack of calibration for nitrate. This was not done in this study for two reasons, the first and more important being the lack of reliable measurements. Since nitrate leaching is closely connected to soil water dynamics, the risk of having nitrate cycle completely wrong was greatly diminished, and to represent the nitrate leaching loads as close as possible, the SWAT management files were edited with attention to real crop rotations and fertilization in the area. In the process of calibration, soil properties were changed slightly, to better represent measured soil moisture. It would be interesting to see how the model performance would change if different methods of determining soil hydraulic properties were used (measured/calculated by pedotransfer functions) as performing measurements is both time and cost-consuming. For this study, we used measured data, but to our knowledge, no studies concerning this question were published to date, thus, it is not clear whether this extra step improves the model performance in the end.


