Fractal-Heuristic Method of Water Quality Sensor Locations in Water Supply Network
Abstract
1. Introduction
2. Materials and Methods
2.1. Comparison of Placement Indications with the Results Obtained Using Other Heuristic Methods
2.2. Analyzed Water Network
3. Results and Discussion
4. Conclusions
Author Contributions
Funding
Conflicts of Interest
References
- Hart, W.E.; Murray, R. Review of Sensor Placement Strategies for Contamination Warning Systems in Drinking Water Distribution Systems. J. Water Resour. Plan. Manag. 2010, 136, 611–619. [Google Scholar] [CrossRef]
- Rathi, S.; Gupta, R. Monitoring stations in water distribution systems to detect contamination events. ISH J. Hydraulic Eng. 2013. [Google Scholar] [CrossRef]
- Rathi, S.; Gupta, R. A Simple sensor placement approach for regular monitoring and contamination detection in water distribution networks. KSCE J. Civ. Eng. 2016, 20, 597–608. [Google Scholar] [CrossRef]
- Rathi, S.; Gupta, R.; Ormsbee, L. A review of sensor placement objective metrics for contamination detection in water distribution networks. Water Supply 2015, 15, 898–917. [Google Scholar] [CrossRef]
- Lee, B.; Deininger, R. Optimal locations of monitoring stations in water distribution system. ACSE J. Environ. Eng. 1992, 118, 4–16. [Google Scholar] [CrossRef]
- Kumar, A.; Kansal, M.L.; Arora, G.; Ostfeld, A.; Kessler, A. Detecting accidental contaminations in municipial water networks. J. Water Resour. Plan. Manag. 1999, 125, 308–310. [Google Scholar] [CrossRef]
- Al-Zahrani, M.A.; Moeid, K. Locating optimum water quality monitoring stations in water distribution system. ASCE World Water Environ. Resour. Congr. 2001, 393–402. [Google Scholar]
- Al-Zahrani, M.A.; Moeid, K. Optimizing water quality monitoring stations using genetic algorithms. Arab. J. Sci. Eng. 2003, 28, 57–75. [Google Scholar]
- Harmant, P.; Nace, A.; Kiene, L.; Fotoohi, F. Optimal supervision of drinking water distribution network. In Proceedings of the ASCE 29th Annual Water Resources Planning and Management Conference, Tempe, AZ, USA, 6–9 June 1999; pp. 52–60. [Google Scholar]
- Tryby, M.E.; Uber, J.G. Representative Water Quality Sampling in Water Distribution Systems. In Proceedings of the World Water and Environmental Resources Congress, Orlando, FL, USA, 20–24 May 2001. [Google Scholar]
- Woo, H.M.; Yoon, J.H.; Choi, D.Y. Optimal monitoring sites based on water quality and quantity in water distribution systems. In Proceedings of the ASCE World Water and Environmental Resources Congress, Orlando, FL, USA, 20–24 May 2001; pp. 397–405. [Google Scholar]
- Liu, S.; Liu, W.; Chen, J.; Wang, Q. Optimal locations of monitoring stations in water distribution systems under multiple demand patterns: A flaw of demand coverage method and modification. Front Environ. Sci. Engin. China 2011. [Google Scholar] [CrossRef]
- Kansal, M.L.; Dorji, T.; Chandniha, S.K. Design Scheme for water quality monitoring in a distribution network, International. J. Environ. Dev. 2012, 9, 69–81. [Google Scholar]
- Ghimire, S.R.; Barkdoll, B.D. Heuristic method for the battle of the water network sensors: Demand-based approach. In Proceedings of the 8th Annual Water Distribution System Analysis Symposium, Cincinnati, OH, USA, 27–30 August 2006. [Google Scholar]
- Ghimire, S.R.; Barkdoll, B.D. A heuristic method for water quality sensor location in a municipal water distribution system: Mass related based approach. In Proceedings of the 8th Annual Water Distribution System Analysis Symposium, Cincinnati, OH, USA, 27–30 August 2006. [Google Scholar]
- Xu, J.H.; Fischbeck, P.S.; Small, M.J.; VanBriesen, J.M.; Casman, E. Identifying sets of key nodes for placing sensors in dynamic water distribution networks. J. Water Resour. Plan. Manag. 2008, 134, 378–385. [Google Scholar] [CrossRef]
- Kowalski, D.; Kowalska, B.; Kwietniewski, M. Localisation method of water quality measurement points in Pulawy water network monitoring system. Ochrona Środowiska 2013, 35, 45–48. [Google Scholar]
- Kowalski, D.; Kowalska, B.; Kwietniewski, M. Monitoring of water distribution system effectiveness using fractal geometry. Bull. Pol. Acad. Sci. Tech. Sci. 2015, 63, 155–161. [Google Scholar] [CrossRef]
- Kowalski, D.; Kowalska, B.; Kwietniewski, M.; Duklewski, W.; Dziak, S.; Czajka, S.; Mierzwa, A. Method for determining the location of water quality sensors in water supply networks. Pol. Pat. 2015, 63, 155–161. [Google Scholar]
- Kessler, A.; Ostfeld, A.; Sinai, G. Detecting accidental contaminations in municipal water networks. J. Water Resour. Plan. Manag. 1998, 124, 192–198. [Google Scholar] [CrossRef]
- Ostfeld, A.; Salomons, E. Optimal layout of early warning detection stations for water distribution systems security. J. Water Resour. Plan. Manag. 2004, 130, 377–385. [Google Scholar] [CrossRef]
- Zhao, Y.; Schwartz, R.; Salomons, E.; Ostfeld, A.; Poor, H.V. New formulation and optimization methods for water sensor placement. Environ. Model. Softw. 2016, 76, 128–136. [Google Scholar] [CrossRef]
- Cozzolino, L.; Mucherino, C.; Pianese, D.; Pirozzi, F. Positioning, within water distribution networks, of monitoring stations aiming at an early detection of intentional contamination. Civ. Eng. Environ. Syst. 2006, 23, 161–174. [Google Scholar] [CrossRef]
- Berry, J.W.; Boman, E.; Phillips, C.A.; Riesen, L.A. Low-memory Lagrangian Relaxation Methods for Sensor Placment in Municipal Water Networks. In Proceedings of the Word Environmental and Water Recources Congress, ASCE, Reston, VA, USA, 17–21 May 2008. [Google Scholar]
- Berry, J.W.; Boman, E.; Phillips, C.A.; Riesen, L.A. User’s Manual: Teva-Spot Toolkit 2.0.; Sandia National Laboratories: Albuquerque, NM, USA, 2008. [Google Scholar]
- Hart, W.E.; Berry, J.W.; Boman, E.G.; Murray, R.; Phillips, C.A.; Riesen, L.A.; Watson, J.P. The TEVA-SPOT toolkit for drinking water contaminant warning system design. In Proceedings of the World Environmental & Water Resources Congress, ASCE, Reston, VA, USA, 17–21 May 2008. [Google Scholar]
- Ostfeld, A.; Salomons, E. Optimal early warning monitoring system layout for water networks security: Inclusion of sensors sensitivities and response delays. Civ. Eng. Environ. Syst. 2005, 22, 151–169. [Google Scholar] [CrossRef]
- Ostfeld, A.; Salomons, E. Securing water distribution systems using online contamination monitoring. J. Water Resour. Plan. Manag. 2005, 131, 402–405. [Google Scholar] [CrossRef]
- Łagnowski, R.; Brdys, M.A. An optimised placement of the hard quality sensors for a robust monitoring of the chlorine concentration in drinking water distribution systems. J. Process Control 2018, 68, 52–63. [Google Scholar]
- Clark, R.M. Chlorine demand and TTHM formation kinetics: A second—Order model. J. Environ. Eng. 1998, 124, 16–24. [Google Scholar] [CrossRef]
- Kowalska, B.; Kowalski, D.; Musz, A. Chlorine Decay in Water Distribution System. Environ. Prot. Eng. 2006, 32, 5–16. [Google Scholar]
- Al Heboos, S.; Licskó, I. Influence of water quality characters on kinetics of chlorine bulk decay in water distribution systems. Int. J. Appl. Sci. Technol. 2015, 5, 64–73. [Google Scholar]
- Al-Jasser, A.O. Chlorine decay in drinking-water transmission and distribution systems: Pipe service age effect. Water Res. 2007, 41, 387–396. [Google Scholar] [CrossRef]
- Courtis, B.J.; West, J.R.; Bridgeman, J. Temporal and spatial variations in bulk chlorine decay within a water supply system. J. Environ. Eng. 2009, 135, 147–152. [Google Scholar] [CrossRef]
- Kowalska, B.; Hołota, E.; Kowalski, D. Simulation of chlorine concentration changes in a real water supply network using EPANET 2.0 and WaterGEMS software. WIT Trans. Built Environ. 2018, 184, 39–48. [Google Scholar]
- Castro, P.; Neves, M. Chlorine decay in water distribution systems. Case study—Lousada network. Electron. J. Environ. Agric. Food Chem. 2003, 2, 261–266. [Google Scholar]
- Al-Zahrani, M.A. Optimizing Dosage and Location of Chlorine Injection in Water Supply Networks. Arab. J. Sci. Eng. 2016, 41, 4207–4215. [Google Scholar] [CrossRef]
- Bensoltane, M.A.; Zeghadnia, L.; Djemili, L.; Gheid, A.; Djebbar, Y. Enhancement of the free residual chlorine concentration at the ends of the water supply network: Case study of Souk Ahras city—Algeria. J. Water Land Dev. 2018, 38, 3–9. [Google Scholar] [CrossRef]
- Delpla, I.; Florea, M.; Pelletier, G.; Rodriguez, M.J. Optimizing disinfection by-product monitoring points in a distribution system using cluster analysis. Chemosphere 2018, 208, 512–521. [Google Scholar] [CrossRef] [PubMed]
- Brown, M.A.; Emmert, G.L. On-line monitoring of trihalomethane concentrations in drinking water distribution systems using capillary membrane sampling-gas chromatography. Anal. Chim. Acta 2006, 555, 75–83. [Google Scholar] [CrossRef]
- Asoka, J. Application of a risk management system to improve drinking water safety. J. Water Health 2008, 6, 547–557. [Google Scholar]
- Boryczko, K.; Rak, J.; Tchórzewska-Cieślak, B. Analysis of risk and failure scenarios in water supply system. J. Pol. Saf. Reliab. Assoc. Summer Saf. Reliab. Semin. 2014, 5, 35–42. [Google Scholar]
- Urbanik, M.; Tchórzewska-Cieślak, B. Approach to the determination of failure risk level index on the example of the natural gas distribution subsystem. J. Civ. Eng. Environ. Archit. JCEEA 2017, XXXIV, 305–312. [Google Scholar] [CrossRef]
- Rossman, L.A. EPANET 2. Users Manual. U.S. Patent EPA/600/R-00/057, 28 June 2000. [Google Scholar]
- Regulation of the Polish Minister of Health, 7th December 2017. Dziennik Ustaw 2017. pos. 2294.
- Kowalski, D.; Kowalska, B. Fractal classification of water supply networks. In Proceedings of the Eleventh International Conference on Computing and Control for the Water Industry Urban Water Management: Challenges and Opportunities, Exeter, UK, 5–9 September 2011; pp. 323–329. [Google Scholar]
- Falconer, K.J. Fractal Geometry: Mathematical Foundations and Applications; John Wiley: Chichester, UK, 1990. [Google Scholar]
- Peitgen, H.O.; Jurgens, H.; Sanpe, D. Chaos and Fractals: New Frontiers of Science; Springer: New York, NY, USA, 1992. [Google Scholar]
- Chen, W.J.; Weisel, C.P. Halogenated DBP concentrations in a distribution system. J. Am. Water Work. Assoc. 1998, 90, 151–163. [Google Scholar] [CrossRef]
- Rodriguez, M.J.; Sérodes, J.B.; Levallois, P.; Proulx, F. Chlorinated DBPs in drinking water according to source, treatment, season and distribution location. J. Environ. Eng. Sci. 2007, 6, 355–365. [Google Scholar] [CrossRef]
- Hua, F.; West, J.R.; Barker, R.A.; Forster, C.F. Modelling of chlorine decay in municipal water supplies. Water Res. 1999, 33, 2735–2746. [Google Scholar] [CrossRef]
- Hallam, N.B.; West, J.R.; Forster, C.F.; Powell, J.C.; Spencer, I. The decay of chlorine associated with the pipe wall in water disinfection systems. Water Res. 2002, 36, 3479–3488. [Google Scholar] [CrossRef]


| Water Demand of Maximum Detected | Q |
|---|---|
| 0%–20% | 1 |
| 21%–40% | 2 |
| 41%–60% | 3 |
| 61%–80% | 4 |
| 81%–100% | 5 |
| Type of recipient | a |
| Housing estates | 1 |
| Schools, office buildings, administration | 2 |
| Department stores, shops | 3 |
| Industry, restaurants, clinics | 4 |
| Water-intensive industry, hospitals, fire department | 5 |
| Type of buildings | b |
| Warehouse and industrial premises | 1 |
| Department stores, shops | 2 |
| Housing estates, schools, office buildings, administration | 3 |
| Restaurants | 4 |
| Water-intensive industry, hospitals | 5 |
| The Average Concentration of Free Chlorine—mgCl2/dm3: In a Subarea (First Stage) In a Junction—Except for the Hydrant Junctions (Second Stage) | c |
|---|---|
| 0.25–0.30 | 1 |
| 0.19–0.24 | 2 |
| 0.13–0.18 | 3 |
| 0.07–0.12 | 4 |
| 0.00–0.06 | 5 |
| Location | Number of Observed Data | Observed Mean | Computed Mean | Mean Error | RMS Error |
|---|---|---|---|---|---|
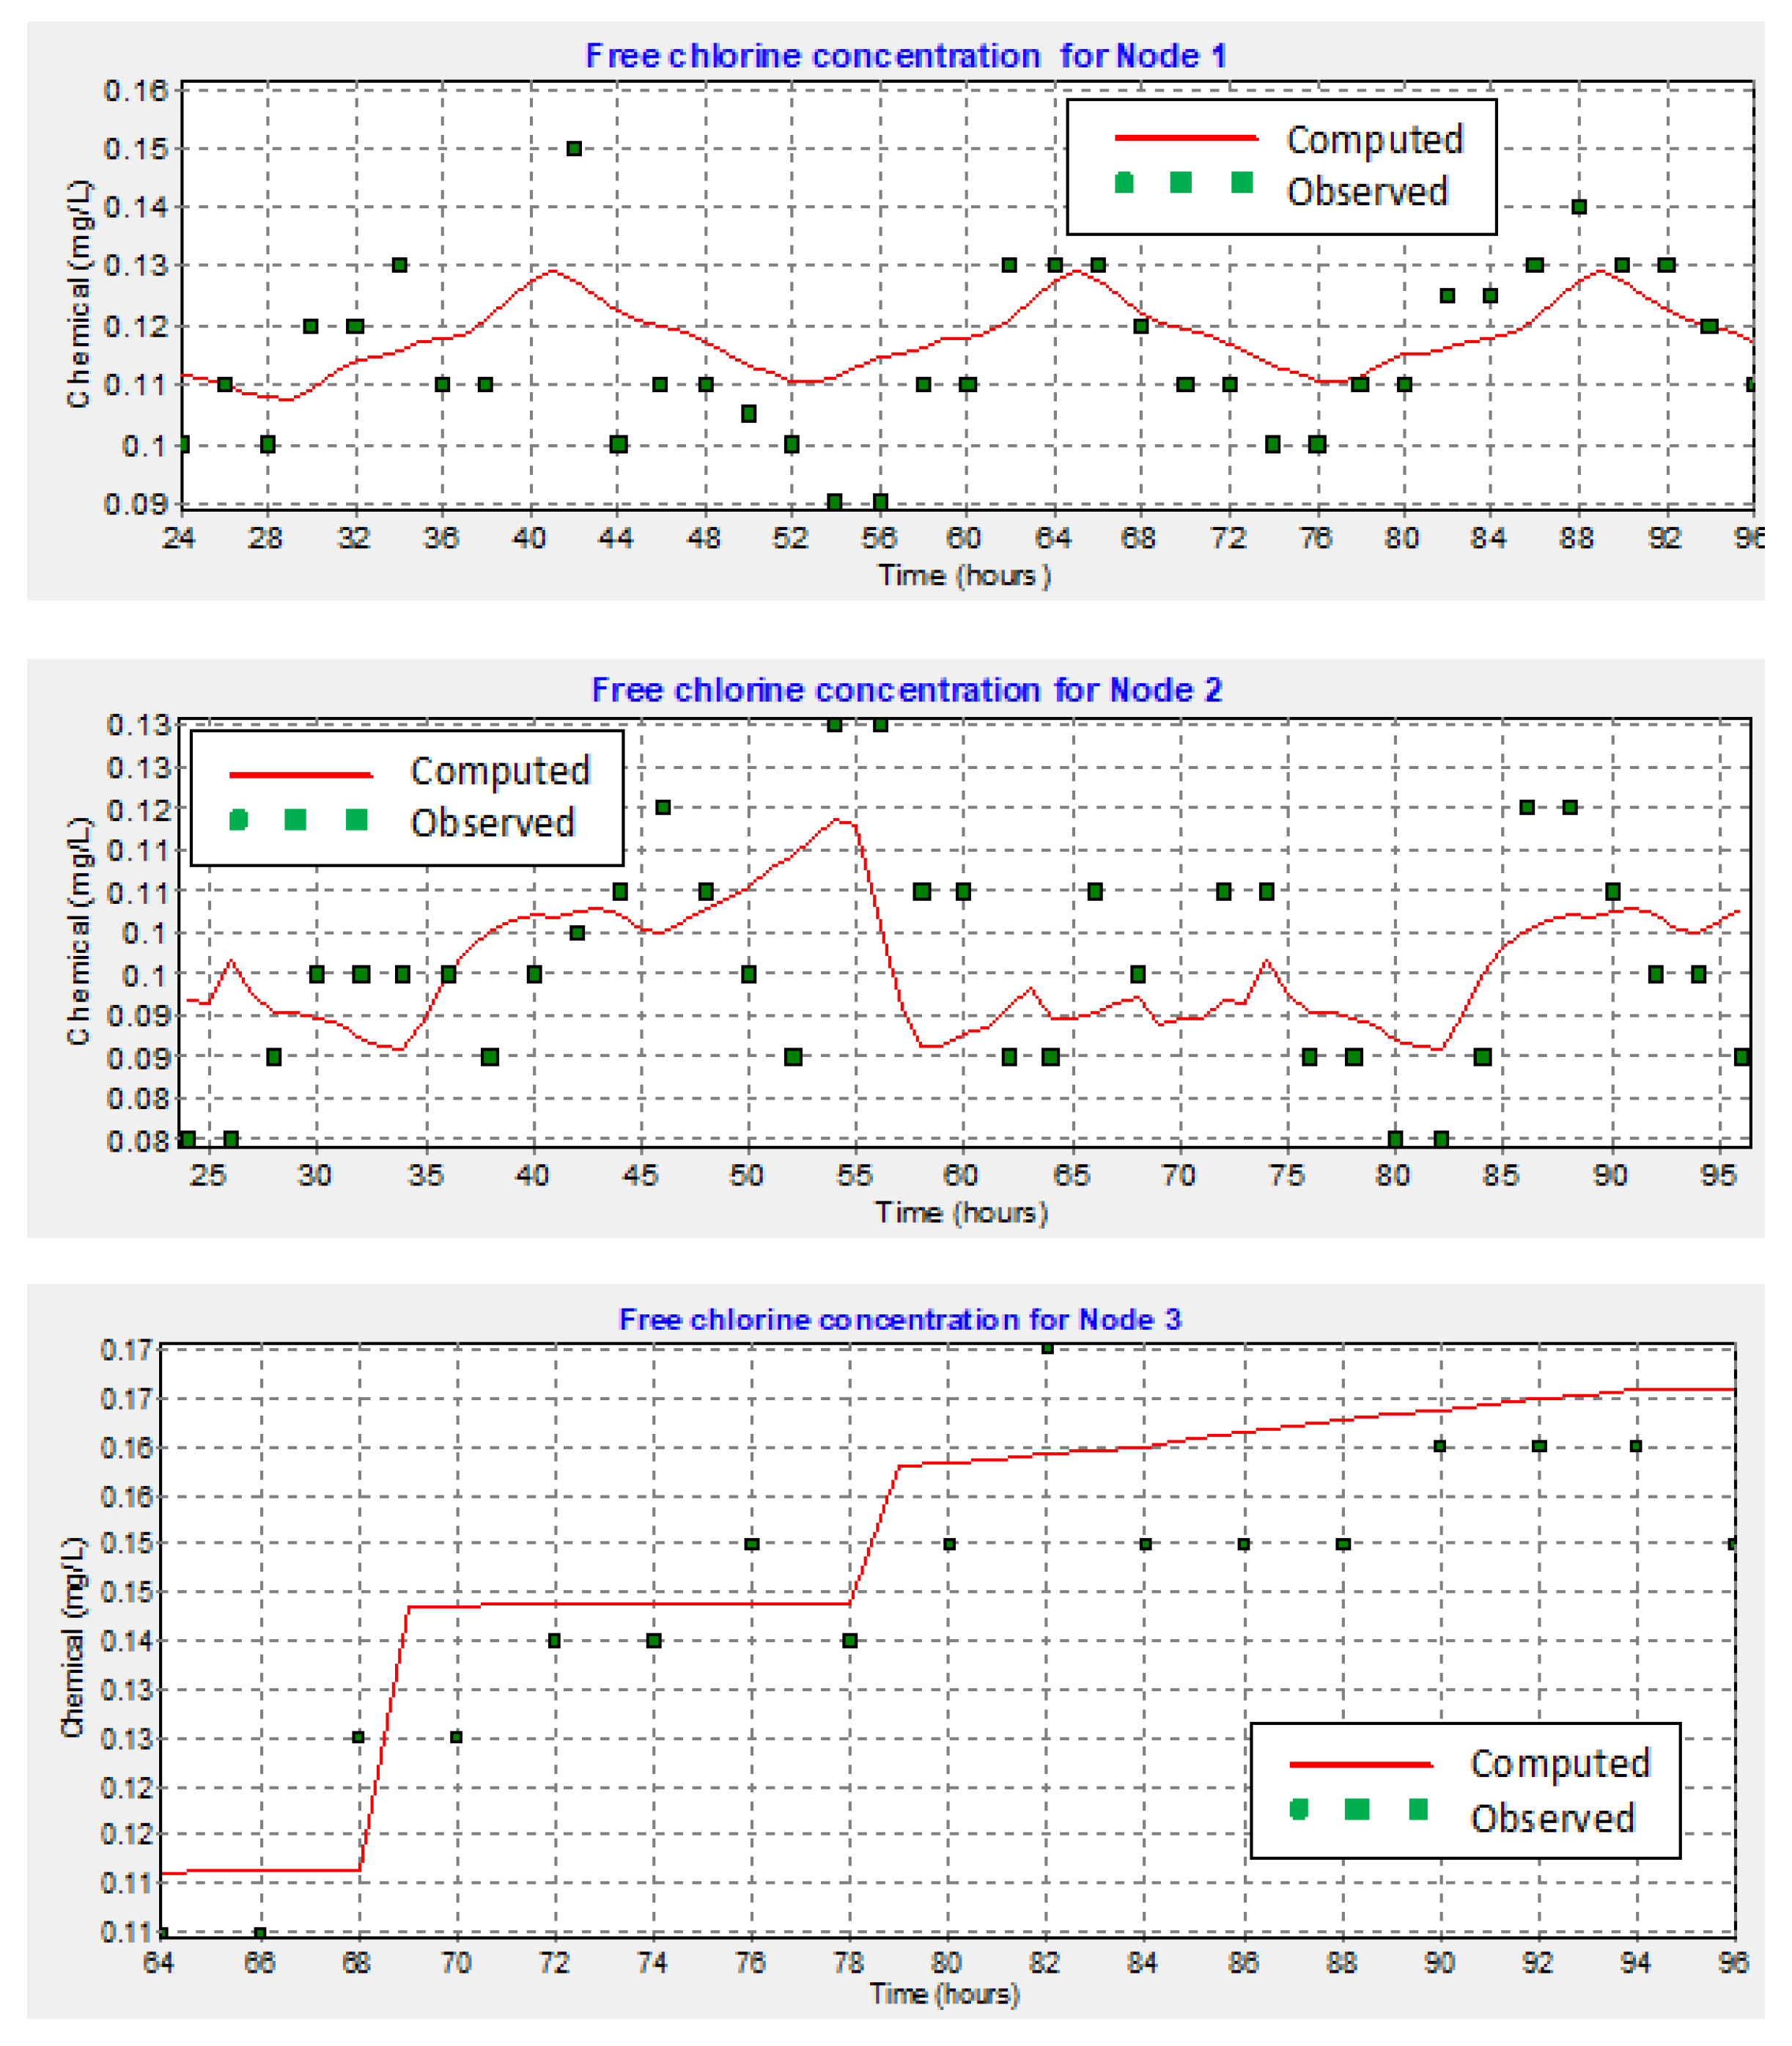
| Network | 425 | 0.14 | 0.13 | 0.017 | 0.033 |
| Correlation between means: 0.874 | |||||
| A | B | C | D | E | F | G | H | I | J | K | L | M | N | |
|---|---|---|---|---|---|---|---|---|---|---|---|---|---|---|
| 1 | 19 | |||||||||||||
| 2 | 2 | |||||||||||||
| 3 | 92 | |||||||||||||
| 4 | 1 | |||||||||||||
| 5 | 12 | 94 | ||||||||||||
| 6 | 0 | 3 | 3 | |||||||||||
| 7 | 6 | 28 | ||||||||||||
| 8 | 26 | 17 | ||||||||||||
| 9 | 64 | |||||||||||||
| 10 | 112 | 2 | ||||||||||||
| 11 | 49 | 20 | 51 | 6 | ||||||||||
| 12 | 132 | 28 | 82 | 123 | 95 | 114 | 673 | 113 | ||||||
| 13 | 42 | 419 | 191 | 271 | 263 | 249 | 222 | 38 | 25 | |||||
| 14 | 8 | 239 | 120 | 103 | 60 | 262 | 301 | 53 | 22 | 21 | 8 | |||
| 15 | 13 | 5 | 51 | 37 | 40 | 513 | 106 | 33 | 23 | 28 | 17 | |||
| 16 | 6 | 45 | 66 | 79 | 7 | 9 | 13 | 14 | 85 | |||||
| 17 | 38 | 30 | 8 | |||||||||||
| 18 | 32 | 34 | ||||||||||||
| 19 | 14 | 50 | ||||||||||||
| 20 | 6 | 29 | 2 | |||||||||||
| 21 | 16 | 3 | ||||||||||||
| 22 | 3 | |||||||||||||
| 23 | 2 | 8 | ||||||||||||
| 24 | 29 |
| Q Coefficient | a Coefficient | |||||||||||||||||||||||||||
|---|---|---|---|---|---|---|---|---|---|---|---|---|---|---|---|---|---|---|---|---|---|---|---|---|---|---|---|---|
| A | B | C | D | E | F | G | H | I | J | K | L | M | N | A | B | C | D | E | F | G | H | I | J | K | L | M | N | |
| 1 | 1 | 1 | ||||||||||||||||||||||||||
| 2 | 1 | 1 | ||||||||||||||||||||||||||
| 3 | 1 | 1 | ||||||||||||||||||||||||||
| 4 | 1 | 1 | ||||||||||||||||||||||||||
| 5 | 1 | 1 | 1 | 1 | 1 | |||||||||||||||||||||||
| 6 | 1 | 1 | 1 | 1 | 1 | 5 | 1 | |||||||||||||||||||||
| 7 | 1 | 1 | 1 | 1 | ||||||||||||||||||||||||
| 8 | 1 | 1 | 1 | 1 | ||||||||||||||||||||||||
| 9 | 1 | 1 | ||||||||||||||||||||||||||
| 10 | 1 | 1 | 2 | 1 | ||||||||||||||||||||||||
| 11 | 1 | 1 | 1 | 1 | 3 | 2 | 1 | 1 | ||||||||||||||||||||
| 12 | 2 | 1 | 1 | 1 | 1 | 1 | 5 | 1 | 3 | 2 | 2 | 1 | 5 | 2 | 1 | 1 | ||||||||||||
| 13 | 1 | 4 | 2 | 3 | 2 | 2 | 2 | 1 | 1 | 1 | 2 | 2 | 4 | 1 | 3 | 1 | 1 | 4 | ||||||||||
| 14 | 1 | 2 | 1 | 1 | 1 | 2 | 3 | 1 | 1 | 1 | 1 | 1 | 2 | 3 | 3 | 3 | 2 | 1 | 3 | 2 | 4 | 4 | ||||||
| 15 | 1 | 1 | 1 | 1 | 1 | 4 | 1 | 1 | 1 | 1 | 1 | 1 | 1 | 1 | 2 | 2 | 1 | 5 | 1 | 1 | 2 | 1 | ||||||
| 16 | 1 | 1 | 1 | 1 | 1 | 1 | 1 | 1 | 1 | 2 | 2 | 1 | 1 | 1 | 1 | 1 | 1 | 1 | ||||||||||
| 17 | 1 | 1 | 1 | 1 | 1 | 1 | ||||||||||||||||||||||
| 18 | 1 | 1 | 1 | 1 | ||||||||||||||||||||||||
| 19 | 1 | 1 | 2 | 1 | ||||||||||||||||||||||||
| 20 | 1 | 1 | 1 | 1 | 4 | 1 | ||||||||||||||||||||||
| 21 | 1 | 1 | 1 | 1 | ||||||||||||||||||||||||
| 22 | 1 | 1 | ||||||||||||||||||||||||||
| 23 | 1 | 1 | 1 | 1 | ||||||||||||||||||||||||
| 24 | 1 | 1 | ||||||||||||||||||||||||||
| b Coefficient | c Coefficient | |||||||||||||||||||||||||||
| 1 | 1 | 3 | ||||||||||||||||||||||||||
| 2 | 1 | 3 | ||||||||||||||||||||||||||
| 3 | 1 | 3 | ||||||||||||||||||||||||||
| 4 | 1 | 3 | ||||||||||||||||||||||||||
| 5 | 1 | 1 | 1 | 3 | 3 | 1 | ||||||||||||||||||||||
| 6 | 1 | 1 | 4 | 1 | 3 | 3 | 1 | 1 | ||||||||||||||||||||
| 7 | 1 | 1 | 3 | 3 | ||||||||||||||||||||||||
| 8 | 1 | 1 | 3 | 3 | ||||||||||||||||||||||||
| 9 | 2 | 3 | ||||||||||||||||||||||||||
| 10 | 2 | 1 | 3 | 3 | ||||||||||||||||||||||||
| 11 | 2 | 2 | 2 | 1 | 3 | 3 | 3 | 3 | ||||||||||||||||||||
| 12 | 2 | 2 | 2 | 1 | 5 | 2 | 2 | 1 | 3 | 3 | 3 | 3 | 3 | 2 | 3 | 3 | ||||||||||||
| 13 | 2 | 2 | 2 | 4 | 2 | 2 | 2 | 1 | 2 | 3 | 3 | 3 | 3 | 2 | 2 | 3 | 3 | 3 | ||||||||||
| 14 | 2 | 2 | 2 | 3 | 2 | 3 | 2 | 4 | 2 | 4 | 4 | 3 | 3 | 3 | 2 | 2 | 2 | 3 | 3 | 3 | 3 | 3 | ||||||
| 15 | 1 | 2 | 2 | 2 | 3 | 3 | 3 | 1 | 1 | 2 | 1 | 3 | 3 | 3 | 2 | 1 | 1 | 1 | 3 | 3 | 3 | 3 | ||||||
| 16 | 2 | 3 | 3 | 3 | 1 | 1 | 1 | 1 | 1 | 2 | 1 | 1 | 2 | 3 | 3 | 3 | 3 | 3 | ||||||||||
| 17 | 2 | 1 | 1 | 1 | 1 | 3 | ||||||||||||||||||||||
| 18 | 1 | 1 | 1 | 1 | 0 | |||||||||||||||||||||||
| 19 | 1 | 1 | 2 | 2 | 0 | |||||||||||||||||||||||
| 20 | 1 | 4 | 1 | 2 | 3 | 3 | ||||||||||||||||||||||
| 21 | 1 | 1 | 2 | 3 | ||||||||||||||||||||||||
| 22 | 1 | 2 | ||||||||||||||||||||||||||
| 23 | 1 | 1 | 2 | 2 | ||||||||||||||||||||||||
| 24 | 1 | 2 | ||||||||||||||||||||||||||
| A | B | C | D | E | F | G | H | I | J | K | L | M | N | |
|---|---|---|---|---|---|---|---|---|---|---|---|---|---|---|
| 1 | 3 | |||||||||||||
| 2 | 3 | |||||||||||||
| 3 | 3 | |||||||||||||
| 4 | 3 | |||||||||||||
| 5 | 3 | 3 | ||||||||||||
| 6 | 3 | 3 | 20 | |||||||||||
| 7 | 3 | 3 | ||||||||||||
| 8 | 3 | 3 | ||||||||||||
| 9 | 6 | |||||||||||||
| 10 | 12 | 3 | ||||||||||||
| 11 | 18 | 12 | 6 | 3 | ||||||||||
| 12 | 36 | 12 | 12 | 3 | 75 | 8 | 30 | 3 | ||||||
| 13 | 6 | 48 | 24 | 144 | 8 | 24 | 12 | 3 | 24 | |||||
| 14 | 6 | 24 | 18 | 18 | 12 | 24 | 18 | 36 | 12 | 48 | 48 | |||
| 15 | 3 | 6 | 6 | 8 | 6 | 12 | 15 | 3 | 3 | 12 | 3 | |||
| 16 | 8 | 6 | 3 | 6 | 3 | 3 | 3 | 3 | 3 | |||||
| 17 | 2 | 1 | 3 | |||||||||||
| 18 | 1 | 1 | ||||||||||||
| 19 | 4 | 2 | ||||||||||||
| 20 | 2 | 48 | 3 | |||||||||||
| 21 | 2 | 3 | ||||||||||||
| 22 | 2 | |||||||||||||
| 23 | 2 | 2 | ||||||||||||
| 24 | 2 |
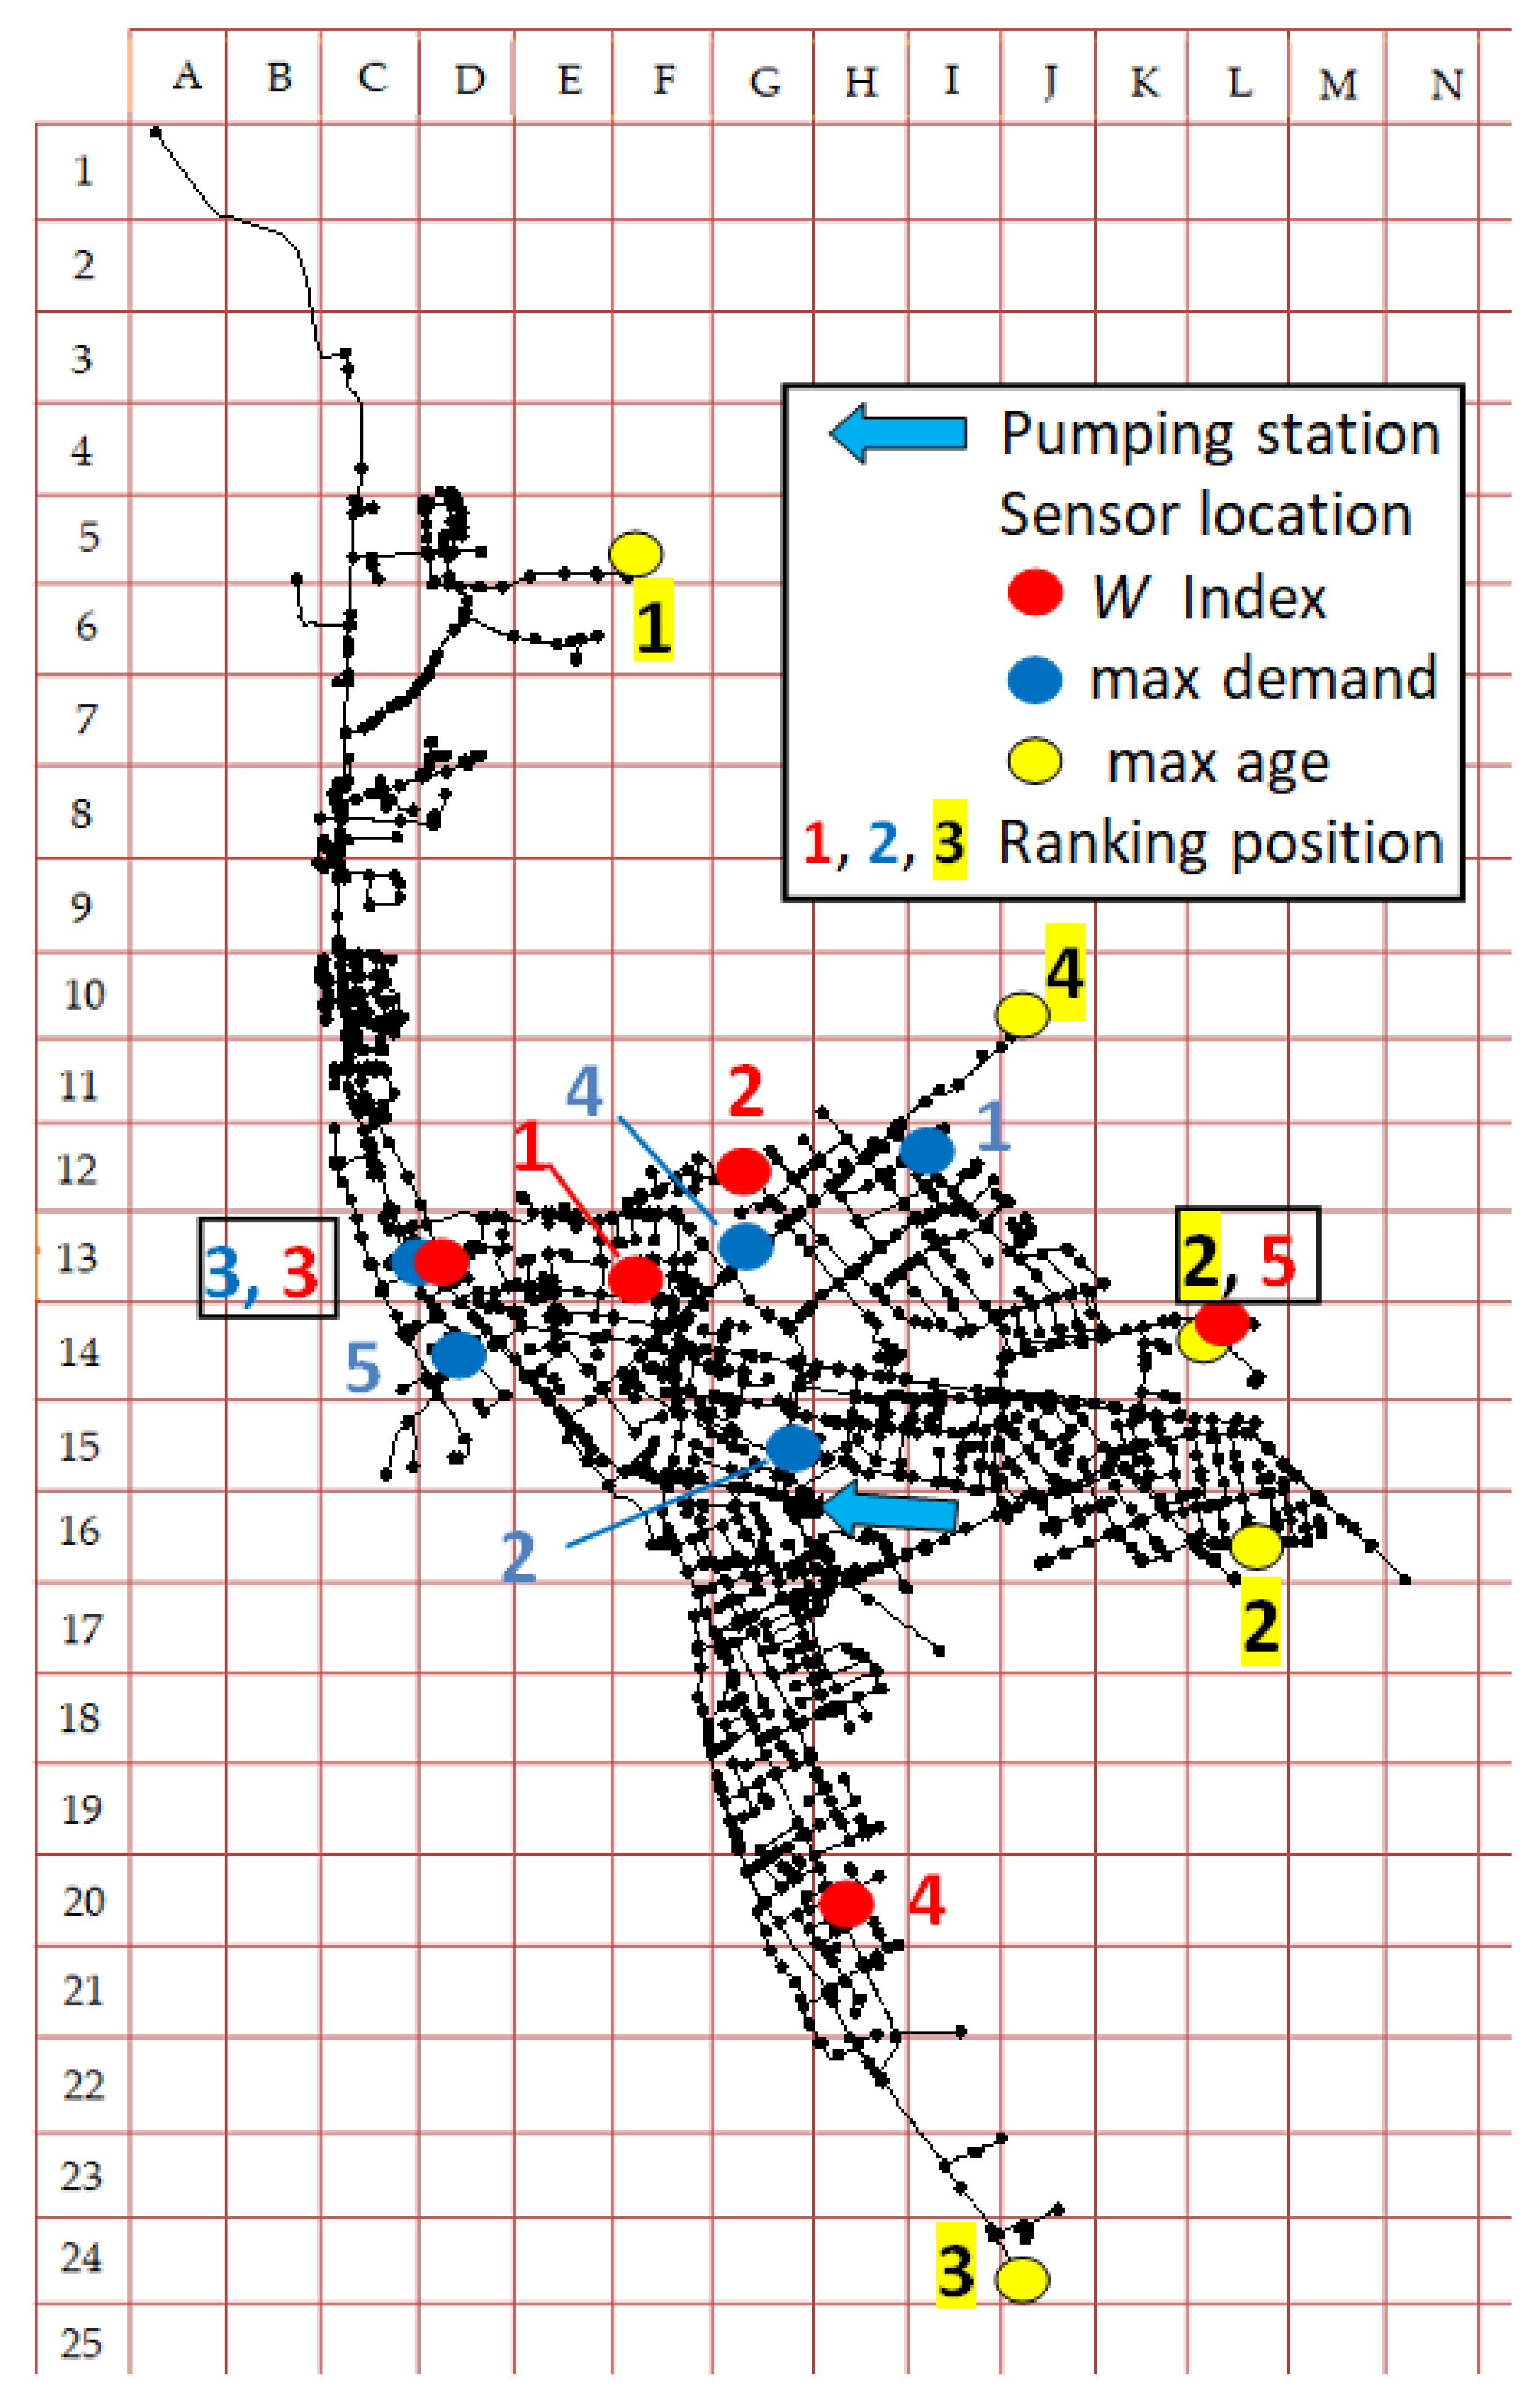
| Sensor Placement, Ranking Position | W Index Method | Maximum Water Demand Method | Maximum Water Age Method |
|---|---|---|---|
| 1 | F13 | I12 | F5 |
| 2 | G12 | G15 | L14 |
| 3 | D13 | D13 | J24 |
| 4 | H20 | G14 | J10 |
| 5 | L14 | D14 | L16 |
| Method | Number of Residents Outside Monitoring, M | Maximum Water Age, h |
|---|---|---|
| Significance index W | 12,433 | 26.0 |
| According to base demand | 15,800 | 11.0 |
| According to water age | 3406 | 96.0 |
© 2020 by the authors. Licensee MDPI, Basel, Switzerland. This article is an open access article distributed under the terms and conditions of the Creative Commons Attribution (CC BY) license (http://creativecommons.org/licenses/by/4.0/).
Share and Cite
Beata, K.; Dariusz, K.; Ewa, H. Fractal-Heuristic Method of Water Quality Sensor Locations in Water Supply Network. Water 2020, 12, 832. https://doi.org/10.3390/w12030832
Beata K, Dariusz K, Ewa H. Fractal-Heuristic Method of Water Quality Sensor Locations in Water Supply Network. Water. 2020; 12(3):832. https://doi.org/10.3390/w12030832
Chicago/Turabian StyleBeata, Kowalska, Kowalski Dariusz, and Hołota Ewa. 2020. "Fractal-Heuristic Method of Water Quality Sensor Locations in Water Supply Network" Water 12, no. 3: 832. https://doi.org/10.3390/w12030832
APA StyleBeata, K., Dariusz, K., & Ewa, H. (2020). Fractal-Heuristic Method of Water Quality Sensor Locations in Water Supply Network. Water, 12(3), 832. https://doi.org/10.3390/w12030832


