Abstract
The paper analyses changes in potential evaporation E0 (mm) in north-western Poland in the years 1952–2018. E0 (mm) has been calculated according to Ivanov’s formula based on the monthly values of air temperature (t, °C) and relative air humidity (f, %) for six weather stations of the Institute of Meteorology and Water Management. The data were collected using the Statistica software ver. 13 and the QGIS software ver. 3.80. The results indicate statistically significant trends in the increase of E0 during the period 1952–2018, and that it is particularly high during the spring and summer months, which should be associated with a statistically significant increase in air temperature and a decrease in relative humidity at all examined stations. The results also indicate an exceptionally high increase in evaporation since the end of the 20th century and in the 21st century, which reflects a potentially higher risk of permanent changes in hydrological conditions. The research results point to the major role of climatic factors in the often-dramatic decreases in water resources observed in the 21st century, particularly in lakes and small watercourses. The progressing reduction of water resources may cause permanent changes in physical and chemical conditions in waterbodies.
1. Introduction
Hydrological systems are highly sensitive to any changes in the natural environment, and in particular to changes in climatic conditions [1,2,3,4,5]. Processes in catchment areas are shaped by multiple factors that coexist and interact with one another, as well as generating feedbacks. Evaporation is one of the key elements affecting water circulation processes in catchment areas. Considering the increase in air temperature recorded since the mid-20th century in many areas around the globe [6,7], the problem of the impact of climate changes on both the quantity and quality of water resources is becoming significant, both in terms of their ecological [8,9,10,11] and economic role [12,13].
Climatic changes recorded at a global scale are also visible in Poland, where since the 1950s there has been a statistically significant increase in the average annual air temperature; the rate of this warming has slightly exceeded 0.2 °C per 10 years [14,15,16]. Research to date indicates that the air temperature increase in Poland increased the frequency of negative climatic balances in the growing season [1], as well as increasing the range of the dry zone, which is defined as areas where the climatic balance ranges from −90 mm to −120 mm [17]. Studies of 893 lakes from the lakeland area indicate a tendency to shrink in lakes’ surface area over the second half of the 20th century, which is linked among other things to a lowering of the water level [18]. On the other hand, there has been no clear relationship observed between the increase in air temperature and the outflow of major rivers [19,20], whose long-term variability is associated with the NAO (The North Atlantic Oscillation) [19]. However, other authors pointed to reduced underground outflow in the second half of the 20th century [21], changes in seasonal outflows [22,23] or a reduction of total outflow within smaller catchment areas [24] or certain regions of Poland [25]. At the same time, the modelling of future climatic conditions and of river outflows has indicated a high probability that the outflow structure will change in the 21st century due to the air temperature increase and changes in the seasonal structure of atmospheric precipitation [26,27].
The results of outflow modelling studies, as well as the predicted further increase in air temperature in the 21st century [28,29,30], indicate a need to analyse the determinants of the water balance of waterbodies and catchment areas. The main objective of the presented paper is to analyse changes in evaporation from free water surfaces (potential evaporation) E0 (mm) in north-western Poland in the years 1952–2018. The research was aimed at determining the temporal trends of E0 and the nature of the temporal and spatial variability of evaporation. Taking into account the significant share of lakes, river valleys and wetlands in the analysed region, it is apparent that the subject of potential evaporation and its changes related to climatic fluctuations can significantly contribute to considerations of catchments’ changes in outflow and their susceptibility to a sustained limitation of water resources. Permanent lowering of the water table in lakes, including the shallowing of waterbodies due to their filling with sediment, may cause lasting changes in the physical and chemical parameters of water. These parameters depend on, among other things, the occurrence of water mixing, while the temperature of water in particular parts of waterbodies affects the rate and directions of, e.g., the processes of oxidation and reduction of organic matter.
2. Materials and Statistical Methods
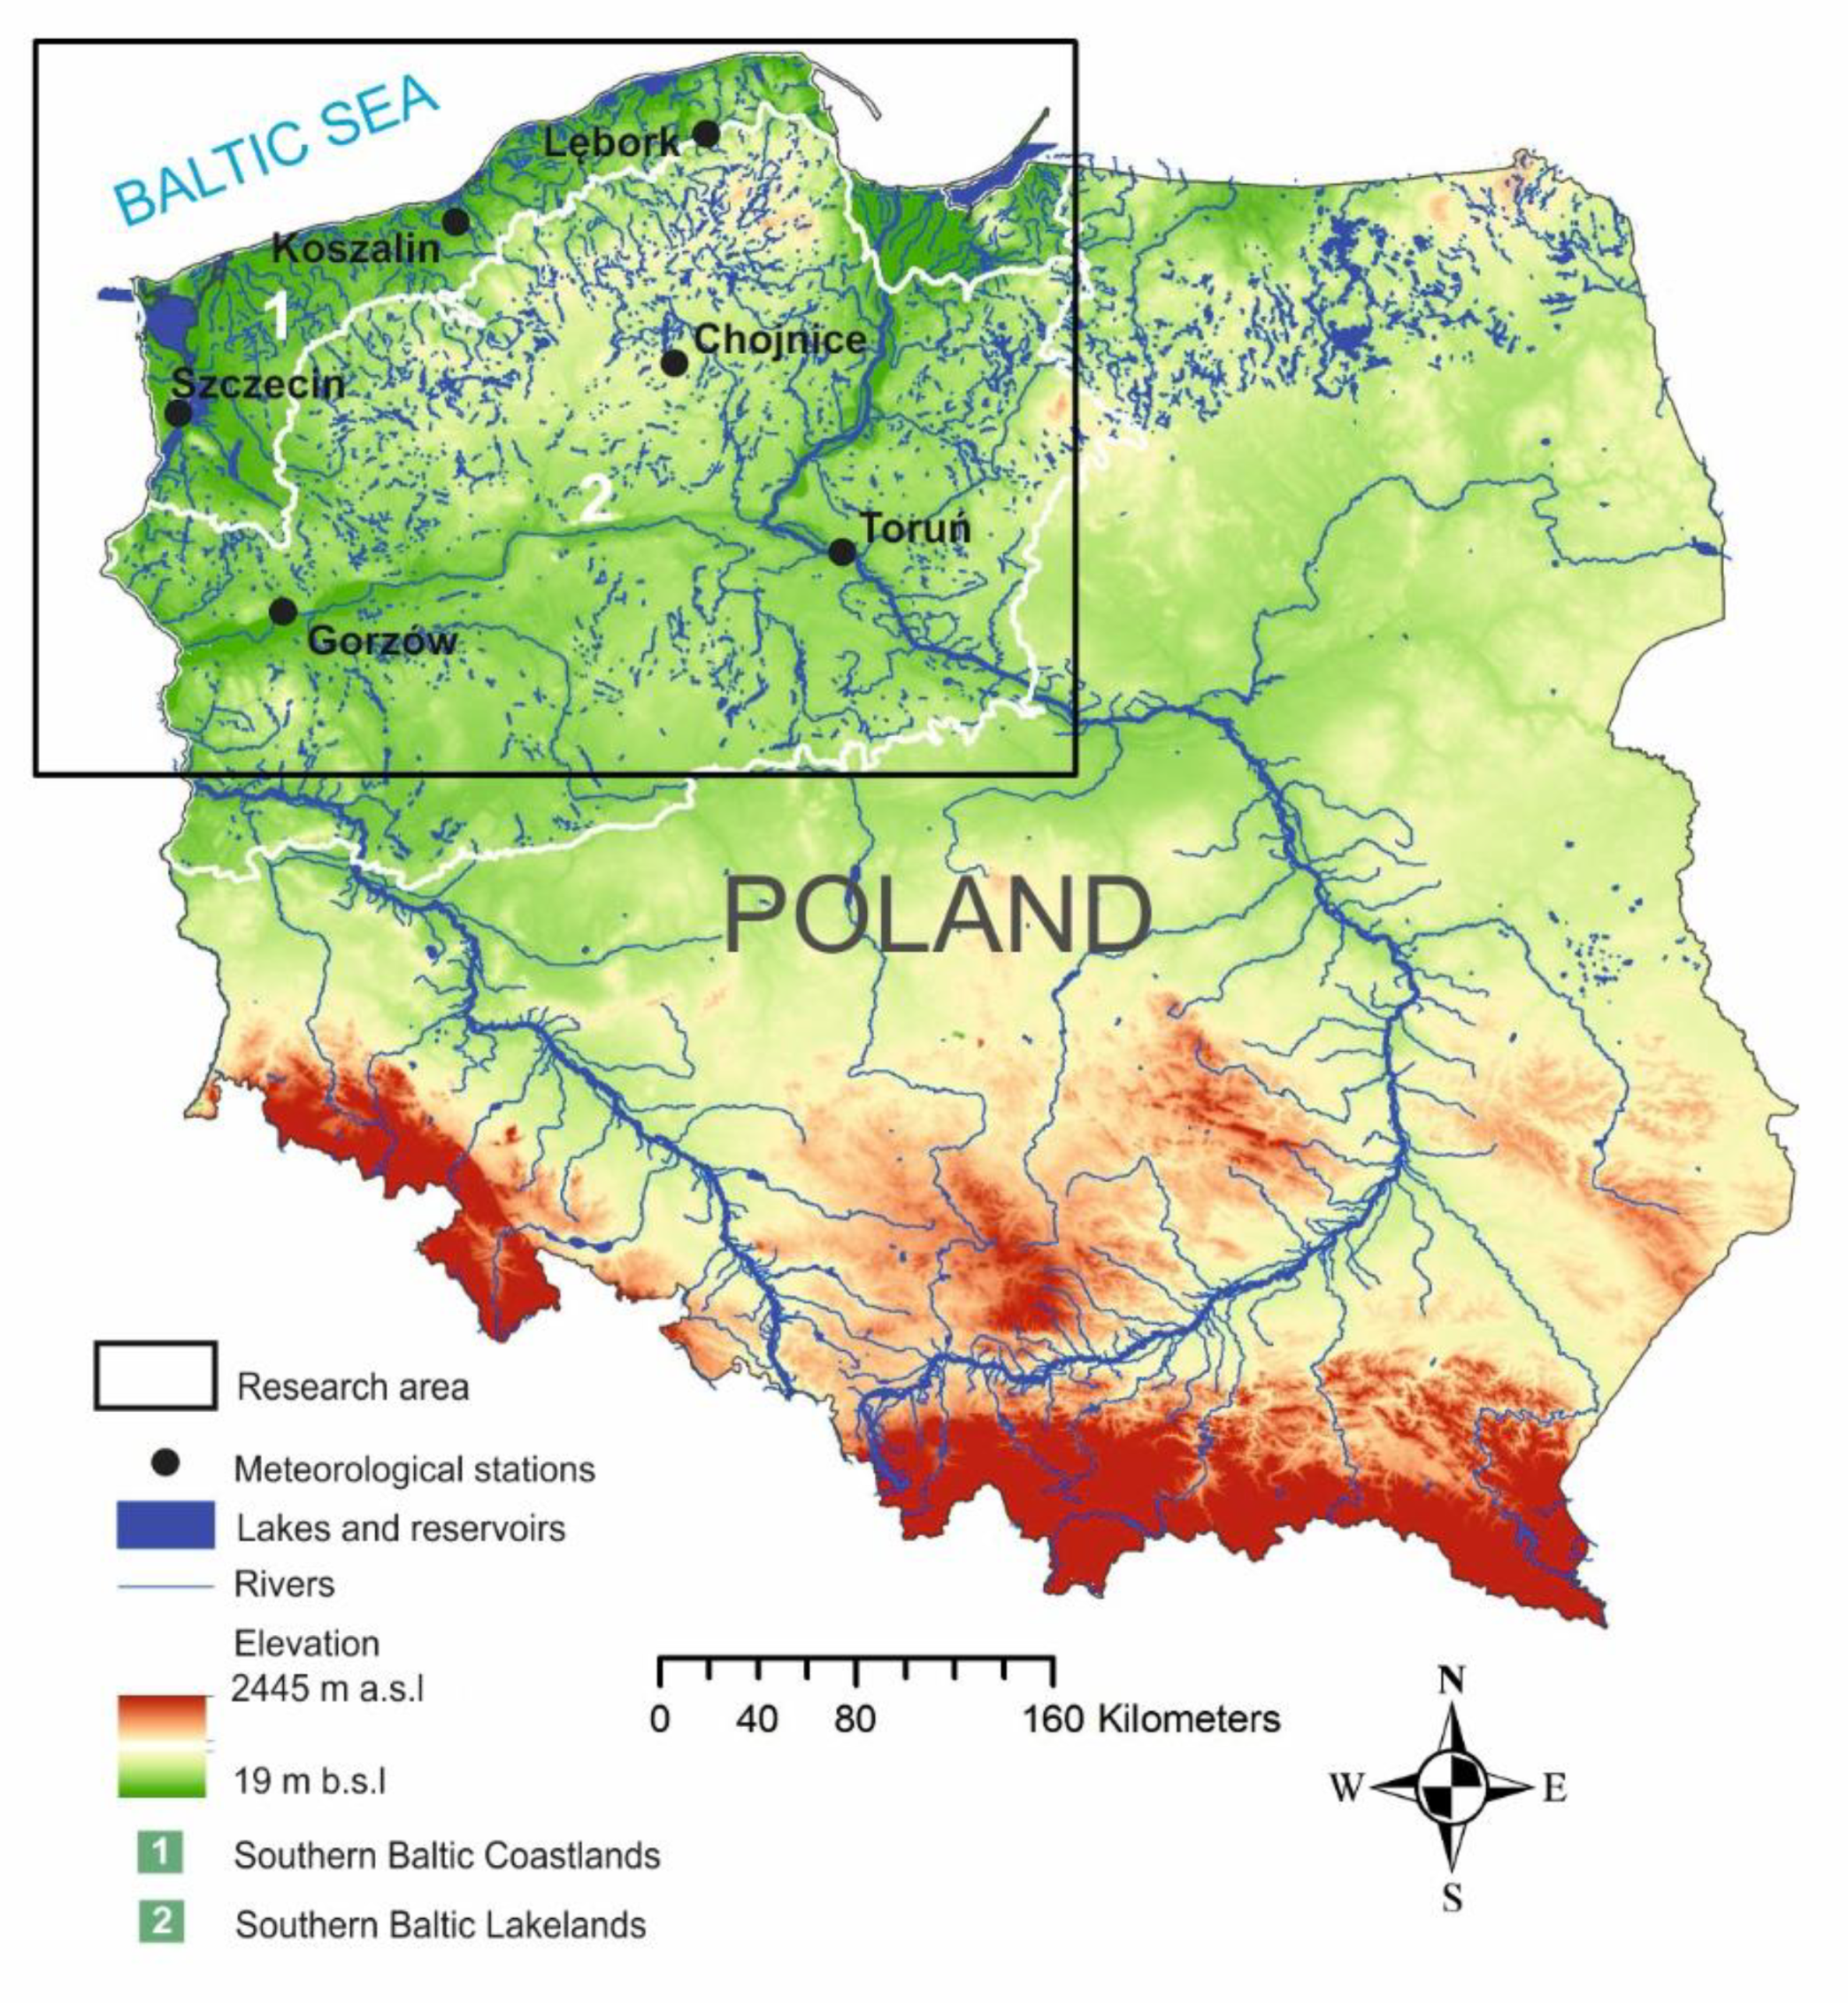
The studied area includes the Southern Baltic Coastlands and a fragment of the Southern Baltic Lakelands to the west of the Vistula river [31] (Figure 1), which are characterised by post-glacial land relief. The landscape of the former of these regions consists of the coastal strip with river mouths, and morainic uplands cut by a network of small glacial valleys usually lying below 100 m a.s.l., as well as a few hills exceeding this height. The Southern Pomeranian Lakelands are characterised by the occurrence of young glacial landscapes with a high number of hollows without outflow and numerous lakes [31], as well as outflow networks of a polygenetic nature [32]. In the studied area, and in particular within the lakelands, lakes constitute an important component of the water network. In this case, the significance of lakes results not just from the amount of space they occupy, but also from their relation to the river network. Lakes with a drainage or flow-through nature often constitute groundwater windows and serve an important function in shaping both the outflow from catchment areas [33,34,35,36] and water quality [34]. At the same time, recent research indicates that smaller waterbodies, including anthropogenic ones, can play a role in shaping the river outflow [37,38,39].
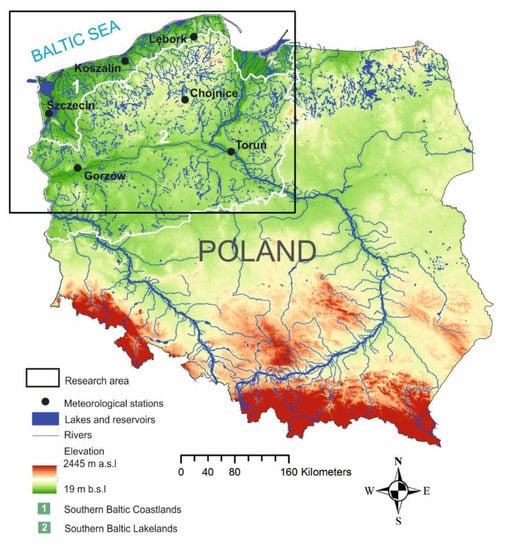
Figure 1.
Research area shown in relief, with monitoring stations shown in relation to water network (prepared based on [40,41,42]).
The changes in evaporation from free water surface in the regions of north-western Poland described above were studied based on average monthly air temperatures (t, °C) and relative air humidity (f, %) for the years 1952–2018. The calculations used data from national weather monitoring shared by the Polish Institute of Meteorology and Water Management—National Research Institute [43]. The studies included six selected weather stations (Table 1), with a known continuous series of air temperature and relative air humidity values for the whole examined period (a total of 67 years). The monthly values of the weather parameters were studied in terms of their homogeneity by means of von Neumann’s test, which in most cases confirmed the homogeneity of data series. Three of the chosen weather stations (Szczecin, Koszalin, Lębork) are within the Southern Baltic Coastlands, and the other three (Gorzów, Chojnice, Toruń) are within the Southern Baltic Lakelands.

Table 1.
Geographic position of weather stations [43,44].
Based on the output data, monthly values of air temperature (t, °C), relative air humidity (f, %) and sums of evaporation from the water surface (E0, mm) were calculated for the years 1952–2018. Calculations were made according to Ivanov’s formula, with the following form [1,45]:
wherein E0—sum of potential evaporation (mm); t—air temperature (°C); f—relative air humidity (%).
The average sums of evaporation, standard deviation and the minimum and maximum values were calculated for both the individual months and the warm and cold half-years. Because the hydrological summer half-year (May–October) and winter half-year (November–April) used for data statistics are different than those used in meteorology (meteorological summer is June–August and meteorological winter is December–February), calculations were made for all four periods. The minimum and maximum values have been calculated as the lowest and highest monthly, semi-annual and annual values from the years 1952–2018 for a given station. Plots were also prepared for long-term changes in annual sums of evaporation, with data from the hydrological year, which runs from November until October. Changes in air temperature, relative humidity and evaporation in the studied period of 1952–2018 were analysed using linear regression. The linear trends of changes in analysed parameters have been calculated by least squares method [46] to characterise changes in temperature, humidity and evaporation. The presented rises and falls in the study parameters indicate a change in the 1952–2018 study period, which is estimated using the linear regression equation y = ax + b. The resulting linear trend values were investigated in terms of statistical significance by means of the parametric Student’s t-test at a significance level of 0.05. Furthermore, maps of the spatial distribution of annual and semi-annual sums of evaporation were prepared for the years 1952–1980, 1981–2000 and 2001–2018 by means of a multi-level B-spline algorithm for spatial interpolation. These periods were selected after a preceding analysis of changes in evaporation over time. A preliminary analysis of the annual course of evaporation established no clear trend in evaporation conditions in 1952–1980. After 1981 the beginnings of an increase in evaporation were visible, and this accelerated from 2001 onwards. The variability of air temperature and relative air humidity was also analysed for the study period in order to determine the relationship between the variability of components considered in the calculations of E0 and the calculated value of evaporation. For this purpose, the coefficient of variation (Cv) for t, f and E0 was calculated for the periods 1952–1980, 1981–2000 and 2001–2018:
wherein Cv—coefficient of variation, S—standard deviation, x—arithmetic average.
Linear trends were analysed for monthly and annual values of air temperature and relative air humidity, along with the variability of said parameters in the study period of 1952–2018. Calculations were performed in the Statistica software, ver. 13, while the maps were prepared using the Quantum GIS software, version 3.80 Zanzibare.
3. Results
The climate of the study area is spatially diverse (Table 2 and Table 3). The Southern Baltic Coastlands, being under the influence of the Baltic Sea, are characterised by relatively mild winters and moderately hot summers [31]. The average annual air temperature in the years 1952–2018 within the Southern Baltic Coastlands ranged between 8.0 °C and 8.8 °C, while in the summer (VI–VIII) it did not exceed 17.5 °C and in the winter (XII–II) it did not drop below −0.5 °C (Table 2). Average annual relative air humidity in the years 1952–2018 amounted to approximately 81%; in summer, it dropped to 75–78%, while in winter, it rose to approximately 86% (Table 3). The climatic conditions of the Southern Baltic Lakelands are more temporally diverse than those of the Southern Baltic Coastlands [47]. The average annual air temperature in the Southern Baltic Lakelands in the years 1952–2018 ranged between 7.4 °C and 8.7 °C, with the mean ranging from 16.4 °C to 17.7 °C for summer months (VI–VIII) and from −0.2 °C to −1.6°C for winter months (XII–II) (Table 2). The relative humidity in the Lakelands was slightly more diverse compared to the Coastlands, and amounted to an average of 78.9% to 82.1% in the year, 72–75% in the summer, but from almost 75.0% to 89.7% in the winter (Table 3).

Table 2.
Average monthly, semi-annual and annual values of air temperatures (°C) in the studied stations, 1952–2018 (calculated based on data obtained from the Polish Institute of Meteorology and Water Management—National Research Institute [43]).

Table 3.
Average monthly, semi-annual and annual values of relative humidity (%) in the studied stations, 1952–2018 (calculated based on data obtained from the Polish Institute of Meteorology and Water Management—National Research Institute [43]).
3.1. Changes in the Studied Climatic Parameters in the Years 1952–2018
3.1.1. Air Temperature
In the years 1952–2018, a positive trend of air temperature was recorded at all studied stations, in terms of both annual and monthly values (Table 4). The highest increase in average annual temperature during the study period 1952–2018 was recorded in Koszalin and Toruń—at slightly more than 2.0 °C per 67 years (0.31 °C per 10 years). The smallest increase in average annual temperature occurred in Lębork, amounting to just 1.6 °C per 67 years (0.24 °C per 10 years). It should be pointed out that the resulting changes in average annual air temperature at all analysed stations were statistically significant at a level of 0.05.

Table 4.
Monthly and annual values of air temperature (°C) changes calculated from linear regression equations, 1952–2018 (bold font indicates values that are statistically significant at a level of 0.05) (calculated based on data obtained from the Polish Institute of Meteorology and Water Management—National Research Institute [43]).
Over the course of a year, the highest (compared to other months of the year) statistically significant increase in air temperature over the years 1952–2018 was observed in the period from February to May. The highest increases in air temperature occurred in February and April, when they reached or even exceeded 3.0 °C per 67 years (Table 4). The highest increase in monthly air temperature in the years 1952–2018 among all stations was recorded for February in Toruń, where the air temperature increase reached 3.6 °C per 67 years. For the summer months (July–September), an upwards trend in air temperature was observed that was slightly less than that seen for the winter–spring period, although it was also statistically significant. In these months, the increase in air temperature ranged from 1.2 °C to 2.7 °C during the years 1952–2018. The lowest increase in air temperature—of a magnitude not exceeding 1.0 °C per 67 years—took place in October (Table 4).
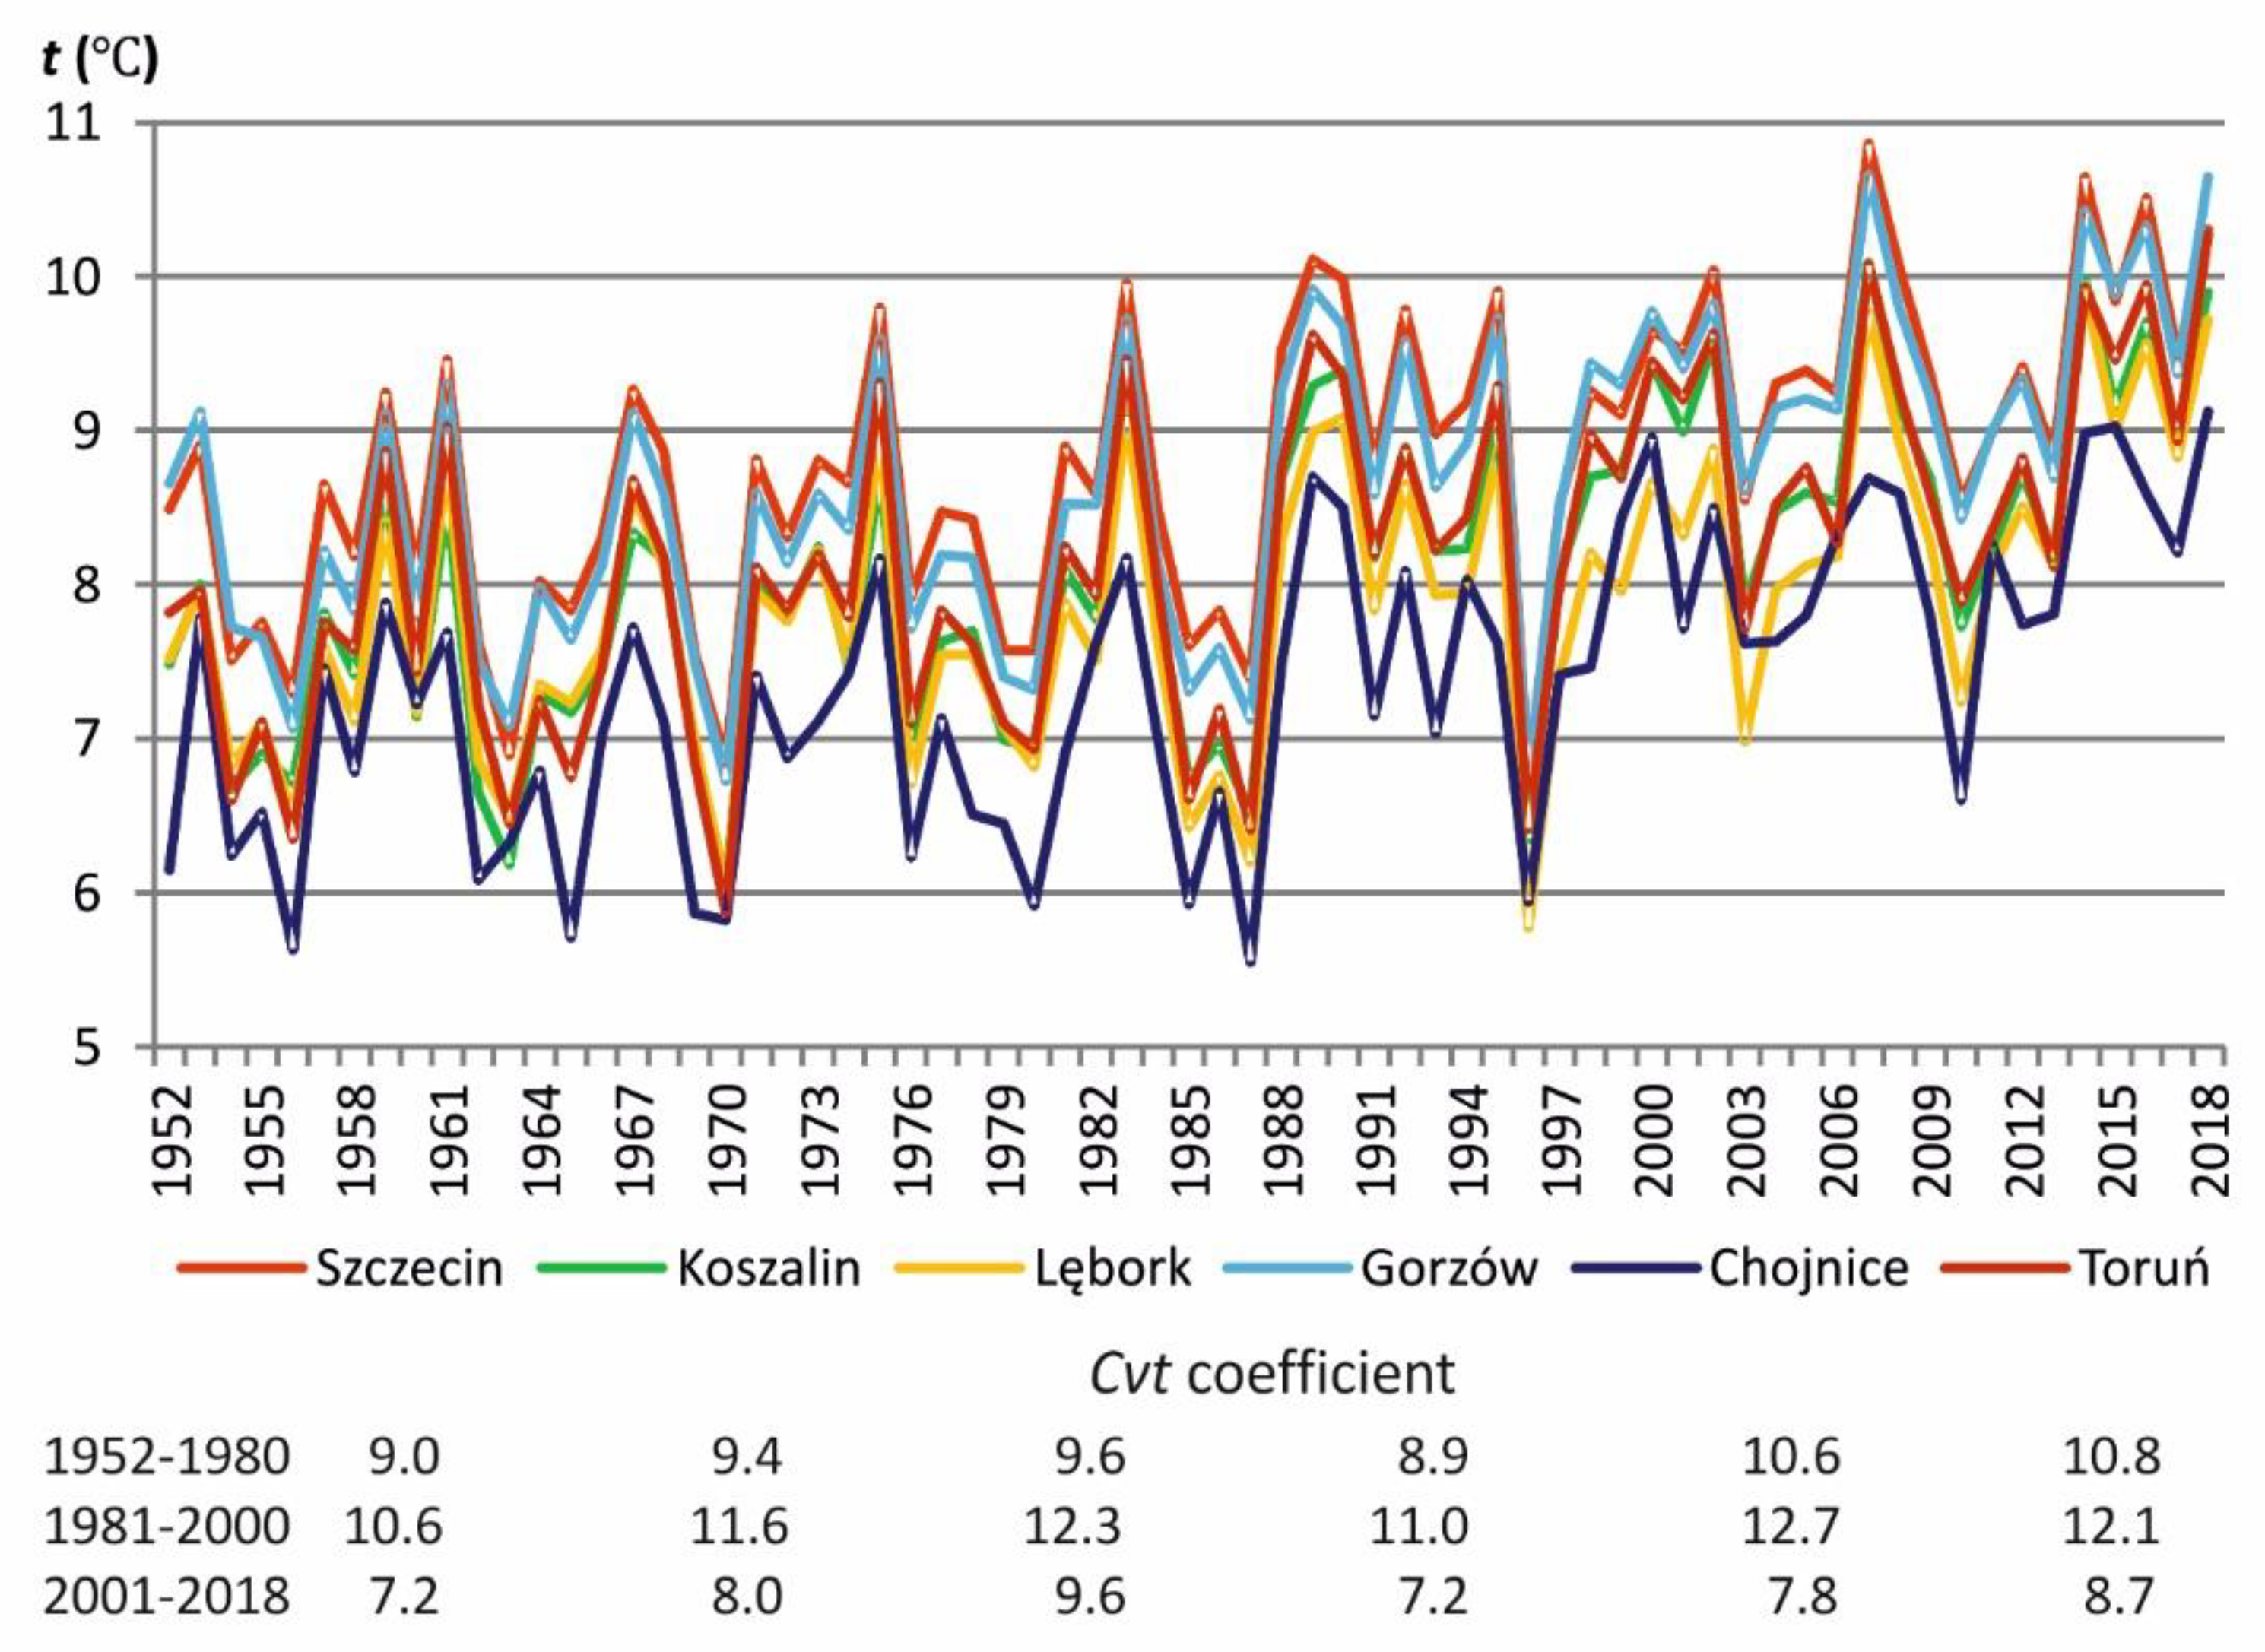
Apart from exhibiting an upward trend that has been particularly intense since the 1990s, long-term changes in annual air temperature are also characterised by the occurrence of alternating years of rising and falling temperatures (Figure 2). Particularly low average annual air temperatures occurred in the years 1956 (5.6 °C–7.3 °C), 1970 (5.8 °C–6.8 °C) and 1987 (5.6 °C–7.4 °C). In the last 30 years of the study period, in spite of a general upwards trend, there were also years with low average annual air temperatures, including in particular 1996 (5.8 °C–6.8 °C) and 2010 (6.6 °C–8.5 °C). On the other hand, the last five years had the highest values of air temperature of the whole study period (8.2 °C–10.7 °C) (Figure 2). Therefore, in the period 2001–2018, the coefficient of air temperature variation (CvT) was lowest, as compared to 1952–1980 and 1981–2000. Conversely, CvT was highest in the years 1981–2000 at all researched meteorological stations.
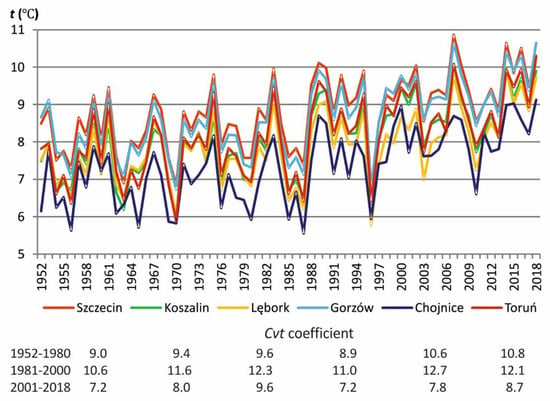
Figure 2.
Long-term changes in average annual air temperatures (t, °C) and coefficient of t variation (Cvt, %) in studied stations (1952–2018) (prepared based on data obtained from the Polish Institute of Meteorology and Water Management—National Research Institute [43]).
3.1.2. Relative Humidity
In the study period 1952–2018, the average annual values of relative air humidity at most stations exhibited a statistically significant negative trend (Table 5). The largest drop in relative humidity among all stations, amounting to 4.0% per 67 years, took place in Toruń. The lowest, albeit statistically insignificant, negative trend of relative humidity was recorded in Lębork. April and August were the months with the highest (compared to the other months) drop in relative humidity in the years 1952–2018. During these months, air humidity dropped by 5% per 67 years at almost all stations. The highest drop in relative air humidity was recorded in Toruń and Chojnice in April, as well as in Gorzów in August, where in the years 1952–2018 humidity dropped by the respective values of 9.7%, 8.8% and 8.7%. In November and December, there was an increase in relative humidity of atmospheric air, with its highest value of 4.3% per 67 years occurring in Lębork in November (Table 5).

Table 5.
Monthly and annual values of relative humidity (%) changes calculated from linear regression equations, 1952–2018 (bold font indicates values that are statistically significant at a level of 0.05) (calculated based on data obtained from the Polish Institute of Meteorology and Water Management—National Research Institute [43]).
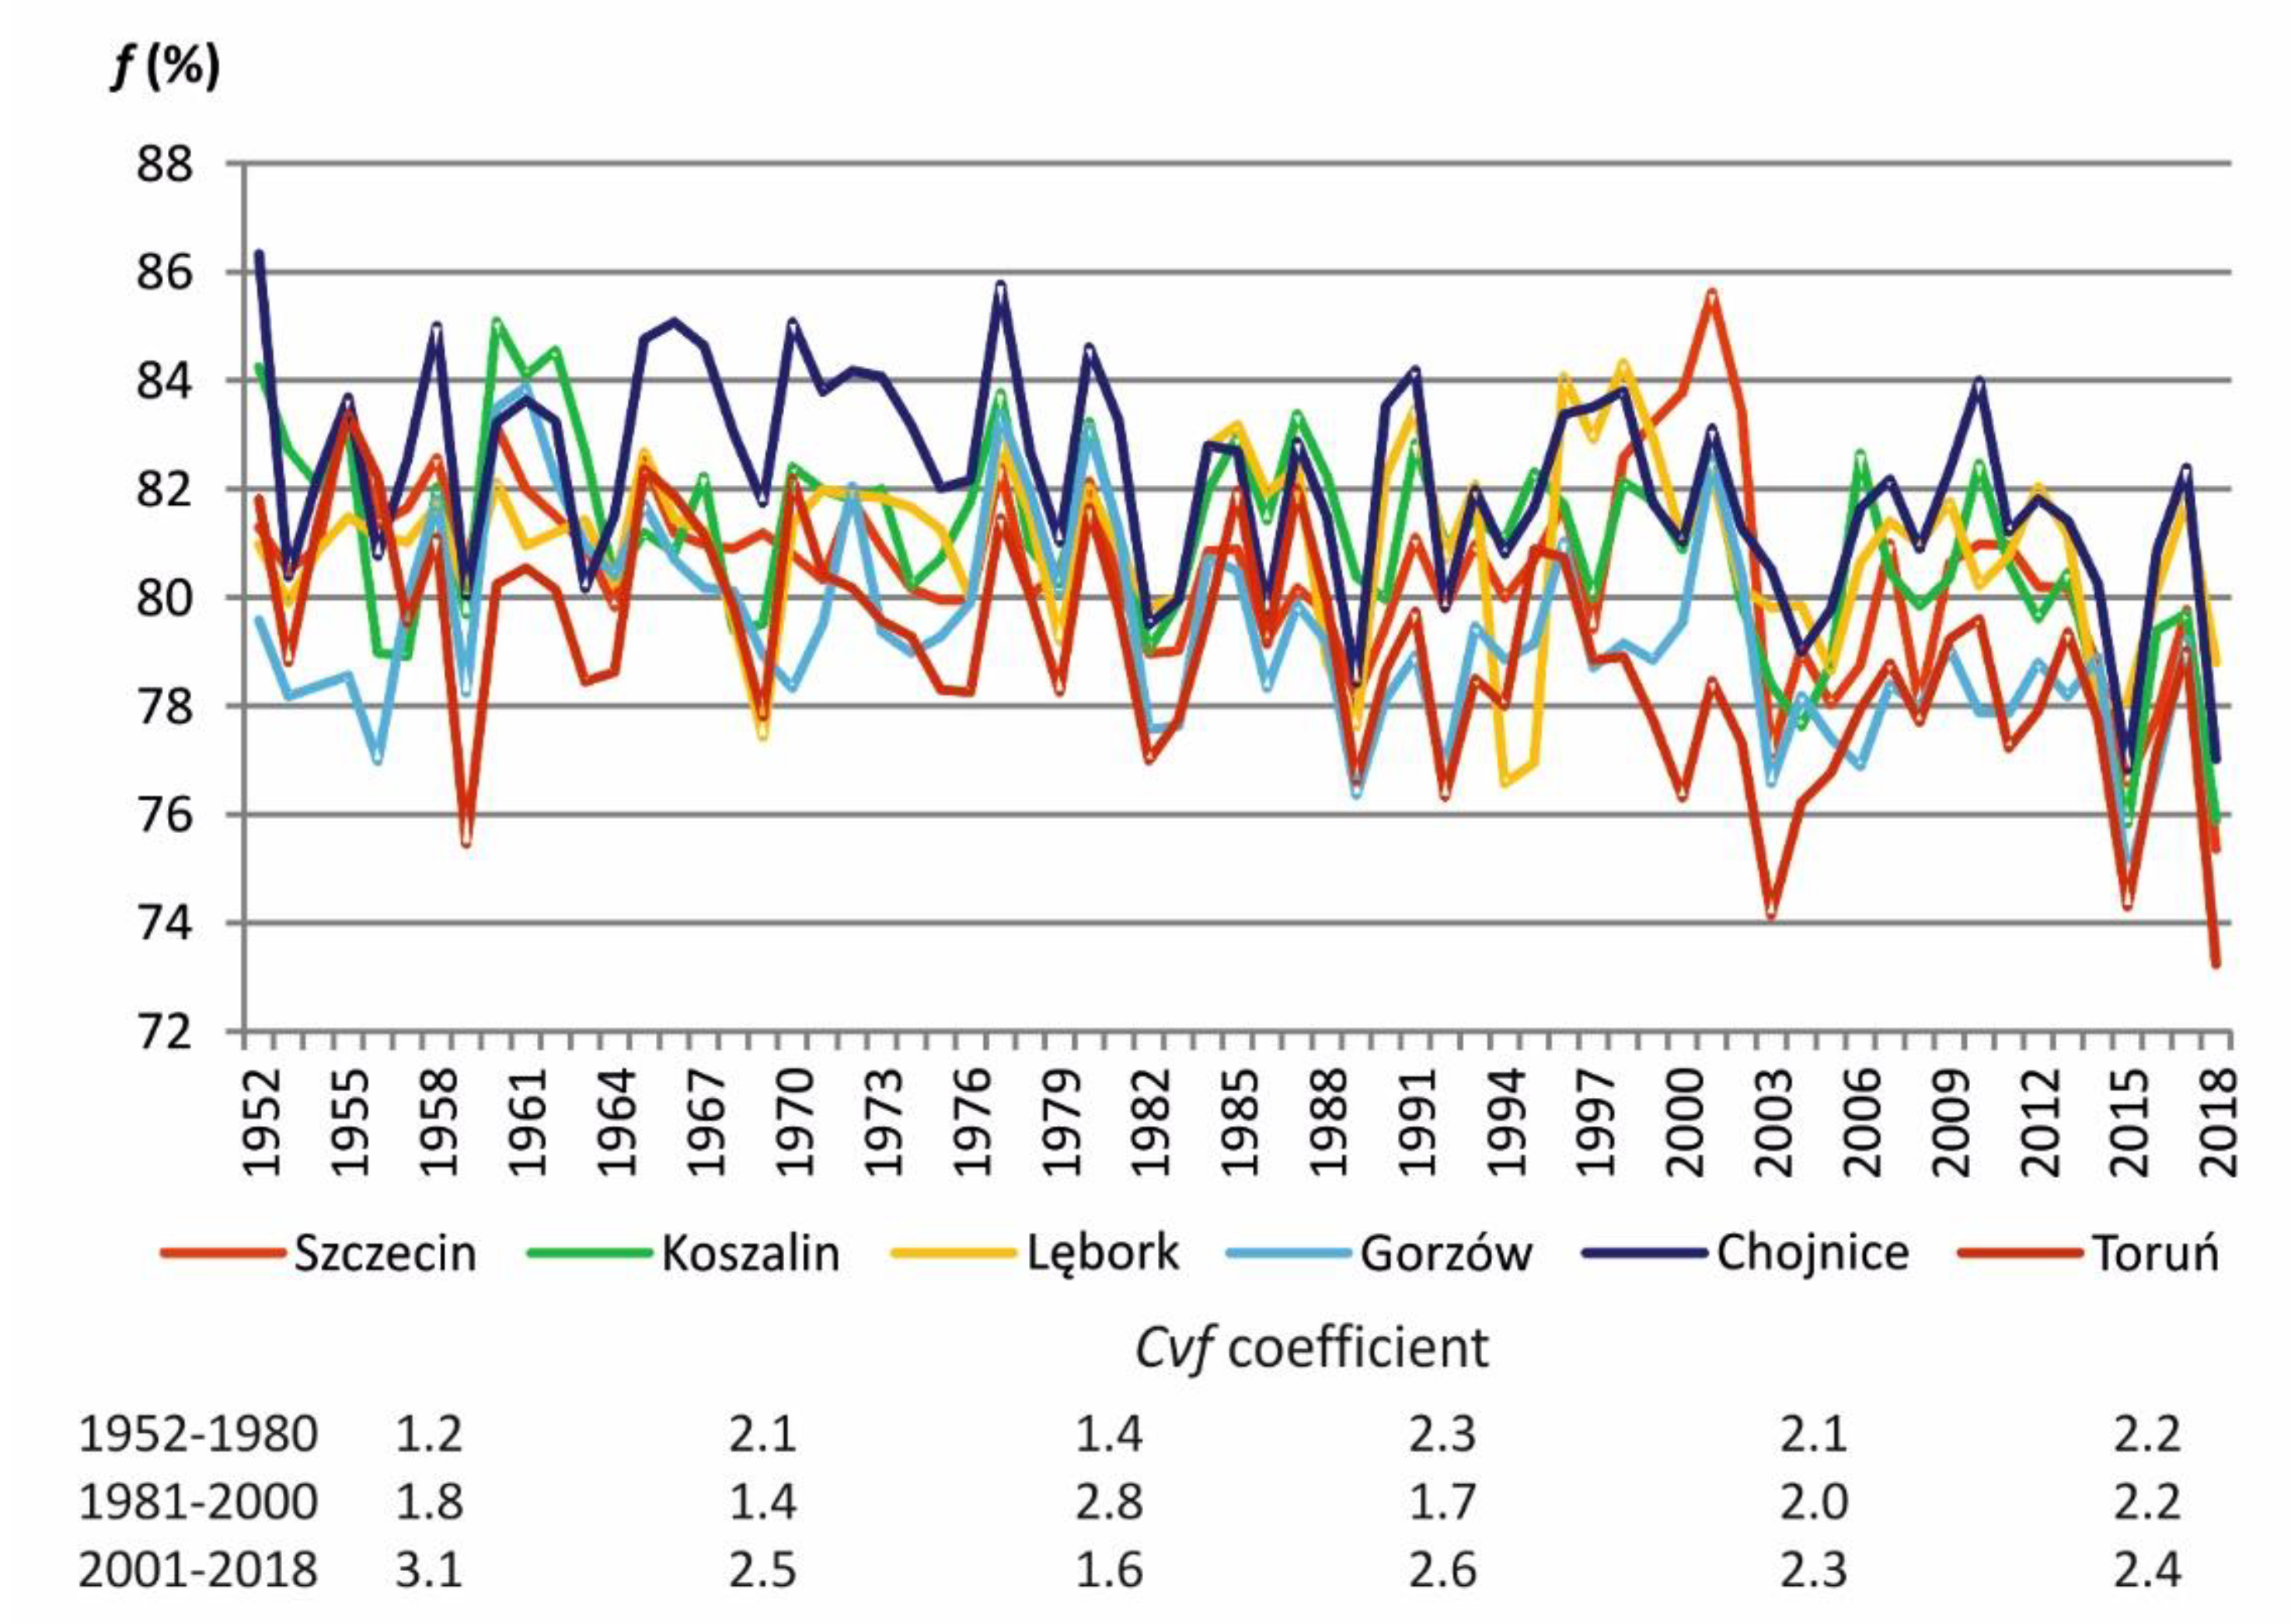
With a general downward trend, the long-term changes in relative air humidity in north-western Poland exhibit considerable fluctuations between individual years. Particular attention should be paid to the fact that the final years of the 1952–2018 period feature the lowest values of relative humidity, which means a noticeable recent deterioration in humidity conditions compared to those recorded in the mid-20th century (Figure 3). The coefficient of relative humidity variation (Cvf) calculated for the three consecutive periods 1952–1980, 1981–2000 and 2001–2018 does not show the same changes at all researched stations. In Szczecin, Cvf increases in successive periods (Figure 3). However, in Koszalin, Lębork and Gorzów relative humidity variation was lowest in the years 1981–2000, compared to earlier and later periods, whereas in Chojnice and Toruń, no significant differences in Cvf were recorded.
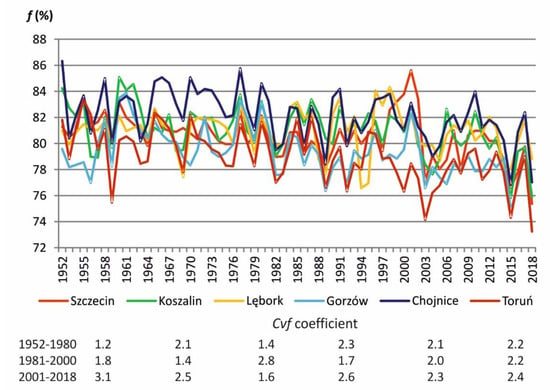
Figure 3.
Long-term changes in the average annual values of relative air humidity (f, %) and coefficient of f variation (Cvf, %) in the studied stations (1952–2018) (prepared based on data obtained from the Polish Institute of Meteorology and Water Management—National Research Institute [43]).
3.1.3. Potential Evaporation
Average sums of evaporation in the analysed stations in the years 1952–2018 ranged from 480.5 mm in Chojnice to 595.1 mm in Gorzów (Table 6). The low level of evaporation in Chojnice was primarily determined by the winter half-year value, which was the lowest and amounted to only 112.4 mm (30.0 mm during the meteorological winter season—XII–II), while 149.2 mm was recorded in the station with the highest value of evaporation for the winter half-year, i.e., in Szczecin (46.7 mm during the meteorological winter season). In the summer half-year (V–X), average evaporation in Chojnice was not the lowest of the studied stations, as it amounted to approximately 368 mm. Slightly lower values were recorded in Koszalin and Lębork, with Koszalin having the lowest evaporation, at only 345.8 mm (201.2 mm during the meteorological summer season—VI–VIII). In the summer half-year, the highest evaporation occurred in Gorzów and Toruń, with average sums of approximately 448.0 mm, and 278–279 mm during the meteorological summer.

Table 6.
Monthly, annual and semi-annual characteristics of sums of evaporation (E0, mm) (1952–2018) (calculated based on t and f and data obtained from the Polish Institute of Meteorology and Water Management—National Research Institute [43]).
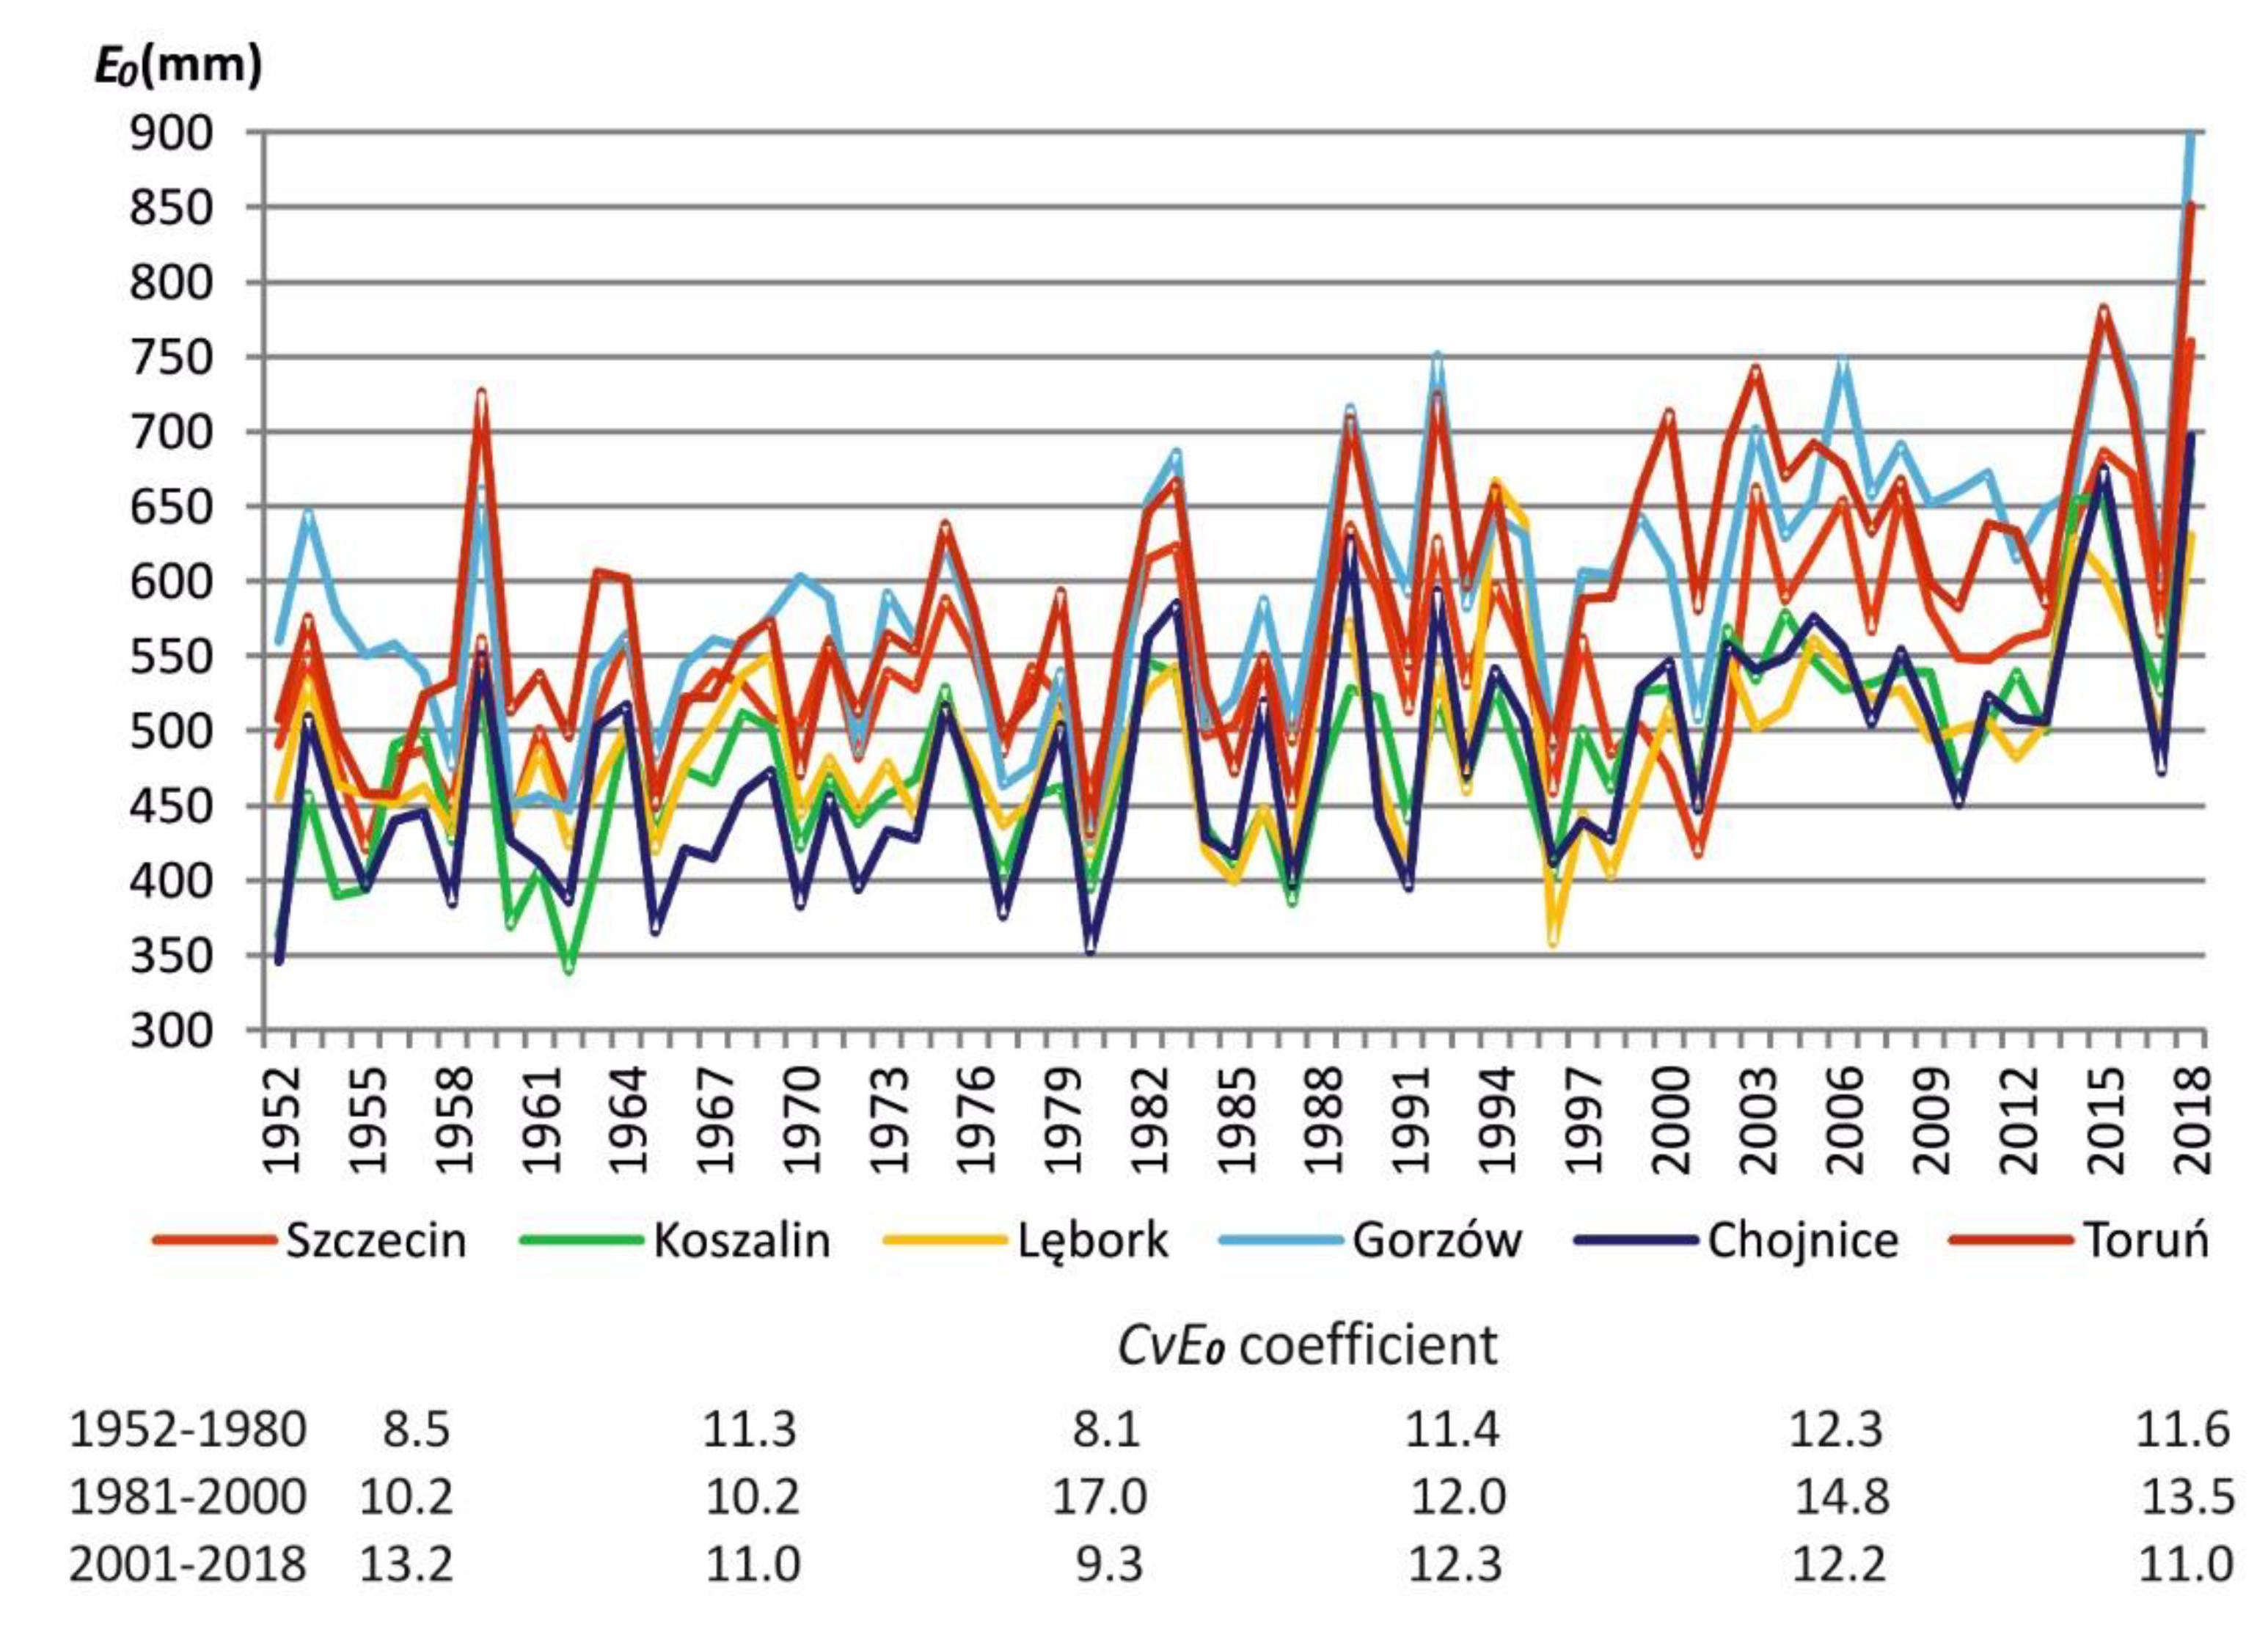
The highest annual sums of evaporation in the study period of 1952–2018 ranged from 666.6 mm to 898.3 mm, and occurred in 2018 in all stations except Lębork (Table 6, Figure 4). During the study period, the highest annual evaporation was in Gorzów, where, at the same time, monthly evaporation was highest compared to the other stations and amounted to 203.2 mm (in July 2000). The lowest annual evaporation values recorded in the years 1952–2018 ranged from 339.1 (Koszalin in 1962) to 431.1 mm (Toruń in 1980).
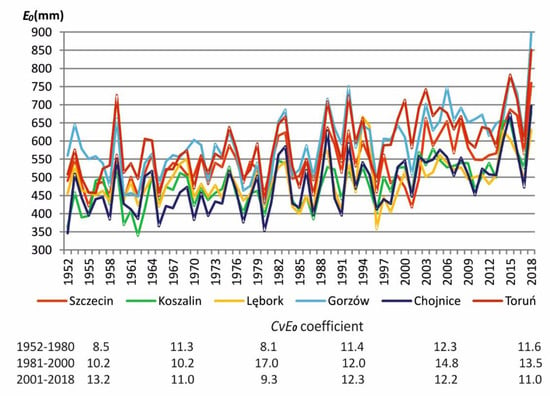
Figure 4.
Long-term changes in annual sums of evaporation (E0, mm) and coefficient of E0 variation (CvE0, %) in the examined stations (1952–2018) (calculated based on t and f and data obtained from the Polish Institute of Meteorology and Water Management—National Research Institute [43]).
Among the analysed months, evaporation was lowest in January and December, especially in Chojnice, where the average values did not exceed 10.0 mm (Table 6). During that time, evaporation in the remaining stations amounted to slightly above 12.0 mm. The highest sums of evaporation were recorded in June (67.2–94.3 mm) and July (67.3–96.6 mm), and the highest value was recorded in Gorzów. Evaporation was lowest in December.
The calculated standard deviation reveals the considerable variability of evaporation conditions, particularly in Gorzów and Toruń, where the average standard deviation values slightly exceeded 88.0 mm, with higher instability in the summer period in all studied stations. By contrast, Lębork and Koszalin had the highest stability, with the standard deviation amounting to 61.9 mm and 67.9 mm, respectively. Among all months, December witnessed particularly stable evaporation conditions, especially in Chojnice and Toruń, while July saw high variability, particularly in Gorzów (Table 6).
Long-term changes in annual sums of evaporation indicate variation in evaporation over time, manifesting as fluctuations between years, with the largest fluctuation occurring in the years 1980–2000 (Figure 4). Since the 1990s, due to an increase in air temperature and a drop in relative humidity (Figure 2 and Figure 3), the evaporation coefficient has been clearly increasing, having reached its maximum in the final year of the study period; that is, in 2018. The coefficient of evaporation variation (CvE0) calculated for the three consecutive periods 1952–1980, 1981–2000 and 2001–2018 does not show the same changes at all researched stations. In Szczecin and Gorzów, CvE0 increases in successive periods (Figure 4). However, in Lębork, Chojnice and Toruń, evaporation variation was highest in the years 1981–2000, whereas in Koszalin, CvE0 was lowest, compared to earlier and later periods.
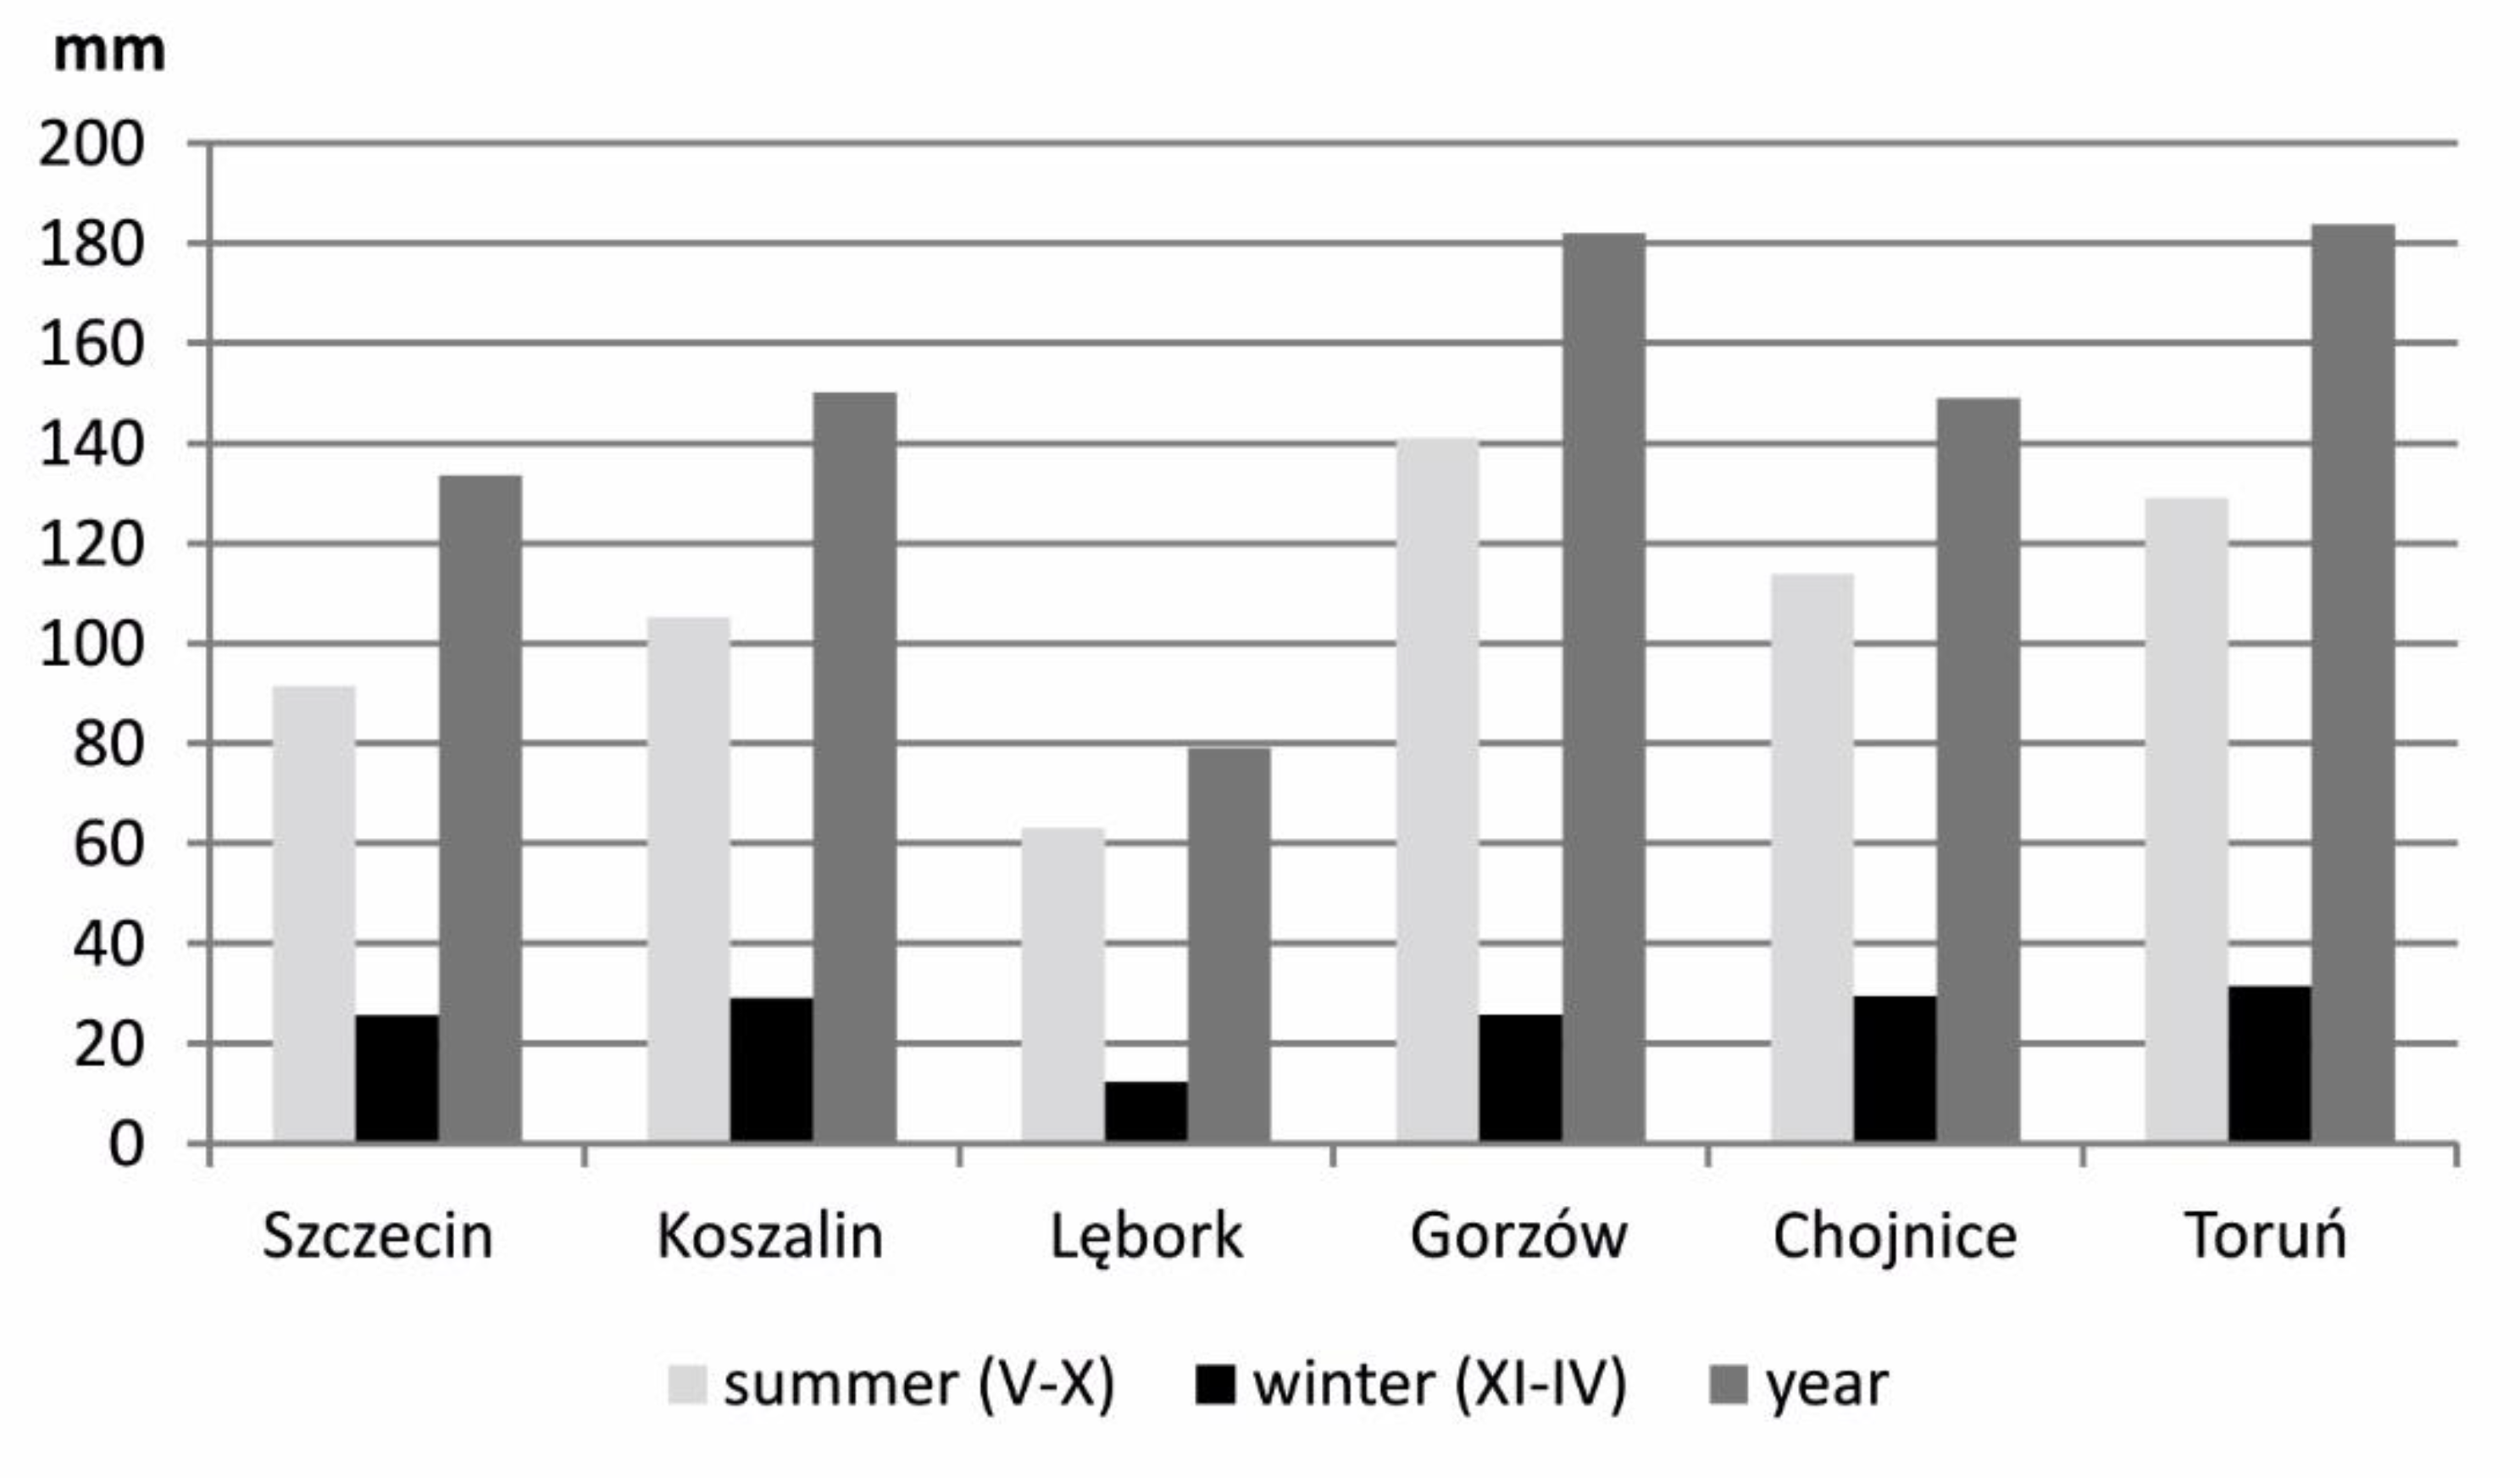
Both the annual and semi-annual trend of evaporation sums in the analysed stations in the years 1952–2018 are positive, and statistically significant at a level of 0.05, which means an increase in the intensity of evaporation in the study period. The increase in evaporation is much higher in the summer half-year (V–X). The highest annual increase in evaporation in the years 1952–2018 was recorded in Toruń and Gorzów, where in the whole studied period evaporation increased by 180.0 mm. Meanwhile, in the summer half-year the increase in evaporation reached values above 140.0 mm per 67 years. The lowest variability of evaporation conditions during the studied period was recorded in Lębork, where the annual sum of evaporation went up by 79.2 mm per 67 years, with 63.0 mm for the summer half-year. The winter half-year was characterised by a small upward trend at all of the studied stations. The intensity of evaporation in this part of the year increased by between 12.3 mm (Lębork) and 31.4 mm (Toruń) per 67 years (Figure 5).
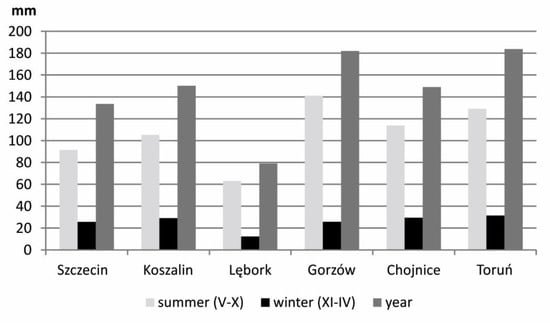
Figure 5.
Changes in annual and semi-annual evaporation sums (E0) calculated from linear regression equations in the studied stations for the years 1952–2018 (calculated based on t and f and data obtained from the Polish Institute of Meteorology and Water Management—National Research Institute [43]).
Among the individual months, the highest increase in evaporation was recorded in August, when the growth over the study period of 1952–2018 ranged from 22.6 mm (in Lębork) to 41.2 mm (in Gorzów). The trends established for summer months, as well as for the period between February and May, were in most cases statistically significant. By contrast, the winter month trends were mostly statistically insignificant, exhibiting a slight drop in evaporation in November and December (Table 7).

Table 7.
Changes in monthly evaporation sums (E0, mm) calculated from linear regression equations in the studied stations (1952–2018) (bold font indicates values that are statistically significant at a level of 0.05) (E0 calculated based on t and f and data obtained from the Polish Institute of Meteorology and Water Management—National Research Institute [43]).
3.2. Spatial Distribution of Potential Evaporation
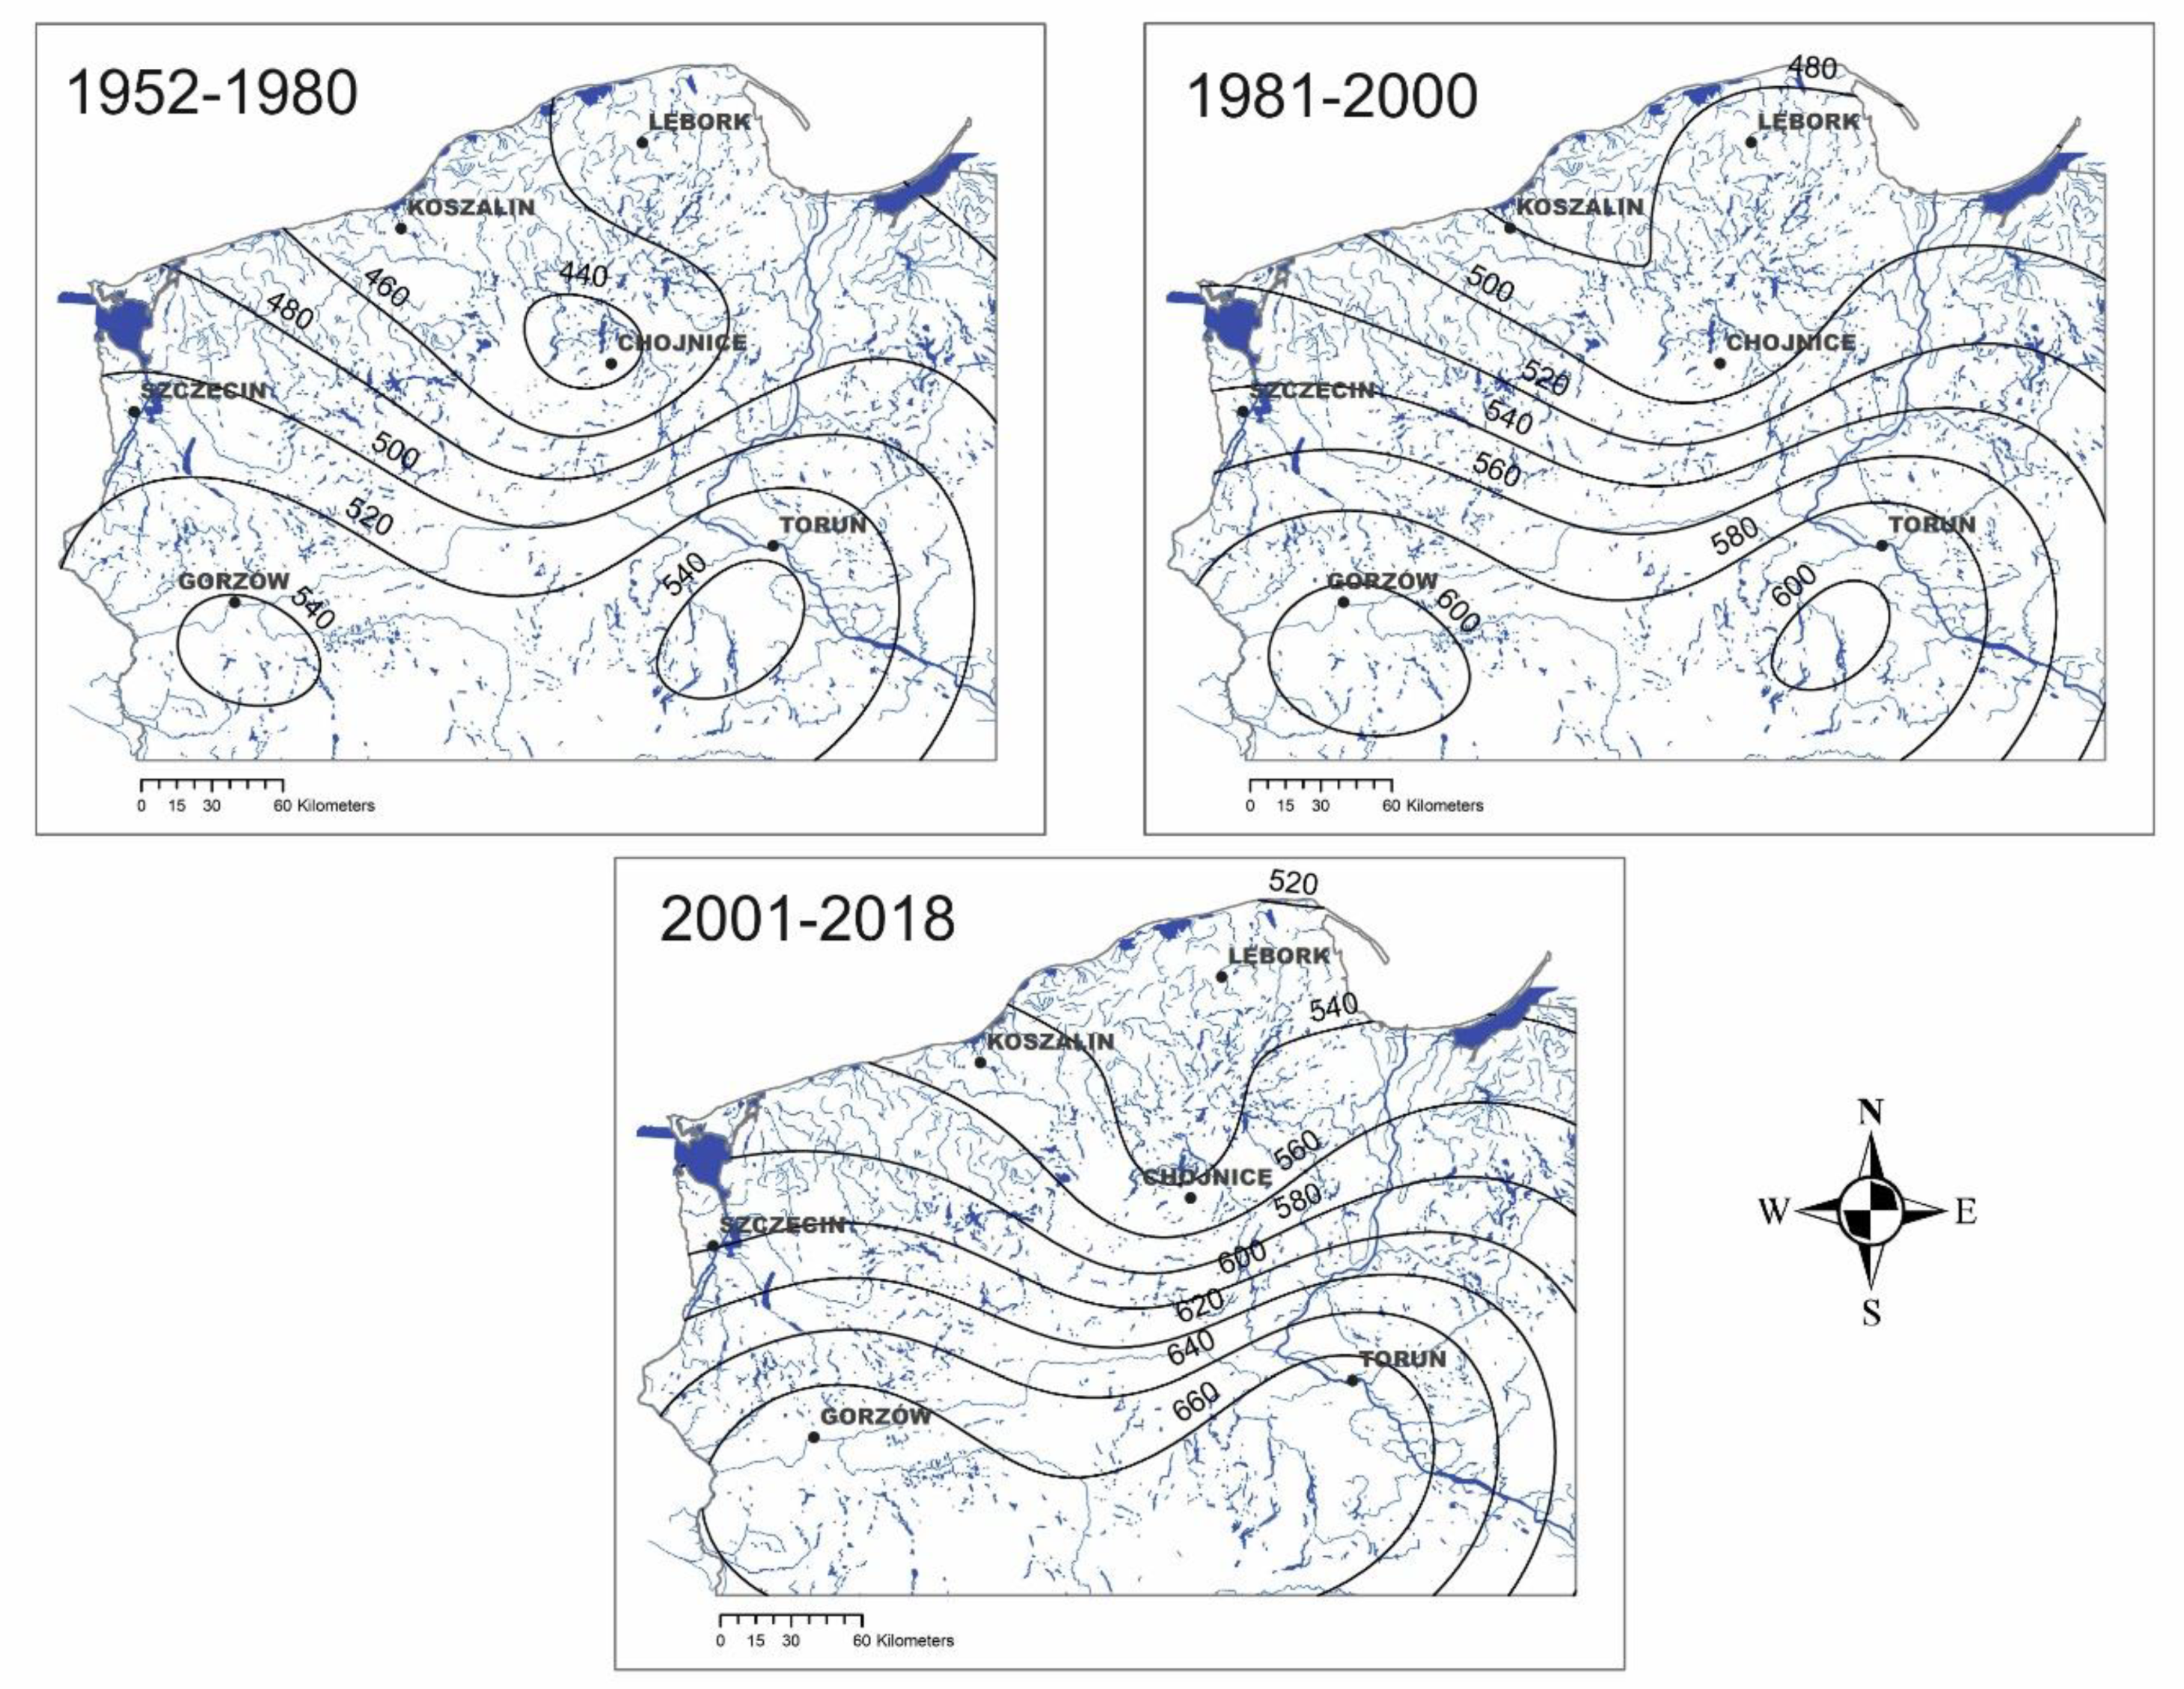
The average annual potential evaporation increases southwards, with increasing distance from the Baltic Sea shore, in all three analysed periods: 1952–1980, 1981–2000 and 2001–2018 (Figure 6). This variability is slightly higher in the eastern and western parts of the study area, and slightly less intense in the central part. In the first of the abovementioned periods, annual values of evaporation increased from 440–460 mm near the Koszalin Coastland to 520–540 mm in the area of the Toruń-Eberswalde Glacial Valley and the Wielkopolskie Lakeland. During this time, the difference in evaporation between the north and south of the study area was approximately 80 mm. For the subsequent investigated periods, a general increase in evaporation can be noticed in the whole study area. However, attention should be paid to the increase in evaporation values between the coastal zone of the Baltic Sea and the southern part of the lakeland strip, which reached approximately 120 mm. In the years 1981–2000, sums of annual evaporation went up from 480–500 mm on the shore to 600 mm within the Toruń-Eberswalde Glacial Valley and the Wielkopolskie Lakeland, and in the subsequent period of 2001–2018 values in these areas amounted to 540 mm and 660 mm, respectively. Therefore, maps of spatial distribution of potential evaporation for the individual research periods show an increase in the amplitude of this parameter between the Baltic Sea shore and central Poland, demarcating the southern edge of the research area.
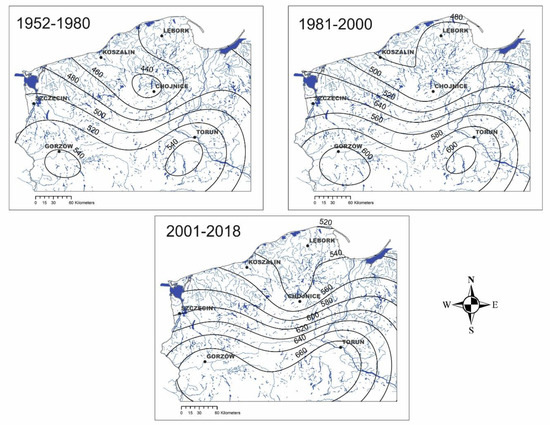
Figure 6.
Spatial distribution of average annual sums of potential evaporation in north-western Poland divided into the periods 1952–1980, 1981–2000 and 2001–2018 against the distribution of the water network (calculated based on data obtained from the Polish Institute of Meteorology and Water Management—National Research Institute [43], water network based on [41]).
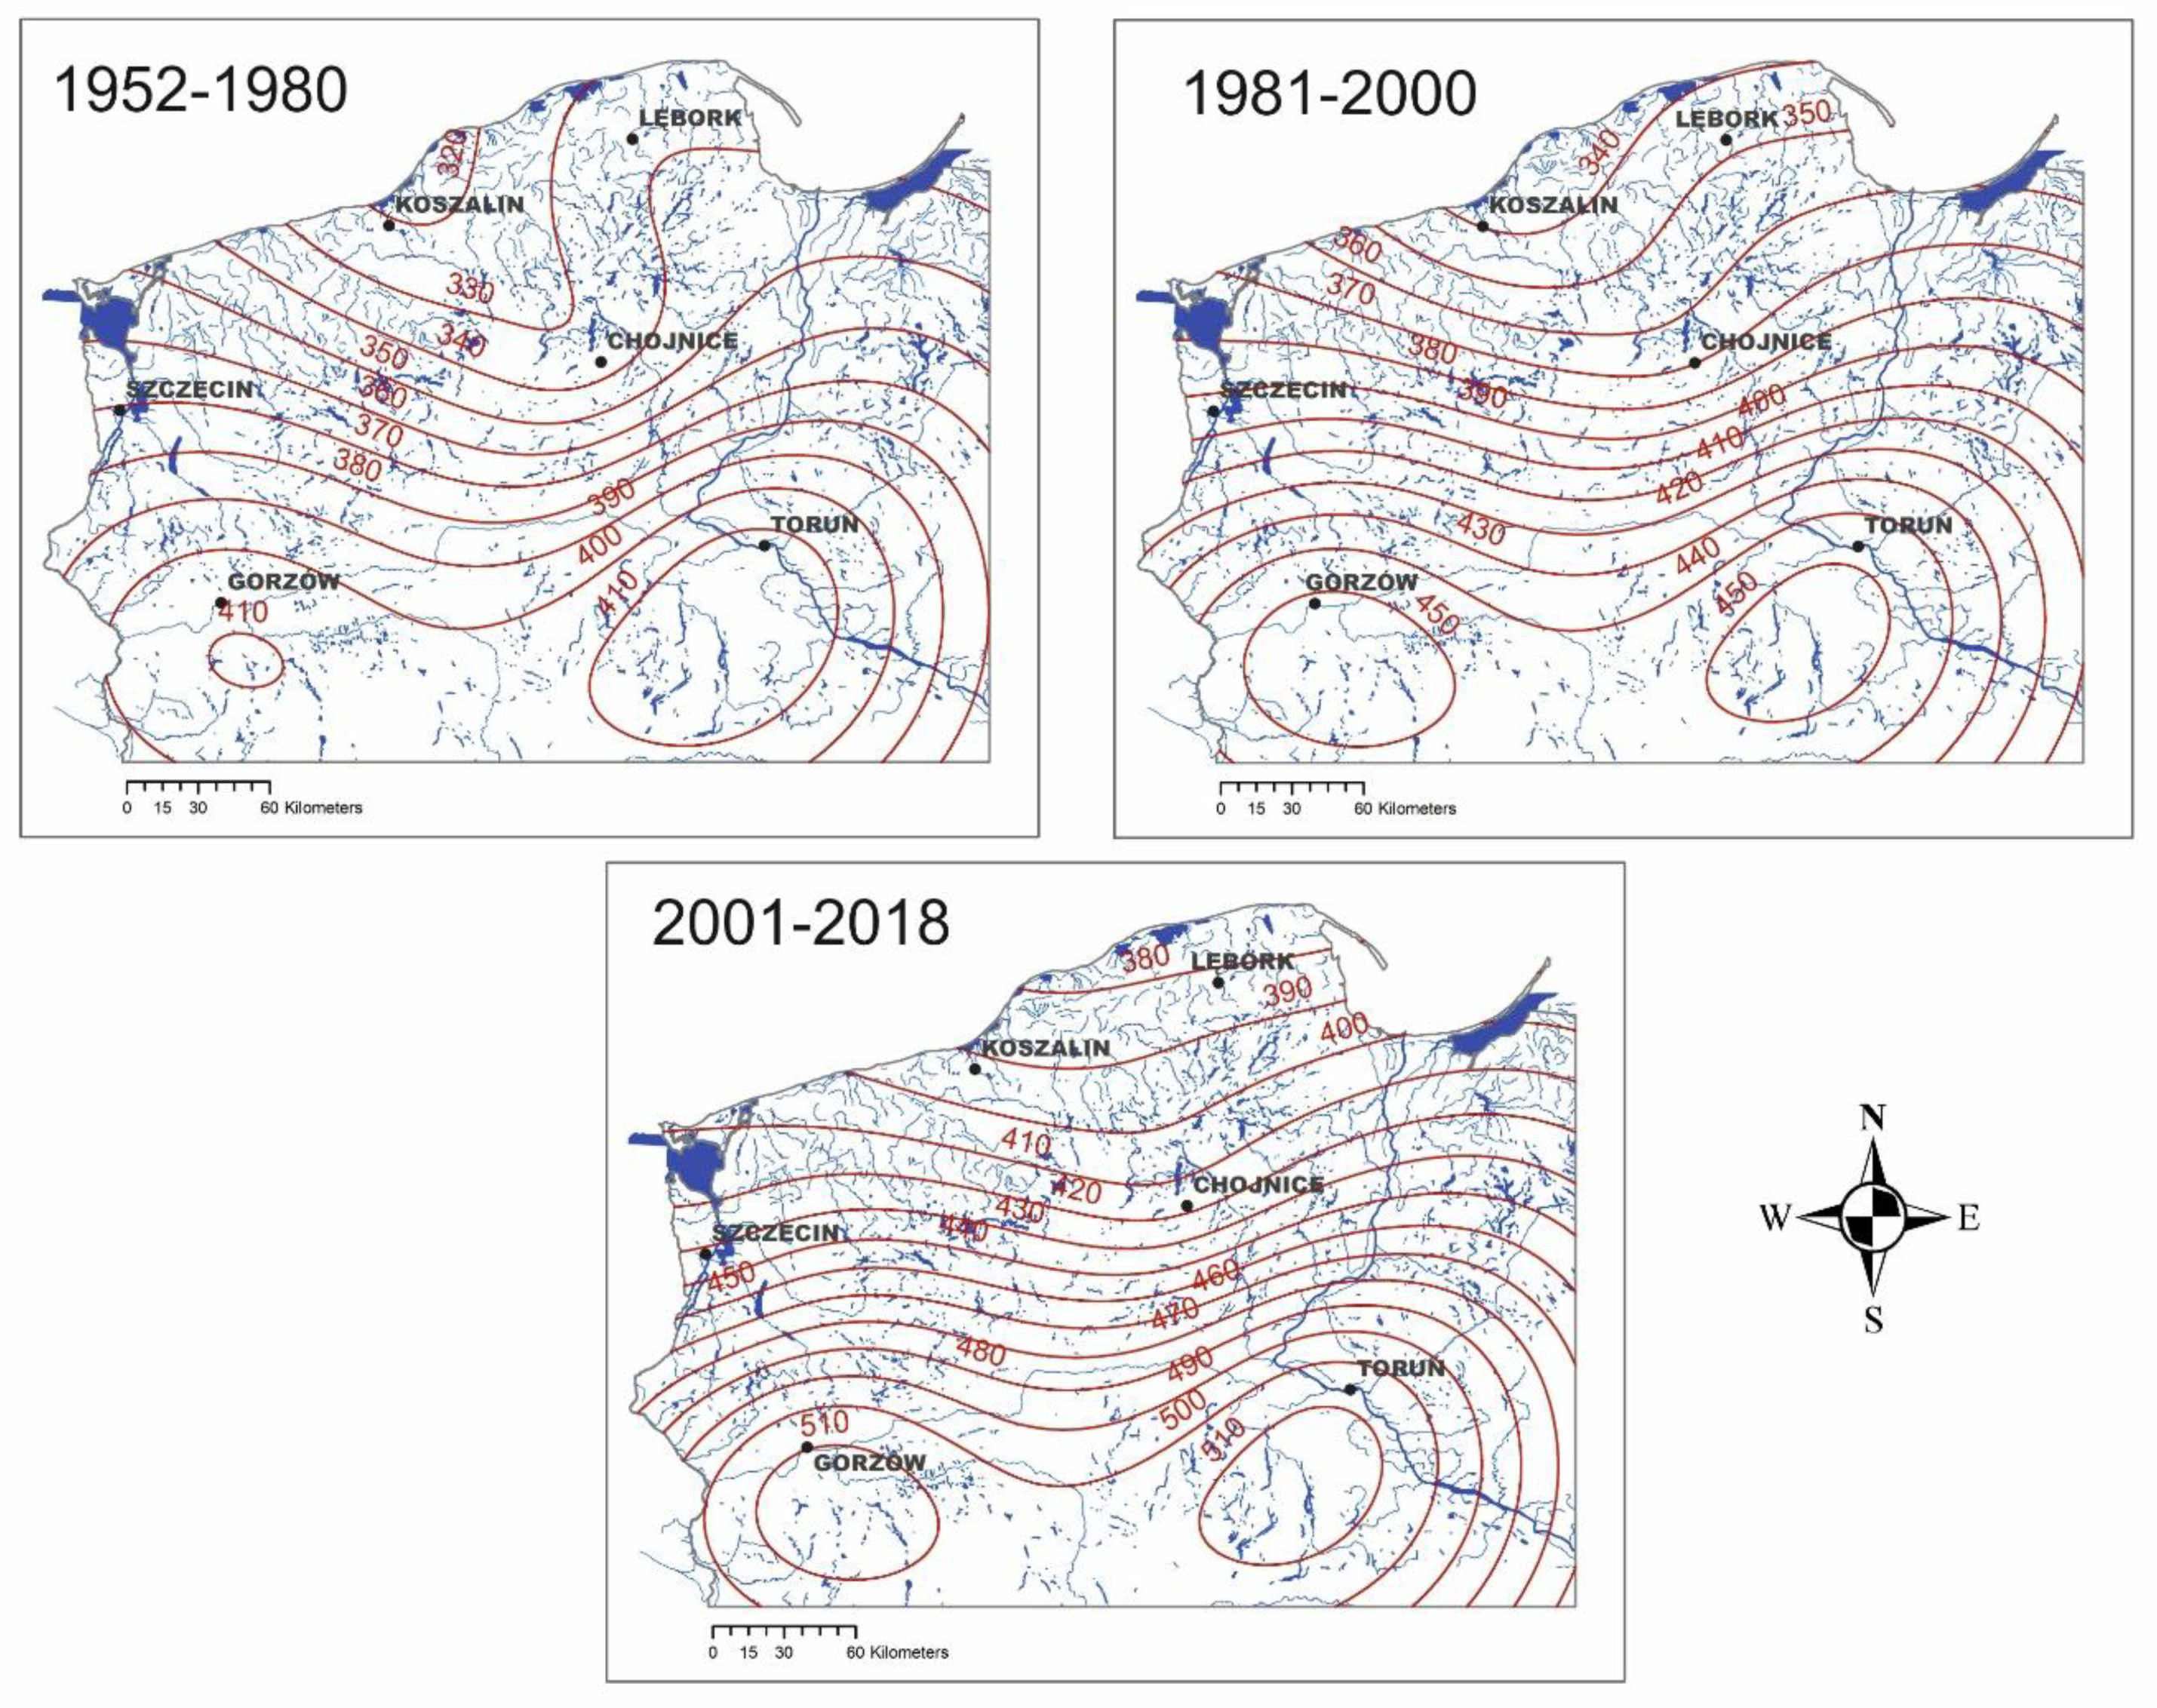
The spatial distribution of sums of evaporation in the summer half-year (V–X) exhibits a similar trend to annual values, meaning that there is an incremental increase moving further away from the coast in all three analysed periods: 1952–1980, 1981–2000 and 2001–2018 (Figure 7). The highest variability in that regard was observed in the years 2001–2018, when differences in evaporation between stations located in the strip of Southern Baltic Coastlands and the southern part of the Southern Baltic Lakelands reached 130 mm, while the analogous value for the 1952–1980 period amounted to approximately 90 mm, with approximately 110 mm for the 1981–2000 window. Another peculiarity is that, compared to the years 2001–2018, in the years 1952–1980 the area between Koszalin and Chojnice was characterised by a much smaller increase in evaporation with increasing distance from the Baltic Sea shore.
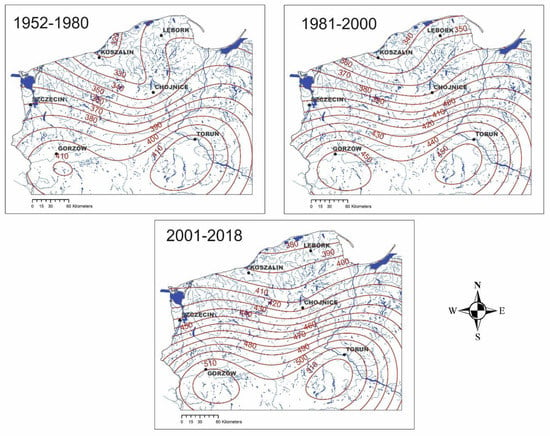
Figure 7.
Spatial distribution of average summer half-year (V–X) sums of potential evaporation in north-western Poland divided into the periods 1952–1980, 1981–2000 and 2001–2018 against the distribution of the water network (calculated based on data obtained from the Polish Institute of Meteorology and Water Management—National Research Institute [43], water network based on [41]).
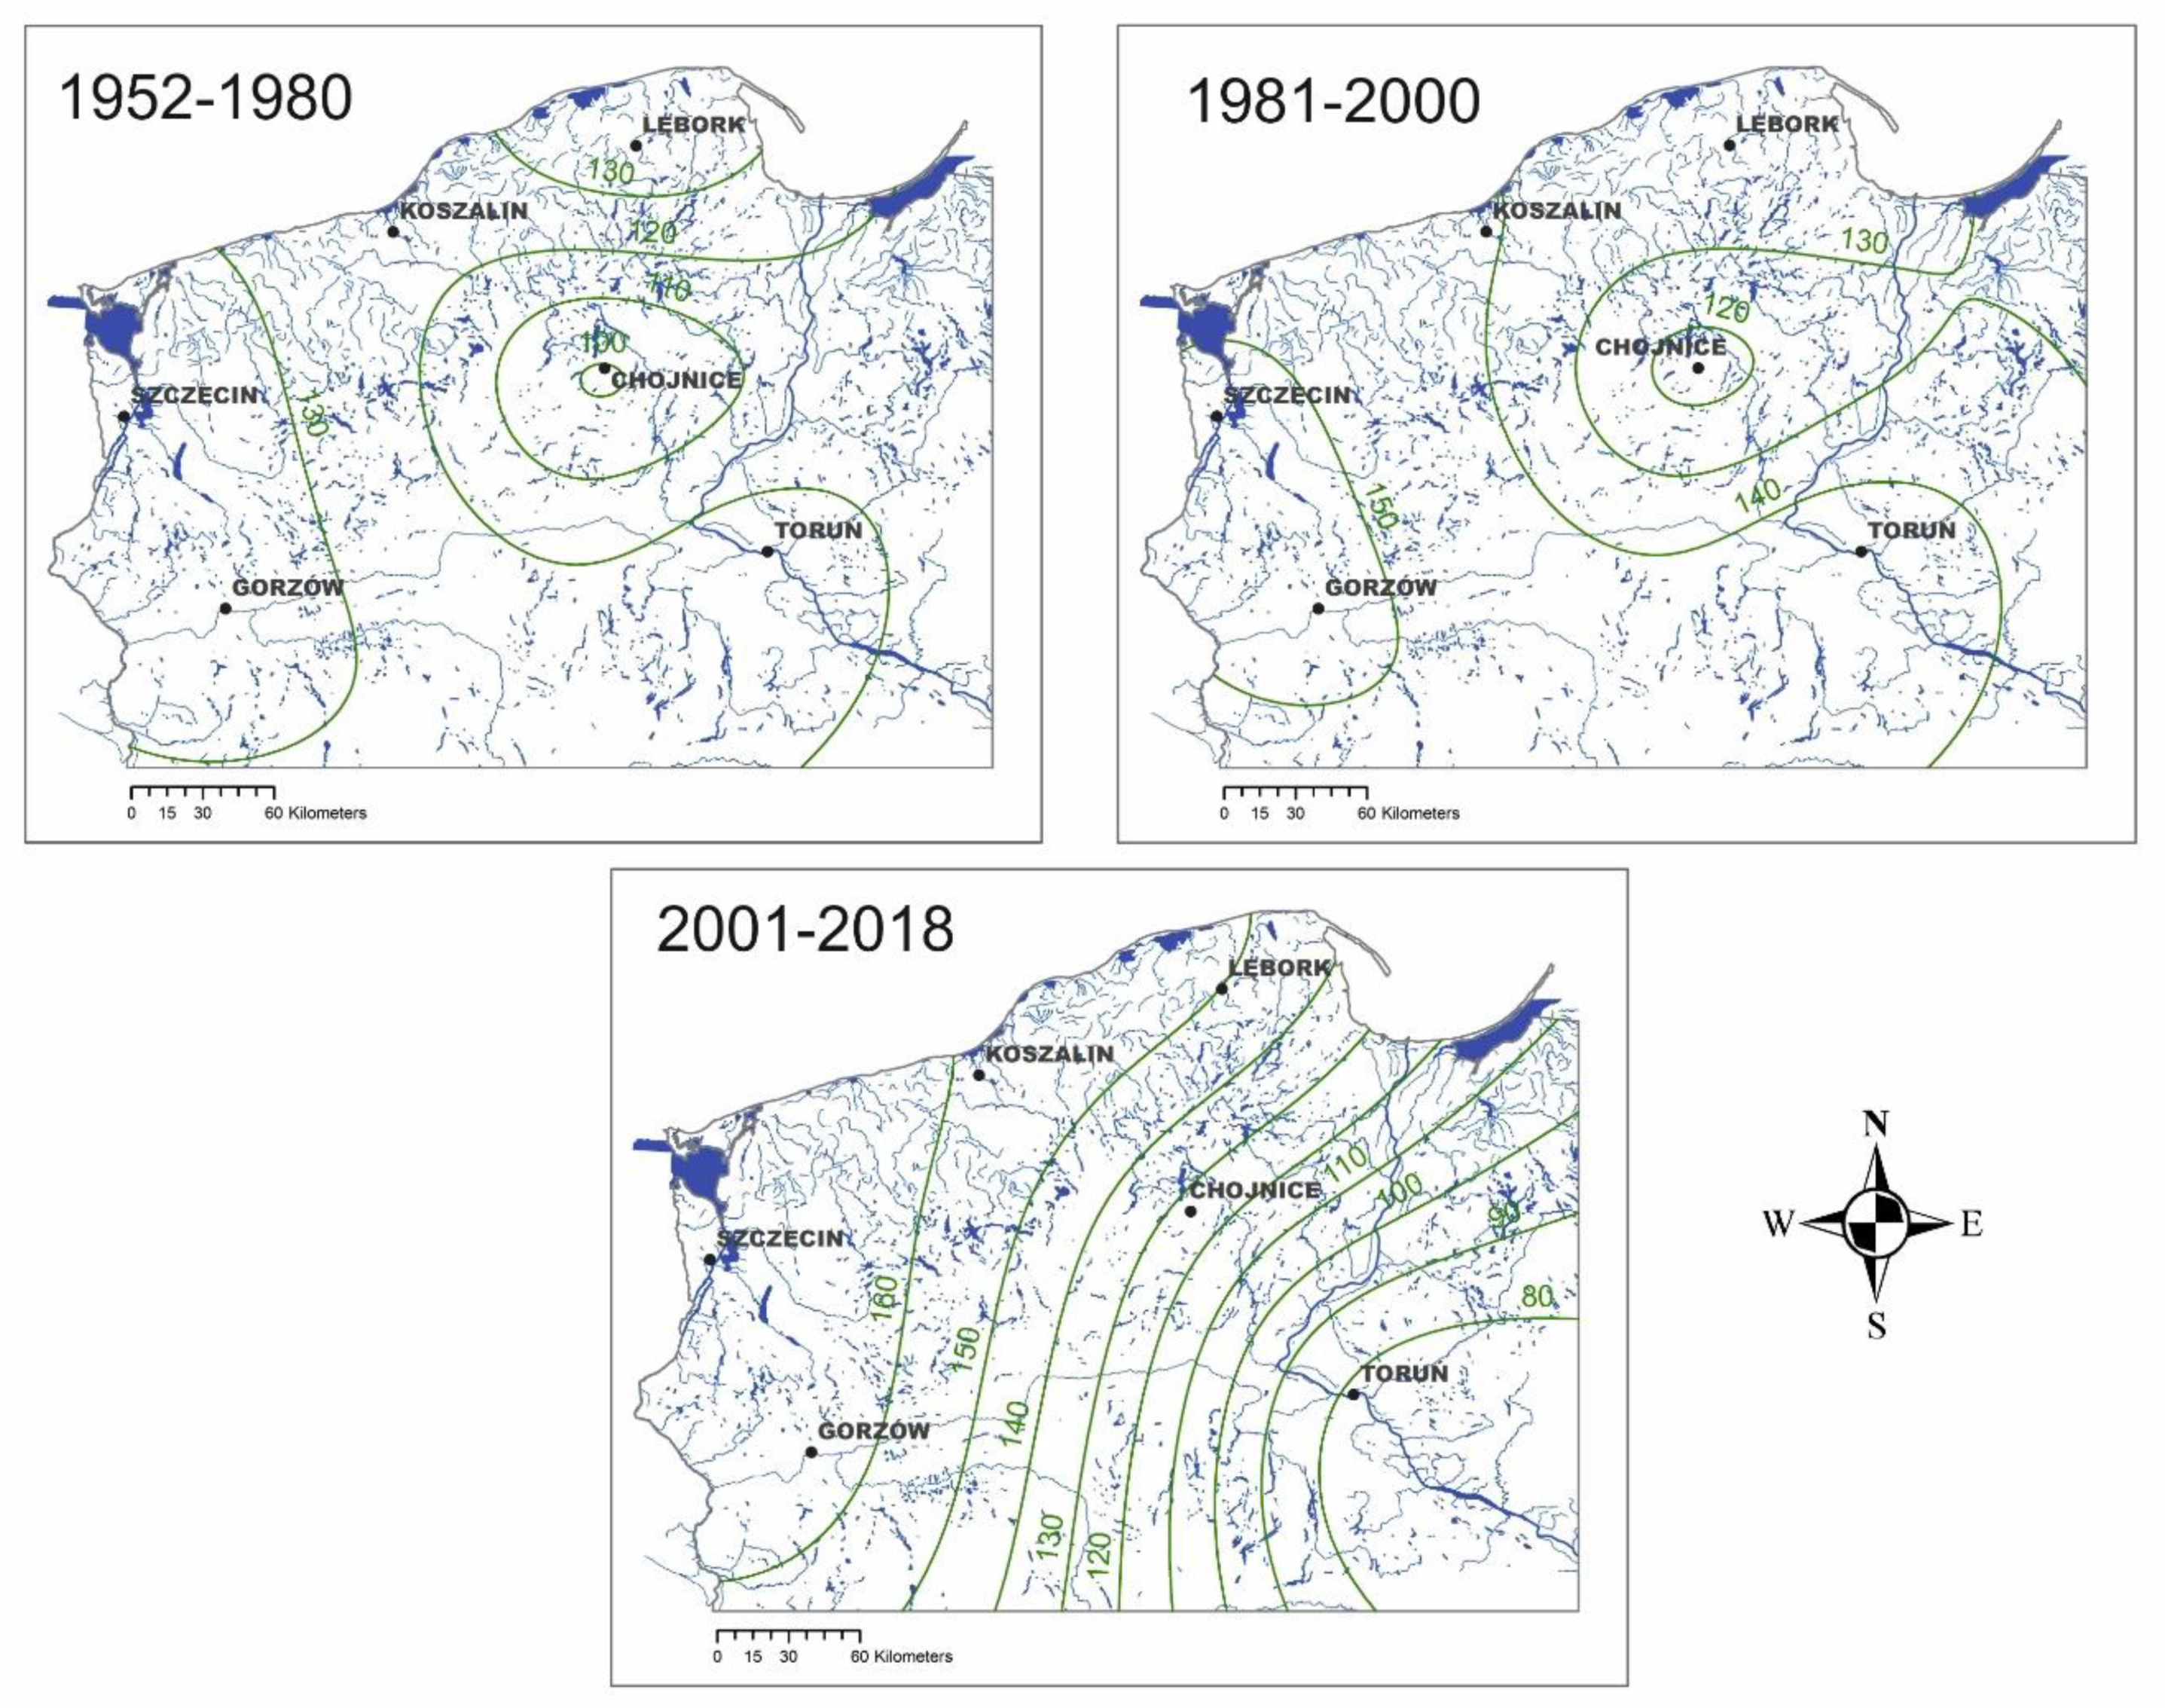
In the winter half-year (XI–IX), evaporation in the periods 1952–1980 and 1981–2000 decreased with distance from the shore, as well as eastwards, though the change is not high, not exceeding 30 mm (Figure 8). The last period, 2001–2018, is characterised by a different spatial pattern of evaporation distribution. The evaporation values were highest (160 mm) in the western part of the study area and decreased eastwards to 80 mm. Apart from the trend of increasing evaporation in the study area in the subsequent periods, the spatial distribution of evaporation is also indicative of evaporation conditions between the east and west of the study area being more diverse in the years 2000–2018 than in the preceding years.
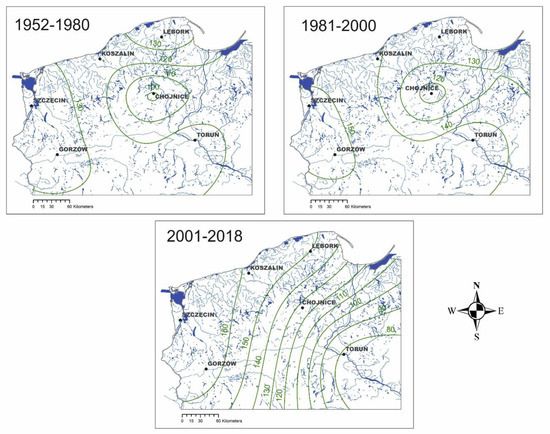
Figure 8.
Spatial distribution of average winter half-year (XII–III) sums of potential evaporation in north-western Poland divided into the periods 1952–1980, 1981–2000 and 2001–2018 against the distribution of the water network (calculated based on data obtained from the Polish Institute of Meteorology and Water Management—National Research Institute [43], water network based on [41]).
4. Discussion
4.1. Increase in Evaporation in North-Western Poland in Light of Previous Studies of Climate Changes
Evaporation and transpiration represent losses to the water balance in a catchment, while precipitation and ground water inflow represent additions to the catchment. The analysed E0 index is determined by conditions of temperature and humidity, with an increase in temperature causing an increase in evaporation, while an increase in air humidity causes a decrease in the intensity of evaporation. According to Michalska [14], air temperature in Poland rose in the whole country in the years 1951–2005 by approximately 0.4 °C (in Kraków) up to 1.5 °C (in Toruń) (0.07 °C and 0.27 °C per 10 years, respectively). That author notices the clear spatial variability of the upward trend of air temperature, which was highest in western Poland and decreased eastwards. Nevertheless, the presented results show that the increased rate for air temperature in the period 1952–2018 was higher than the rate calculated for the years 1951–2005 by Michalska [14]. The average increase in temperature per 10 years amounted to between 0.24 °C in Lębork and 0.31 °C in Koszalin and Toruń. It is therefore clear that the accelerated increase in air temperature in the 21st century noticed by Michalska [14] accelerated even more sharply during the next dozen years or so (Figure 2). This is why the temperature increases for north-western Poland for the years 1951–2018 correspond to the maximum values of the increase observed by Michalska [14], and are also higher than the values calculated for the strips of coastlands and lakelands for the years 1951–2010 by Marosz et al. [48] and by Wójcik and Miętus [15]. The respective values of the increase in air temperature calculated by the latter authors amounted to 0.24 °C and 0.22 °C per 10 years. A higher increase in air temperature, compared to research based on meteorological data until 2010 is also indicated by Owczarek and Filipiak [16], who analysed the years 1951–2015.
Considering the spatial variability of the increase in air temperature in the years 1952–2018 in the studied area of north-western Poland, there is no distinct visible spatial trend. However, previous studies show that in north-western Poland the air temperature increase was higher compared to the other regions [49]. A high increase in air temperature was recorded both at stations from the coastland region (Koszalin) and at stations further inland (Toruń, Gorzów). Similar to the previous research results [14,15], the increase in air temperature was greatest near the end of the winter, in the spring and in the summer (II–V, VII–VIII). Compared to previous research, the produced results also exhibit a considerable increase in temperature for September and November (Table 2).
The acquired data indicate that the intensification in the upward trend of air temperature near the end of the 20th century and in the 21st century was accompanied by a drop in relative humidity (Figure 2 and Figure 3). The months with the greatest recorded drop in relative humidity included April, May and August at all stations, as well as July, September and October in some of them. In earlier modelling studies, Szwed [50] pointed to summer months (VI–VIII) as potentially at risk of considerable atmospheric precipitation deficits in the 21st century. The abovementioned author also indicates a possible increase in atmospheric precipitation in winter months; however, considering a probable further increase in air temperature, she pointed to a probable increase in evaporation in all months of the year. The modelling studies presented by Szwed [50] indicated the probability of a change in the temporal structure of outflow in Poland in the 21st century [26,27]. The prediction includes factors shaping climatic water balance. According to that author, the outflow changes will be greater in north-western Poland compared with eastern and south-eastern regions.
The research results presented here confirm such essential changes in north-western Poland; specifically, the increased difference in evaporation between the Southern Baltic Coastlands and the south of the Southern Baltic Lakelands. The difference in evaporation between these areas increased from 80 mm per year at the beginning of the studied period to 120 mm per year in the 21st century. Such a directional change, which is related to a considerable increase in air temperature accompanied by a drop in relative air humidity that was especially pronounced further from the Baltic Sea coast, could increase water deficits within the Southern Baltic Lakeland region.
Regarding the impact on water management, considering the observed changes in climate and outflow, as well as forecasts for the 21st century, Szwed [50] and Kasperska-Wołowicz et al. [51] emphasised that an increase in both air temperature and evaporation (which are particularly high in summer months), as well as an increase in atmospheric precipitation in winter months, would require water management planning to prepare for future climatic conditions. The elements of environment that can mitigate the effects of changes in the annual structure of outflow from a catchment area include, for example, control of land use [52] or engineering of the outflow [27]. For the engineering-based actions, it seems that lakeland areas, where the network of outflow is formed of polygenetic fluvial–lacustrine systems, are particularly suited to the creation of small retention systems. However, the fact that many outflow systems of young glacial areas are in hydraulic connection with groundwaters of deeper circulation systems (via deep erosional valleys or deep lakes) [53] makes these systems highly sensitive to an increase in evaporation (and in particular to high evaporation in summer months). Due to the high inertia of groundwater circulation systems, the losses of water resources in a catchment area may only be observed after a delay of up to several decades, and may further intensify outflow deficits.
4.2. Increase in Evaporation and Changes in Hydrological and Physico-Chemical Conditions in Surface Waters
In light of the research performed to date, changes in the structure of outflow are predicted, with the differences between surge outflows and low outflows increasing in amplitude [54]. The increase in evaporation in the 21st century, which is particularly strong in summer months, may be causing the intensification of low flows in rivers and considerable changes in the regime of smaller watercourses. As indicated by the research of Feyen and Dankersa [54], Poland is at the edge of an area covering southern and south-western Europe, which in the 21st century will suffer from an outflow deficit. Many published research results [22,25,55] involve changes in outflow and forecasts related to larger rivers in national monitoring networks. These rivers are also frequently objects that people transform indirectly or use directly, which, as pointed out by Wrzesiński and Sobkowiak [25], may constitute a factor concealing changes in outflow resulting from climate changes. In terms of the area of north-western Poland studied in the present paper, based on an analysis of the outflow regime in the years 1951–2010, Wrzesiński and Sobkowiak [25] observed a decrease in outflow near the end of the 20th century and in the first decade of the 21st century. The performed research indicates that one of the main reasons behind the reduced outflow may involve the considerable increase in sums of potential evaporation in the final decades of the 20th century and in the beginning of the 21st century, primarily in the central and southern part of the Southern Baltic Lakelands. This area was also identified as being at considerable risk of meteorological and hydrological drought in documents related to the implementation of a country-wide project intended to counteract the effects of drought [56]. At the same time, the literature clearly lacks research into the response of smaller watercourses to climate changes, including changes in temperature and changes in evaporation. There is a lack of results from the lack of regular observations of these watercourses. Studies from the southern regions of Europe indicate a dramatic limitation of water resources in the second half of the 20th century specifically in small watercourses, and they pay attention to the impact of limited outflow on the quality of water [57]. There are a few papers from Poland involving smaller catchment areas and indicating that a strong relationship exists between positive trends of air temperature and evaporation in the second half of the 20th century on the one hand, and the lowering of the water table, the loss of flow in smaller watercourses and the lowering of the water level in lakes on the other [58]. However, it should be emphasised that decreases in outflow in small watercourses may significantly deteriorate ecological conditions for many species and constitute an indirect effect of climate changes on ecosystem services [59,60,61,62,63].
Quantitative changes in water resources and changes in the hydrological regime can affect the elements shaping water quality, both in bodies of standing water and within flowing waters. In the case of rivers, surge flows threaten the maintenance of water quality, since they are associated with a potential risk of the flow of contaminants [64] and an increase in the migration of organic carbon from catchment areas [65]. For the studied area, due to the river basin’s low susceptibility to flood occurrence (k index < 1 in the Southern Baltic Lakelands and between 1 and 2 in the Southern Baltic Coastlands) [22], it seems that a higher risk will be associated with low flows. The latter can cause oxygen deficits, as well as an increase in the concentrations of main ions and heavy metals, which is disadvantageous for water ecosystems inter alia [66,67]. A review by Mosley [67] of studies on the impact that low flows, mainly in the rivers of Europe and North America, have on water quality indicates that the increase in concentrations of solutes has been attributed mainly to evapoconcentration and less dilution of more saline groundwater inputs, and also to point sources in some cases. In turn, the flow of nitrogen and phosphorus compounds decreases along with the reduction of outflow from a catchment area [67,68]. The lower flow volume and higher water temperature observed during the summer period, in particular in the studied area of north-western Poland [55], may favour the occurrence of oxygen deficits in rivers [69]. In the case of catchment areas not subjected to anthropogenic contamination, the reduction of outflow can in turn decrease the inflow of solutes into waters [70].
Unlike flowing waters, more unambiguous trends in changes of hydrological conditions have been observed in Polish lakes, in which lowering of the water level has been visible since the second half of the 20th century [18,71]. At the same time, an increase in water temperature was recorded in lakes [72,73,74]. Wang et al. [75] forecasted a further global increase in evaporation from lakes and estimate that the global annual lake evaporation will increase by 16% by the end of the century. They pointed out that the increase in evaporation could be higher for lakes at low latitudes. Czarnecki and Ptak [72] indicated that a further considerable increase in water temperature of the lakes in Poland will be the primary factor determining the transformation of lake ecosystems. Studies into the impact of climate warming on processes occurring in lakes show that the effects may include changing the mixing type of the lake, extending the period of thermal stratification, shortening the duration of water mixing and increasing the depth and temperature of the epilimnion [70,73,76,77,78]. Not only may changes in thermal stratification of lakes result from the increase in water temperature, they are also determined by their total depth [79] and morphology [80], which, likewise, depend on climate changes. Changes in water temperature and in the type of mixing affect a number of chemical processes. In the case of the (Lower) Lake of Zurich, the possibilities of oxidation of phosphorus have been observed to fall due to oxygen deficits within the hypolimnion caused by a change in the water mixing type [81]. The cited authors pointed at the undesirable effects of climate-induced, ecosystem-scale changes, which may result in, for example, a decline in water quality and a reduction in coldwater fish habitats. Bartosiewicz et al. [82] indicate the high complexity of processes that may accompany climate changes, particularly in relation to shallow lakes. According to those authors, an increase in temperature may cause a stronger thermal destratification of lakes and potentially change nutrient and biogenic gas cycling. High temperatures in the epilimnion may accelerate algae blooms and increase carbon intake, while isolation and deficits of oxygen in the hypolimnion may enhance the production of methane from bottom sediments.
5. Conclusions
Based on the performed analysis of changes in evaporation in the years 1952–2018 for north-western Poland, one can notice an increase in air temperature, a drop in air humidity and an increase in evaporation across the whole study area, with particular intensification of these processes near the end of the 20th century and in the 21st. In the case of evaporation, the increase ranged from 79.2 to 183.9 mm at the researched meteorological stations. The review of the literature indicates that these processes may cause significant hydrological changes within the outflow network and standing waters. The greatest changes involve smaller watercourses, in which there may be a significant reduction or complete loss of flow. In the case of standing waters, particularly in the case of smaller and shallow lakes, climate changes may considerably reduce depth and transform thermal stratification. The above changes may transform physical and chemical conditions in surface waters, due to a decreased intensity of inflow of solutes and a simultaneous increase in water temperature. In spite of a smaller supply of chemical compounds, a decrease in the volume of water may also increase the concentrations of solutes in surface waters, especially in areas subjected to anthropogenic pressure. A further increase in air temperature and evaporation, as well as the hydrological changes predicted in the literature, could considerably transform physical and chemical conditions, especially in small hydrological objects (shallow lakes, first-order watercourses).
Author Contributions
Conceptualisation, M.O. and D.S.; methodology, M.O. and D.S; formal analysis, M.O.; investigation, M.O.; resources, M.O.; software, M.O. and D.S.; validation, M.O. and D.S.; data curation, M.O. and D.S.; writing—original draft preparation, M.O. and D.S.; writing—review and editing, M.O. and D.S.; visualisation, M.O. and D.S.; supervision, M.O. and D.S.; project administration, M.O.; funding acquisition, M.O. and D.S. All authors have read and agreed to the published version of the manuscript.
Funding
This research was funded by the Project Supporting Maintenance of Research Potential at Kazimierz Wielki University.
Acknowledgments
The authors would like to thank S. Czapiewski for technical support.
Conflicts of Interest
The authors declare no conflict of interest.
References
- Radzka, E. Climatic water balance for the vegetation season (according to Iwanow’s equation) in central-eastern Poland. Water-Environ. -Rural Areas 2014, 14, 67–76. [Google Scholar]
- Stagl, J.; Mayr, E.; Koch, H.; Hattermann, F.F.; Huang, S. Effects of Climate Change on the Hydrological Cycle in Central and Eastern Europe. In Managing Protected Areas in Central and Eastern Europe Under Climate Change; Rannow, S., Neubert, M., Eds.; Springer: Dordrecht, The Netherlands, 2014; Volume 58, pp. 31–43. ISBN 978-94-007-7959-4. [Google Scholar]
- AghaKouchak, A.; Feldman, D.; Hoerling, M.; Huxman, T.; Lund, J. Water and climate: Recognize anthropogenic drought. Nature 2015, 524, 409–411. [Google Scholar] [CrossRef] [PubMed]
- Piniewski, M.; Mezghani, A.; Szcześniak, M.; Kundzewicz, Z.W. Regional projections of temperature and precipitation changes: Robustness and uncertainty aspects. metz 2017, 26, 223–234. [Google Scholar] [CrossRef]
- Fang, J.; Li, G.; Rubinato, M.; Ma, G.; Zhou, J.; Jia, G.; Yu, X.; Wang, H. Analysis of Long-Term Water Level Variations in Qinghai Lake in China. Water 2019, 11, 2136. [Google Scholar] [CrossRef]
- Climate Change 2014: Synthesis Report; Pachauri, R.K., Mayer, L., Intergovernmental Panel on Climate Change, Eds.; Intergovernmental Panel on Climate Change: Geneva, Switzerland, 2015; ISBN 978-92-9169-143-2. [Google Scholar]
- Intergovernmental Panel on Climate Change. Global Warming of 1.5°C; World Meteorological Organization: Geneva, Switzerland, 2018. [Google Scholar]
- Czoch, K.; Kulesza, K.; Kwiecień, M.; Szopnicka, M. Zmiany klimatu a ekosystemy wodne. In Zrównoważone Gospodarowanie Zasobami Wodnymi oraz Infrastrukturą Hydrotechniczną w świetle Prognozowanych zmian Klimatycznych; Majewski, W., Walczykiewicz, T., Eds.; IMGW-PIB: Warsaw, Poland, 2012; pp. 66–75. [Google Scholar]
- Okruszko, T.; Duel, H.; Acreman, M.; Grygoruk, M.; Flörke, M.; Schneider, C. Broad-scale ecosystem services of European wetlands—overview of the current situation and future perspectives under different climate and water management scenarios. Hydrol. Sci. J. 2011, 56, 1501–1517. [Google Scholar] [CrossRef]
- Okruszko, T.; O’Keeffe, J.; Utratna, M.; Marcinkowski, P.; Szcześniak, M.; Kardel, I.; Kundzewicz, Z.W.; Piniewski, M. Prognoza wpływu zmian klimatu na środowisko wodne i mokradła w Polsce. In Zmiany Klimatu i ich Wpływ na Wybrane Sektory w Polsce; Kundzewicz, Z.W., Øystein, H., Okruszko, T., Eds.; ISRL PAN: Poznań, Poland, 2017; pp. 148–167. ISBN 978-83-8104-753-1. [Google Scholar]
- Piniewski, M.; Szcześniak, M.; Kardel, I.; Marcinkowski, P.; Okruszko, T.; Kundzewicz, Z.W. Zasoby wodne. In Zmiany Klimatu i ich Wpływ na Wybrane Sektory w Polsce; Kundzewicz, Z.W., Øystein, H., Okruszko, T., Eds.; ISRL PAN: Poznań, Poland, 2017; pp. 131–147. ISBN 978-83-8104-753-1. [Google Scholar]
- Kundzewicz, Z.W.; Matczak, P. Climate change regional review: Poland: Climate change regional review: Poland. Wires Clim. Chang. 2012, 3, 297–311. [Google Scholar] [CrossRef]
- Wine, M.L.; Davison, J.H. Untangling global change impacts on hydrological processes: Resisting climatization. Hydrol. Process. 2019, 33, 2148–2155. [Google Scholar] [CrossRef]
- Michalska, B. Tendencies of air temperature changes in Poland. Pr. Studia Geogr. 2011, 47, 67–75. [Google Scholar]
- Wójcik, R.; Miętus, M. Some features of long-term variability in air temperature in Poland (1951–2010). Przegląd Geogr. 2014, 83, 339–364. [Google Scholar]
- Owczarek, M.; Filipiak, J. Contemporary changes of thermal conditions in Poland, 1951–2015. Bull. Geogr. Phys. Geogr. Ser. 2016, 10, 31–50. [Google Scholar] [CrossRef]
- Ziernicka-Wojtaszek, A. Klimatyczny bilans wodny na obszarze Polski w świetle współczesnych zmian klimatu. Woda-Środowisko-Obsz. Wiej. 2015, 5, 93–100. [Google Scholar]
- Skowron, R.; Jaworski, T. Changes in lake area as a consequence of plant overgrowth in the South Baltic Lakelands (Northern Poland). Bull. Geogr. Phys. Geogr. Ser. 2017, 12, 19–30. [Google Scholar] [CrossRef][Green Version]
- Pociask-Karteczka, J. River runoff response to climate changes in Poland (East-Central Europe). In Hydro-Climatology: Variability and Change, Proceedings of Symposium J-H02 held during IUGG2011 in Melbourne, Australia, July 2011; The International Association of Hydrological Sciences; IAHS Publication: Wallingford, UK, 2011; pp. 182–187. [Google Scholar]
- Ilnicki, P.; Farat, R.; Górecki, K.; Lewandowski, P. Long-term air temperature and precipitation variability in the Warta River catchment area. J. Water Land Dev. 2015, 27, 3–13. [Google Scholar] [CrossRef]
- Olichwer, T.; Tarka, R. The impact of climate changes on the total and groundwater runoff–a case study of river basins in the Sudety Mts and their foreland. Biul. PaŃStwowego Inst. Geol. 456 Hydrogeol. 2013, 14, 443–449. [Google Scholar]
- Bartnik, A.; Jokiel, P. Maximum discharges and runoffs in Poland (Report). In Natural Environment of Poland and its protection in Łódź University Geographical Research; Koojek, E., Marszał, T., Eds.; Łódź University Press: Łódź, Poland, 2014; pp. 43–73. [Google Scholar]
- Malinowski, Ł.; Skoczko, I. Impacts of Climate Change on Hydrological Regime and Water Resources Management of the Narew River in Poland. J. Ecol. Eng. 2018, 19, 167–175. [Google Scholar] [CrossRef]
- Banasik, K.; Kazanowska, E. Impact of Climate Change on Low Flow Characteristics in a Small Catchment of Central Poland; American Geophysical Union: Washington, DC, USA, 2016. [Google Scholar]
- Wrzesiński, D.; Sobkowiak, L. Detection of changes in flow regime of rivers in Poland. J. Hydrol. Hydromech. 2018, 66, 55–64. [Google Scholar] [CrossRef]
- Meresa, H.; Osuch, M.; Romanowicz, R. Hydro-Meteorological Drought Projections into the 21-st Century for Selected Polish Catchments. Water 2016, 8, 206. [Google Scholar] [CrossRef]
- Meresa, H.K. River flow characteristics and changes under the influence of varying climate conditions. Nat. Resour. Modeling 2019, 33, e12242. [Google Scholar] [CrossRef]
- Climate change 2007: the physical science basis: contribution of Working Group I to the Fourth Assessment Report of the Intergovernmental Panel on Climate Change; Solomon, S., Intergovernmental Panel on Climate Change, Intergovernmental Panel on Climate Change, Eds.; Cambridge University Press: Cambridge, UK; New York, NY, USA, 2007; ISBN 978-0-521-88009-1. [Google Scholar]
- Błażejczyk, K.; Baranowski, J.; Błażejczyk, A. Wpływ klimatu na stan zdrowia w Polsce: stan aktualny oraz prognoza do 2100 roku = Influence of climate on health status in Poland and projections to the year 2100; Wydanie pierwsze; SEDNO Wydawnictwo Akademickie: Warszawa, Poland, 2015; ISBN 978-83-7963-042-4. [Google Scholar]
- Kundzewicz, Z.W. Zmiany klimatu, ich przyczyny i skutki – obserwacje i projekcje. Landf. Anal. 2011, 15, 39–49. [Google Scholar]
- Kondracki, J. Geografia Regionalna Polski; PWN: Warszawa, Poland, 2009. [Google Scholar]
- Błaszkiewicz, M. Development of Fluvio-Lacustrine Systems in the Young Glacial Area in Poland Based on the Research in the Valleys of the Rivers Wierzyca and WDA. Quaest. Geogr. 2010, 29, 13–19. [Google Scholar] [CrossRef]
- Borowiak, D. Water Regimes and Hydrological Functions of Polish Lowland Lakes; Bad. Limnol. 2Wyd. KLUG: Gdańsk, Poland, 2000; ISBN 8391038114 9788391038116. [Google Scholar]
- Bajkiewicz-Grabowska, E. Obieg materii systemach rzeczno-jeziornych; Wyd Uniwersytet Warszawski Wydział Geografii i Studiów Regionalnych: Warszawa, Poland, 2002. [Google Scholar]
- Jańczak, J. Porównanie odpływu z większych jezior pojezierzy Wielkopolskiego i Pomorskiego In: Zasoby i ochrona wód: obieg wody i materii w zlewniach rzecznych; Bogdanowicz, R., FacBeneda, J., Eds.; Fund. Rozwoju Uniwersytetu Gdańskiego: Gdańsk, Poland, 2009; pp. 63–73. ISBN 9788375310283. [Google Scholar]
- Jańczak, J.; Choiński, A. Comparison between discharges of larger lakes in Poland and problems with their assessment. Gospod. Wodna 2013, 1, 31–35. [Google Scholar]
- Hillbricht-Ilkowska, A. Shallow lakes in lowland river systems: Role in transport and transformations of nutrients and in biological diversity. In Shallow Lakes ’98; Walz, N., Nixdorf, B., Eds.; Springer: Dordrecht, The Netherlands, 1999; pp. 349–358. ISBN 978-90-481-5370-1. [Google Scholar]
- Bajkiewicz-Grabowska, E.; Zdanowski, B. Phosphorus retention in lake sections of Struga Siedmiu Jezior. Limnol. Rev. 2006, 6, 5–12. [Google Scholar]
- Golus, W.; Bajkiewicz-Grabowska, E. Water circulation in the moraine ponds of northern Poland. Hydrobiologia 2017, 793, 55–65. [Google Scholar] [CrossRef]
- NASA Jet Propulsion Laboratory (JPL) NASA Shuttle Radar Topography Mission Global 3 arc second. Version 3. 6°S, 69°W NASA EOSDIS Land Processes DAAC. Available online: https://lpdaac.usgs.gov (accessed on 26 July 2019).
- Czarnecka, H. Atlas Podziału Hydrograficznego Polski; IMGW: Warszawa, Poland, 2005. [Google Scholar]
- Solon, J.; Borzyszkowski, J.; Bidłasik, M.; Richling, A.; Badora, K.; Balon, J.; Brzezińska-Wójcik, T.; Chabudziński, Ł.; Dobrowolski, R.; Grzegorczyk, I.; et al. Physico-geographical mesoregions of Poland: Verification and adjustment of boundaries on the basis of contemporary spatial data. Geogr. Pol. 2018, 91, 143–170. [Google Scholar] [CrossRef]
- Available online: https://danepubliczne.imgw.pl (accessed on 26 July 2019).
- Available online: https://www.ogimet.com/ (accessed on 31 July 2019).
- Żarnowiec, W.; Policht-Latawiec, A.; Ostrowski, K. Szacowanie wielkości parowania wody z powierzchni dachowych na podstawie wybranych wzorów empirycznych. Acta Sci. Pol. Form. Circumiectus 2016, 15, 17–28. [Google Scholar] [CrossRef]
- Montgomery, D.C.; Runger, G.C. Applied Statistics and Probability for Engineers, 3rd ed.; Wiley: New York, NY, USA, 2003; ISBN 978-0-471-20454-1. [Google Scholar]
- Woś, A. Zarys klimatu Polski; Bogucki Wydaw. Naukowe: Poznań, Poland, 1995; ISBN 978-83-86001-07-1. [Google Scholar]
- Marosz, M.; Wójcik, R.; Biermacik, D.; Jakusik, E.; Pilarski, M.; Owczarek, M.; Miętus, M. Zmienność klimatu Polski od połowy XX wieku. Rezultaty projektu klimat. Pr. I Studia Geogr. 2011, 47, 51–66. [Google Scholar]
- Biernacik, D.; Filipiak, J.; Miętus, M.; Wójcik, R. Zmienność warunków termicznych w Polsce po roku 1951. In Klimat Polski na tle klimatu Europy: zmiany i ich konsekwencje; Bednorz, E., Kolendowicz, I., Eds.; Wyd. Bogucki: Poznań, Poland, 2010; pp. 9–21. [Google Scholar]
- Szwed, M. The Elements of Water Balance in the Changing Climate in Poland. Adv. Meteorol. 2015, 2015, 1–13. [Google Scholar] [CrossRef]
- Kasperska-Wołowicz, W.; Smarzyńska, K.; Miatkowski, Z.; Bolewski, T.; Farat, R. Monthly Precipitation Patterns in a Region Vulnerable to Climate-Related Hazards—A Case Study from Poland. Water 2016, 8, 362. [Google Scholar] [CrossRef]
- Szwed, M. Projections of changes of areal evapotranspiration for different land-use units in the Wielkopolska Region (Poland). Theor. Appl. Clim. 2017, 130, 291–304. [Google Scholar] [CrossRef][Green Version]
- Bajkiewicz-Grabowska, E.; Golus, W.; Markowski, M.; Kwidzińska, M. The Role of Lakes in Shaping the Runoff of Lakeland Rivers. In Polish River Basins and Lakes – Part I; Korzeniewska, E., Harnisz, M., Eds.; Springer International Publishing: Cham, Switzerland, 2020; Volume 86, pp. 175–187. ISBN 978-3-030-12122-8. [Google Scholar]
- Feyen, L.; Dankers, R. Impact of global warming on streamflow drought in Europe. J. Geophys. Res. 2009, 114, D17116. [Google Scholar] [CrossRef]
- Marszelewski, W.; Pius, B. Long-term changes in temperature of river waters in the transitional zone of the temperate climate: a case study of Polish rivers. Hydrol. Sci. J. 2016, 61, 1430–1442. [Google Scholar] [CrossRef]
- Available online: http://stopsuszy.pl/ (accessed on 10 December 2019).
- Skoulikidis, N.T.; Sabater, S.; Datry, T.; Morais, M.M.; Buffagni, A.; Dörflinger, G.; Zogaris, S.; del Mar Sánchez-Montoya, M.; Bonada, N.; Kalogianni, E.; et al. Non-perennial Mediterranean rivers in Europe: Status, pressures, and challenges for research and management. Sci. Total Environ. 2017, 577, 1–18. [Google Scholar] [CrossRef] [PubMed]
- Kędziora, A. Climatic conditions and water balance of the Kujawy Lakeland. Rocz. Glebozn. 2011, 62, 189–203. [Google Scholar]
- Baptista, J.; Martinho, F.; Dolbeth, M.; Viegas, I.; Cabral, H.; Pardal, M. Effects of freshwater flow on the fish assemblage of the Mondego estuary (Portugal): Comparison between drought and non-drought years. Mar. Freshw. Res. 2010, 61, 490. [Google Scholar] [CrossRef]
- Dewson, Z.S.; James, A.B.W.; Death, R.G. A review of the consequences of decreased flow for instream habitat and macroinvertebrates. J. North Am. Benthol. Soc. 2007, 26, 401–415. [Google Scholar] [CrossRef]
- Lake, P.S. Ecological effects of perturbation by drought in flowing waters. Freshw. Biol. 2003, 48, 1161–1172. [Google Scholar] [CrossRef]
- Lake, P.S. Drought and Aquatic Ecosystems: Effects and Responses: Lake/Drought and Aquatic Ecosystems: Effects and Responses; John Wiley & Sons, Ltd: Chichester, UK, 2011; ISBN 978-1-4443-4181-2. [Google Scholar]
- Edwards, F.K.; Baker, R.; Dunbar, M.; Laize, C. A Review of the Processes and Effects of Droughts And Summer Floods in Rivers and Threats due to Clima te Change on Current Adaptive Strategies. Adaptive Strategies to Mitigate the Impacts of Climate Change on European Freshwater Ecosystems; Seventh Framework Programme. EU FP7; Centre for Ecology and Hydrology: Wallingford, UK, 2012. [Google Scholar]
- Delpla, I.; Jung, A.-V.; Baures, E.; Clement, M.; Thomas, O. Impacts of climate change on surface water quality in relation to drinking water production. Environ. Int. 2009, 35, 1225–1233. [Google Scholar] [CrossRef]
- Golladay, S.W.; Battle, J. Effects of Flooding and Drought on Water Quality in Gulf Coastal Plain Streams in Georgia. J. Environ. Qual. 2002, 31, 1266–1272. [Google Scholar] [CrossRef]
- Zwolsman, J.J.G.; van Bokhoven, A.J. Impact of summer droughts on water quality of the Rhine River—A preview of climate change? Water Sci. Technol. 2007, 56, 45–55. [Google Scholar] [CrossRef]
- Mosley, L.M. Drought impacts on the water quality of freshwater systems; review and integration. Earth-Sci. Rev. 2015, 140, 203–214. [Google Scholar] [CrossRef]
- Lutz, S.R.; Mallucci, S.; Diamantini, E.; Majone, B.; Bellin, A.; Merz, R. Hydroclimatic and water quality trends across three Mediterranean river basins. Sci. Total Environ. 2016, 571, 1392–1406. [Google Scholar] [CrossRef] [PubMed]
- Everard, M. The importance of periodic droughts for maintaining diversity in the freshwater environment. Freshw. Forum 1996, 7, 33–50. [Google Scholar]
- Schindler, D.W.; Bayley, S.E.; Parker, B.R.; Beaty, K.G.; Cruikshank, D.R.; Fee, E.J.; Schindler, E.U.; Stainton, M.P. The effects of climatic warming on the properties of boreal lakes and streams at the Experimental Lakes Area, northwestern Ontario. Limnol. Oceanogr 1996, 41, 1004–1017. [Google Scholar] [CrossRef]
- Choiński, A.; Ptak, M.; Ławniczak, A. Changes in Water Resources of Polish Lakes as Influenced by Natural and Anthropogenic Factors. Pol. J. Environ. Stud. 2016, 25, 1883–1890. [Google Scholar] [CrossRef]
- Czernecki, B.; Ptak, M. The impact of global warming on lake surface water temperature in Poland - the application of empirical-statistical downscaling, 1971–2100. J. Limnol. 2018, 77, 330–348. [Google Scholar] [CrossRef]
- Borowiak, D.; Barańczuk, J.; Nowiński, K. Transformations of thermal stratification in Upper Raduńskie Lake, In Anthropogenic and natural transformations of lakes, Vol. 2; Bajkiewicz-Grabowska, E., Borowiak, D., Eds.; Departament of Limnology, University of Gdańsk, Polish Limnological Society: Gdańsk, Poland, 2008; pp. 23–26. ISBN 8391038173, 9788391038178. [Google Scholar]
- Marszelewski, W.; Pius, B. Relation Between Air Temperature and Inland Surface Water Temperature During Climate Change (1961–2014): Case Study of the Polish Lowland. In Water Management and the Environment: Case Studies; Zelenakova, M., Ed.; Springer International Publishing: Cham, Switzerland, 2018; Volume 86, pp. 175–195. ISBN 978-3-319-79013-8. [Google Scholar]
- Wang, W.; Lee, X.; Xiao, W.; Liu, S.; Schultz, N.; Wang, Y.; Zhang, M.; Zhao, L. Global lake evaporation accelerated by changes in surface energy allocation in a warmer climate. Nat. Geosci. 2018, 11, 410–414. [Google Scholar] [CrossRef]
- Kirillin, G. Modeling the impact of global warming on water temperature and seasonal mixing regimes in small temperate lakes. Boreal Environ. Res. 2010, 15, 279–293. [Google Scholar]
- Perroud, M.; Goyette, S. Impact of warmer climate on Lake Geneva water temperature profiles. Boreal Environ. Res. 2010, 15, 255–278. [Google Scholar]
- Palmer, M.E.; Yan, N.D.; Somers, K.M. Climate change drives coherent trends in physics and oxygen content in North American lakes. Clim. Chang. 2014, 124, 285–299. [Google Scholar] [CrossRef]
- Gerten, D.; Adrian, R. Differences in the persistency of the North Atlantic Oscillation signal among lakes. Limnol. Oceanogr. 2001, 46, 448–455. [Google Scholar] [CrossRef]
- Jones, I.; Sahlberg, J.; Persson, I. Modelling the impact of climate change on the thermal characteristics of lakes. In The Impact of Climate Change on European Lakes; George, G., Ed.; Springer: Berlin, Germany, 2010; pp. 103–120. [Google Scholar]
- North, R.P.; North, R.L.; Livingstone, D.M.; Köster, O.; Kipfer, R. Long-term changes in hypoxia and soluble reactive phosphorus in the hypolimnion of a large temperate lake: Consequences of a climate regime shift. Glob. Chang. Biol. 2014, 20, 811–823. [Google Scholar] [CrossRef] [PubMed]
- Bartosiewicz, M.; Laurion, I.; Clayer, F.; Maranger, R. Heat-Wave Effects on Oxygen, Nutrients, and Phytoplankton Can Alter Global Warming Potential of Gases Emitted from a Small Shallow Lake. Environ. Sci. Technol. 2016, 50, 6267–6275. [Google Scholar] [CrossRef] [PubMed]
© 2020 by the authors. Licensee MDPI, Basel, Switzerland. This article is an open access article distributed under the terms and conditions of the Creative Commons Attribution (CC BY) license (http://creativecommons.org/licenses/by/4.0/).

