Lag Times as Indicators of Hydrological Mechanisms Responsible for NO3-N Flushing in a Forested Headwater Catchment
Abstract
1. Introduction
2. Materials and Methods
2.1. Study Area
2.2. Measurements and Data
2.3. Data Analysis
3. Results and Discussion
4. Conclusions
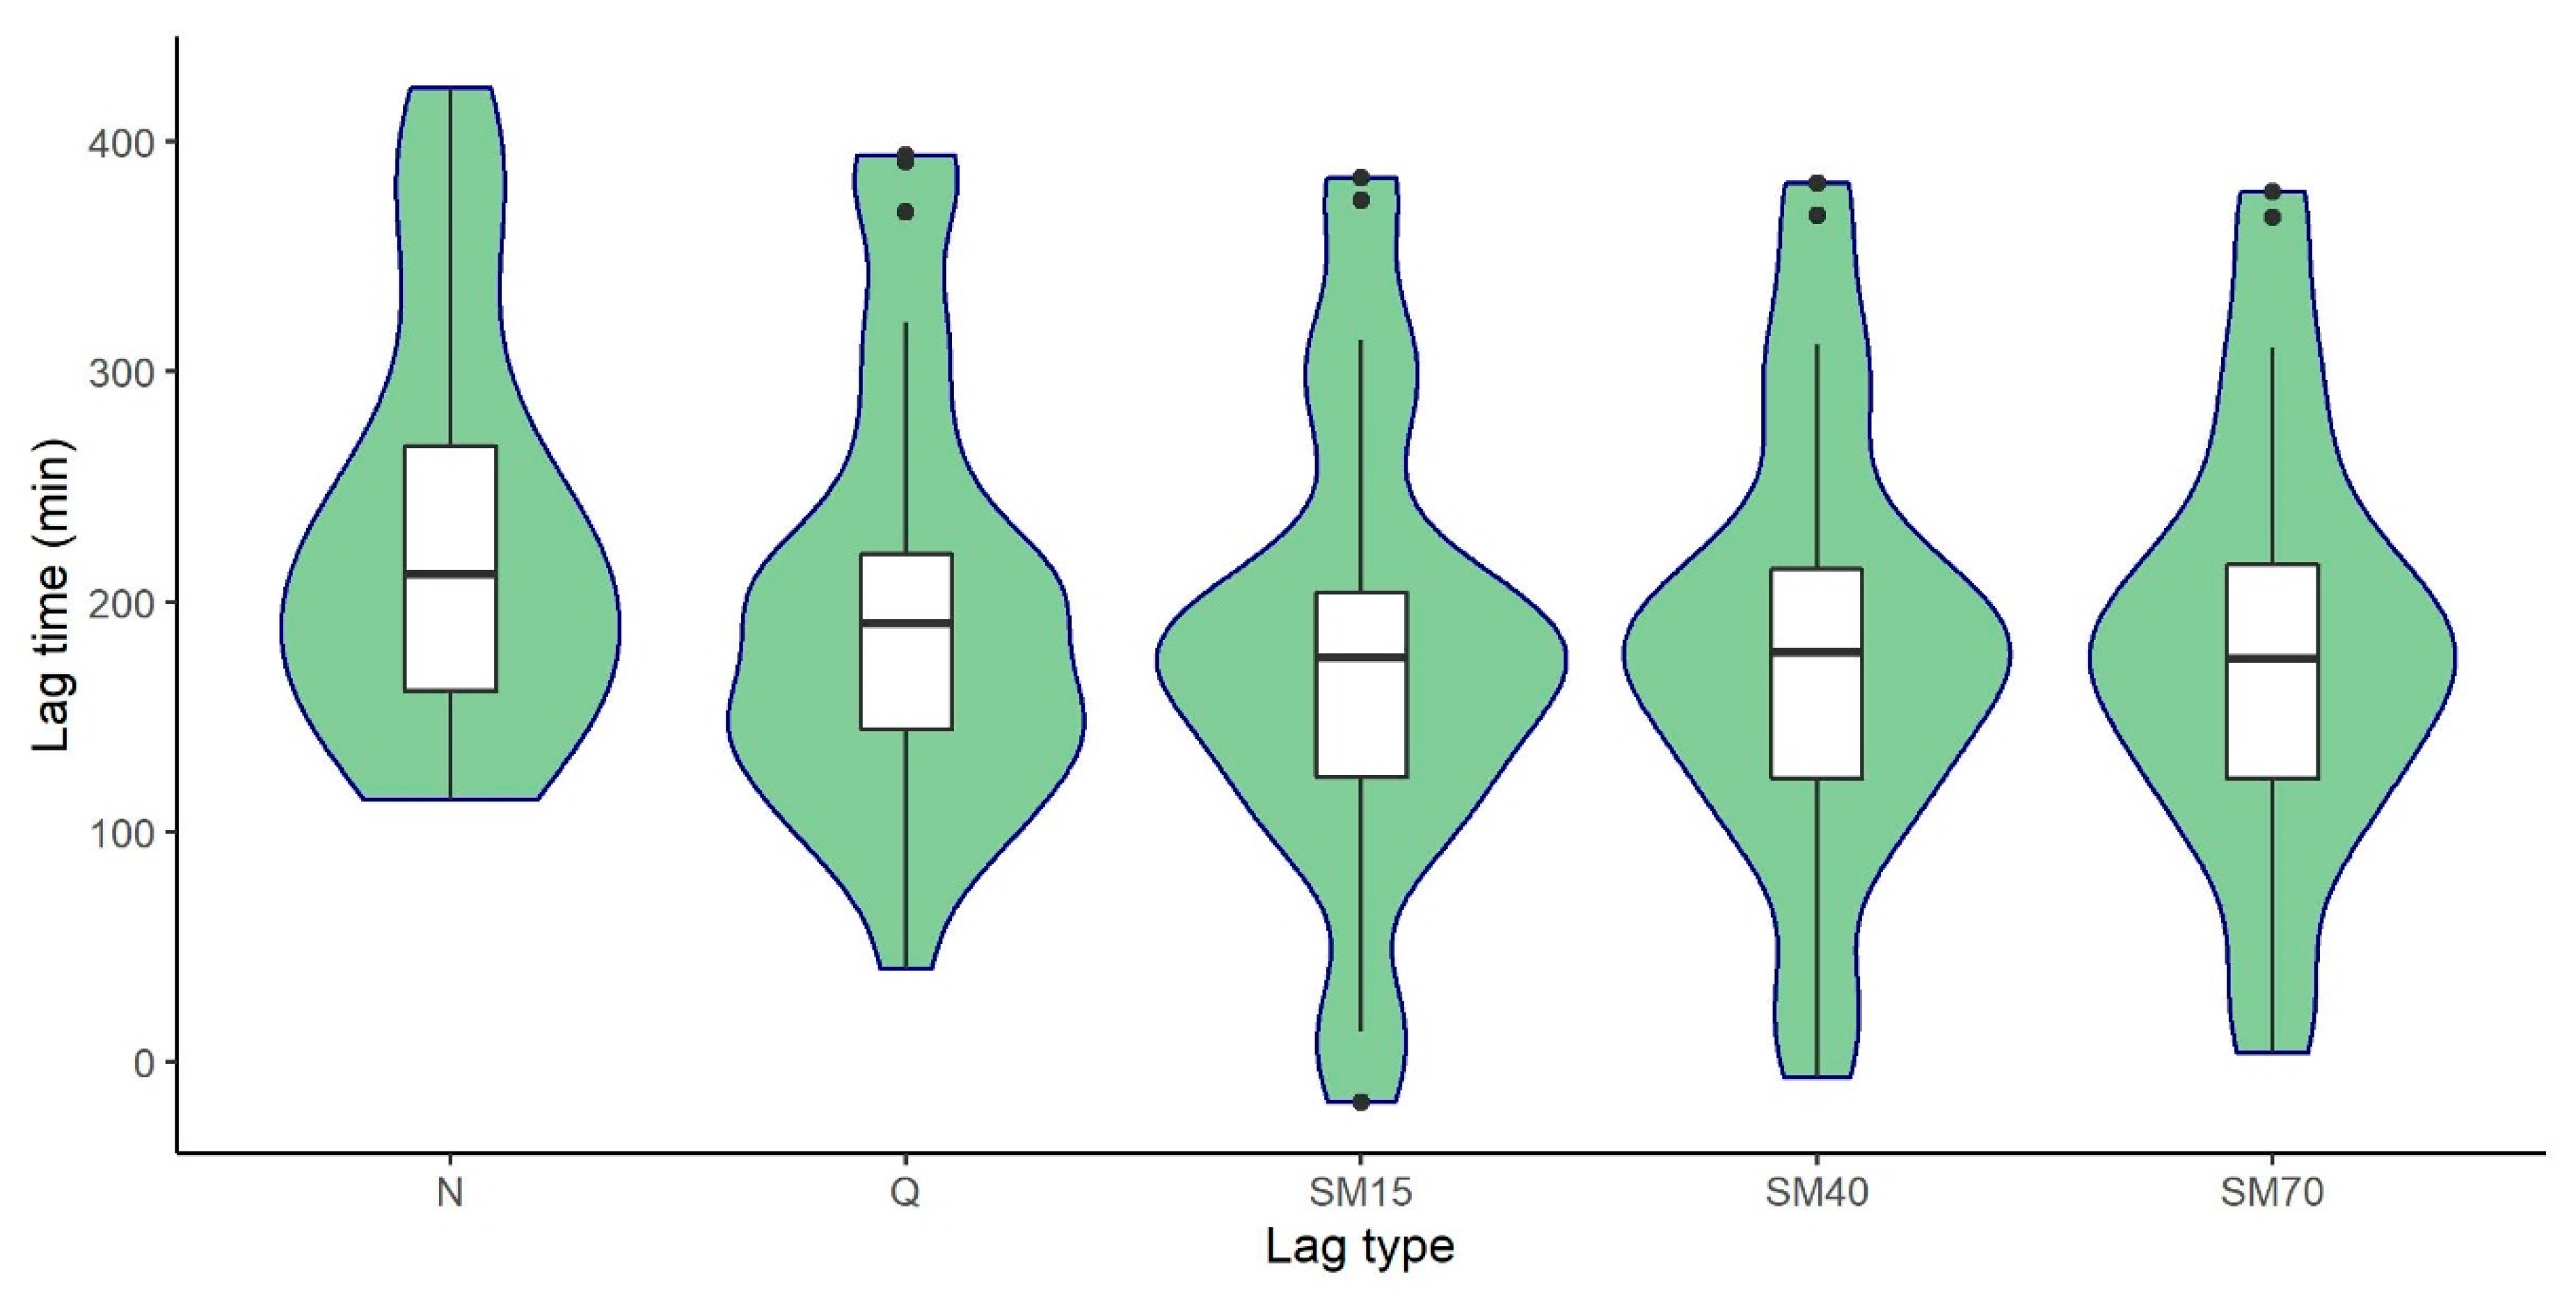
- The comparison of lag times by using linear and multiple linear regression analysis revealed high correlation (R2 0.98, p-value < 0.01) between the rainfall runoff formation processes and the nitrate flux formation.
- The lag time’s analysis indicates mechanisms which are able to control the NO3-N flux formation in relation to rainfall runoff. Regardless of the fact that the observed hydrological events were highly variable and occurred in contrasting seasonal antecedent hydrological conditions, the temporal NO3-N flux formation remained relatively constant in view of the stream discharge temporal dynamics.
- The results suggest that the forest catchment has the ability to considerably control the temporal dynamics of the NO3-N flux through rainfall runoff formation, even though the precipitation inputs, the stream discharge hydrographs, and the catchment wetness states are highly variable. Moreover, our results indicate that seasonally conditioned export regimes did not considerably influence the apparent strong connection between the lag times of NO3-N flux, discharge, and soil moisture.
Author Contributions
Funding
Conflicts of Interest
References
- Sterling, S.M.; Ducharne, A.; Polcher, J. The impact of global land-cover change on the terrestrial water cycle. Nat. Clim. Chang. 2013, 3, 385–390. [Google Scholar] [CrossRef]
- Bussi, G.; Janes, V.; Whitehead, P.G.; Dadson, S.J.; Holman, I.P. Dynamic response of land use and river nutrient concentration to long-term climatic changes. Sci. Total Environ. 2017, 590–591, 818–831. [Google Scholar] [CrossRef] [PubMed]
- Judd, K.E.; Likens, G.E.; Groffman, P.M. High nitrate retention during winter in soils of the Hubbard Brook Experimental Forest. Ecosystems 2007, 10, 217–225. [Google Scholar] [CrossRef]
- Rusjan, S.; Vidmar, A. The role of seasonal and hydrological conditions in regulating dissolved inorganic nitrogen budgets in a forested catchment in SW Slovenia. Sci. Total Environ. 2017, 575, 1109–1118. [Google Scholar] [CrossRef]
- van Verseveld, W.J.; McDonnell, J.J.; Lajtha, K. A mechanistic assessment of nutrient flushing at the catchment scale. J. Hydrol. 2008, 358, 268–287. [Google Scholar] [CrossRef]
- Ockerman, D.J.; Livingston, C.W. Nitrogen Concentrations and Deposition in Rainfall at Two Sites in the Coastal Bend Area, South Texas, 1996–1998; U.S. Geological Survey: Austin, TX, USA, 1999; 6p. [CrossRef]
- Blaen, P.J.; Khamis, K.; Lloyd, C.E.M.; Bradley, C.; Hannah, D.; Krause, S. Real-time monitoring of nutrients and dissolved organic matter in rivers: Capturing event dynamics, technological opportunities and future directions. Sci. Total Environ. 2016, 569–570, 647–660. [Google Scholar] [CrossRef]
- Blaen, P.J.; Khamis, K.; Lloyd, C.; Comer-Warner, S.; Ciocca, F.; Thomas, R.M.; MacKenzie, A.R.; Krause, S. High-frequency monitoring of catchment nutrient exports reveals highly variable storm event responses and dynamic source zone activation. J. Geophys. Res. Biogeosci. 2017, 122, 2265–2281. [Google Scholar] [CrossRef]
- Duncan, J.M.; Band, L.E.; Groffman, P.M. Variable nitrate concentration–discharge relationships in a forested watershed. Hydrol. Process. 2017, 31, 1817–1824. [Google Scholar] [CrossRef]
- Aguilera, R.; Melack, J.M. Concentration-Discharge Responses to Storm Events in Coastal California Watersheds. Water Resour. Res. 2018, 54, 407–424. [Google Scholar] [CrossRef]
- Lewis, W.M.; Melack, J.M.; McDowell, W.H.; McClain, M.; Richey, J.E. Nitrogen yields from undisturbed watersheds in the Americas. Biogeochemistry 1999, 46, 149–162. [Google Scholar] [CrossRef]
- Rodríguez-Blanco, M.L.; Taboada-Castro, M.M.; Arias, R.; Taboada-Castro, M.T. Inter- and Intra-Annual Variability of Nitrogen Concentrations in the Headwaters of the Mero River. In Nitrogen in Agriculture; Amanullah, K., Fahad, S., Eds.; IntechOpen: Rijeka, Croatia, 2018. [Google Scholar] [CrossRef]
- Musolff, A.; Schmidt, C.; Selle, B.; Fleckenstein, J.H. Catchment controls on solute export. Adv. Water Resour. 2015, 86, 133–146. [Google Scholar] [CrossRef]
- Andrea, B.; Francesc, G.; Jérôme, L.; Eusebi, V.; Francesc, S. Cross-site comparison of variability of DOC and nitrate c-q hysteresis during the autumn-winter period in three Mediterranean headwater streams: A synthetic approach. Biogeochemistry 2006, 77, 327–349. [Google Scholar] [CrossRef]
- Lawler, D.M.; Petts, G.E.; Foster, I.D.L.; Harper, S. Turbidity dynamics during spring storm events in an urban headwater river system: The Upper Tame, West Midlands, UK. Sci. Total Environ. 2006, 360, 109–126. [Google Scholar] [CrossRef] [PubMed]
- Zuecco, G.; Penna, D.; Borga, M.; van Meerveld, H.J. A versatile index to characterize hysteresis between hydrological variables at the runoff event timescale. Hydrol. Process. 2016, 30, 1449–1466. [Google Scholar] [CrossRef]
- Prowse, C.W. Some Thoughts on Lag and Hysteresis. Area 1984, 16, 17–23. [Google Scholar]
- Lloyd, C.E.M.; Freer, J.E.; Johnes, P.J.; Coxon, G.; Collins, A.L. Discharge and nutrient uncertainty: Implications for nutrient flux estimation in small streams. Hydrol. Process. 2016, 30, 135–152. [Google Scholar] [CrossRef]
- Rusjan, S.; Mikoš, M. Assessment of hydrological and seasonal controls over the nitrate flushing from a forested watershed using a data mining technique. Hydrol. Earth Syst. Sci. 2008, 12, 645–656. [Google Scholar] [CrossRef]
- Higashino, M.; Stefan, H.G. Modeling the effect of rainfall intensity on soil-water nutrient exchange in flooded rice paddies and implications for nitrate fertilizer runoff to the Oita River in Japan. Water Resour. Res. 2014, 50, 8611–8624. [Google Scholar] [CrossRef]
- El-sadek, A.; Radwan, M.; Abdel-gawad, S.; Chairperson, V.; Water, N.; Barrage, D. Analysis of load vs concentration as water quality measures. In Proceedings of the Ninth International Egyptian Water Technology Conference, Sharm El-Sheikh, Egypt, 17–20 March 2005; pp. 1281–1292. [Google Scholar]
- Marciniak, M.; Szczucińska, A. Determination of diurnal water level fluctuations in headwaters. Hydrol. Res. 2016, 47, 888–901. [Google Scholar] [CrossRef]
- Banasik, K.; Madeyski, M.; Mitchell, J.K.; Mori, K. An investigation of lag times for rainfall-runoff-sediment yield events in small river basins. Hydrol. Sci. J. 2005, 50, 857–866. [Google Scholar] [CrossRef]
- Bezak, N.; Grigillo, D.; Urbančič, T.; Mikoš, M.; Petrovič, D.; Rusjan, S. Geomorphic response detection and quantification in a steep forested torrent. Geomorphology 2017, 291, 33–44. [Google Scholar] [CrossRef]
- Bezak, N.; Šraj, M.; Rusjan, S.; Kogoj, M.; Vidmar, A.; Sečnik, M.; Brilly, M.; Mikoš, M. Primerjava Dveh Sosednjih Eksperimentalnih Hudourniških Porečij: Kuzlovec in Mačkov Graben = Comparison Between Two Adjacent Experimental Torrential Watersheds: Kuzlovec and Mačkov Graben. Acta Hydrotech. 2015, 45, 85–97. [Google Scholar]
- American Institute of Hydrology. Challenges in Coastal Hydrology and Water Quality. In Proceedings of the Coastal Hydrology and Processes: Proceedings of the AIH 25th Anniversary Meeting & International Conference; Singh, V.P., Xu, Y.J., Eds.; Water Resources Publications: Highland Ranch, CO, USA, 2006; 509p. [Google Scholar]
- Archive of Slovenian Environment Agency of meteorological data observed and measured in Slovenia. Available online: http://www.meteo.si/met/sl/archive/ (accessed on 3 February 2020).
- Bezak, N.; Rusjan, S.; Fijavž, M.K.; Mikoš, M.; Šraj, M. Estimation of suspended sediment loads using copula functions. Water 2017, 9, 628. [Google Scholar] [CrossRef]
- Guo, Y. Development of Analytical Probabilistic Urban Stormwater Models. Ph.D. Thesis, Department of Civil Engineering, University of Toronto, Toronto, ON, Canada, 1998. [Google Scholar]
- Adams, B.J.; Papa, F. Urban Stormwater Management Planning with Analytical Probabilistic Models; Wiley: New York, NY, USA, 2000; 376p. [Google Scholar]
- US Army Corps of Engineers Hydrologic Modeling System HEC-HMS User’s Manual CPD-74A; US Army Corps of Engineers: Davis, CA, USA, 2016; p. 598.
- Hejduk, A.; Banasik, K. Recorded lag times of snowmelt events in a small catchment. Ann. Warsaw Univ. Life Sci. SGGW Land Reclam. 2011, 43, 37–46. [Google Scholar] [CrossRef]
- R Core Team. R: A Language and Environment for Statistical Computing; R Foundation for Statistical Computing: Vienna, Austria, 2020; Available online: https://www.R-project.org/ (accessed on 3 February 2020).
- Mao, L. The effect of hydrographs on bed load transport and bed sediment spatial arrangement. J. Geophys. Res. Earth Surf. 2012, 117, 1–16. [Google Scholar] [CrossRef]


| Event | Pduration (min) | Pamount (mm) | Imean (mm/min) | Imax (mm/min) | Qmax (L/s) | ΔQ (L/s) | Cmax (mg/L) | ΔC (mg/L) | SM15 | SM40 | SM70 |
|---|---|---|---|---|---|---|---|---|---|---|---|
| 1 | 180 | 15 | 0.083 | 0.6 | 8.76 | 5.15 | 1.17 | 0.62 | 0.31 | 0.25 | 0.16 |
| 2 | 1100 | 35.7 | 0.032 | 0.33 | 7.18 | 3.12 | 1.52 | 0.81 | 0.33 | 0.27 | 0.17 |
| 3 | 200 | 60.3 | 0.302 | 1.425 | 60.27 | 55.97 | 2.11 | 1.47 | 0.33 | 0.27 | 0.17 |
| 4 | 240 | 35.7 | 0.149 | 0.495 | 22.01 | 16.79 | 2.30 | 1.06 | 0.34 | 0.28 | 0.17 |
| 5 | 40 | 10.2 | 0.255 | 0.405 | 6.64 | 3.04 | 1.45 | 0.12 | 0.34 | 0.26 | 0.15 |
| 6 | 560 | 11.55 | 0.021 | 0.21 | 5.98 | 3.65 | 1.19 | 0.17 | 0.32 | 0.24 | 0.15 |
| 7 | 380 | 34.2 | 0.090 | 0.315 | 8.14 | 4.42 | 3.08 | 2.33 | 0.33 | 0.26 | 0.16 |
| 8 | 200 | 13.5 | 0.068 | 0.135 | 3.94 | 1.53 | - | - | 0.32 | 0.26 | 0.16 |
| 9 | 540 | 14.7 | 0.027 | 0.255 | 5.82 | 3.49 | - | - | 0.33 | 0.27 | 0.15 |
| 10 | 300 | 30.9 | 0.103 | 0.405 | 7.55 | 5.51 | - | - | 0.32 | 0.26 | 0.16 |
| 11 | 460 | 15.45 | 0.034 | 0.09 | 4.95 | 2.77 | - | - | 0.35 | 0.27 | 0.15 |
| 12 | 480 | 15.6 | 0.033 | 0.09 | 4.55 | 2.06 | - | - | 0.34 | 0.26 | 0.14 |
| 13 | 140 | 15.9 | 0.114 | 0.255 | 5.09 | 2.91 | - | - | 0.35 | 0.27 | 0.15 |
| 14 | 900 | 12 | 0.013 | 0.06 | 4.95 | 2.62 | - | - | 0.35 | 0.25 | 0.14 |
| 15 | 840 | 14.7 | 0.018 | 0.09 | 3.20 | 1.23 | - | - | 0.36 | 0.27 | 0.15 |
| 16 | 1180 | 15.9 | 0.013 | 0.075 | 5.37 | 2.72 | - | - | 0.37 | 0.28 | 0.16 |
| 17 | 860 | 16.5 | 0.019 | 0.06 | 4.68 | 2.71 | 0.75 | 0.18 | 0.37 | 0.28 | 0.16 |
| 18 | 1040 | 15.9 | 0.015 | 0.06 | 5.52 | 2.95 | 0.81 | 0.15 | 0.37 | 0.28 | 0.16 |
| 19 | 980 | 24.9 | 0.025 | 0.225 | 5.37 | 2.80 | 0.85 | 0.28 | 0.37 | 0.28 | 0.16 |
| 20 | 2400 | 63 | 0.026 | 0.15 | 9.88 | 7.70 | 0.92 | 0.29 | 0.38 | 0.29 | 0.16 |
| 21 | 1160 | 44.4 | 0.038 | 0.315 | 14.53 | 11.43 | 0.97 | 0.28 | 0.38 | 0.29 | 0.16 |
| 22 | 660 | 12 | 0.018 | 0.09 | 6.31 | 2.48 | 0.86 | 0.08 | 0.38 | 0.28 | 0.16 |
| 23 | 800 | 33.6 | 0.042 | 0.165 | 10.36 | 4.37 | 0.97 | 0.16 | 0.38 | 0.29 | 0.17 |
| 24 | 920 | 36.3 | 0.039 | 0.165 | 8.97 | 6.64 | 0.82 | 0.23 | 0.38 | 0.28 | 0.16 |
| 25 | 1520 | 49.2 | 0.032 | 0.12 | 13.02 | 10.69 | 0.94 | 0.27 | 0.39 | 0.28 | 0.16 |
| 26 | 460 | 15.6 | 0.034 | 0.195 | 8.34 | 2.03 | - | - | 0.39 | 0.29 | 0.18 |
| 27 | 220 | 18.6 | 0.085 | 0.15 | 7.94 | 1.47 | - | - | 0.39 | 0.29 | 0.17 |
| 28 | 860 | 43.5 | 0.051 | 0.165 | 17.60 | 12.79 | 3.28 | 1.76 | 0.39 | 0.29 | 0.18 |
| 29 | 740 | 24.3 | 0.033 | 0.165 | 10.11 | 3.81 | 2.71 | 1.00 | 0.39 | 0.29 | 0.17 |
| Variable | Description | Units |
|---|---|---|
| Pduration | duration of rainfall | min |
| Pamount | amount of rainfall | mm |
| Imean | mean intensity | mm/min |
| Imax | maximum intensity | mm/min |
| ΔC | difference between max and min NO3-N concentration during the event | mg/L |
| Cmax | maximum concentration of NO3-N | mg/L |
| ΔQ | difference between maximum and minimum stream discharge during the event | L/s |
| Qmax | maximum stream discharge | L/s |
| ΔSM15 | difference between maximum and minimum soil water content in 15 cm depth layer | m3/m3 |
| ΔSM40 | difference between maximum and minimum soil water content in 40 cm depth layer | m3/m3 |
| ΔSM70 | difference between maximum and minimum soil water content in 70 cm depth layer | m3/m3 |
| LAGN | LAGQ | ||||||||||
|---|---|---|---|---|---|---|---|---|---|---|---|
| Variable | Estimate | Standard Error | t Value | Pr (>|t|) | Sign. | Variable | Estimate | Standard Error | t Value | Pr (>|t|) | Sign. |
| Intercept | 210.30 | 99.27 | 2.12 | 0.08 | * | (Intercept) | 252.10 | 108.30 | 2.33 | 0.06 | * |
| Pduration | −0.09 | 0.08 | −1.13 | 0.30 | Pduration | −0.10 | 0.09 | −1.07 | 0.33 | ||
| Pamount | 10.98 | 3.34 | 3.29 | 0.02 | ** | Pamount | 11.62 | 3.64 | 3.19 | 0.02 | ** |
| Imean | −582.00 | 438.50 | −1.33 | 0.23 | Imean | −746.90 | 478.50 | −1.56 | 0.17 | ||
| Imax | 29.13 | 212.80 | 0.14 | 0.90 | Imax | 139.50 | 232.20 | 0.60 | 0.57 | ||
| ΔC | 108.60 | 121.00 | 0.90 | 0.40 | ΔC | 136.30 | 132.10 | 1.03 | 0.34 | ||
| Cmax | −106.70 | 83.28 | −1.28 | 0.25 | Cmax | −130.80 | 90.88 | −1.44 | 0.20 | ||
| ΔQ | −23.49 | 15.09 | −1.56 | 0.17 | ΔQ | −24.72 | 16.46 | −1.50 | 0.18 | ||
| Qmax | 18.02 | 16.12 | 1.12 | 0.31 | Qmax | 17.57 | 17.59 | 1.00 | 0.36 | ||
| ΔSM15 | 13,180.00 | 5190.00 | 2.54 | 0.04 | ** | ΔSM15 | 10,910.00 | 5664.00 | 1.93 | 0.10 | |
| ΔSM40 | −6649.00 | 2748.00 | −2.42 | 0.05 | * | ΔSM40 | −6994.00 | 2999.00 | −2.33 | 0.06 | * |
| ΔSM70 | −3024.00 | 1730.00 | −1.75 | 0.13 | ΔSM70 | −3591.00 | 1888.00 | −1.90 | 0.11 | ||
© 2020 by the authors. Licensee MDPI, Basel, Switzerland. This article is an open access article distributed under the terms and conditions of the Creative Commons Attribution (CC BY) license (http://creativecommons.org/licenses/by/4.0/).
Share and Cite
Sapač, K.; Vidmar, A.; Bezak, N.; Rusjan, S. Lag Times as Indicators of Hydrological Mechanisms Responsible for NO3-N Flushing in a Forested Headwater Catchment. Water 2020, 12, 1092. https://doi.org/10.3390/w12041092
Sapač K, Vidmar A, Bezak N, Rusjan S. Lag Times as Indicators of Hydrological Mechanisms Responsible for NO3-N Flushing in a Forested Headwater Catchment. Water. 2020; 12(4):1092. https://doi.org/10.3390/w12041092
Chicago/Turabian StyleSapač, Klaudija, Andrej Vidmar, Nejc Bezak, and Simon Rusjan. 2020. "Lag Times as Indicators of Hydrological Mechanisms Responsible for NO3-N Flushing in a Forested Headwater Catchment" Water 12, no. 4: 1092. https://doi.org/10.3390/w12041092
APA StyleSapač, K., Vidmar, A., Bezak, N., & Rusjan, S. (2020). Lag Times as Indicators of Hydrological Mechanisms Responsible for NO3-N Flushing in a Forested Headwater Catchment. Water, 12(4), 1092. https://doi.org/10.3390/w12041092


