Location Suitability for Small Reservoirs at the Bodri-Kuto River Basin Based on Spatial Monthly SPI

 , and
, and
Abstract
:1. Introduction
2. Materials and Methods
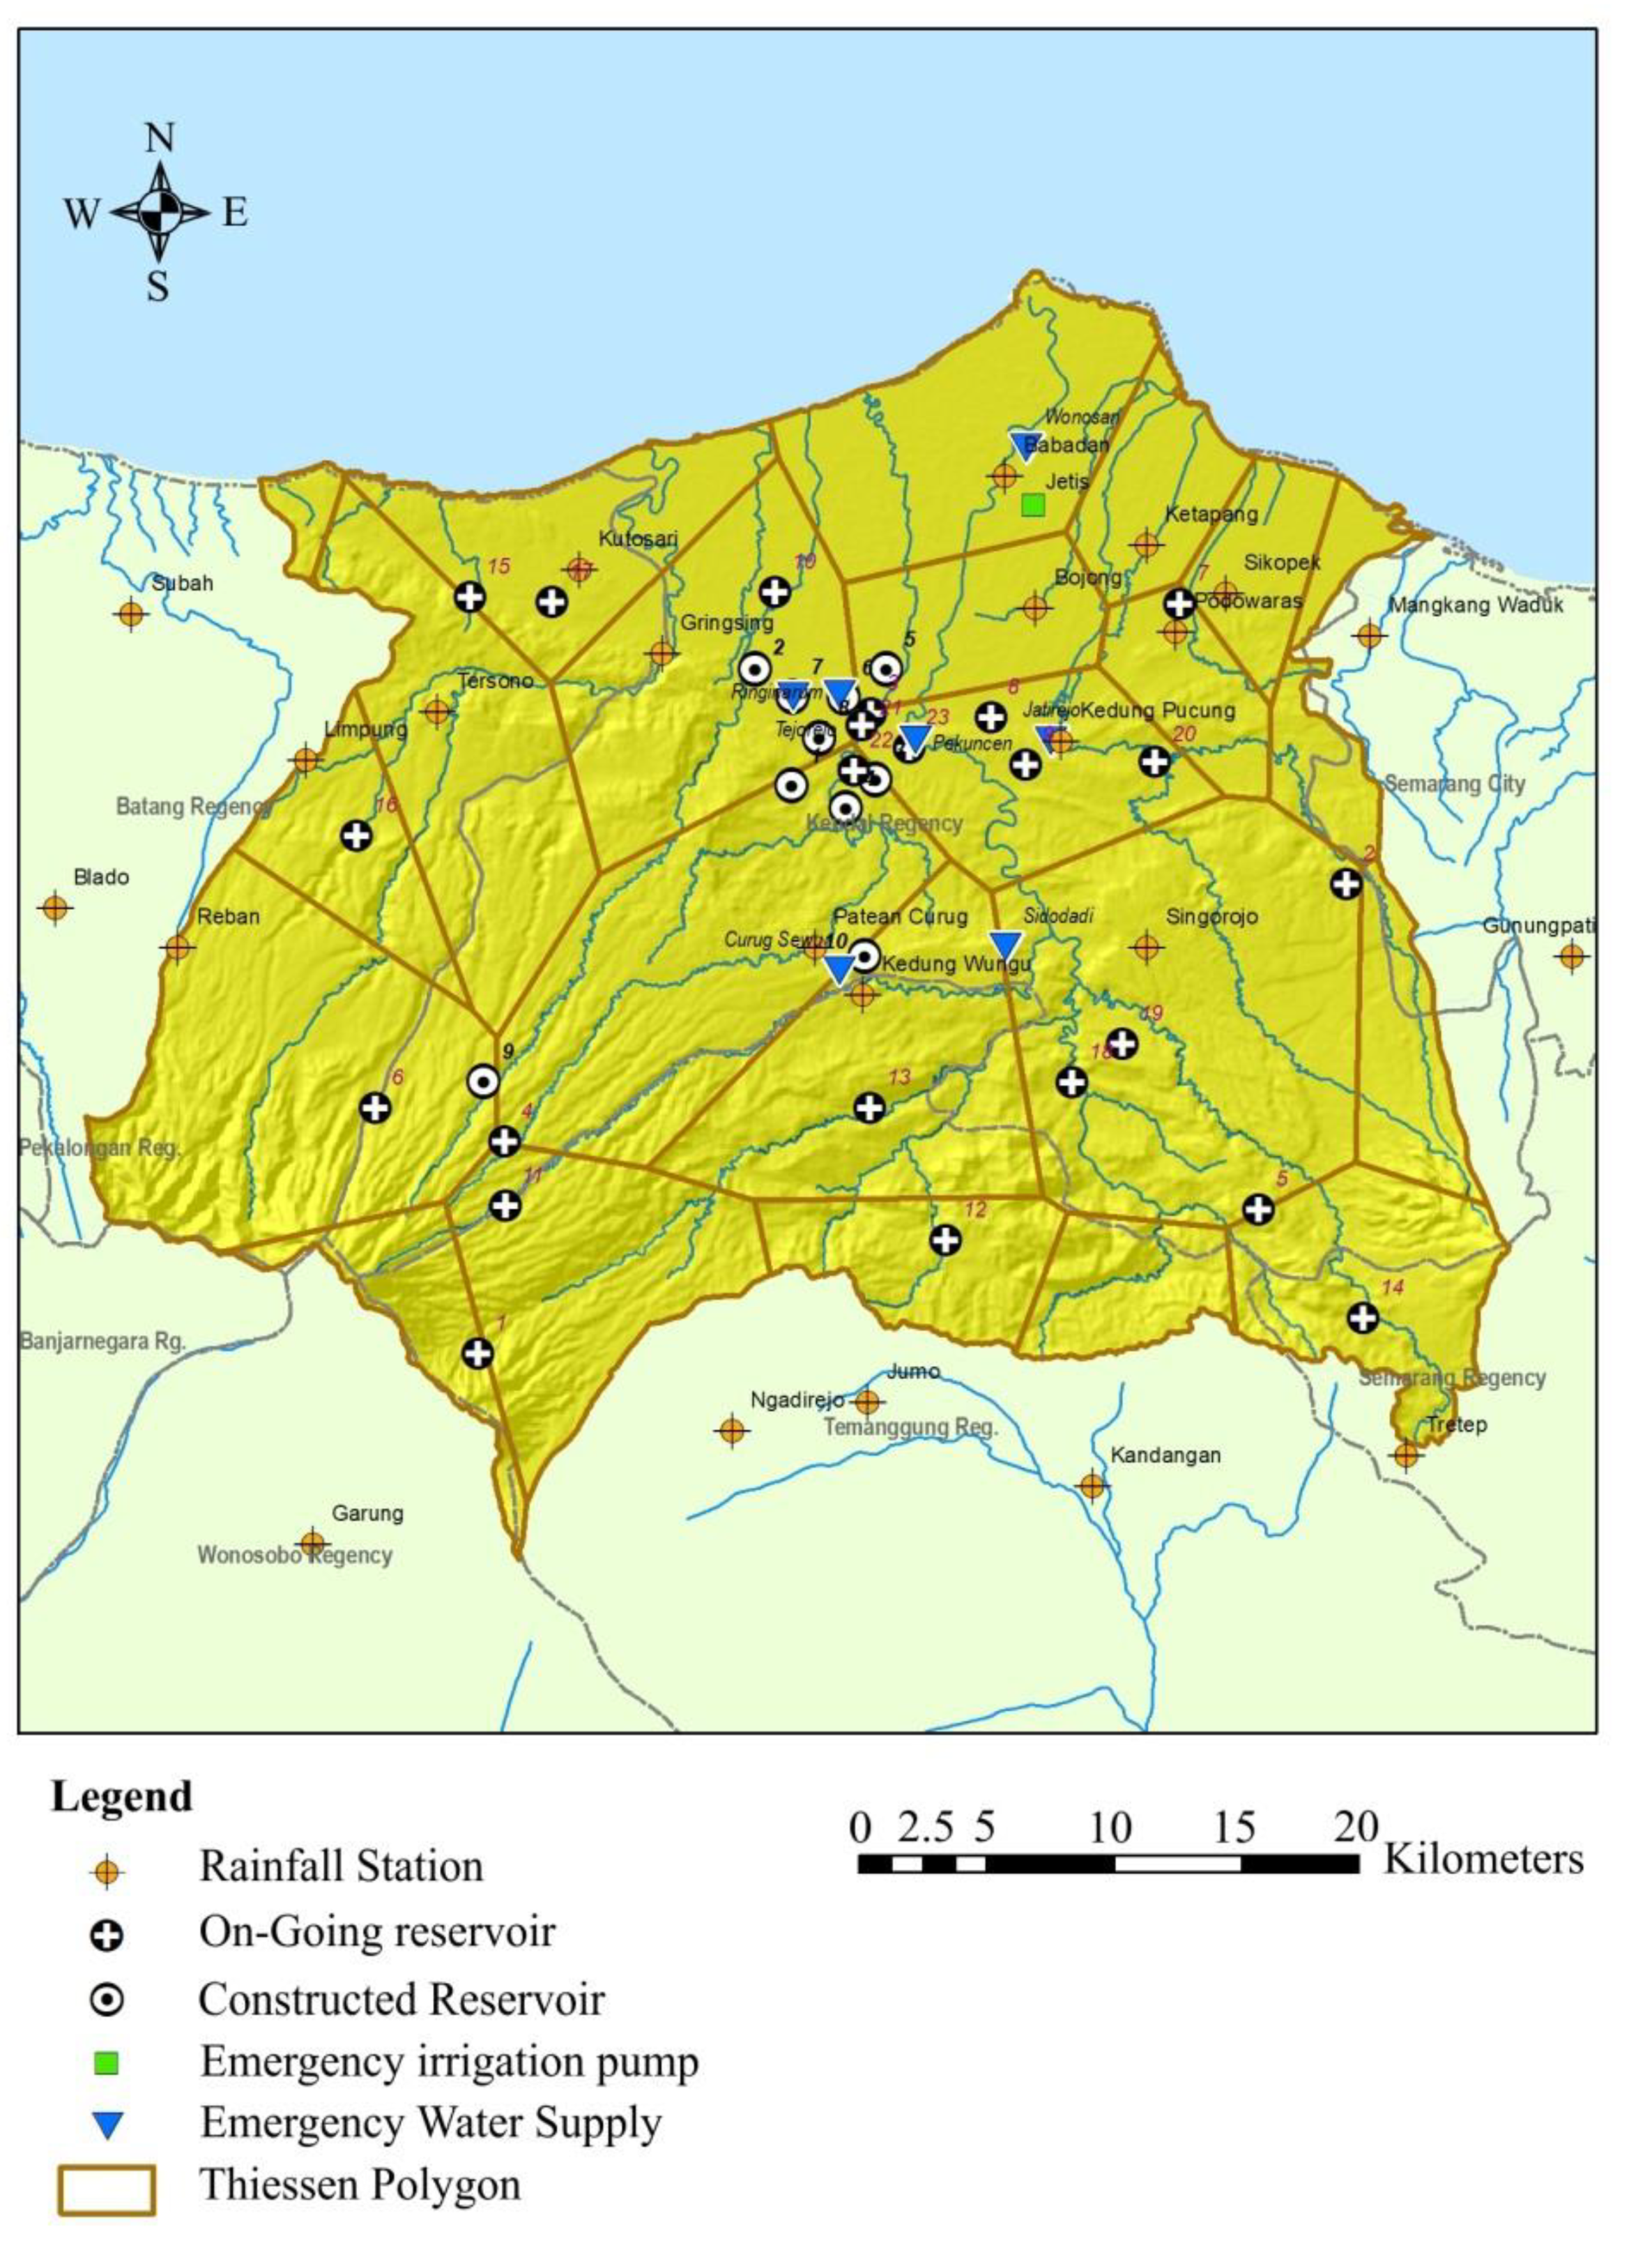
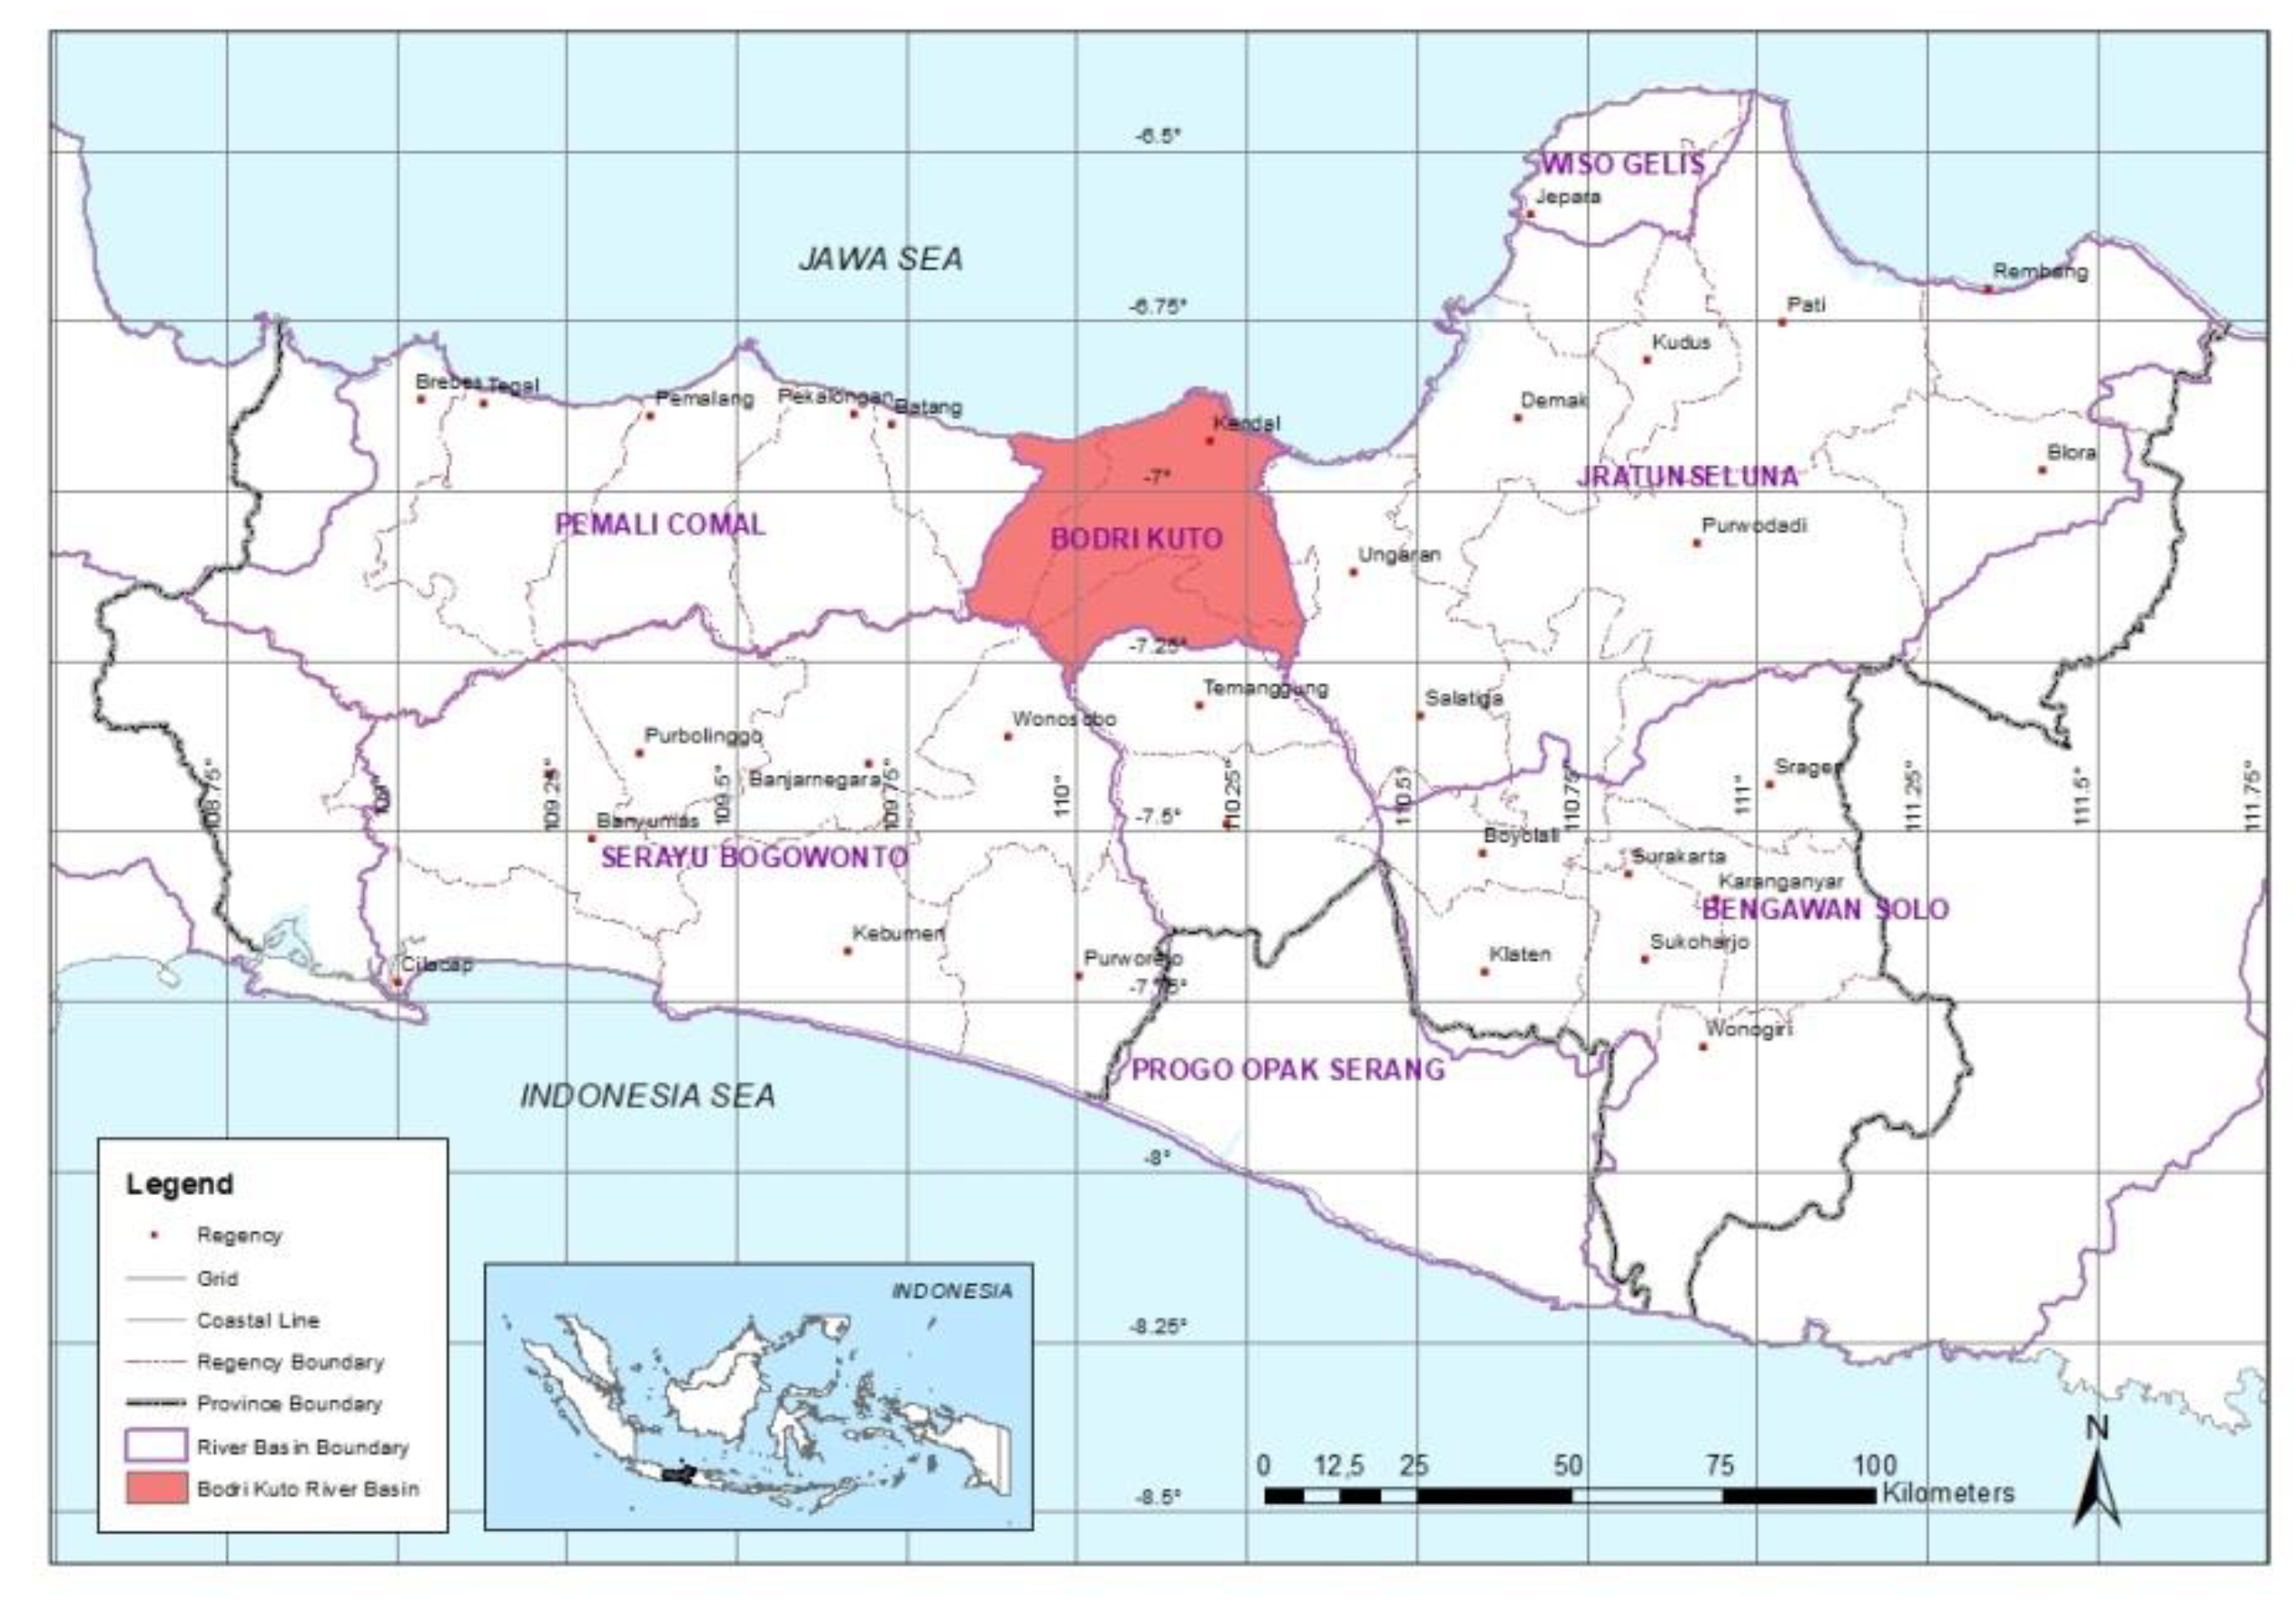
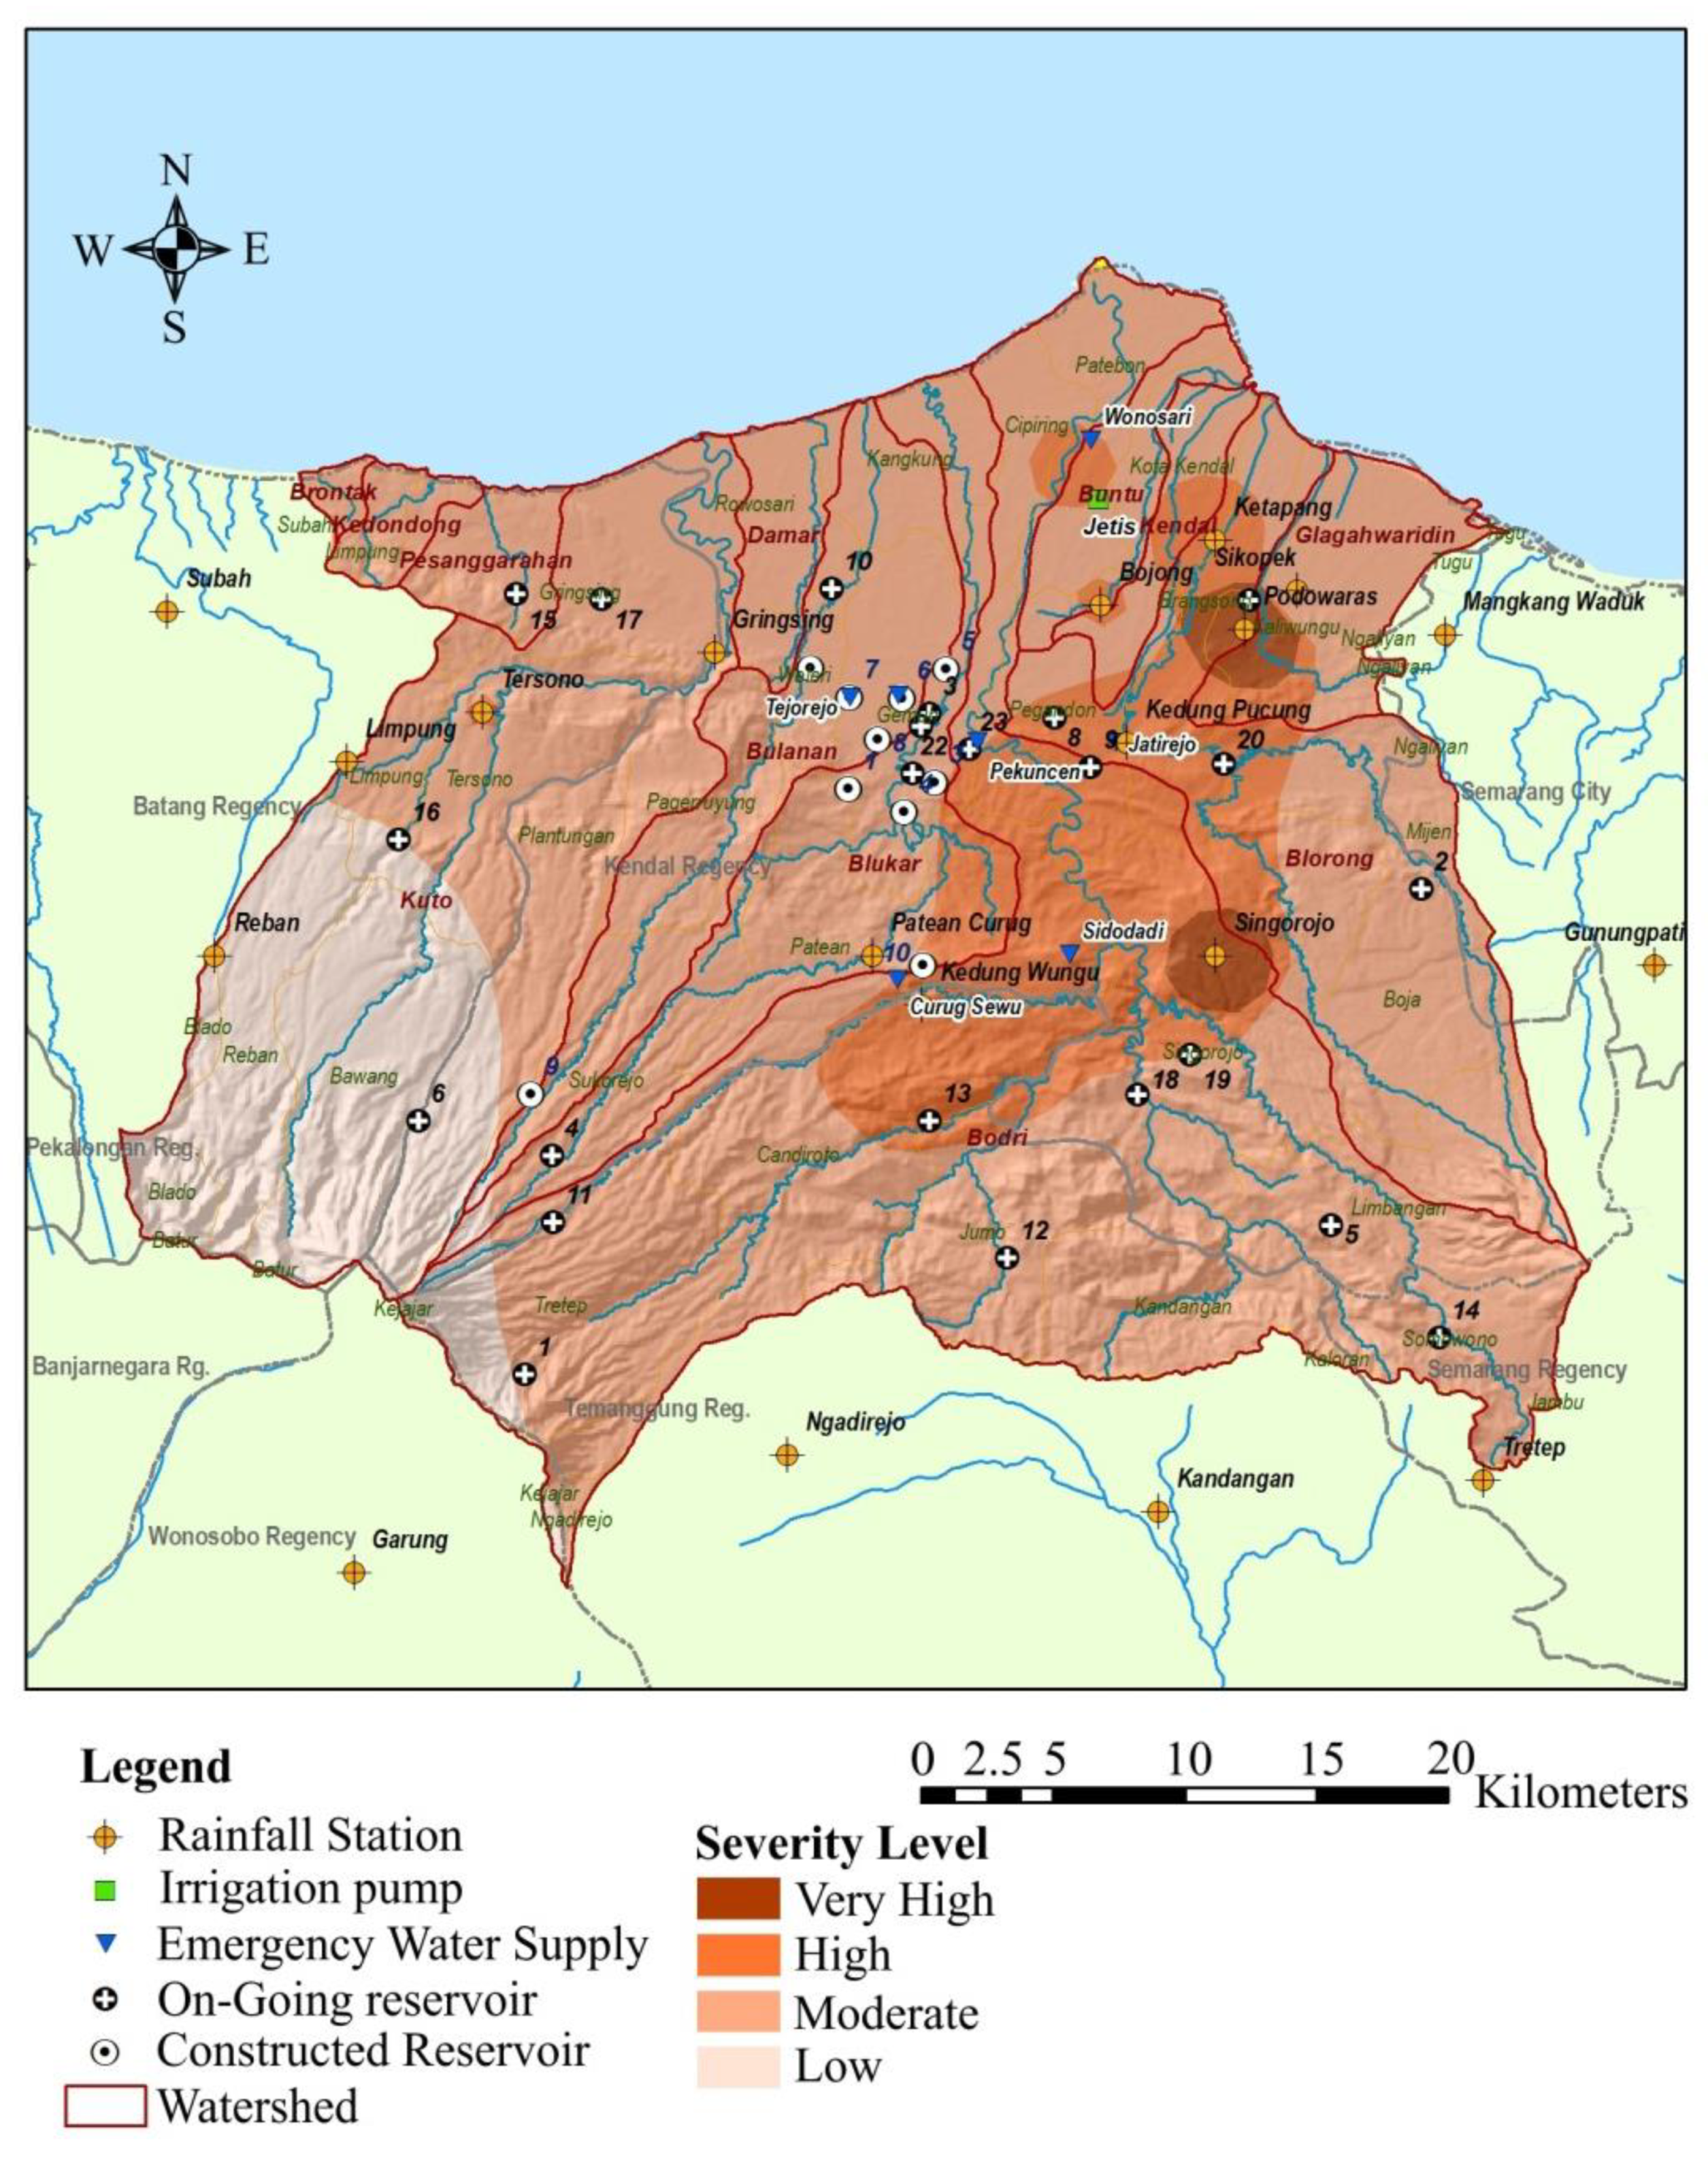
2.1. Location
2.2. Data
2.3. Analysis
3. Results
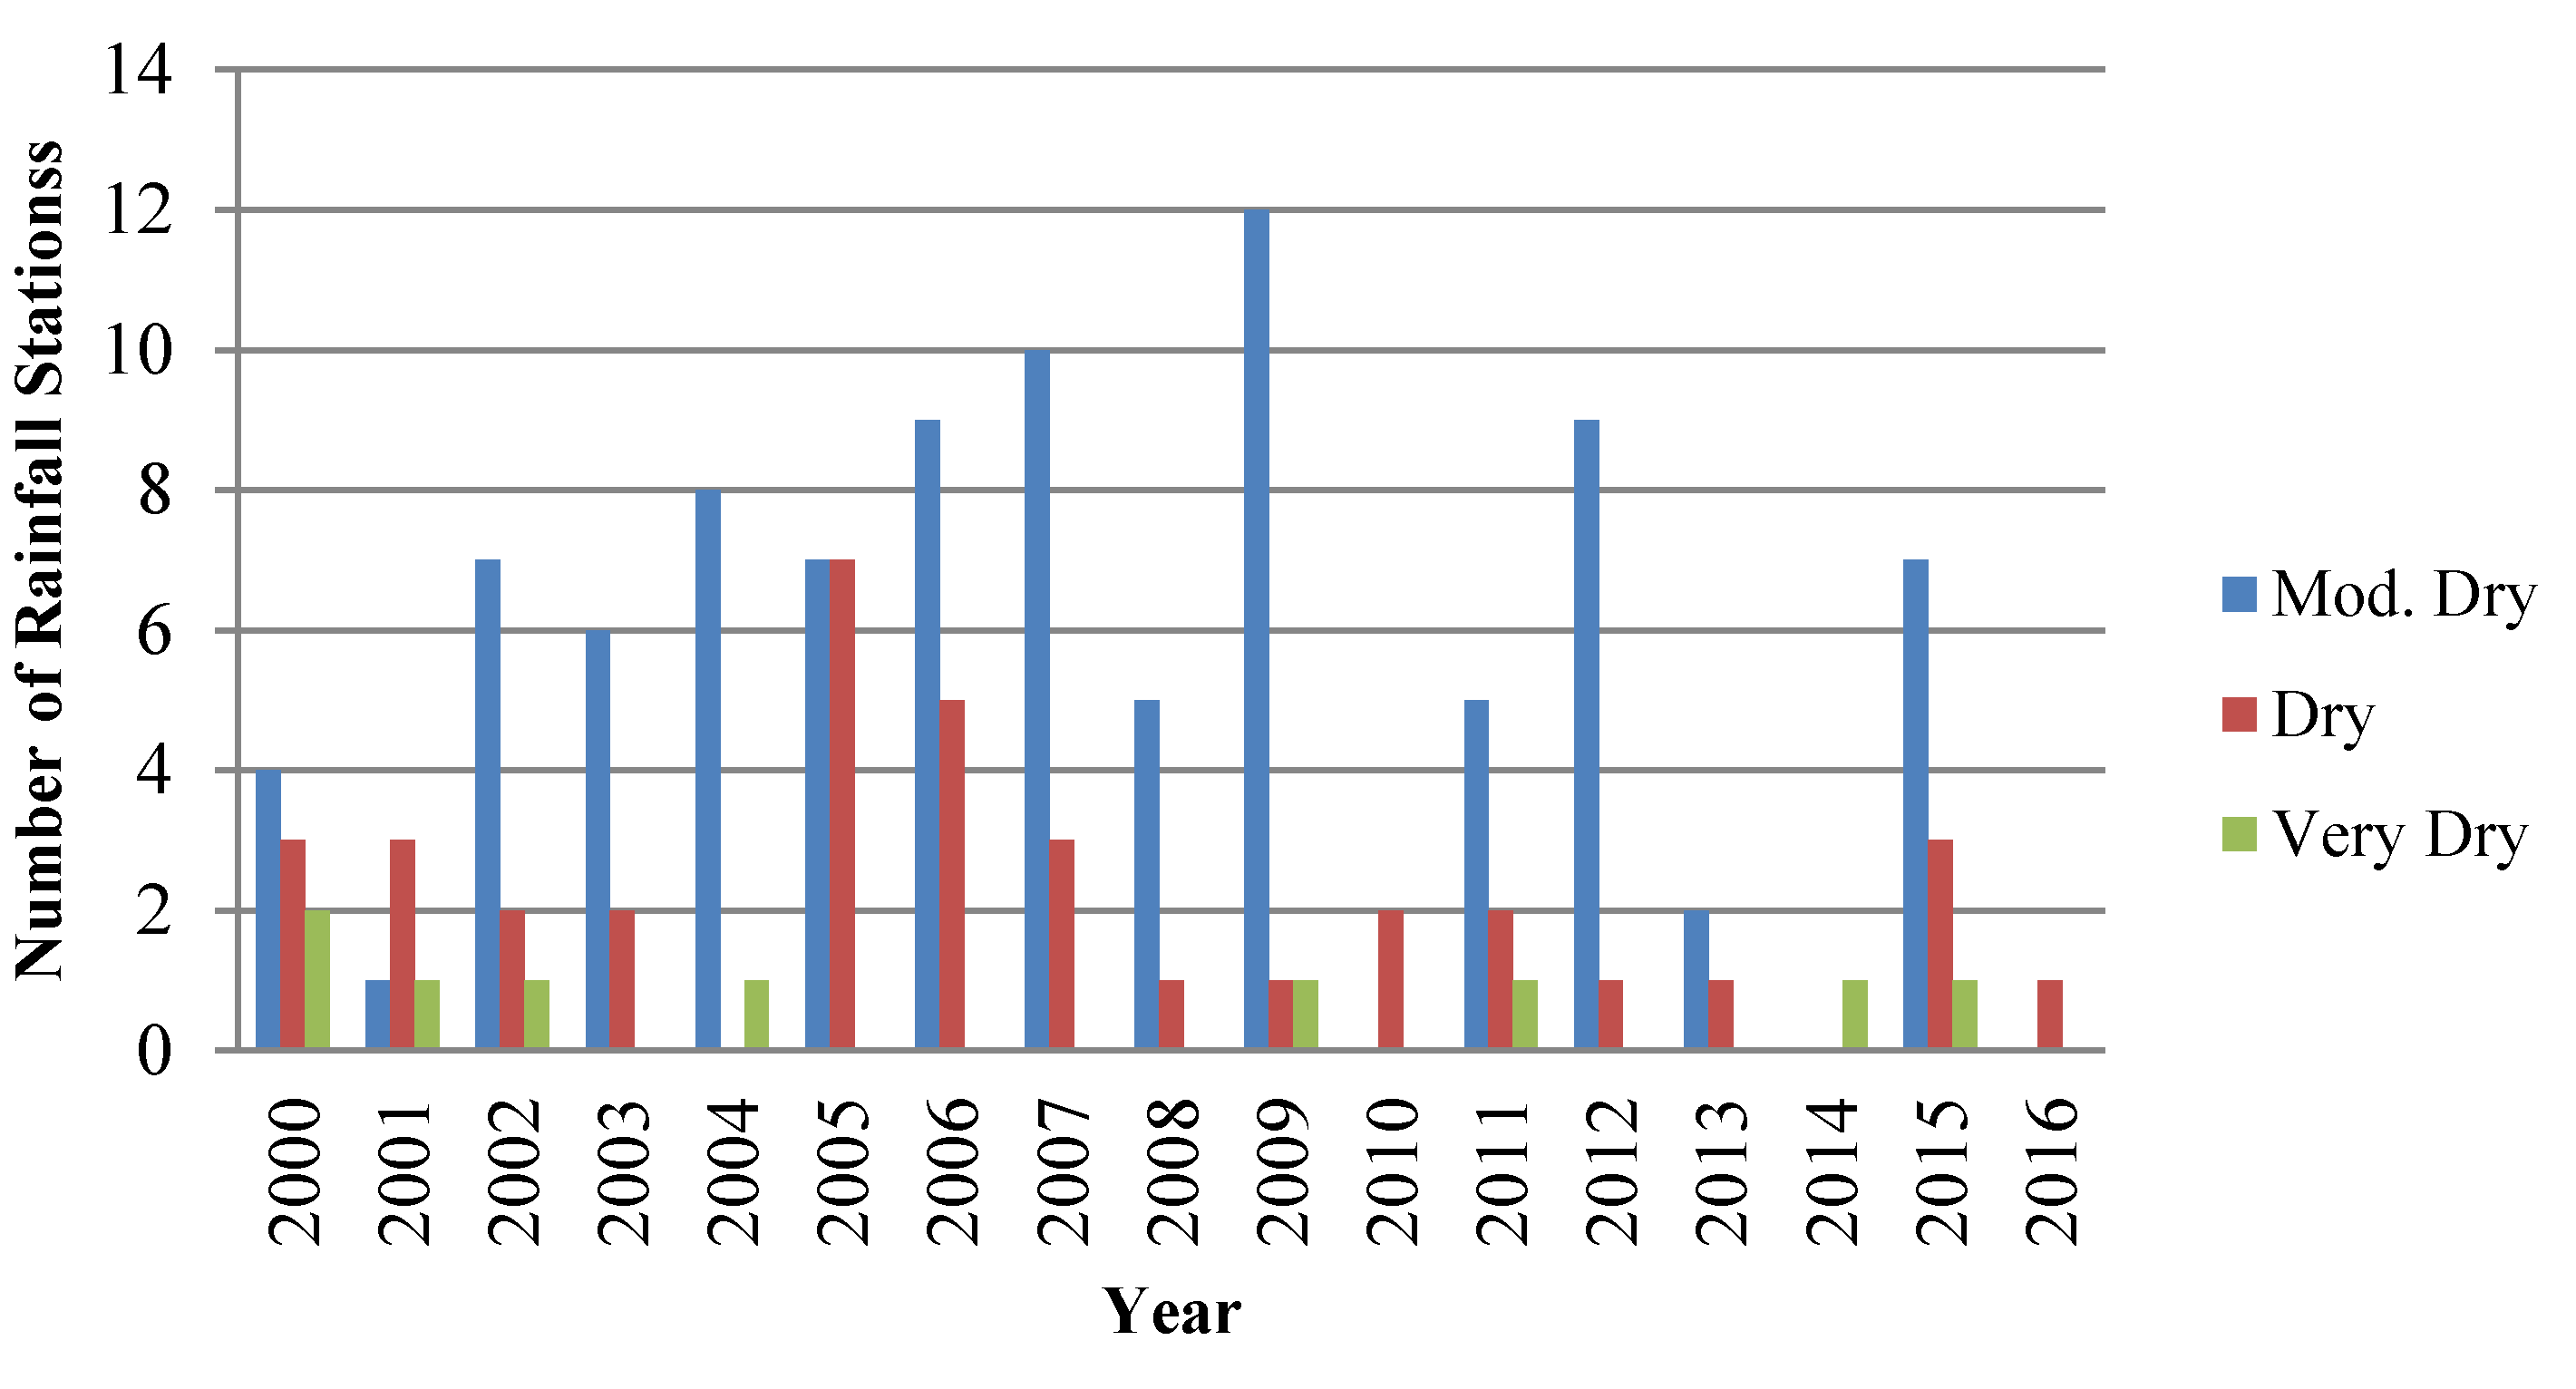
3.1. Yearly SPI
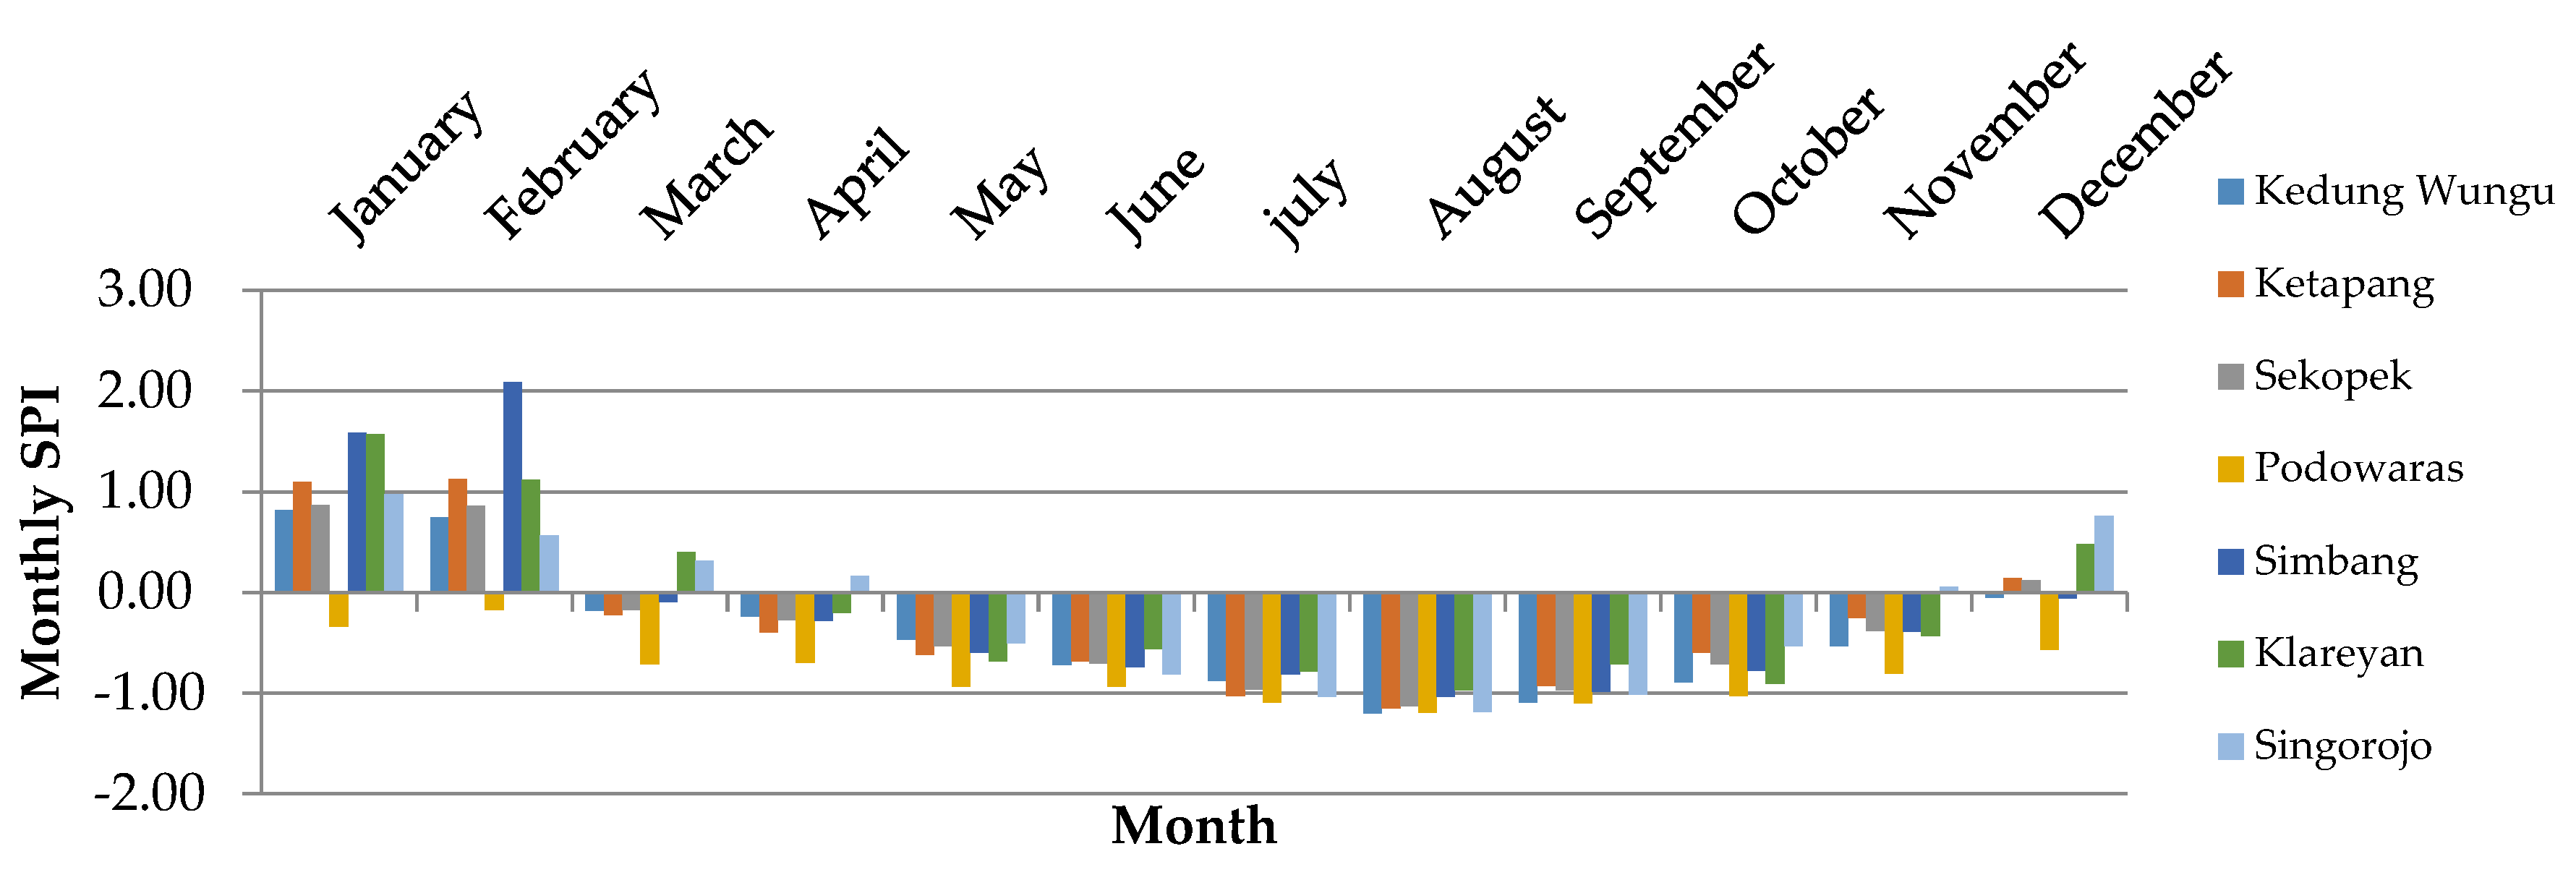
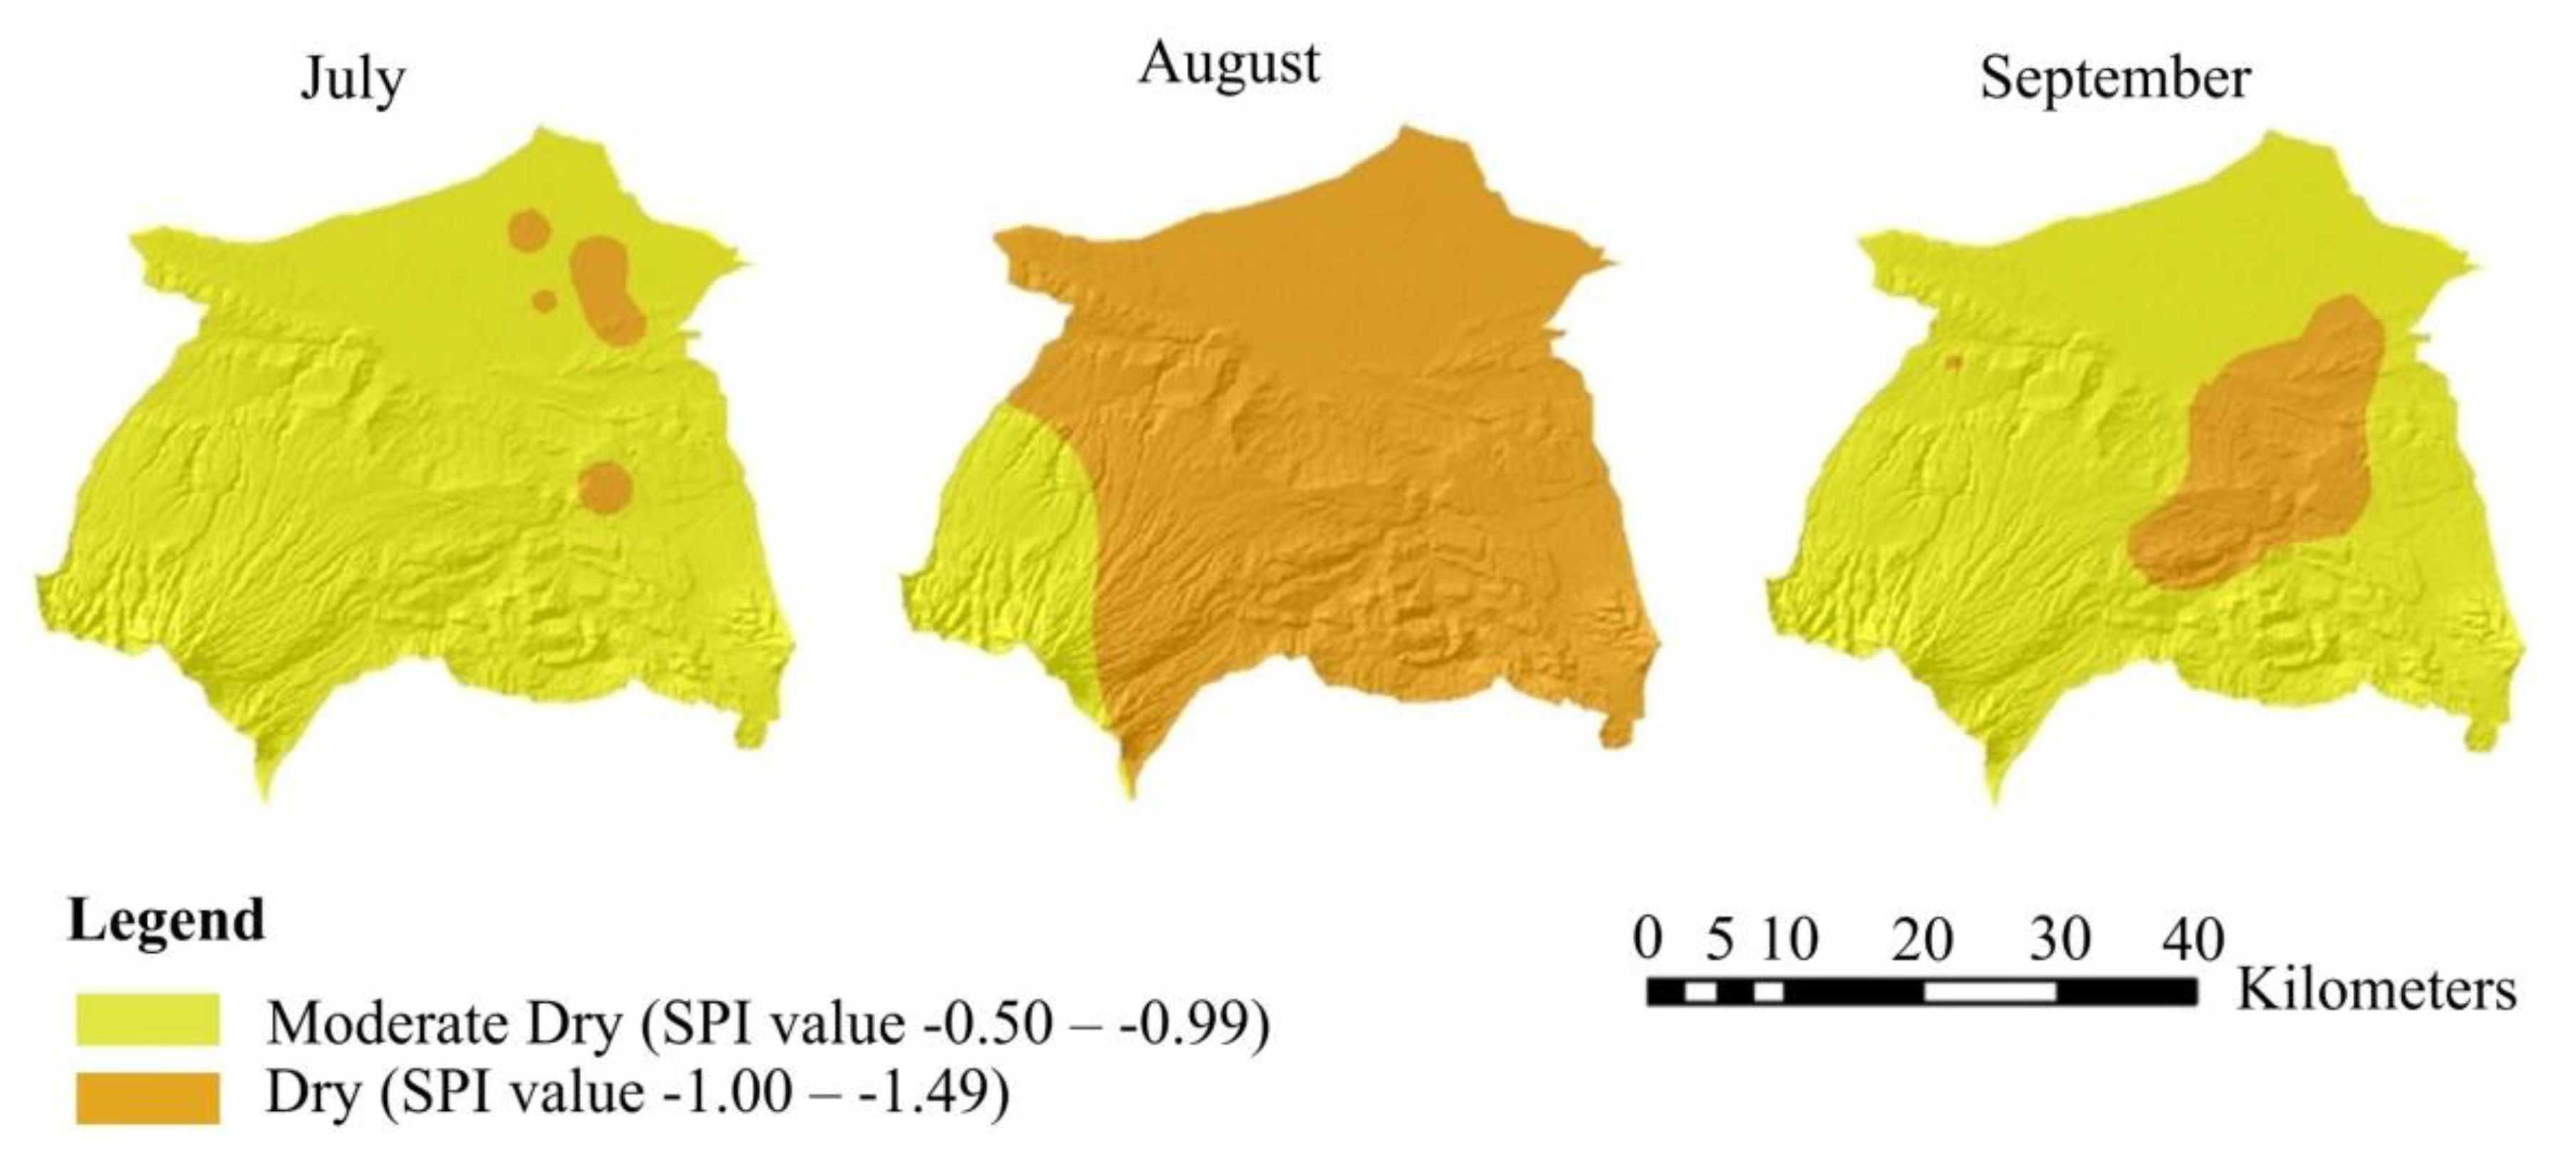
3.2. Monthly SPI
4. Discussion
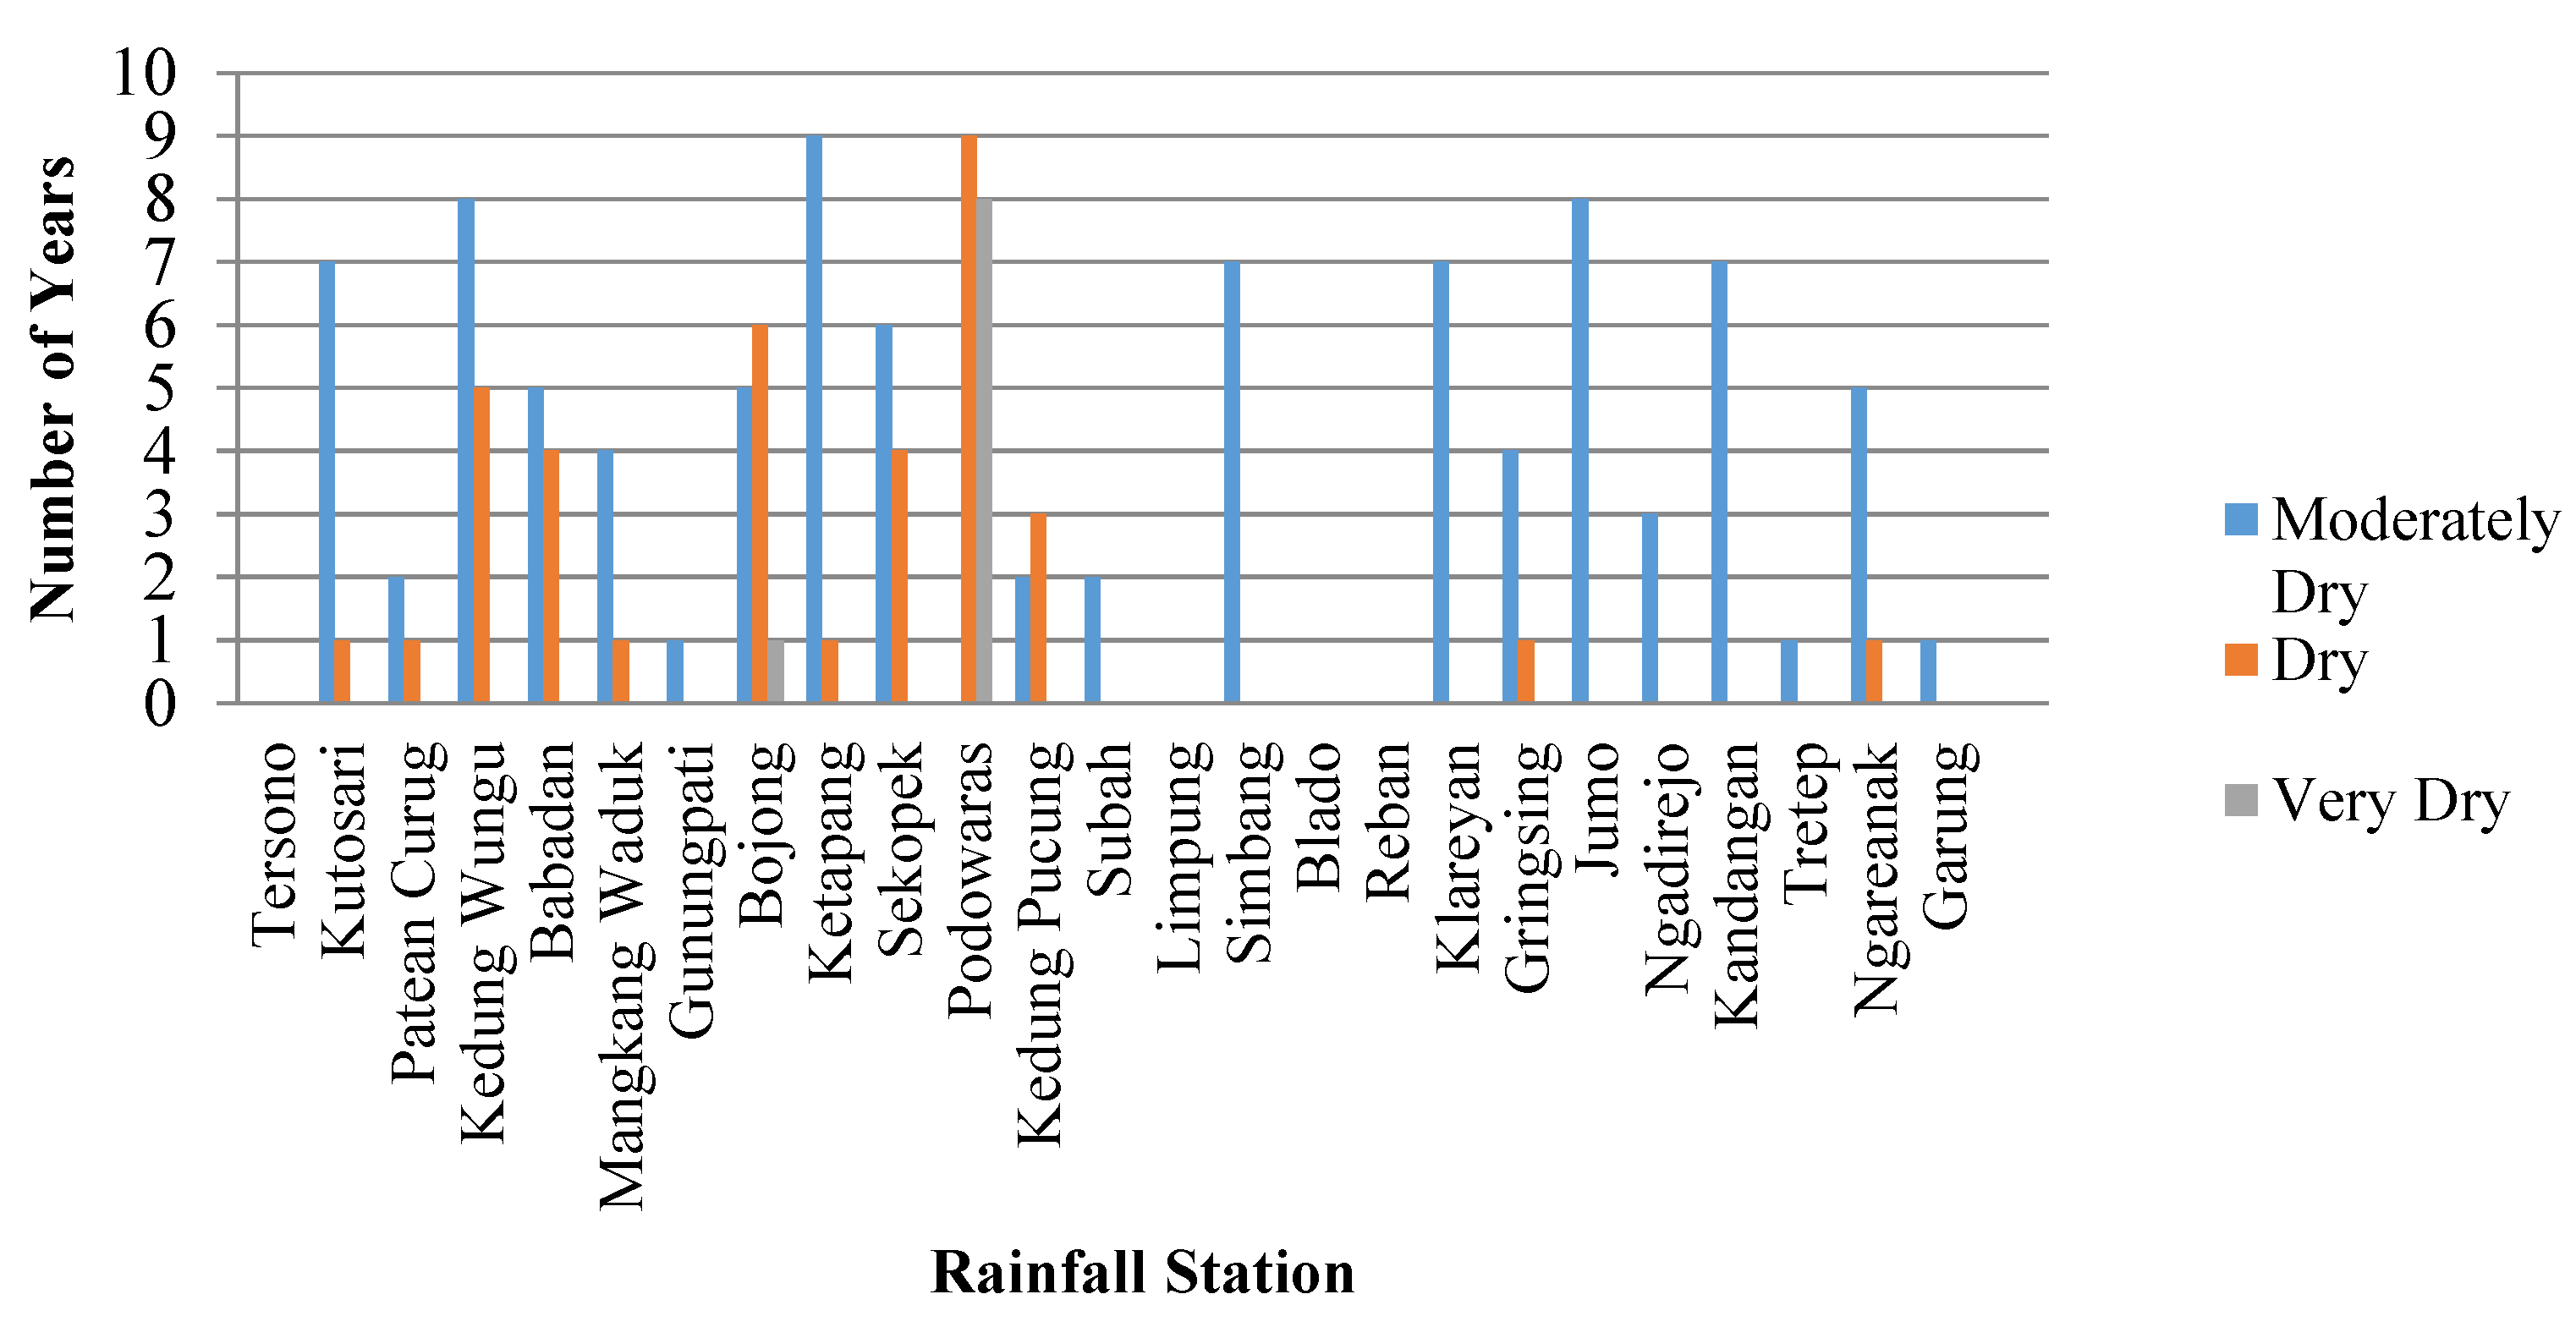
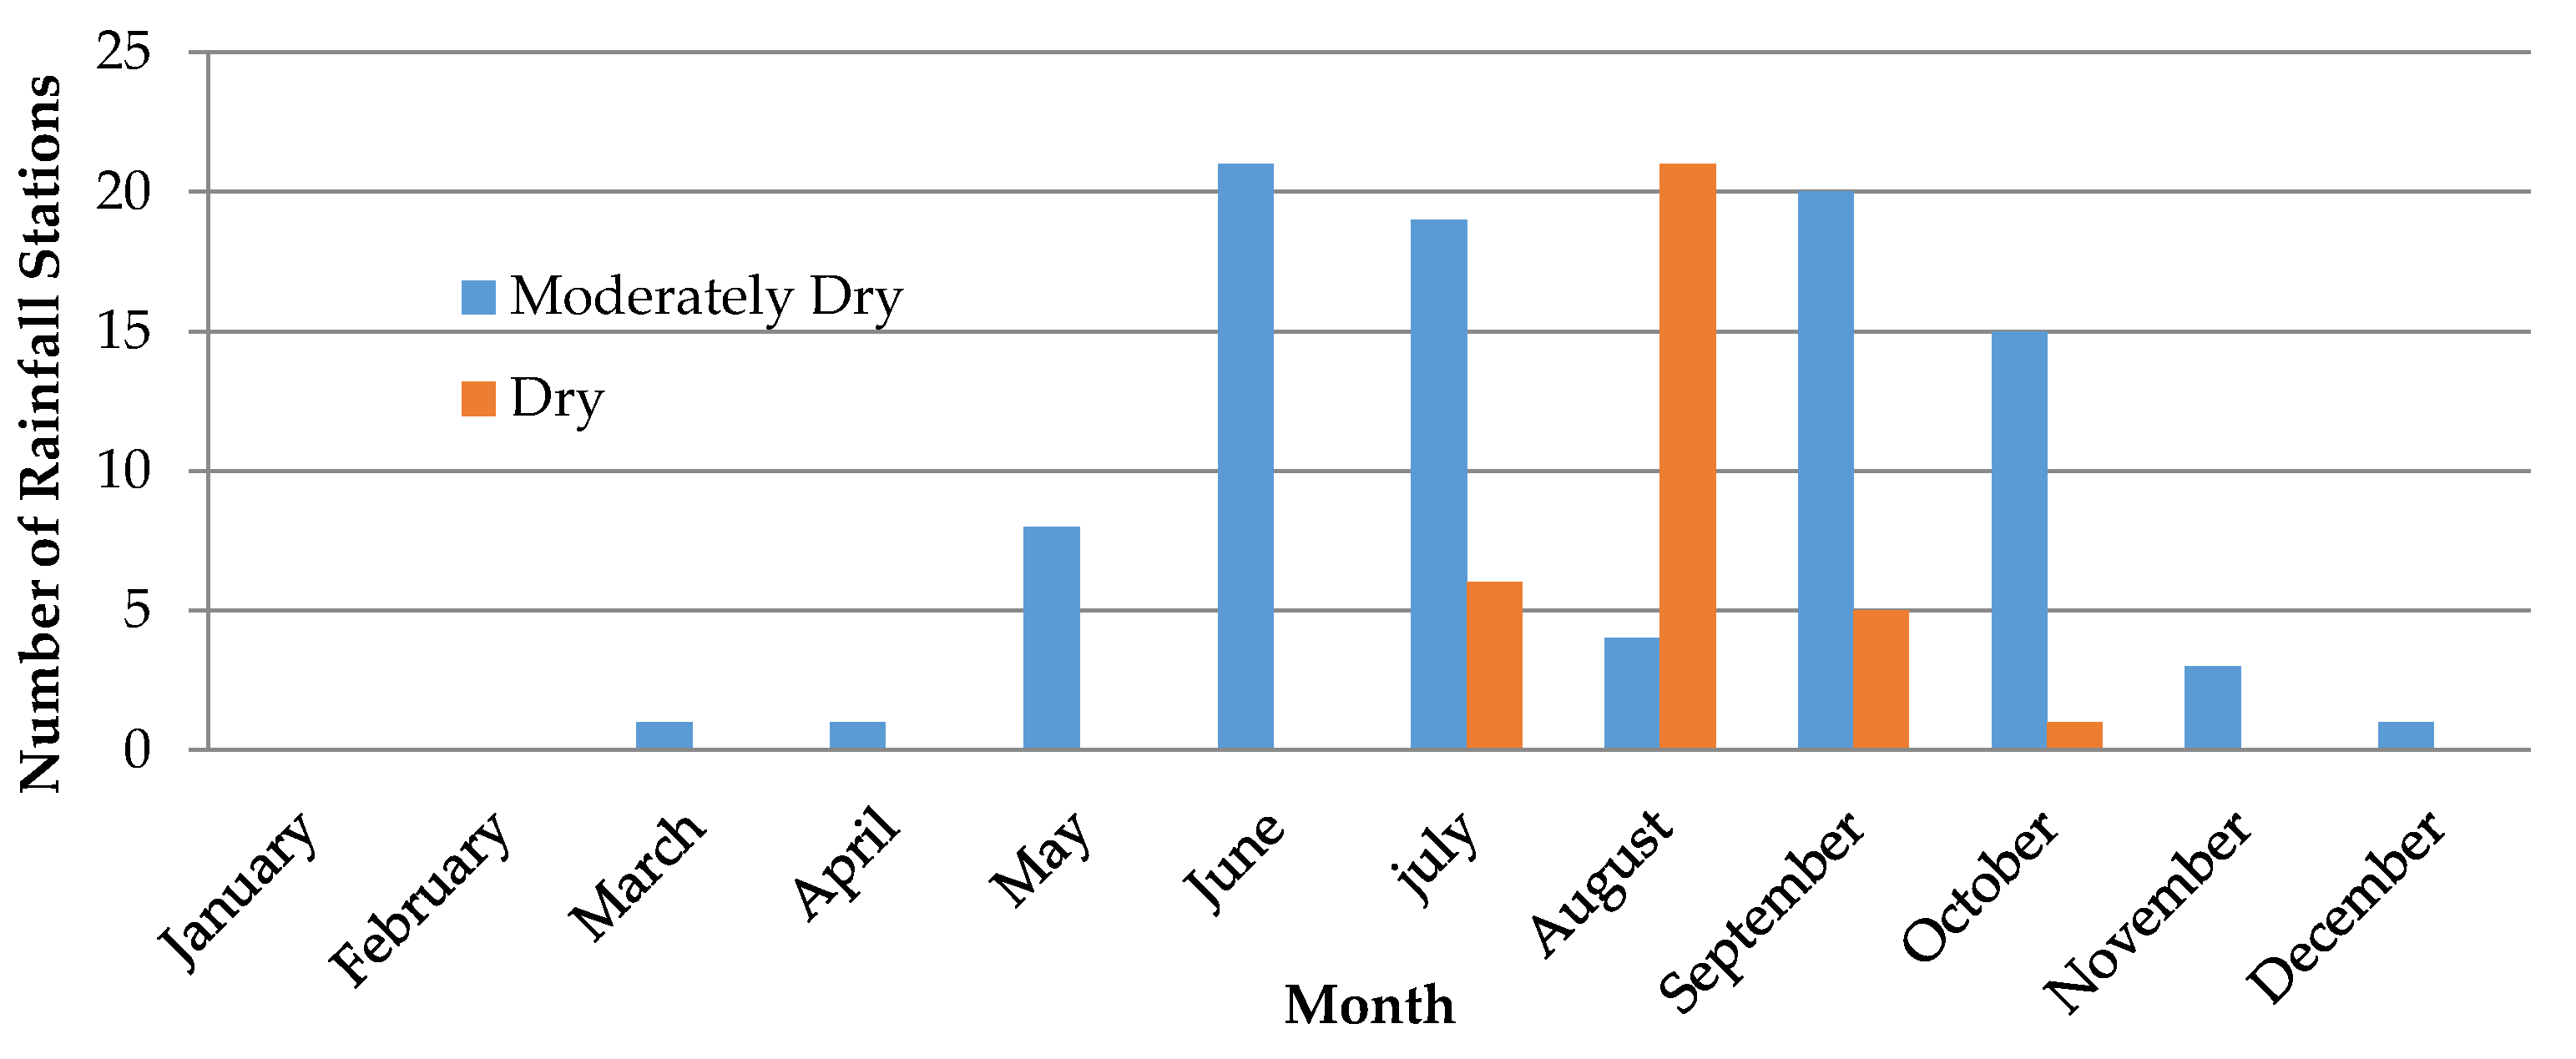
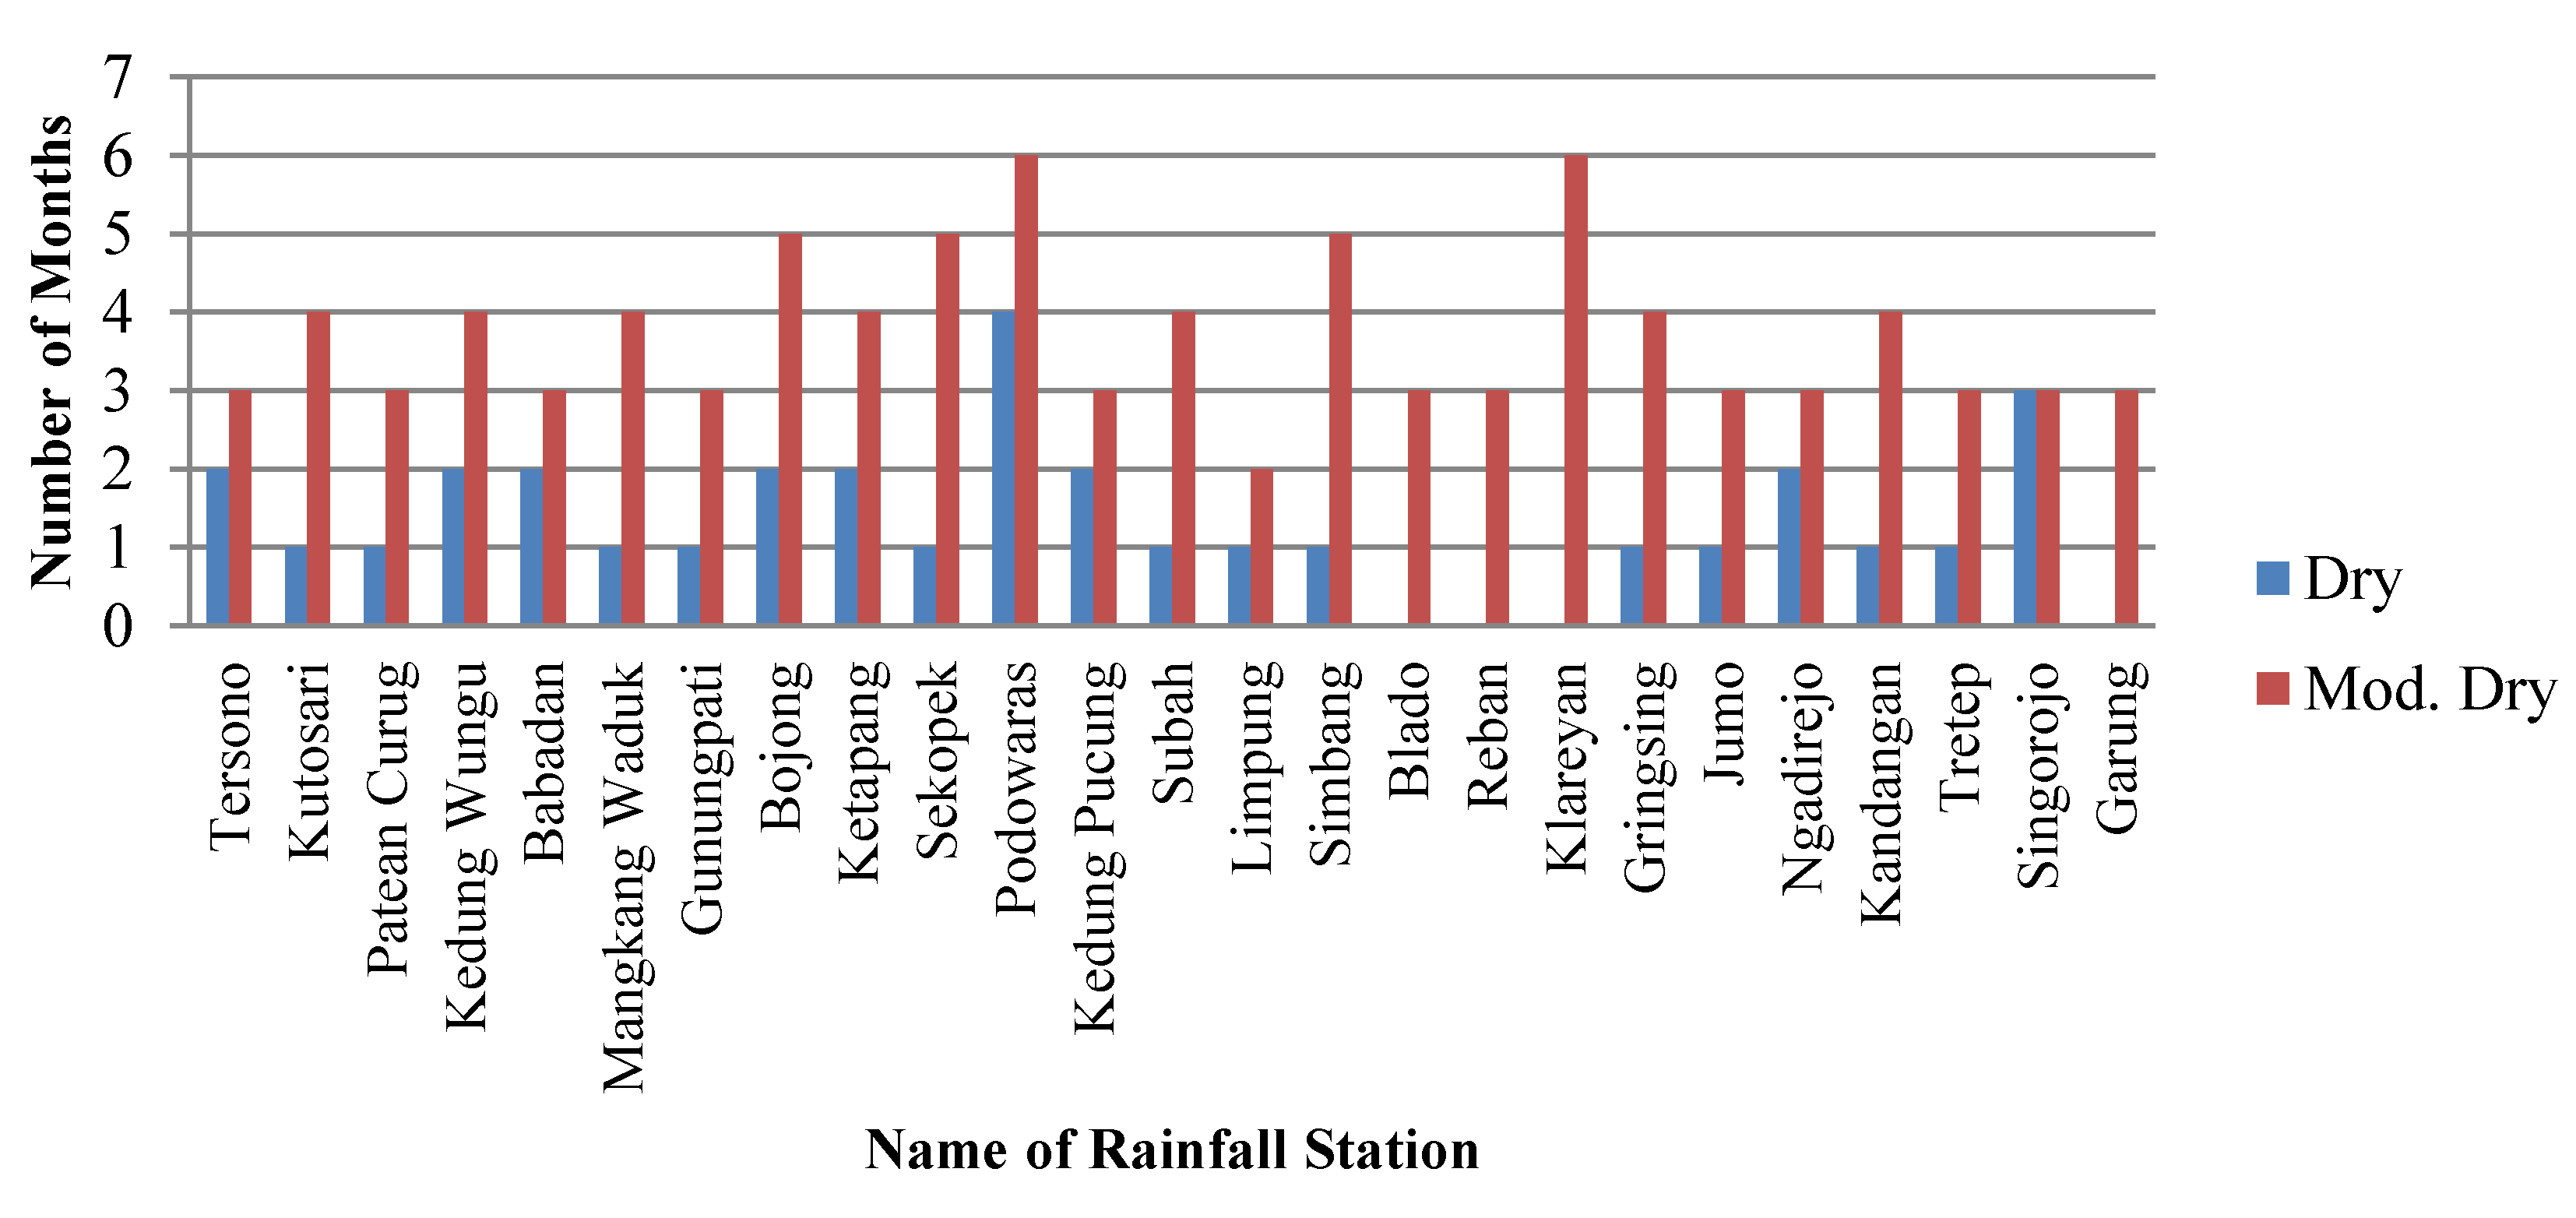
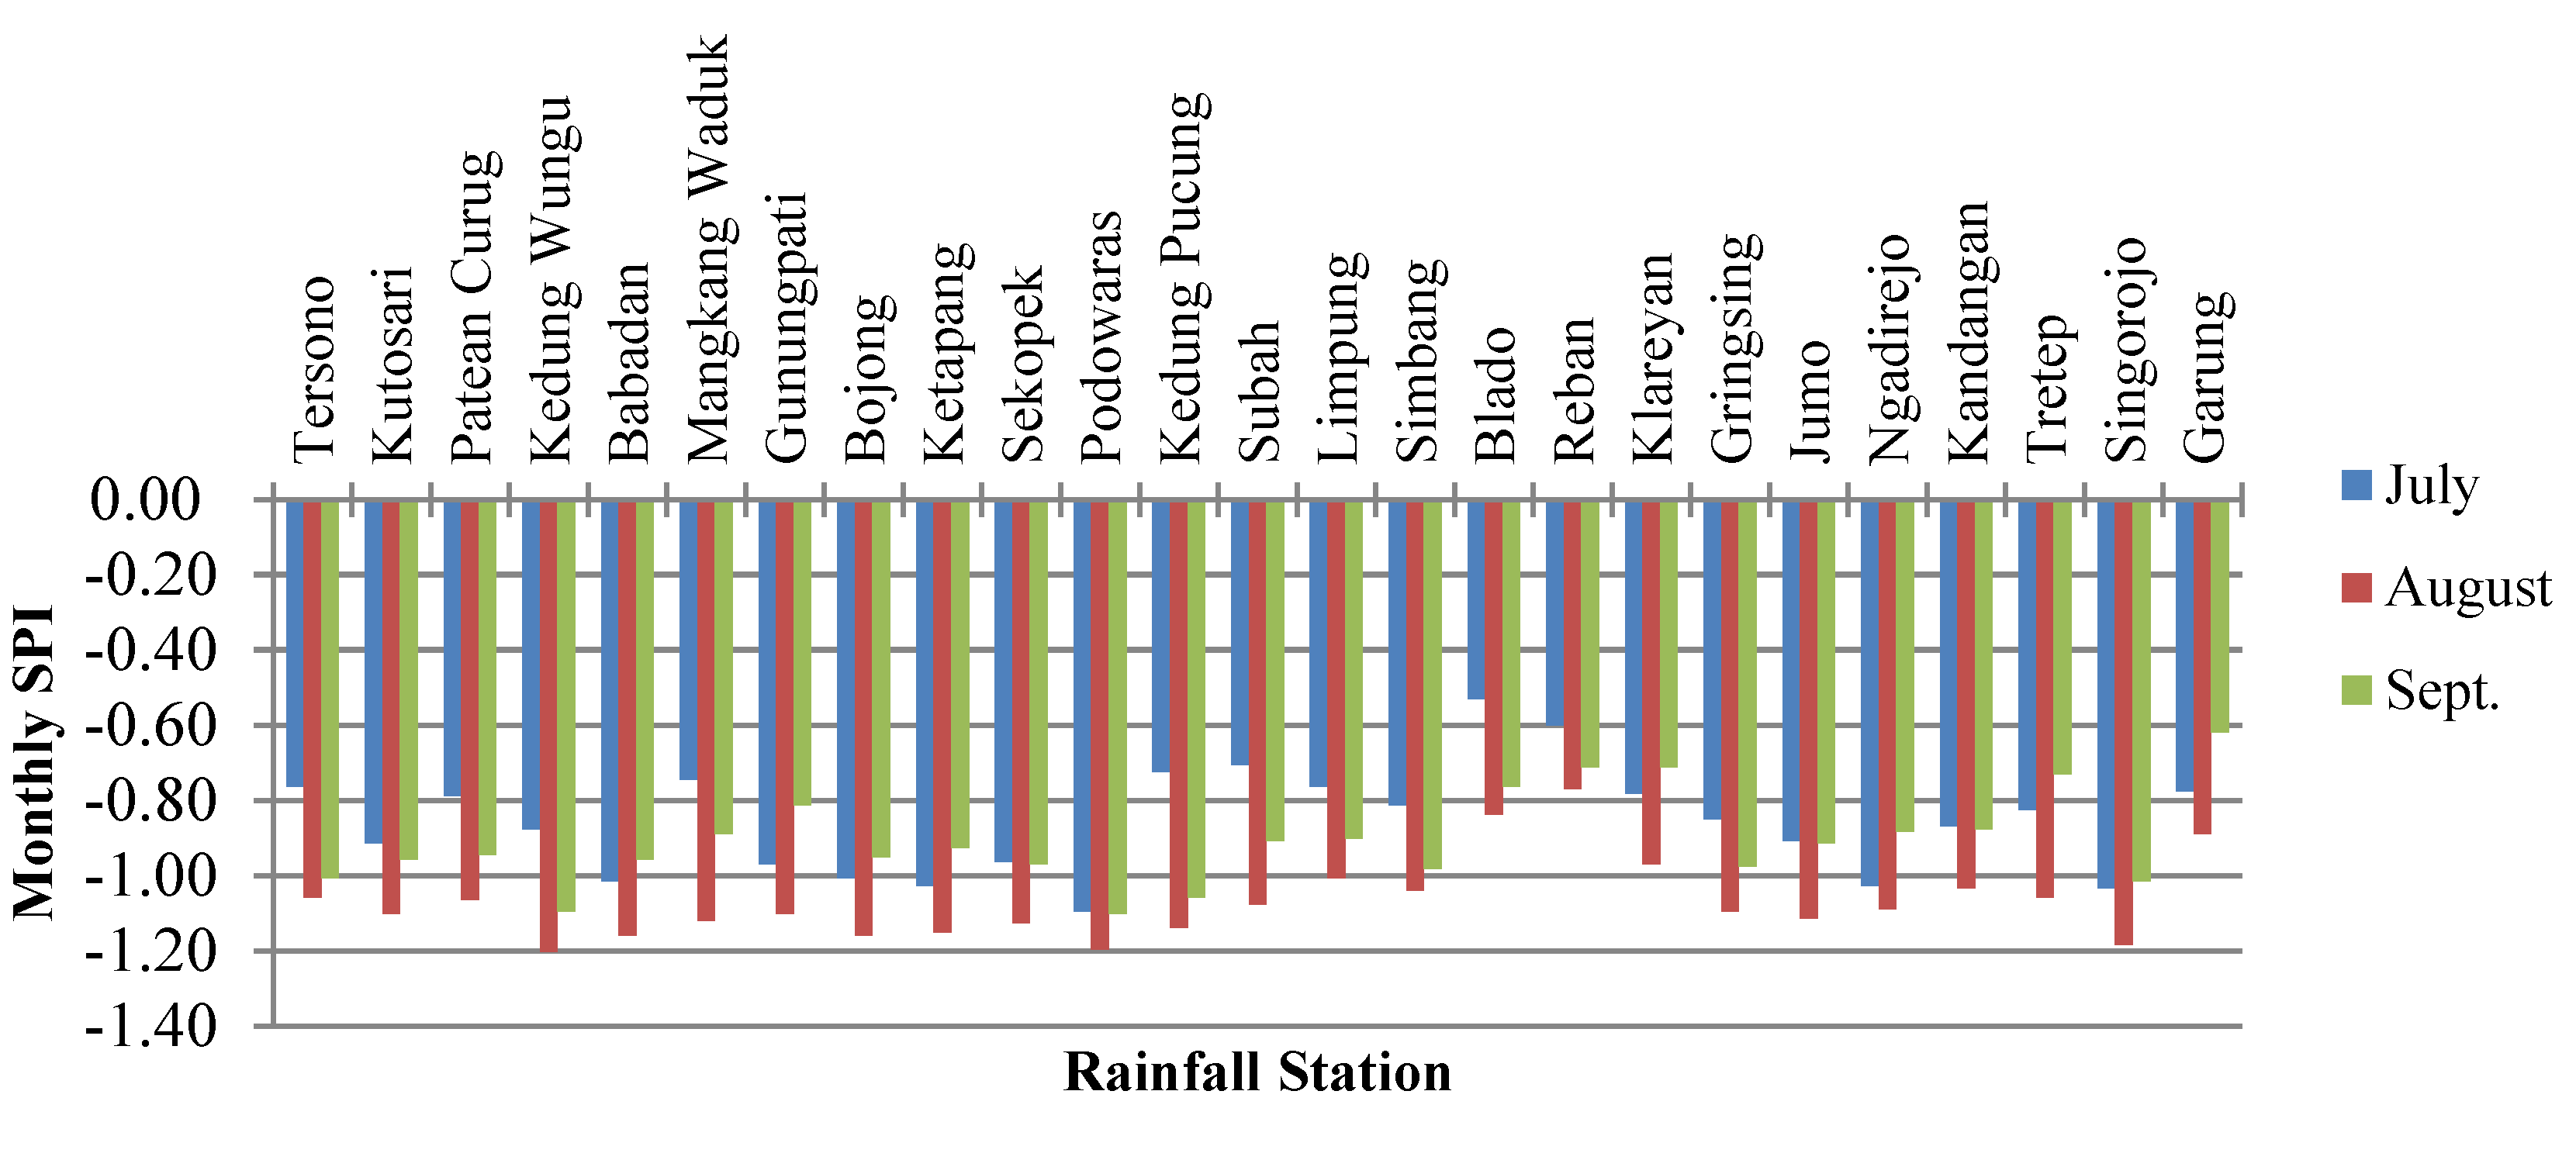
4.1. Spatial Distribution of Drought
4.2. Location Suitability of Constructed Reservoirs
4.3. Location Suitability of Reservoirs Under Construction
5. Conclusions
Author Contributions
Funding
Acknowledgments
Conflicts of Interest
References
- Abbas, M.N.; Biswajeet, P.; Qayssar, M.A. Dam site suitability assessment at the Greater Zab River in northern Iraq using remote sensing data and GIS. J. Hydrol. 2019, 574, 964–979. [Google Scholar] [CrossRef]
- Al-Ruzouq, R.; Abdallah, S.; Abdullah, G.Y.; AlaEldin, I.; Sunanda, M.; Mohamad, A.K.; Mohamed, B.A.G. Dam Site Suitability Mapping and Analysis Using an Integrated GIS and Machine Learning Approach. Water 2019, 11, 1880. [Google Scholar] [CrossRef] [Green Version]
- PWC. The 2nd Edition of PwC’s Annual Indonesian Infrastructure Report. 2016. Available online: www.pwc.com/id (accessed on 10 September 2019).
- Babatunde, S.O.; Adeniyi, O.; Awodele, O.A. Investigation into the causes of delay in land acquisition for PPP projects in developing countries. J. Eng. Des. Technol. 2017, 15, 552–570. [Google Scholar] [CrossRef]
- Harjanti, T.N.S. Suitability Analysis of Reservoir’s Location using GIS Based SPI Index (Case Study: Bodri Kuto River basin). In Proceedings of the 5th International Conference on Sustainable Built Environment (ICSBE), Banjarmasin, Indonesia, 11–13 October 2018; Volume 280. [Google Scholar] [CrossRef]
- Tshiabukole, K.; Khonde, P.; Muku, M.; Vumilia, K.; Lunekua, K.; Kankolongo, M. Influence of Climate Variability on Seasonal Rainfall Patterns in South-Western DR Congo. Open Access Libr. J. 2016, 3, e2952. [Google Scholar] [CrossRef]
- Smakhtin, V.U.; Schipper, E.L.F. Droughts: The impact of semantics and perceptions. Water Policy 2008, 10, 131–143. [Google Scholar] [CrossRef]
- Hao, Z.; Singh, V.P. Drought characterization from a multivariate perspective: A review. J. Hydrol. 2015, 527, 668–678. [Google Scholar] [CrossRef]
- Svoboda, M.D.; Fuchs, B.A.; Poulsen, C.C.; Nothwehr, J.R. The drought risk atlas: Enhancing decision support for drought risk management in the United States. J. Hydrol. 2015, 526, 274–286. [Google Scholar] [CrossRef] [Green Version]
- Temam, D.; Uddameri, V.; Mohammadi, G.; Hernandez, E.A.; Ekwaro-Osire, S. Long-Term Drought Trends in Ethiopia with Implications for Dryland Agriculture. Water 2019, 11, 2571. [Google Scholar] [CrossRef] [Green Version]
- Spinoni, J.; Naumann, G.; Carrao, H.; Barbosa, P.; Vogt, J. World drought frequency, duration, and severity for 1951–2010. Int. J. Climatol. 2013, 34, 2792–2804. [Google Scholar] [CrossRef] [Green Version]
- Hou, Y.Y.; He, Y.B.; Liu, Q.H.; Tian, G.L. Research progress on drought indices. China J. Ecol. 2007, 26, 892–897. [Google Scholar]
- Sayari, N.; Bannayan, M.; Alizadeh, A.; Farid, A. Using drought indices to assess climate change impacts on drought conditions in the northeast of Iran (case study: Kashafrood basin). Meteorol. Appl. 2013, 20, 115–127. [Google Scholar] [CrossRef]
- Saada, N.; Abu-Romman, A. Multi-site Modeling and Simulation of the Standardized Precipitation Index (SPI) in Jordan. J. Hydrol. Reg. Stud. 2017, 14, 83–91. [Google Scholar] [CrossRef]
- Setiawan, A.M.; Lee, W.S.; Rhee, J. Spatio-temporal characteristics of Indonesian drought related to El Niño events and its predictability using the multi-model ensemble. Int. J. Climatol. 2017, 37, 4700–4719. [Google Scholar] [CrossRef]
- Utami, D. Prediksi Kekeringan Berdasarkan Standardized Precipitation Index (SPI) Pada Daerah Aliran Sungai Keduang Di Kabupaten Wonogiri. Matriks Tek. Sipil 2013, 1, 84. [Google Scholar]
- Mamad, T. Mengestimasi Tingkat Kekeringan Menggunakan SPI (Standardized Precipitation Index). Institut Teknologi Bandung. Available online: https://mamadtama.wordpress.com/2014/04/19/mengestimasi-tingkat-kekeringan-menggunakan-spi-standardized-precipitation-index/ (accessed on 19 September 2017).
- Fisher, N.I.; Lewis, T.; Embleton, B.J.J. Statistical Analysis of Spherical Data; Cambridge University Press: Cambridge, UK, 1987; p. 329. [Google Scholar]
- Wilson, E.M. Engineering Hydrology, 3rd ed.; Macmillan Press: London, UK, 1983; p. 27. [Google Scholar]
- Parvin, I.; Saleh, A.F.M. Assessment of Agricultural Drought in 2006 Aman Season and Its Management by the Farmers: A Case Study in Rajshahi District Bangladesh. J. Indian Water Resour. Soc. 2013, 33, 1. [Google Scholar]
- ESRI. Understanding interpolation analysis. 2012. Available online: http://resources.arcgis.com/en/help/main/10.1/index.html#//003100000008000000 (accessed on 11 July 2019).
- Cavus, Y.; Aksoy, H. Spatial Drought Characterization for Seyhan River Basin in the Mediterranean Region of Turkey. Water 2019, 11, 1331. [Google Scholar] [CrossRef] [Green Version]
- Espinosa, L.A.; Portela, M.M.; Pontes Filho, J.D.; Studart, T.M.D.C.; Santos, J.F.; Rodrigues, R. Jointly Modeling Drought Characteristics with Smoothed Regionalized SPI Series for a Small Island. Water 2019, 11, 2489. [Google Scholar] [CrossRef] [Green Version]


| No. | Small Reservoir | Source of Water | Capacity (× 106 m3) | Constr. | Dry Area |
|---|---|---|---|---|---|
| 1 | Kedungasri | Rain-fed | 0.02 | 2016 | - |
| 2 | Bumiayu | Irrig. and Rain-fed | 0.025 | 2013 | - |
| 3 | Triharjo | Irrig. and Rain-fed | 0.02 | 2012 | yes |
| 4 | Sojomerto | Irrig. and Rain-fed | 0.025 | 2016 | yes |
| 5 | Rowobraten | Rain-fed | 0.02 | 2017 | - |
| 6 | Ringinarum | Rain-fed | 0.03 | 2017 | - |
| 7 | Tejorejo | Rain-fed | 0.05 | 2017 | - |
| 8 | Ngerjo | Rain-fed | 0.02 | 2016 | - |
| 9 | Harjodowo | Rain-fed | 0.02 | 2016 | yes |
| 10 | Sidokumpul | Spring | 0.02 | 2013 | yes |
| No. | Small Reservoir | Source of Water | Capacity (× 106 m3) | Constr. | Dry Area |
|---|---|---|---|---|---|
| 1 | Wonoboyo | Spring | 0.1 | - | yes |
| 2 | Trisobo | Irrig. and Rain-fed | 0.04 | - | - |
| 3 | Kedunggading | Rain-fed | 0.04 | - | - |
| 4 | Tamanrejo | Rain-fed | 0.02 | - | yes |
| 5 | Kedungboto | Rain-fed | 0.08 | - | yes |
| 6 | Blumah | Rain-fed | 0.02 | - | yes |
| 7 | Karangtengah | Rain-fed | 0.02 | - | yes |
| 8 | Wonosari | Rain-fed | 0.02 | - | yes |
| 9 | Jatirejo | Rain-fed | 0.02 | - | yes |
| 10 | Wonotenggang | Rain-fed | 0.02 | - | - |
| 11 | Nglarangan | Rain-fed | 0.1 | - | yes |
| 12 | Gemawang | Rain-fed | 0.08 | - | yes |
| 13 | Bejen | Rain-fed | 0.07 | - | yes |
| 14 | Sumowono | Rain-fed | 0.05 | - | - |
| 15 | Sawangan | Rain-fed | 0.1 | - | yes |
| 16 | Ngaliyan | Rain-fed | 0.1 | - | yes |
| 17 | Gringsing | Rain-fed | 0.08 | - | yes |
| 18 | W. Cening | Kali Putih River | 10.00 | - | - |
| 19 | W. Bodri (Banyuwaringin) | Kali Putih River | 42.00 | - | - |
| 20 | W. Kedungsuren | Blorong River | 24.48 | - | yes |
| 21 | Kedunggading 2 | Rain-fed | 0.02 | - | - |
| 22 | Sojomerto 2 | Irrig. and Rain-fed | 0.02 | - | yes |
| 23 | Triharjo 2 | Irrig. and Rain-fed | 0.02 | - | yes |
| Value of SPI | Drought Condition |
|---|---|
| −0.49 to 0.49 | Normal |
| −0.50 to −0.99 | Moderately dry |
| −1.00 to −1.49 | Dry |
| −1.50 to −1.99 | Very dry |
| <−2.00 | Extreme dry |
| No. | Duration * | Drought Severity | Suitability |
|---|---|---|---|
| 1 | 3 months | Very High | Very Suitable |
| 2 | 2 months | High | Suitable |
| 3 | 1 months | Moderate | Moderately Suitable |
| 4 | - | Low | Less Suitable |
| No. | Rainfall Station | Monthly SPI | |||||||||||
|---|---|---|---|---|---|---|---|---|---|---|---|---|---|
| January | February | March | April | May | June | July | August | September | October | November | December | ||
| 1 | Tersono | 1.82 | 2.87 | 0.83 | 0.70 | −0.22 | −0.55 | −0.76 | −1.06 | −1.00 | −0.57 | 0.19 | 1.41 |
| 2 | Kutosari | 1.18 | 1.30 | −0.32 | −0.33 | −0.45 | −0.71 | −0.91 | −1.10 | −0.96 | −0.80 | −0.03 | 0.27 |
| 3 | Patean Curug | 1.08 | 1.05 | 0.81 | 0.40 | −0.12 | −0.58 | −0.79 | −1.06 | −0.94 | −0.40 | 0.43 | 0.72 |
| 4 | Kedung Wungu | 0.81 | 0.75 | −0.18 | −0.24 | −0.46 | −0.72 | −0.88 | −1.20 | −1.10 | −0.90 | −0.54 | −0.05 |
| 5 | Babadan | 0.76 | 1.06 | −0.14 | −0.44 | −0.42 | −0.77 | −1.01 | −1.16 | −0.96 | −0.75 | −0.36 | 0.11 |
| 6 | Mangkang Waduk | 1.34 | 1.30 | 0.23 | 0.14 | −0.21 | −0.55 | −0.75 | −1.12 | −0.89 | −0.60 | −0.01 | 0.32 |
| 7 | Gunungpati | 1.66 | 1.04 | 1.00 | 0.55 | −0.20 | −0.69 | −0.97 | −1.10 | −0.81 | −0.43 | 0.74 | 0.88 |
| 8 | Bojong | 0.70 | 0.50 | −0.29 | −0.30 | −0.59 | −0.80 | −1.01 | −1.16 | −0.95 | −0.83 | −0.51 | 0.11 |
| 9 | Ketapang | 1.10 | 1.13 | −0.22 | −0.40 | −0.62 | −0.68 | −1.03 | −1.15 | −0.93 | −0.60 | −0.25 | 0.14 |
| 10 | Sekopek | 0.87 | 0.86 | −0.17 | −0.27 | −0.53 | −0.71 | −0.96 | −1.13 | −0.97 | −0.71 | −0.39 | 0.12 |
| 11 | Podowaras | −0.34 | −0.17 | −0.71 | −0.70 | −0.93 | −0.93 | −1.10 | −1.20 | −1.10 | −1.03 | −0.81 | −0.56 |
| 12 | Kedung Pucung | 1.15 | 0.87 | 0.35 | 0.38 | −0.25 | −0.57 | −0.73 | −1.14 | −1.06 | −0.73 | 0.04 | 0.33 |
| 13 | Subah | 2.03 | 2.48 | 0.18 | −0.12 | −0.49 | −0.64 | −0.70 | −1.08 | −0.91 | −0.62 | −0.08 | 0.28 |
| 14 | Limpung | 2.09 | 2.25 | 0.73 | 0.57 | −0.19 | −0.41 | −0.76 | −1.01 | −0.90 | −0.43 | 0.29 | 0.87 |
| 15 | Simbang | 1.59 | 2.09 | −0.09 | −0.28 | −0.60 | −0.74 | −0.81 | −1.04 | −0.98 | −0.77 | −0.39 | −0.06 |
| 16 | Blado | 3.52 | 3.37 | 2.23 | 1.55 | 0.88 | 0.07 | −0.53 | −0.84 | −0.76 | 0.25 | 1.26 | 2.05 |
| 17 | Reban | 3.73 | 4.20 | 2.39 | 2.08 | 1.02 | −0.07 | −0.60 | −0.58 | −0.53 | 0.01 | 1.14 | 2.59 |
| 18 | Klareyan | 1.57 | 1.12 | 0.40 | −0.20 | −0.68 | −0.56 | −0.78 | −0.97 | −0.71 | −0.91 | −0.43 | 0.48 |
| 19 | Gringsing | 1.33 | 1.87 | −0.14 | −0.27 | −0.43 | −0.65 | −0.85 | −1.09 | −0.97 | −0.72 | −0.09 | 0.37 |
| 20 | Jumo | 0.41 | 0.53 | 0.76 | 0.28 | −0.37 | −0.91 | −0.90 | −1.11 | −0.91 | −0.44 | 0.14 | 0.39 |
| 21 | Ngadirejo | 0.80 | 0.66 | 0.72 | 0.39 | −0.38 | −0.82 | −1.03 | −1.09 | −0.88 | −0.62 | 0.11 | 0.78 |
| 22 | Kandangan | 0.74 | 0.16 | 0.42 | 0.15 | −0.53 | −0.97 | −0.87 | −1.03 | −0.87 | −0.31 | 0.37 | 0.64 |
| 23 | Tretep | 1.47 | 1.20 | 1.09 | 0.99 | 0.04 | −0.60 | −0.83 | −1.06 | −0.73 | −0.24 | 0.70 | 1.52 |
| 24 | Singorojo | 0.98 | 0.57 | 0.32 | 0.17 | −0.50 | −0.81 | −1.03 | −1.18 | −1.01 | −0.53 | 0.06 | 0.77 |
| 25 | Garung | 1.75 | 1.47 | 1.90 | 1.35 | 0.36 | −0.50 | −0.77 | −0.89 | −0.62 | 0.39 | 1.45 | 1.92 |
| Max | 3.73 | 4.20 | 2.39 | 2.08 | 1.02 | 0.07 | −0.53 | −0.58 | −0.53 | 0.39 | 1.45 | 2.59 | |
| Min | −0.34 | −0.17 | −0.71 | −0.70 | −0.93 | −0.97 | −1.10 | −1.20 | −1.10 | −1.03 | −0.81 | −0.56 | |
| Average | 1.37 | 1.38 | 0.48 | 0.25 | −0.27 | −0.63 | −0.85 | −1.06 | −0.90 | −0.53 | 0.12 | 0.66 | |
| No. | Name | Drought Severity | Suitability |
|---|---|---|---|
| 1 | Kedungasri | Moderate | Moderate |
| 2 | Bumiayu | Moderate | Moderate |
| 3 | Triharjo | Moderate | Moderate |
| 4 | Sojomerto | Moderate | Moderate |
| 5 | Rowobranten | Moderate | Moderate |
| 6 | Ringinarum | Moderate | Moderate |
| 7 | Tejorejo | Moderate | Moderate |
| 8 | Ngerjo | Moderate | Moderate |
| 9 | Harjodowo | Moderate | Moderate |
| 10 | Sidokumpul | High | Suitable |
| Total: | |||
| Very Suitable | 0 (0%) | ||
| Suitable | 1 (10%) | ||
| Moderately Suitable | 9 (90%) | ||
| Less Suitable | 0 (0%) |
| No. | Name | Drought Severity | Suitability |
|---|---|---|---|
| 1 | Wonoboyo | Moderate | Moderate |
| 2 | Trisobo | Moderate | Moderate |
| 3 | Kedunggading | Moderate | Moderate |
| 4 | Tamanrejo | Moderate | Moderate |
| 5 | Kedungboto | Moderate | Moderate |
| 6 | Blumah | Low | Less |
| 7 | Karangtengah | Very High | Very |
| 8 | Wonosari | High | Suitable |
| 9 | Jatirejo | High | Suitable |
| 10 | Wonotenggang | Moderate | Moderate |
| 11 | Nglarangan | Moderate | Moderate |
| 12 | Gemawang | Moderate | Moderate |
| 13 | Bejen | High | Suitable |
| 14 | Sumowono | Moderate | Moderate |
| 15 | Sawangan | Moderate | Moderate |
| 16 | Ngaliyan | Moderate | Moderate |
| 17 | Gringsing | Moderate | Moderate |
| 18 | W. Cening | Moderate | Moderate |
| 19 | W. Banyuwaringin | High | Suitable |
| 20 | W. Kedungsuren | High | Suitable |
| 21 | Kdg Gading2 | Moderate | Moderate |
| 22 | Sojomerto2 | Moderate | Moderate |
| 23 | Triharjo2 | High | Suitable |
| Total: | |||
| Very Suitable | 1 (4%) | ||
| Suitable | 6 (26%) | ||
| Moderately Suitable | 15 (65%) | ||
| Less Suitable | 1 (4%) |
| No. | Suitability | Constructed | Under Construction | Total | |
|---|---|---|---|---|---|
| 1 | Very Suitable | 0 (0%) | 1 (4%) | 1 | 3% |
| 2 | Suitable | 1 (10%) | 6 (26%) | 7 | 21% |
| 3 | Moderately Suitable | 9 (90%) | 15 (65%) | 24 | 73% |
| 4 | Less Suitable | 0 (0%) | 1 (4%) | 1 | 3% |
| Total | 10 (100%) | 23 (100%) | 33 | 100% | |
© 2020 by the authors. Licensee MDPI, Basel, Switzerland. This article is an open access article distributed under the terms and conditions of the Creative Commons Attribution (CC BY) license (http://creativecommons.org/licenses/by/4.0/).
Share and Cite
Suharyanto, S.; Harjanti, T.N.S.; Sriyana, I.; Suryadi, F. Location Suitability for Small Reservoirs at the Bodri-Kuto River Basin Based on Spatial Monthly SPI. Water 2020, 12, 993. https://doi.org/10.3390/w12040993
Suharyanto S, Harjanti TNS, Sriyana I, Suryadi F. Location Suitability for Small Reservoirs at the Bodri-Kuto River Basin Based on Spatial Monthly SPI. Water. 2020; 12(4):993. https://doi.org/10.3390/w12040993
Chicago/Turabian StyleSuharyanto, Suharyanto, Theresia Novie Secunda Harjanti, Ignatius Sriyana, and Fransiskus Suryadi. 2020. "Location Suitability for Small Reservoirs at the Bodri-Kuto River Basin Based on Spatial Monthly SPI" Water 12, no. 4: 993. https://doi.org/10.3390/w12040993
APA StyleSuharyanto, S., Harjanti, T. N. S., Sriyana, I., & Suryadi, F. (2020). Location Suitability for Small Reservoirs at the Bodri-Kuto River Basin Based on Spatial Monthly SPI. Water, 12(4), 993. https://doi.org/10.3390/w12040993