Article

Tendency of Runoff and Sediment Variety and Multiple Time Scale Wavelet Analysis in Hongze Lake during 1975–2015

1
State Key Laboratory of Hydraulic Engineering Simulation and Safety, Tianjin University, Tianjin 300350, China
2
Tianjin Port & Shipping Authority, Tianjin 300456, China
*
Author to whom correspondence should be addressed.
Water 2020, 12(4), 999; https://doi.org/10.3390/w12040999
Submission received: 26 February 2020 / Revised: 16 March 2020 / Accepted: 27 March 2020 / Published: 1 April 2020
(This article belongs to the Section Hydrology)

Abstract

:
Hongze Lake plays a key role in flood and waterlogging prevention, analyzing the variation process and characteristics of multi-time scales will have a great practical significance to water resources management and regulation in the Huaihe River basin of China. This research proposed a combinatorial mutation test method to study the interannual variation trends and change points of runoff and sediment flowing into and out of Hongze Lake during the period 1975–2015. It is concluded that the annual variation trend of the inflow and outflow runoff time series is consistent, with no obvious decreasing trend and change point, while the inflow and outflow sediment time series showed a decreasing trend, and the change point was 1991. Then, the runoff and sediment time series were analyzed by the wavelet method. The results showed that the time series has multi-time scale characteristics. The annual inflow runoff and sediment would enter into the dry period in a short time after 2015, and both would be in the valley floor stage. Among the influencing factors, the variation of rainfall in the basin was the main factor affecting the runoff variation. Changes in heavy rainfalls pattern, the construction of hydraulic engineering projects, and land use/cover change (LUCC) are the main reasons for the significant decrease and mutation variation of inflow sediment.

1. Introduction

Runoff plays a vital role in the hydrologic cycle. It is of great significance to explore the changing trend of water flow in the field of water resources [1]. Hydrologic events such as variations in runoff and sediment are partly results of variations in the hydrologic cycle [2], these variations can be divided into two categories: trend and shift [3]. Hydrological regime-changing has important significance in planning and designing of hydraulic structures along the lake, understanding these variations plays an important role in lake engineering management [4].
Flood and drought have always been the two most important factors restricting social stability and economic development in the Huaihe River basin. At present, most studies on the hydrological cycle variations of the Huaihe River basin focused on the mainstream and branches water system, Zhou et al. [5] studied the dynamic characteristics of flood time series in the Huaihe River basin based on chaos theory. Lin et al. [6] simulated the heavy precipitation and flood disaster in the Huaihe River basin by using the framework of atmospheric-hydrological simulation. Zhu et al. [7] analyzed the impacts of climate variability and anthropogenic activities on runoff in the Huaihe River basin based on the 1964–2010 long series of hydrological time series data. Ye et al. [8] and Yu et al. [9] explained the spatial characteristics and variation trends of precipitation in the Huaihe River basin.
Hongze Lake as one of the four largest freshwater in China, located in the junction of middle and lower Huaihe River basin, its storage, and drainage capacity is crucial to flood control in the middle and lower Huaihe River. Affected by climate variability and anthropogenic activities, the runoff and sediment flowing into and out of Hongze Lake affected the flood regulation and storage capacity. Many scholars have focused on the variation of rainfall and flood disasters in the Hongze Lake area. Jiang et al. [10], based on the historical water level and discharge data of Hongze lake, analyzed the long and short time series of flood peak discharge into the lake, and elaborated on the characteristics of flood disaster. Yin et al. [11] analyzed the relationship between the maximum water level variation and climate variability and anthropogenic activities from 1736 to 2005 in Hongze Lake. Duan et al. [12] studied the influence of anthropogenic activities (artificial sand mining) on the hydrological regime of Hongze Lake. There is short of research on the variation trend and causes of runoff and sediment in the long time series of Hongze Lake.
In the context of global warming, the frequency and intensity of extreme precipitation events are increasing [13], and this directly leads to the constant variation of the hydrological time series frequency domain characteristics. However, the frequency domain feature is difficult to identify by traditional hydrological analysis methods. The variation of runoff and sediment characteristics directly affects lake regulation, flood control, and navigation. Therefore, it has prominent theoretical and practical significance to study the variations trends and causes of runoff and sediment in Hongze Lake. Also this is beneficial to flood and waterlogging disaster prevention and water resources management.
Because time series analysis has fewer assumptions and uncertainties, the historical data time series analysis is more helpful to understand the variation behavior of runoff compared with the simulation model [14]. There are many kinds of discriminant methods for trend variation, among which the statistical test can analyze the trend variation significance level and has a rigorous statistical basis. The Mann–Kendall (M–K) [15,16] trend test can deal with non-normal distribution and explain the existence of missing values and non-stationarity in data, these advantages make it a widely used tool for analyzing hydrological variables variation trends [17,18]. However, the M–K test has poor processing ability for nonlinear data, so other analytical methods are needed. Decomposing the original time series will beneficial to observe the variation trend of hydrological data in different periods, so the wavelet analysis method was chosen for its ability to process nonlinear data and decompose the original time series [19]. Many scholars have studied the characteristics of runoff and sediment in different rivers and lakes by using wavelet analysis [20,21,22], however there is a lack of research on the multi-time-scale variation characteristics of runoff and sediment time series in Hongze Lake by the wavelet analysis method.
There are many methods to study the change point of hydrological time series, including the Mann–Whitney test [23], the Kruskal–Wallis test [24], the Pettitt test [25], and the Student’s t-test [26]. Among these tests, Pettitt test is widely used in hydroclimatology because of its high accuracy [27]. In the previous studies [28,29,30], the purpose of this method is to identify the change points of the variable and analyze the mutation causes. However, due to the difference of presuppositions and applicable conditions, the results are often different, so the analytical method of hydrological time series change point needs to be improved.
Also, the research on the influence of climate variability and anthropogenic activities on water circulation and water resources is a hot topic in climatology and hydrology. In recent years, extreme weather events such as a rainstorm, flood, strong storm surge, drought, high temperature and heat wave have become more and more intense [31,32]. Climate variability, mainly characterized by global warming, affects the regional land water circulation by changing the atmospheric temperature and precipitation, and drives the changes of hydrological factors such as runoff and sediment [33,34]. Anthropogenic activities mainly include the construction of hydraulic engineering, water and soil conservation measures, unreasonable farming, etc., of which the construction of hydraulic engineering is a typical representative, sediment is trapped in the reservoir, resulting in reduced sediment transport downstream of the river [35]. As an artificial “disturbance system”, LUCC is not only an important part of regional environmental evolution, but also one of the main causes of physical process changes on the surface [36,37]. Ervinia et al. [38] found that the land use change enhanced the impact of climate change on runoff change. Dao et al. [39] found that climate change from 1978 to 2000 had a stronger impact on the hydrological process of the Vietnam river basin than the land use change. Apollonio et al. [40] showed the impact of land use on the hydrological response is closely related to the watershed scale. Bussi et al. [41] simulated the effects of future climate and land use changes on the transport of suspended sediment in the Thames River.
The purpose of this research is to improve the accuracy of the trend detection technology of time series, then clarify the variation trend, change points and periodicity of the runoff and sediment time series of the Hongze Lake, and further analyze the influencing factors from climate variability and anthropogenic activities. In this paper, the hydrologic stations of the surrounding water system of Hongze Lake are selected to explore the variation trend and change points of runoff and sediment flowing into and out of the Hongze Lake basin from 1975 to 2015. A combinatorial mutation test method based on the M–K test and Pettitt test is proposed to identify the catastrophe points. Based on statistical analysis, wavelet analysis is used to analyze the spatiotemporal variation characteristics of the hydrological time series, then predict its variation trend in a short time in the future. By analyzing the causes of the change point, revealing the impacts of climate variability and anthropogenic activities on runoff and sediment variations in Hongze Lake. It is of great significance for the management and economic development to understand the characteristics, variation trends, and influencing factors of runoff and sediment in Hongze Lake scientifically.

2. Materials and Methods

2.1. Research Areas and Data

This paper mainly takes Hongze Lake as the research area, which is located at the junction of the middle and lower Huaihe River basin of China. The hydrological data are the annual runoff and sediment time series of ten hydrological stations flowing into and out of Hongze Lake from 1975 to 2015. The surrounding water system of Hongze Lake [42] is shown in Figure 1.

2.2. Combinatorial Mutation Test Method

2.2.1. M–K Test

In addition to trend analysis, the M–K test theory can also be used for the change point test, which is effective for verifying the variation from a relatively stable state to another state. For the time series X containing n samples, we construct an order column in the equation [15,16]:
S k = i = 1 k r i   ( k = 1 ,   2 ,   ,   n ) ,
where
r i = { 1 ,         x i > x j 0 ,         x i x j   ( j = 1 ,   2 ,   ,   i ) ,
Under the assumption of random independence of time series, statistics are defined as the equation:
U F k = [ S k E ( S k ) ] Var ( S k )   ( k = 1 ,   2 ,   ,   n ) ,
where, Sk is the cumulative value of the number of values at time i is greater than that at time j, UF1 = 0; E(Sk), Var(Sk) are the mean and variance of cumulative Sk respectively, when x1, x2, …, xn are independent of each other, E(Sk) and Var(Sk) have the same distribution, then:
E ( S k ) = n ( n + 1 ) 4 ,   Var ( S k ) = n ( n 1 ) ( 2 n + 5 ) 72 ,
UFk is the standard normal distribution, which is a statistical time series calculated by time series X. At a given level of significance α, according to the normal distribution table, when UFk > Uα, there are obvious trend variations in the time series.
Inverting the time series X and repeating the process, setting UBk = −UFk (k = n, n − 1, …,1), UB1 = 0. To calculate the UFk and UBk, if UFk is greater than 0, the time series shows an upward trend; if the UFk less than 0, it shows a downward trend. At the significance level α=0.05, the mutation probability increases when UFk exceeds the critical value ±1.96. Within the confidence interval, if there is an intersection point between curve UFk and UBk, it is a possible catastrophe point. However, the M–K test does not applicable to the time series with multiple or multi-scale mutations time series, that is, when there are multiple intersection points in the confidence interval, there may be pseudo catastrophe points, and the clutter points need to be removed [43].

2.2.2. Pettitt Test

The basic principle of the Pettitt test is to assume that the sample is divided into two-time sub-series arbitrarily and the mean is the same. That means the random variables time series is divided into two parts arbitrarily, x1, x2, …, xto and xto+1, xto+2, …, xT. If the distributions of the random variables in the two parts are F1(x) and F2(x), and F1(x)F2(x), the catastrophe point is supposed to happen at to. The statistics are defined as the equation [25]:
U t , T = i = 1 t j = t + 1 T s g n ( x j x i ) ,     s g n ( x j x i ) = { 1         x j x i > 0 0       x j x i = 0 1     x j x i < 0 ,
When the time series follow a continuous distribution, statistic Ut,T is obtained by the equation:
U t , T = U t 1 , T + V t , T ,
For t = 2, 3, …, T,
V t , T = j = 1 T s g n ( x j x t ) ,     U 1 , T = V 1 , T ,
The point satisfying Equation (8) is considered to be the most likely position for the mutation.
K t = | U t , T | = Max | U t , T | ,
The corresponding significance probability can be obtained by the equation:
P = 2 e 6 k t 2 T 2 + T 3 ,
The Pettitt test can only identify one change point in a long time series, but there may be more than one change point in a hydrological time series. In the research, all the change points obtained using the method proposed by Li et al. [44]. The first-order change point was identified by the Pettitt test. Then, the hydrological long time series is divided into two parts based on the first-order change point, and the new change points are tested until all the change points are found.

2.2.3. Combinatorial Test

To obtain a more accurate change point, the research proposed a combinatorial mutation test method based on the M–K test and Pettitt test. The test process is as follows: (Ⅰ) The possible change points and regions in hydrological time series are identified by the M–K test. (Ⅱ) Using the Pettitt test to obtain all the change points in the hydrological time series. (Ⅲ) According to the possible change points and regions obtained by the M–K test, verify whether the change points obtained by the Pettitt test are significant. If the Pettitt test points are not in the regions obtained by the M–K test, the points are non-significant change points. (Ⅳ) Finally, the significance change points are used to remove the false change points in the M–K test and find the real change points.
This method uses the Pettitt test to offset the defect that the M–K test cannot identify the true and false change points, compared with the single Pettitt test, the combinatorial test can identify the change points and regions accurately, ensuring that the change points are significant, so that all significant points can be identified more scientifically and accurately.

2.3. Wavelet Analysis Method

2.3.1. Wavelet Function

The basic idea of wavelet analysis is to use a cluster of wavelet functions to represent or approximate a certain signal or function. The wavelet function is the key to wavelet analysis. Wavelet function is φ(t)∈L2(R) and it satisfies Equation (10).
+ φ ( t ) d t = 0 ,
where φ(t) is the base wavelet function, which can form a cluster function system by scaling and shifting on the time axis:
φ a , b ( t ) = | a | 1 2 φ ( t b a )   where ,   a ,   b R ,   a   0 ,
where φa,b(t) is the daughter wavelet; a is the scale factor, which can reflect the period length of the wavelet; b is the translation factor, which can reflect the shift in time.
At present, many wavelet functions can be used [44], for example, Mexican hat wavelet, Haar wavelet, Morlet wavelet, and Meyer wavelet. Among, the Morlet wavelet is widely used to identify periodic oscillations of the real life signals, which can detect the time-dependent amplitude and phase for different frequencies [45,46], it is a very accurate method for obtaining the periodicity [47]. Given the hydrological characteristics of the runoff and sediment time series, a continuous wavelet transform should be used to detect the existence of oscillations and their period, so the research selected Morlet wavelet function to analyze the multi-time scale variations of the runoff and sediment time series in Hongze Lake.

2.3.2. Wavelet Transform

Let L2(R) represents the measurable square-integrable function space defined on the real axis, if the function f(t)∈L2(R) satisfies Equation (12).
+ | f ( t ) 2 | d t < ,
Then, for a given energy-limited signal f(t)∈L2(R), the continuous wavelet transform is defined as the equation:
W f ( a , b ) = | a | 1 2 + f ( t ) φ ¯ ( t b a ) d t ,
where Wf(a,b) is the wavelet transform coefficient; φ ¯ ( t b a ) is the complex conjugate of φ ( t b a ) .

2.3.3. Wavelet Variance

For discrete-time series, the wavelet variance can be calculated according to the equation:
Var ( a ) = 1 n j = 1 n W 2 ( a , x j ) ,
where W(a,xj) is the wavelet transform coefficient with scale factor a and translation factor xj. For complex wavelet function W2(a,xj), it is the square of the wavelet transform coefficient module; n is the total number of wavelet transform coefficients obtained under scale a .
According to Equation (14), the wavelet variance Var(a) is equal to the mean value of the square of the corresponding wavelet transform coefficient W2(a,xj) of each sample at the scale a . The wavelet variance graph is the process of wavelet variance changing with time scale a , which can reflect the energy distribution of signal fluctuation in different time scales a. Therefore, the wavelet variance diagram can be used to determine the main period of the studied signal.

3. Results and Discussion

3.1. Spatial and Temporal Distribution of Runoff and Sediment

3.1.1. Runoff and Sediment Trend Analysis

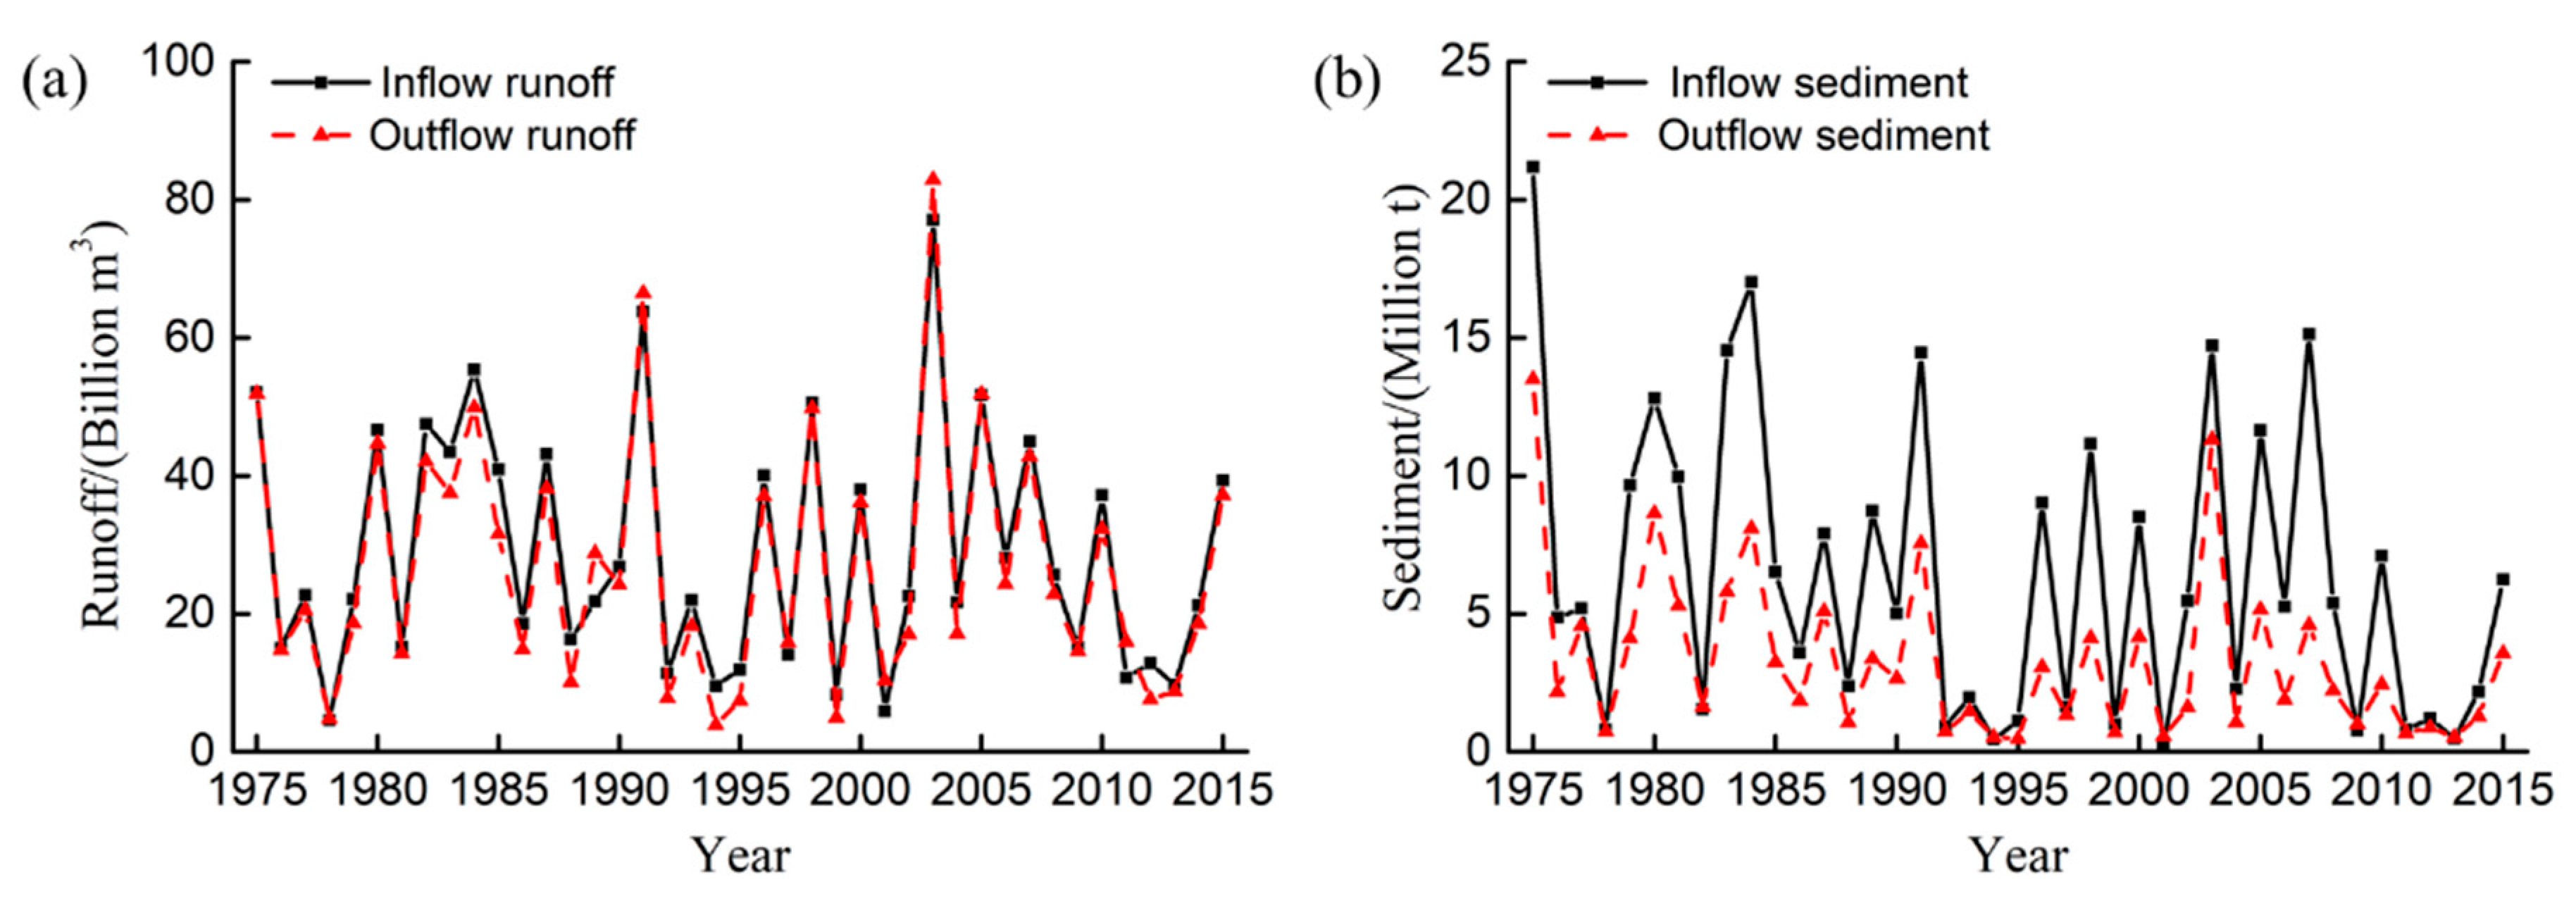
From the analysis of hydrological time series, the average annual runoff and sediment flowing into and out of Hongze Lake fluctuated in waves from 1975 to 2015, as shown in Figure 2. There is little difference between the annual inflow and outflow runoff, while the annual inflow sediment is greater than the outflow except for some special years, the lake keeps in deposition state. The variation of runoff and sediment is closely related, which means that the sediment increases with the runoff, and when the runoff decreases, the sediment will decrease at the same time.
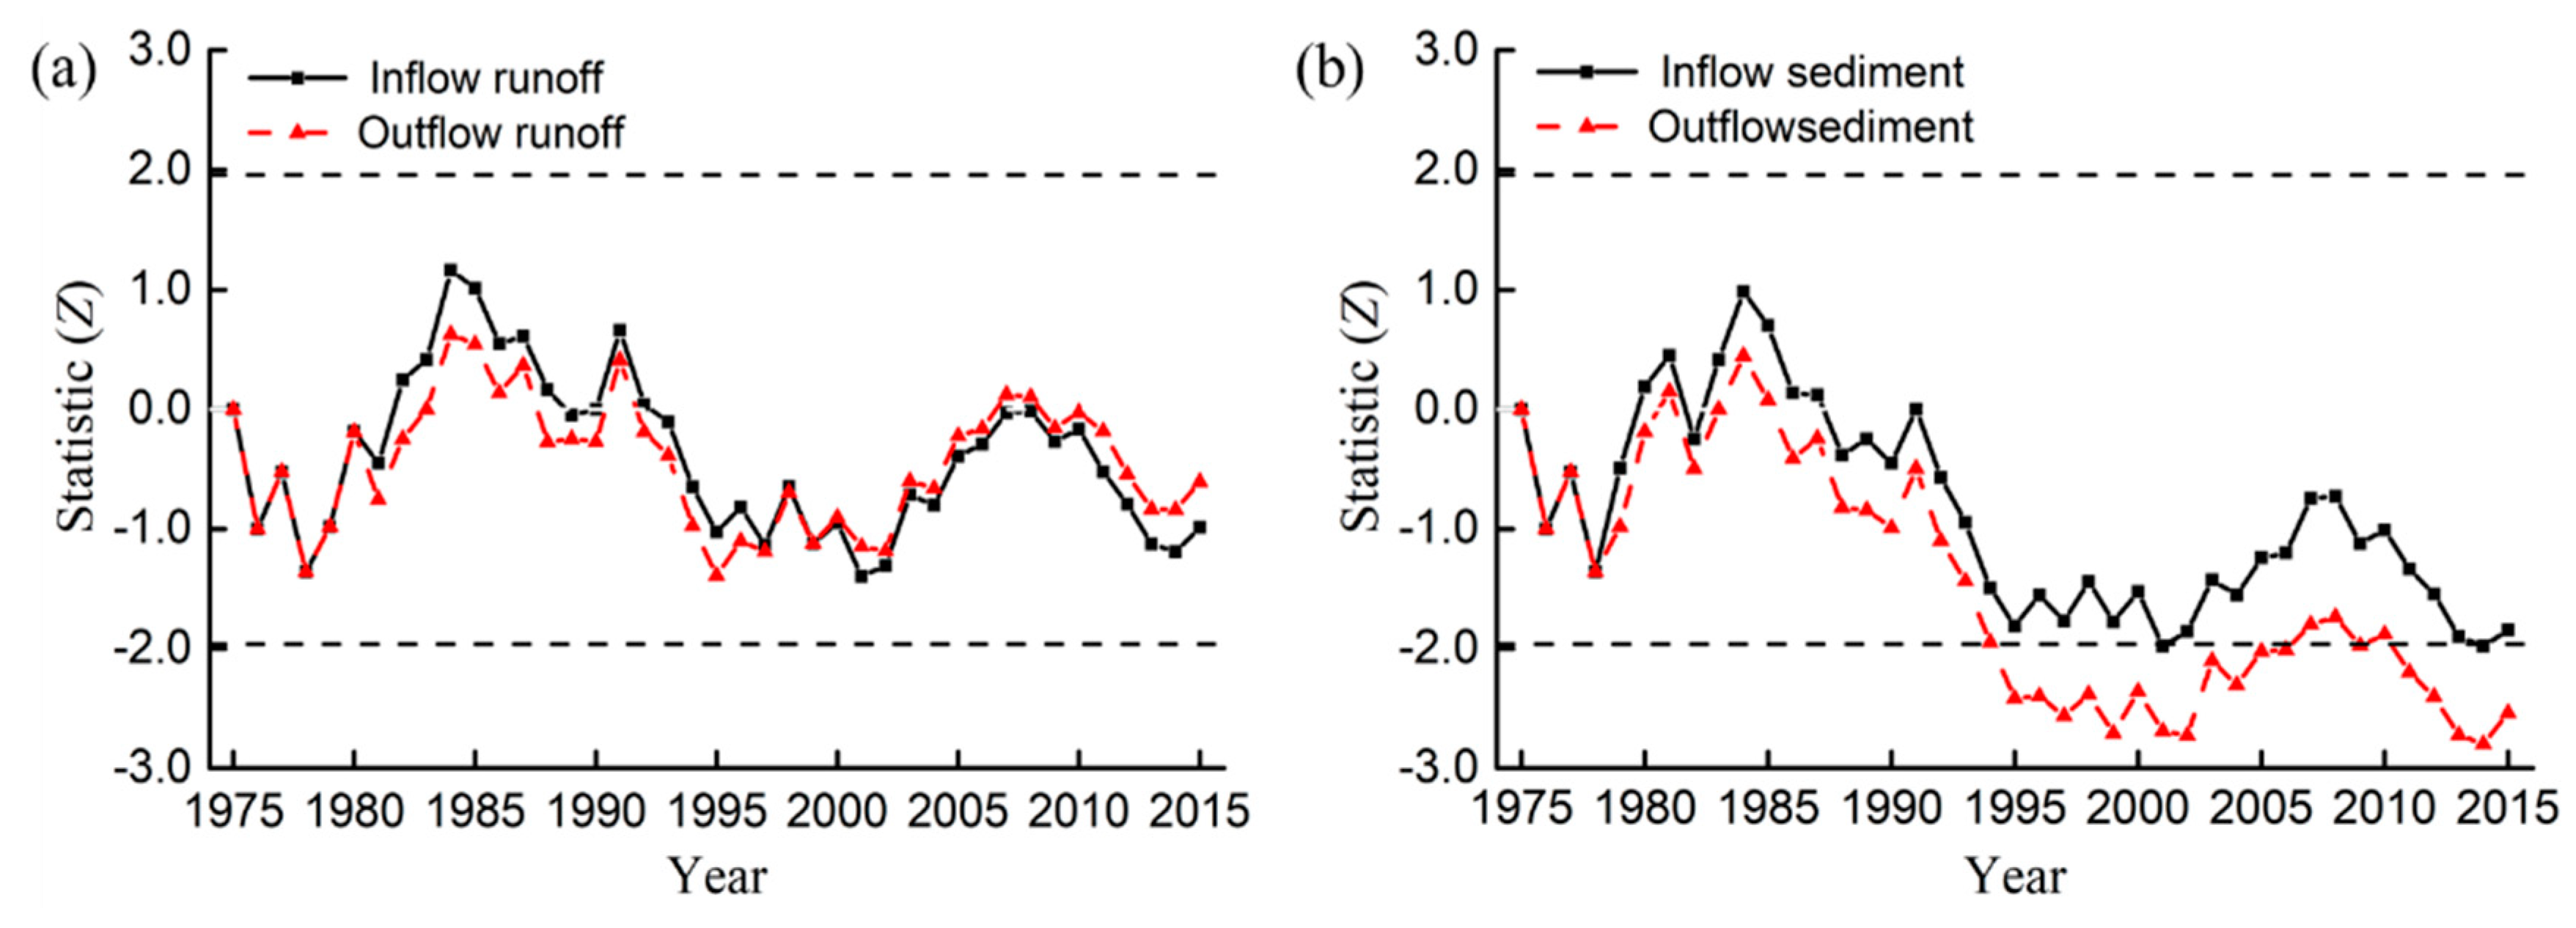
The M–K test is conducted on the runoff and sediment time series of Hongze Lake from 1975 to 2015, the statistics are shown in Table 1. Taking 1975 as the starting point of the calculation, the calculated M–K statistics positive series of the annual mean inflow and outflow runoff are shown in Figure 3.
The inflow and outflow runoff M–K statistics are –0.98 and −0.60 during 1975–2015, and the decreasing trend is not obvious. While the M–K statistics are close to the critical value of −1.96 during 1994–2005, and the decreasing trend is relatively significant. However, during the whole study period, the M–K statistics are all lower than the significant level, with no significant variation trend, and the variation of runoff and sediment flowing into and out of Hongze Lake in normal fluctuation.
The inflow and outflow sediment M–K statistics are −1.83 and −2.53 from 1975–2015. The inflow sediment M–K statistics time series present a slight decreasing trend, while the outflow sediment M–K statistics exceed the significant level and have an obvious decreasing trend. Except for 1981 and 1983–1987, the inflow sediment M–K statistics are greater than 0 and tend to increase, while the rest years show a decreasing trend. Except for 1981, 1984 and 1985, the outflow sediment M–K statistics are greater than 0 and tend to increase, the rest is less than 0 and shows an obvious decreasing trend. The runoff and sediment M–K statistics of flowing into and out of Hongze Lake are all outside the critical value during 1994–2004 and 2011–2015, as the decreasing trend is prominent.

3.1.2. Analysis of Runoff and Sediment Change Point

The runoff and sediment flowing into and out of Hongze Lake on a decreasing trend during 1975–2015. However, the runoff M–K statistics of the inflow and outflow did not exceed the critical value of α = 0.05, showing no significant trend variation. There was no significant variation in the time series, that means no change point exists. However, the sediment M–K statistics of inflow and outflow exceed the critical value of α = 0.05, showing a relatively obvious variation trend. Therefore, only the mutation test was carried out on the sediment time series of inflow and outflow to identify the change point.
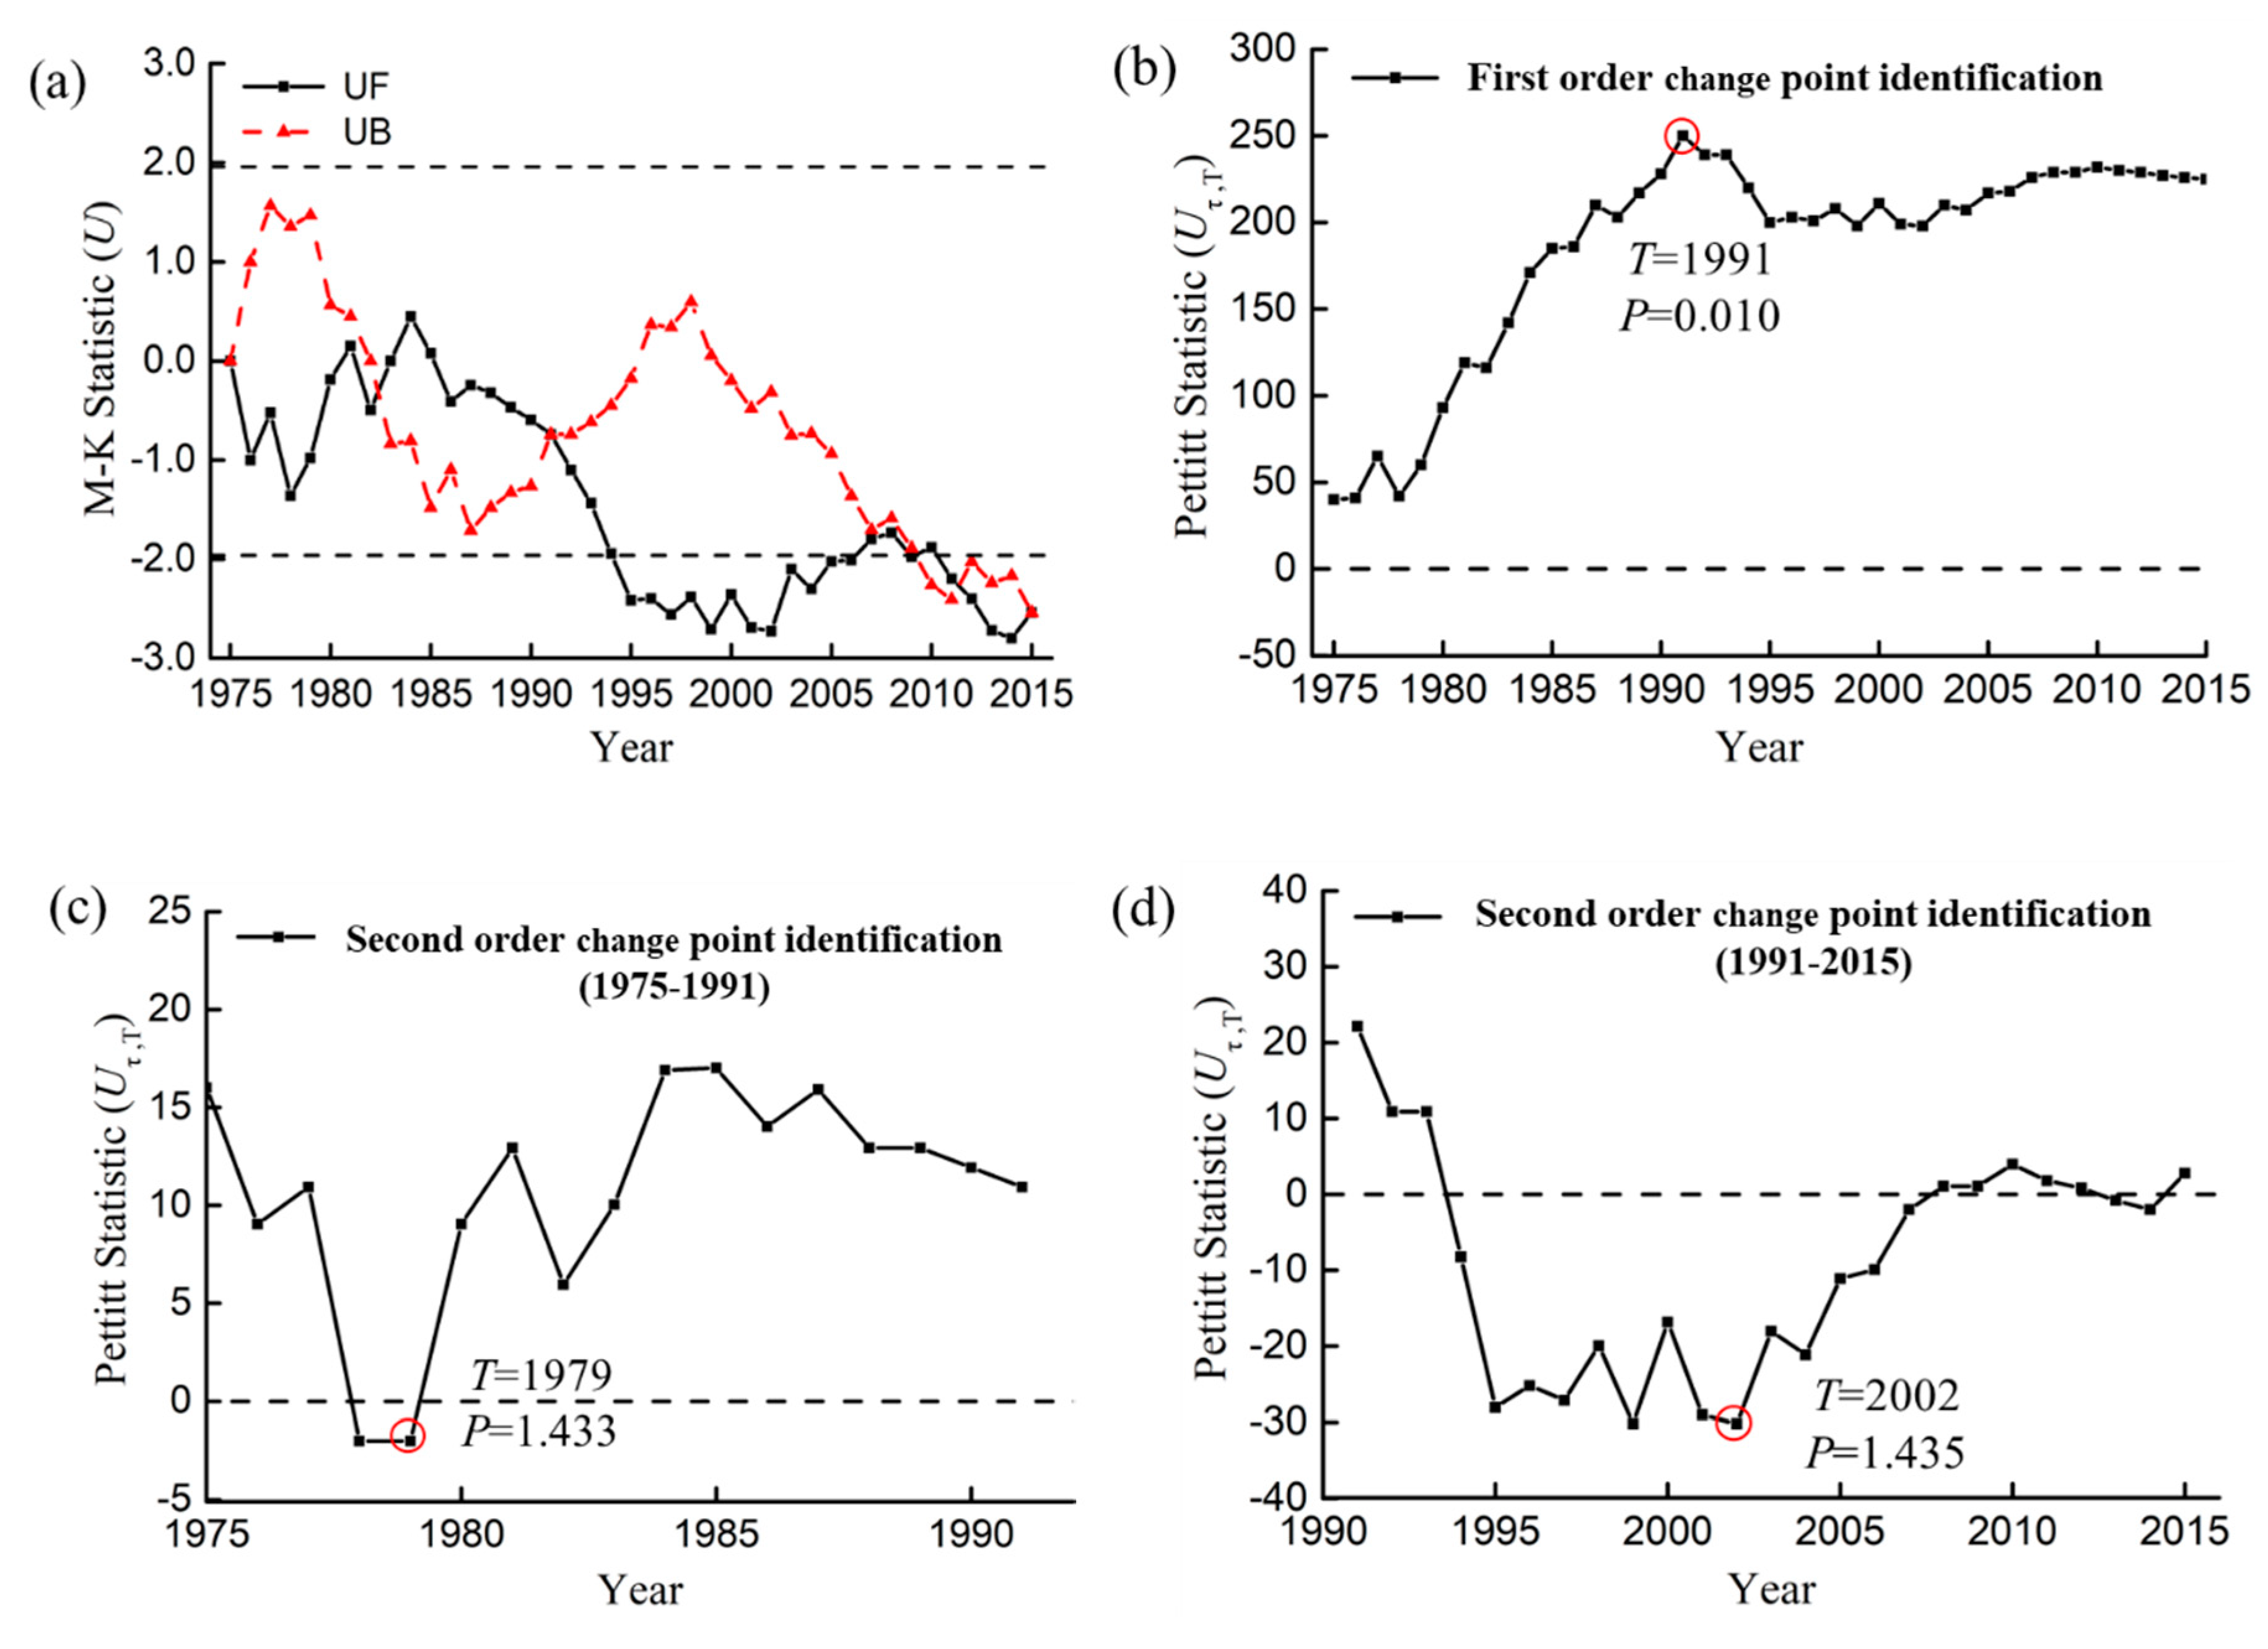
The calculation was carried out according to the combinatorial mutation test method. The positive and inverse order M–K statistics series of inflow sediment and Pettitt change points were obtained, as Figure 4a. The intersections of the M–K statistics series of inflow sediment occurred during 1982–1983, 1991 and 2006–2012, and the possible mutation years were 1982, 1991 and 2006. Through Pettitt test identify the change points, 1991 was identified as the first order change point, as shown in Figure 4b. Based on the first-order change point, the long-term time series is divided into two parts: 1975–1991 and 1991–2015, and the second order change point of the Pettitt test was carried out. The points are not within the possible mutation region of the M–K test, so the second order change points of the Pettitt test are not significant, as shown in Figure 4c,d. The possible mutation years obtained by the M–K test, 1982 and 2006, were false change points. In conclusion, the change point of inflow sediment time series occurred in 1991.
The positive and inverse order M–K statistics series of outflow sediment and Pettitt change points are shown in Figure 5a. Through the Pettitt test, 1991 was identified as the first order change point, which is consistent with the change point of inflow sediment, as shown in Figure 5b. After testing the second order change points of the two-part series: 1975–1991 and 1991–2015, the change year is not within the possible mutation regions of M–K test, as shown in Figure 5c,d, and the change point is not significant, that is, there is no second order change point. So the change point of outflow sediment series occurred in 1991. Then, taking the change point as the boundary, the time series was divided into two parts: 1975–1991 and 1992–2015. The characteristic values of the two part time series were calculated, the results are shown in Table 2. The average inflow sediment decreased by 41.8 billion m3 after the mutation, and the reduction is 48.6%. The average outflow sediment decreased by 26.2 billion m3 after the mutation, and the reduction is 56.1%. The sediment of inflow and outflow decreased obviously after the change point.

3.2. Wavelet Analysis

3.2.1. Analysis of Wavelet Transform

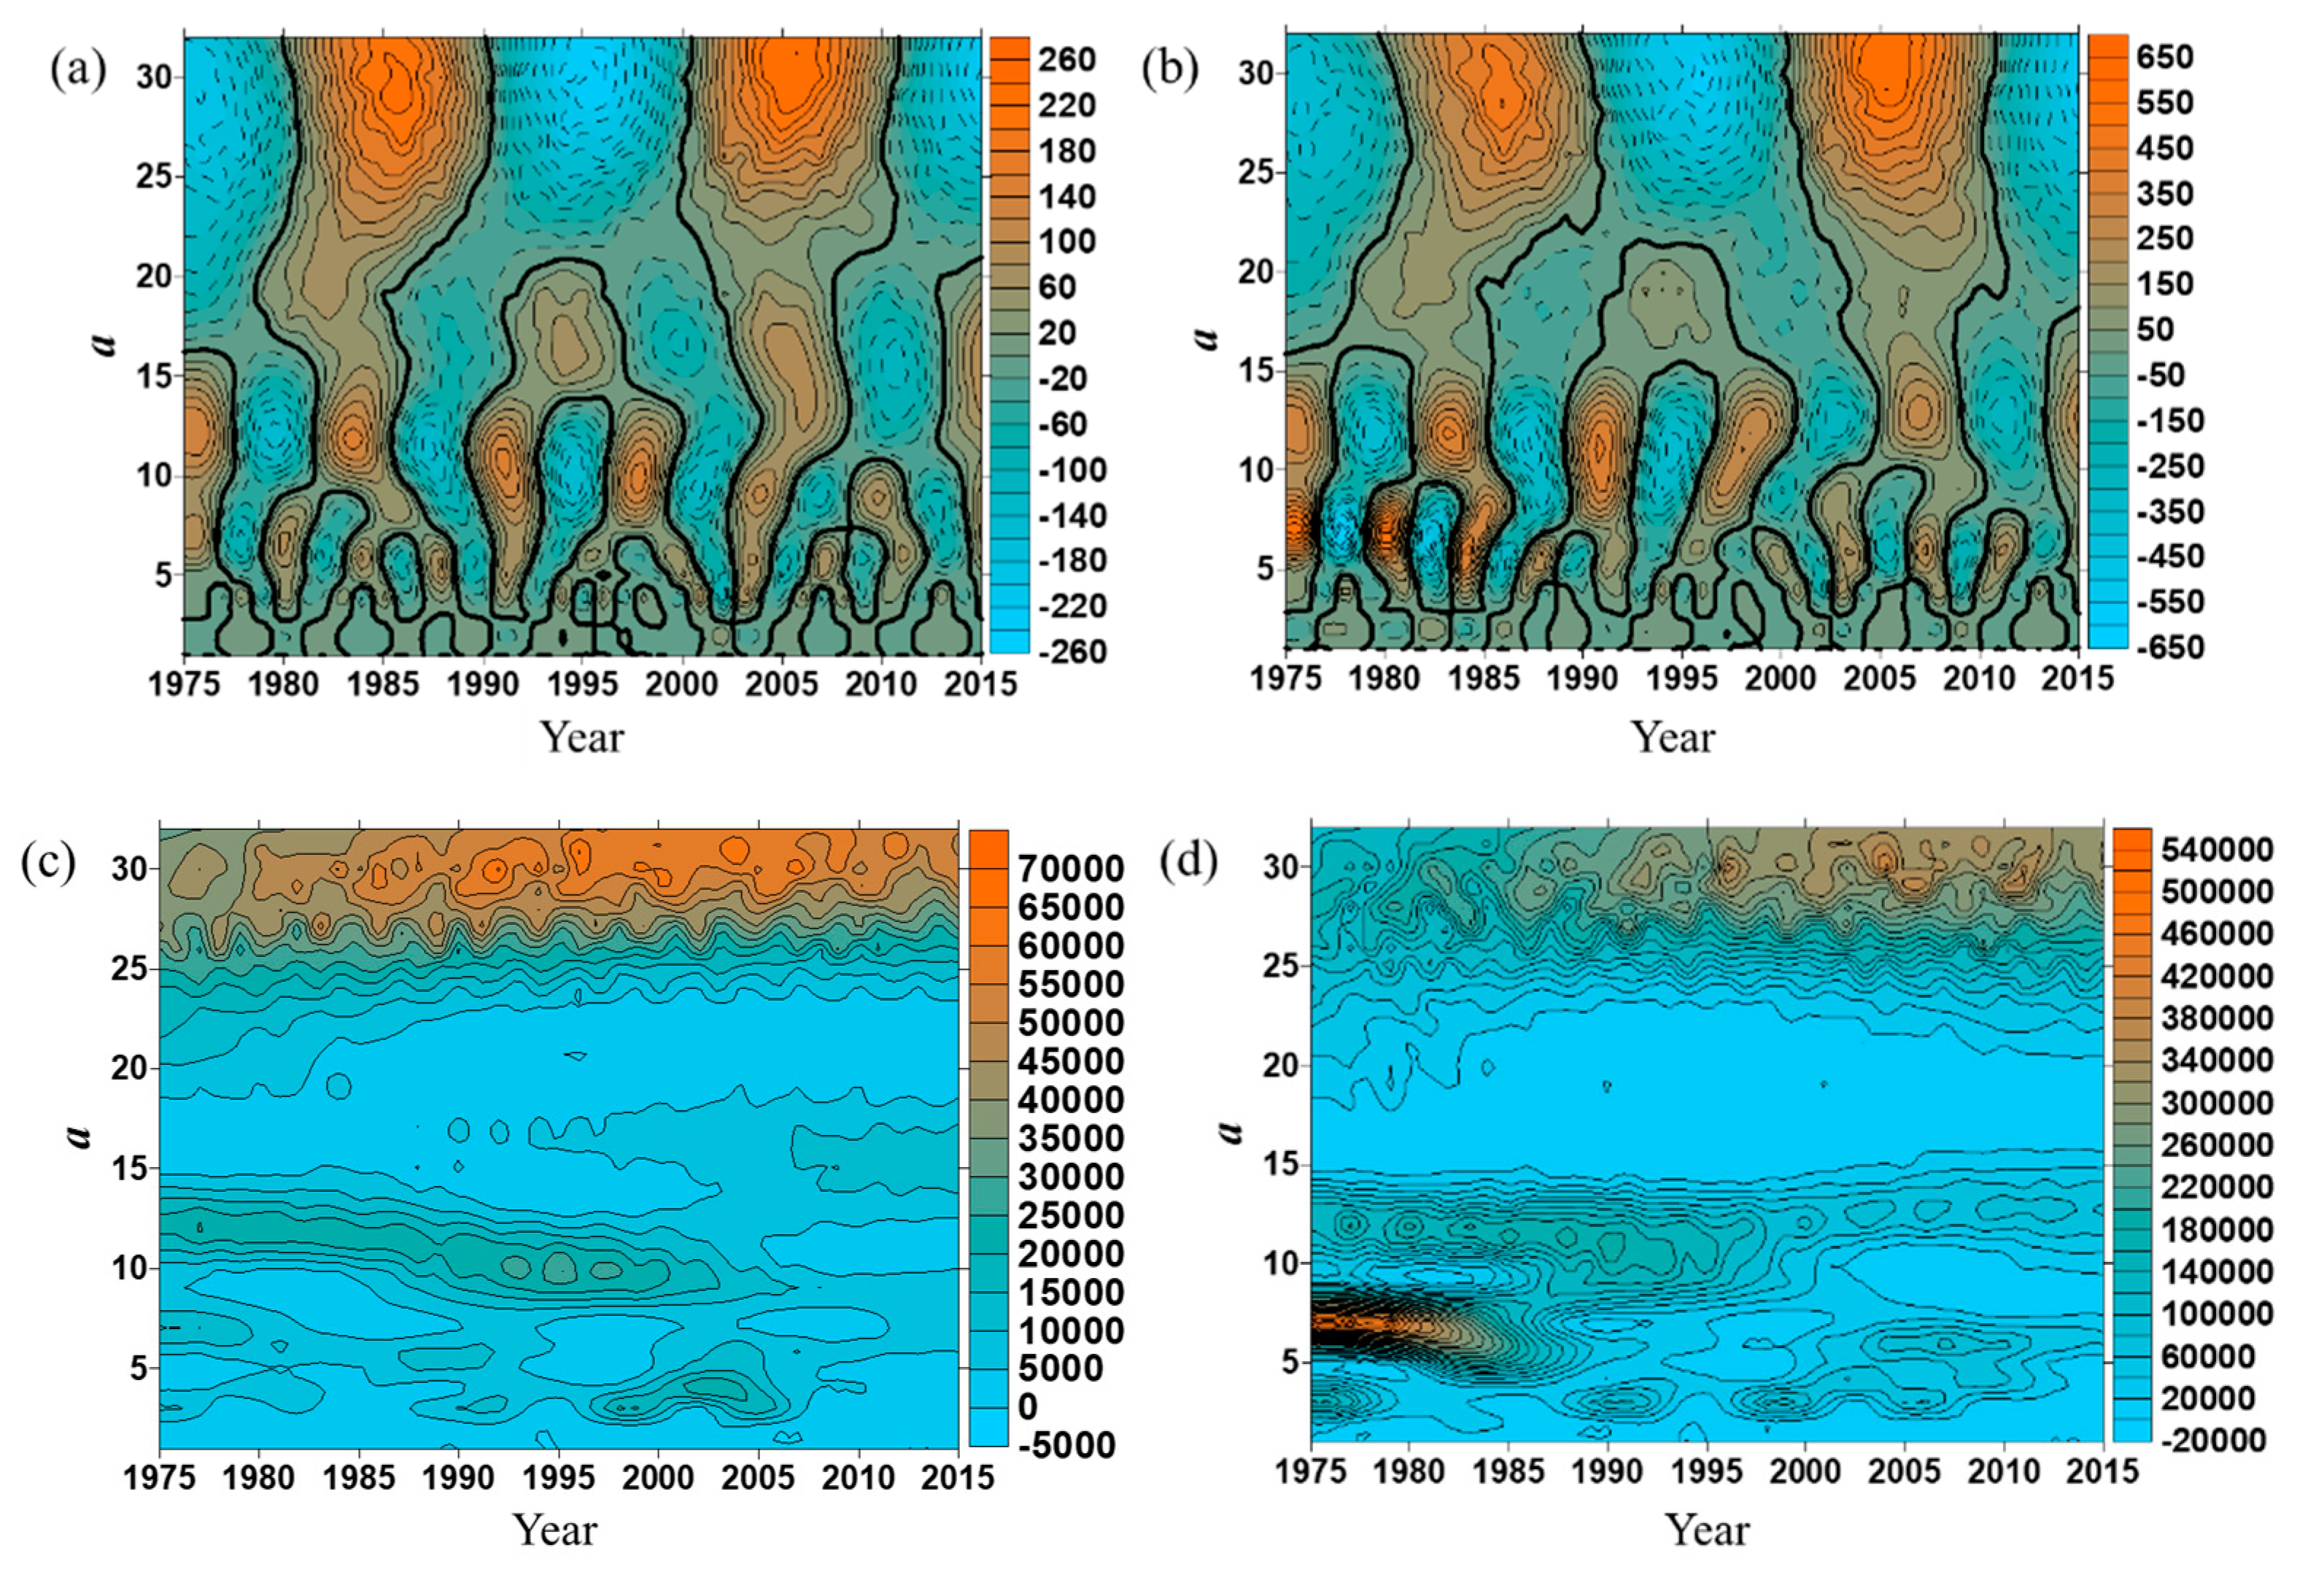
Because the inflow variation law of runoff and sediment is similar to the outflow, so only the inflow runoff and sediment time series analyzed by wavelet theory. The real part contour map of wavelet coefficients can reflect the periodic variation law of the hydrological time series on various time scales [48], as shown in Figure 6a,b. The solid line shows that the real part of the wavelet coefficient is positive, which represent the flood season of Hongze Lake, that’s the orange area in the figure. The dotted line shows that the real part of the wavelet coefficient is negative, which represents the dry season of Hongze Lake, that’s the light blue area in the figure. The thick solid line shows the zero isolines, that is, the borderline between rich period and dry period.
There are four types of periodic variation rules in the evolution process of inflow runoff, namely 23–32 a , 14–20 a , 9–13 a and 5–8 a , as shown in Figure 6a. Among them, there are quasi-second oscillations between high and low runoff in time scale of 23–32 a , which is relatively stable in the whole research time domain. There are quasi-third oscillations between high and low runoff in time scale of 14–20 a , which mainly occurred after 1986. There are quasi-sixth oscillations in the time scale of 9–13 a , which are also global. The periodic variations in the time scale below 8 a are relatively chaotic, it shows that the inflow runoff changed frequently and had poor regularity in a small scale cycle. There are three types of periodic variation rules in the evolution process of inflow sediment, namely 23–32 a , 9–15 a and 5–8 a   as shown in Figure 6b. There are quasi-second oscillations between high and low runoff in time scale of 23–32 a , and quasi-fifth oscillations in time scale of 9–15 a . It can be seen that the periodic variation of the above two time scales are relatively stable in the whole research domain, and with a global character.
The modulus square value of the wavelet coefficient is equivalent to the wavelet energy spectrum, and the oscillation energy of different periods can be analyzed, the larger the value is, the stronger the energy of the corresponding period is. Orange color is used to represent the area with a large modulus square value of the wavelet coefficient, which can be seen in the strong and weak distribution of annual inflow runoff in each time scale, as shown in Figure 6c. Among them, the energy of 26–32 a time scale is strongest, the periodic distribution is obvious and almost occupying the whole study domain, the oscillation center is around 2004. The energy of 9–14 a time scale is also strong, though the period is significant but locality, it mainly occurred before 2003, and the center of oscillation is around 1996. The 2–5 a time scale mainly occurred in 1997–2006, but the energy is weak and locality, the center of oscillation is around 2003.
In the research time domain, the strong and weak distribution of annual inflow sediment in each time scale is shown in Figure 6d. The energy of 26–32 a time scale is the strongest, and the periodic distribution is obvious, almost occupying the whole study time domain, and the oscillation center is around 2004 or 2012. The energy of 10–14 a time scale is also strong, and the period is significant, and it also has the global character, the oscillation center is around 1991. The time scale of 5–8 a mainly occurred before 1987, the energy performance is relatively significant but locality. The time scale of 3–4 a also has periodic distribution, but the energy performance is very weak and locality.

3.2.2. Analysis of Wavelet Variance and Periodic Characteristic

The wavelet variance diagram can reflect the distribution of wave energy with time scale a of the studied hydrological time series, it can be used to determine the main period in the evolution process of hydrological series [49].
There are four obvious peaks in the annual runoff time series, and they are 30 a , 11 a , 6 a , and 4 a , as shown in Figure 7a. The maximum peak value corresponds to the time scale of 30 a , which indicates that the cycle oscillation of 30 a is the strongest, it is the first main period of runoff variation in Hongze Lake during 1975–2015. The time scale of 11 a corresponds to the second peak value, which is the second dominant period. The time series of 6 a and 4 a also correspond to two peak values, but the variance value is relatively small. This shows that the fluctuation of the above four periods control the variation characteristics of the annual runoff inflow in the whole study time domain.
There are four obvious peaks in the annual sediment time series from 1975–2015, they are 30 a , 12 a , 7 a and 3 a , as shown in Figure 7b. Among them, the maximum peak value corresponds to the time scale of 30 a , which indicates that the cycle oscillation of 30 a is the strongest, it is the first dominant period of sediment variation in Hongze Lake, which is the same as runoff series variation rules. The time scale of 11 a and 7 a have a similar peak value. The fluctuation of the above four periods controlled the variation characteristics of the annual sediment inflow in the whole study time domain.
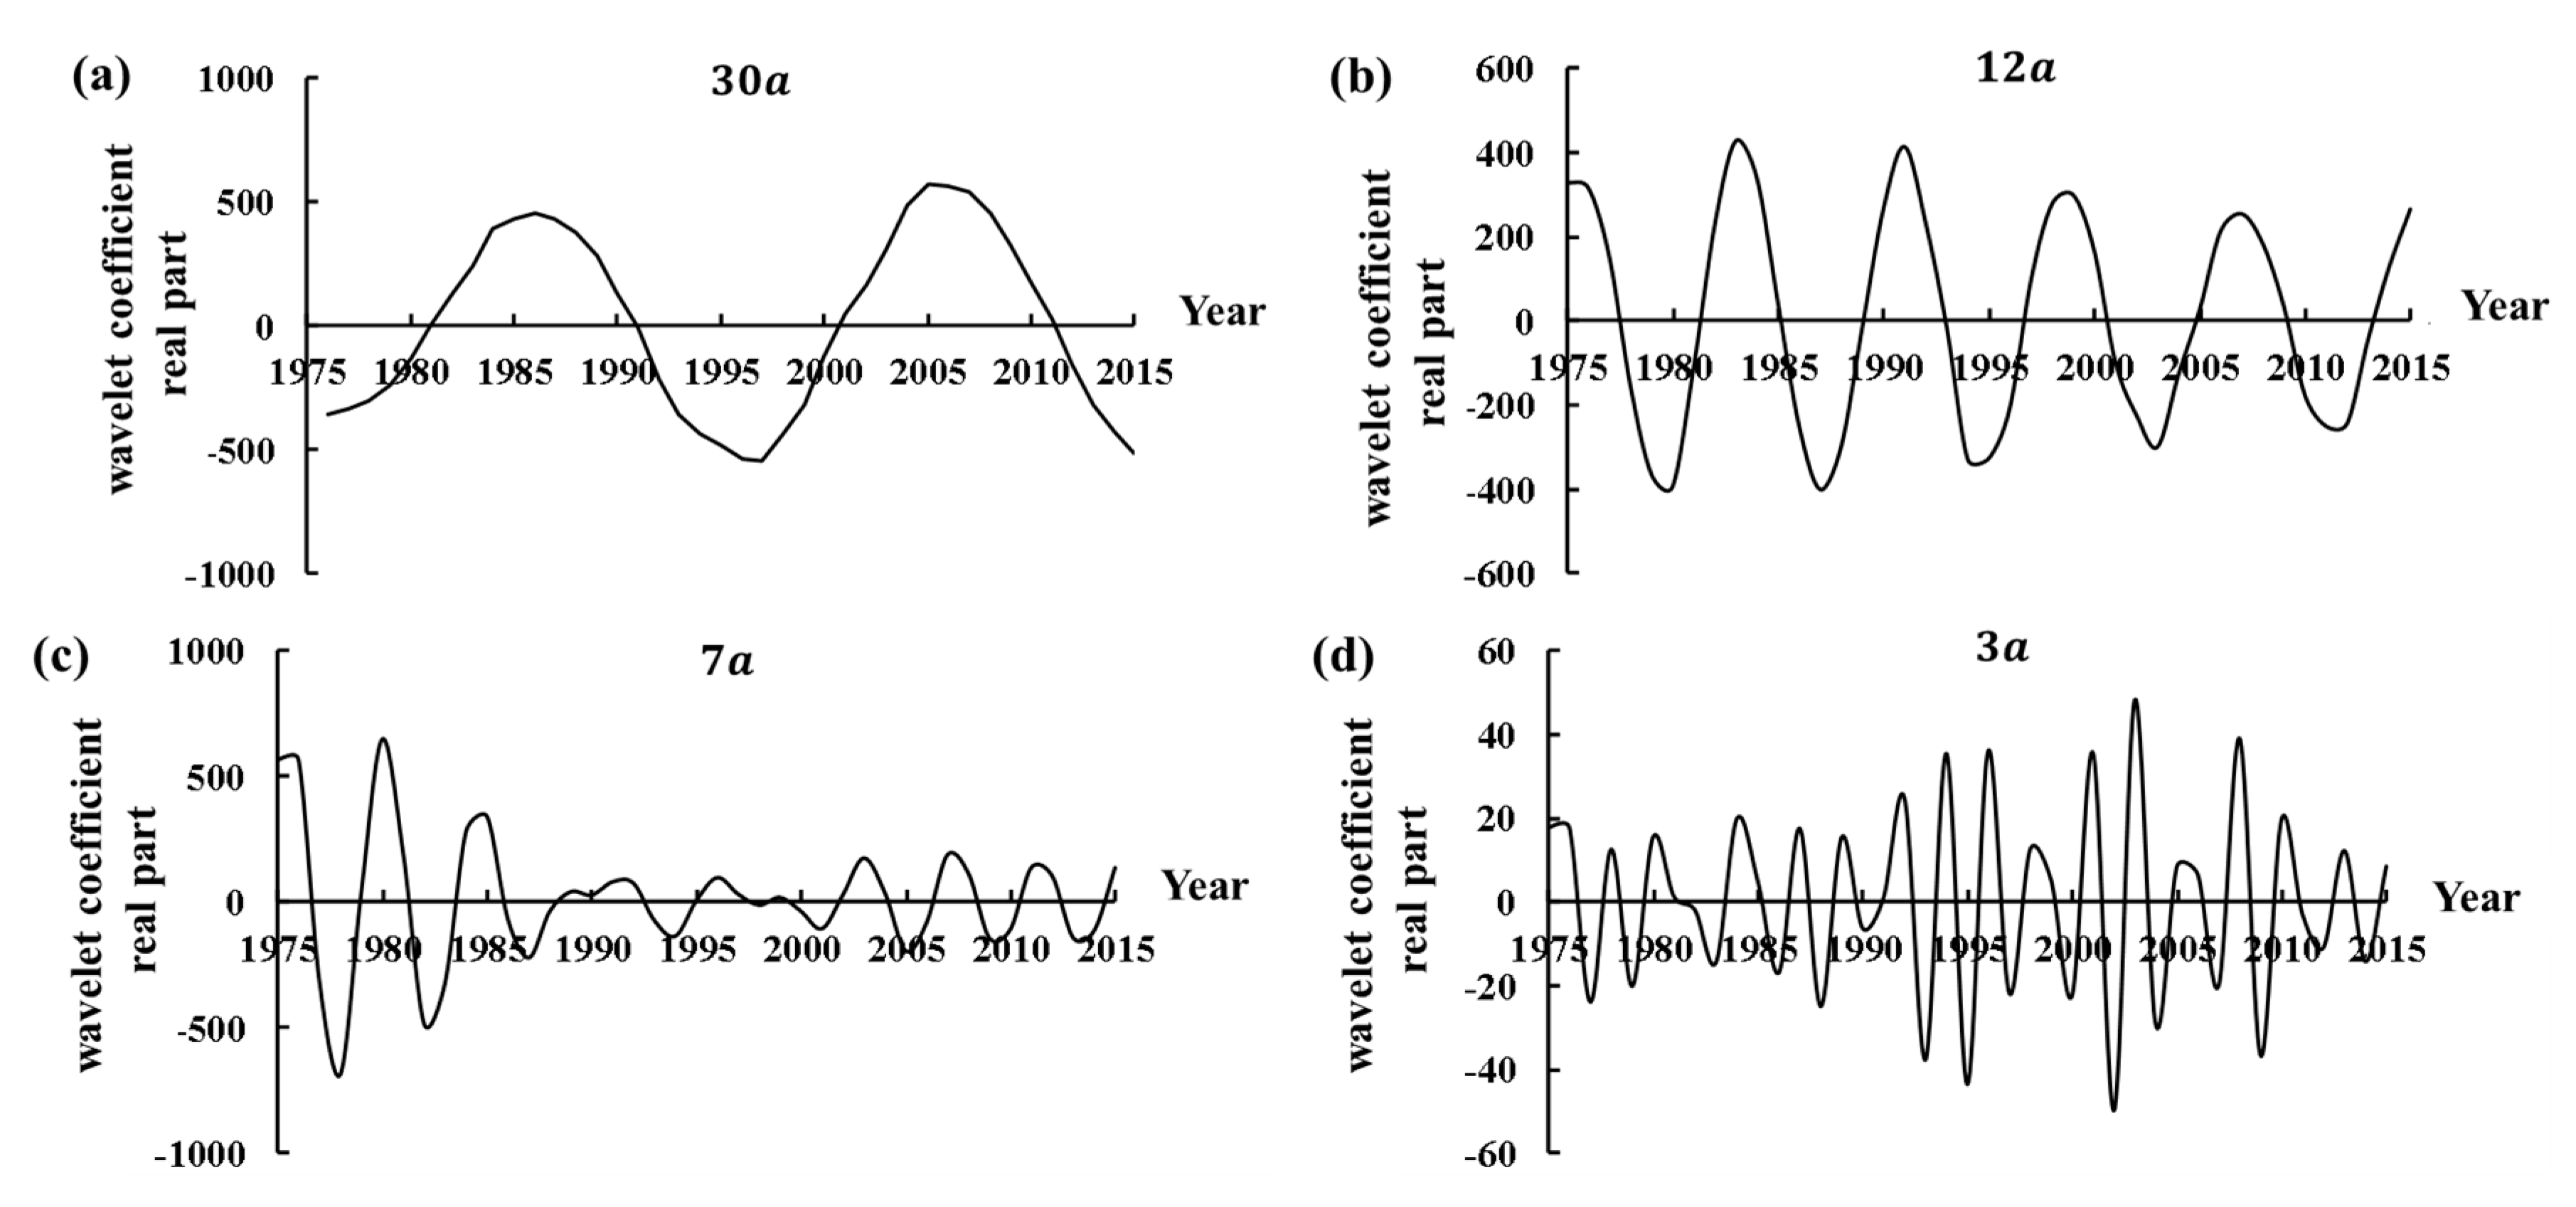
According to the results of the wavelet variance test, drawing the real part variation process of the four main period wavelet coefficients of the runoff time series evolution, as shown in Figure 8. The average period and variation characteristic in the evolution process of annual inflow runoff under different time scales can be analyzed, the analysis results show in Table 3. The distribution characteristics of the runoff time series from 1975 to 2015 in the whole study time domain are uneven, and with significant localization characteristics. The variation process of high and low runoff under different characteristic time scales is different and closely related to the time scale. So, the inflow runoff time series exist two main periods, which are time scale of 11 a and 30 a . The real part variation process of four main period wavelet coefficients of sediment time series evolution is drawn, as shown in Figure 9. Moreover, the analysis results of different characteristic time scales are shown in Table 4. So, the inflow sediment time series exist two main periods, which are the time scale of 12 a and 30 a . From the analysis, the annual inflow runoff and sediment time series exist the same first main period, it can be predicted that the annual inflow runoff and sediment maintain in a low-value period, and will reach the valley floor value after 2015.

3.3. Cause Analysis of Runoff and Sediment Variation

3.3.1. Cause Analysis of Runoff Trend Variation

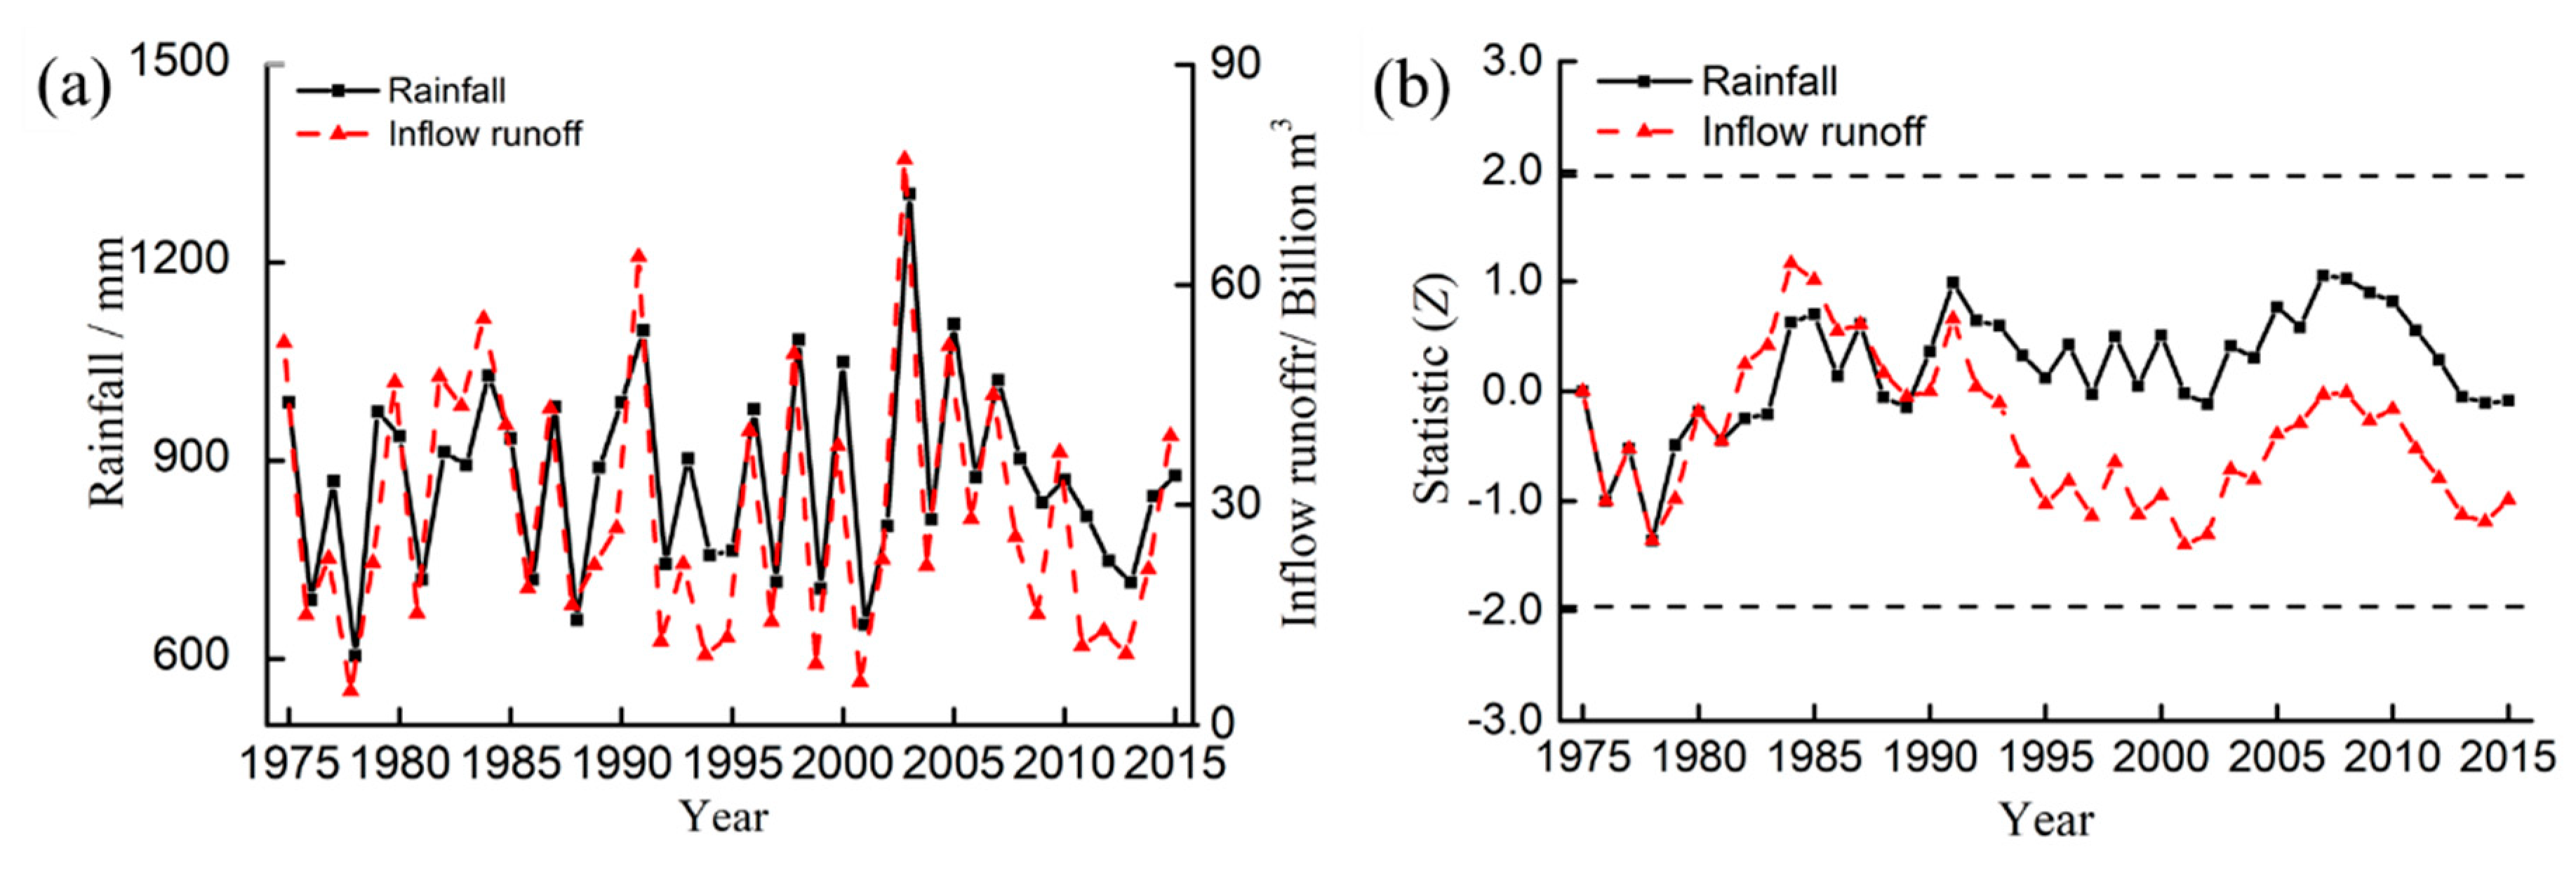
The main factors for the variation of runoff in the river basin are rainfall and water consumption by human activities. Considering that the variation of inflow runoff and outflow runoff are relatively consistent, the research only analysis the influence of rainfall on the variation of inflow runoff. The variation of rainfall and runoff are relatively synchronous, and the runoff varies with the variation of rainfall, as shown in Figure 10a. In 1975, 1983, 1991, 2003, and 2007, great floods occurred in the Huaihe River basin, and the runoff inflow into the lake increased significantly. Meanwhile, in 1978, 1986, 1992, 1994, 2000, and 2001, the rainfall in the Huaihe River basin decreased, the drought led to a decrease in the runoff inflow into the lake. From 1992 to 2003, the inflow runoff decreased significantly, the M–K statistic is close to the critical value, the results of the M–K test agree with the actual variation.
Through the M–K trend analysis of the multi-year rainfall time series, the M–K statistic of rainfall from 1975 to 2015 is −0.05, and the rainfall shows no obvious decreasing trend. The variation trend of inflow runoff is consistent with the rainfall, as shown in Figure 10b. Sun et al. [50] have pointed out that in the last 50 years, the annual fluctuation of precipitation in the Huaihe River basin was relatively strong, and the rainfall intensity showed an insignificant decreasing trend, which was consistent with the research results.
Before 1993, the variation trend of rainfall was consistent with the inflow runoff, and rainfall played a leading role in the runoff variation. After 1993, rainfall tends to increase while inflow runoff tends to decrease. So, 1975–1993 was selected as the base period of the whole study period. According to the regression analysis [51], the relationship between inflow runoff Y and rainfall X in the base period is: Y = 1.0197X − 577.18 (R2 = 0.8171). According to the rainfall-runoff relationship, the average annual inflow runoff is 32.75 billion m3 during 1993–2015, the runoff decreased by 1.09 billion m3 compared with 1975–1993. The measured annual average inflow runoff is 27.10 billion m3 during 1993–2015, the runoff decreases by 3.92 billion m3 compared with 1975–1993. Thus, among the major factors influencing the decrease of runoff from 1993 to 2015, the decrease in rainfall accounted for 28%, and the increase in water use for human activities accounted for 72%.
Under investigation, the water consumption increased from 39.86 billion m3 to 54.02 billion m3 during 1993–2015. The M–K trend was conducted on the water consumption time series, the results showed that the statistic Z = 4.72 is far more than 95% significant level, and the water consumption increased significantly. The economy of the Huaihe River basin increased by 1.35 times and the population increased by 8 million from 1994 to 2004. With the growth of population, the rapid development of domestic water, construction and production water, agricultural irrigation water, aquaculture and other activities, the degree of exploitation and utilization of water resources has been increasing and exceeded 60% [52]. Anthropogenic activities have become the main reason for the decrease of inflow runoff after 1993.

3.3.2. Trend Variation of Sediment and Cause Analysis of Change Point

Sediment transport is mainly related to climate variability and anthropogenic activities in the basin. In the trend analysis, the variation trends of sediment flowing into and out of Hongze Lake are related to runoff. The M–K test statistics of rainfall and runoff in the study period did not exceed the significance level, while the sediment exceeded the significance level and showed a more obvious decreasing trend. It meant rainfall and runoff had no obvious effects on the decreasing trend of sediment, anthropogenic activities may had a great influence on sediment transport.
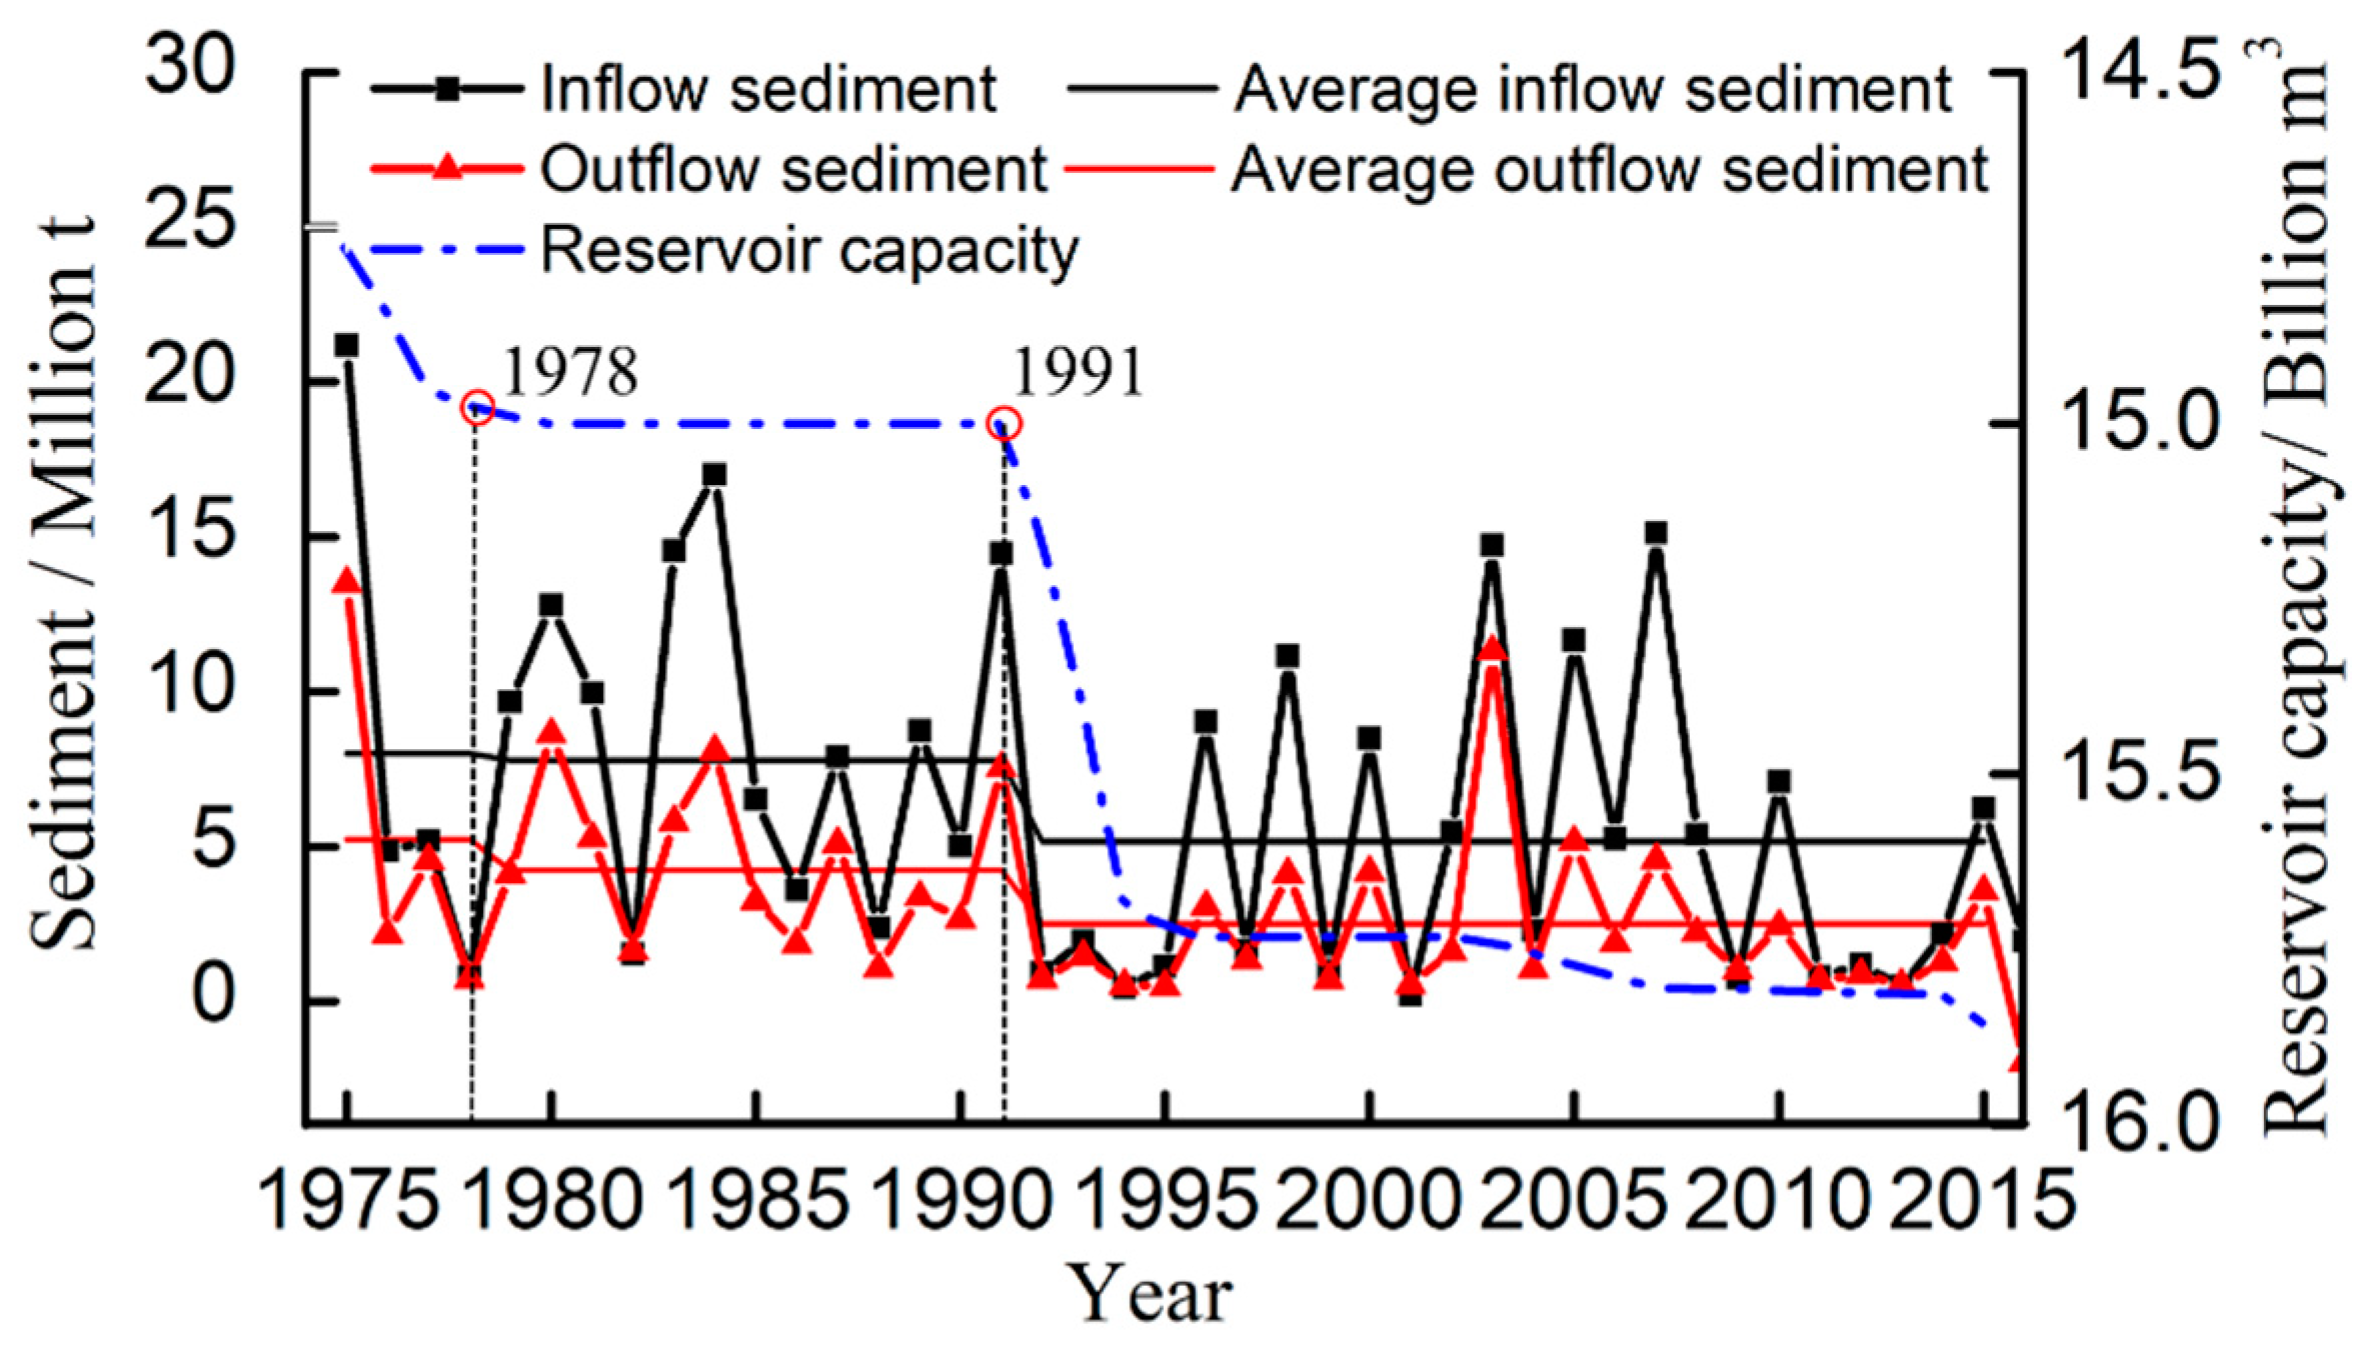
Since 1949, large-scale reservoir construction has been carried out in the Huaihe River basin to develop hydropower resources rationally and reduce flood disasters. At present, 18 large reservoirs have been built successively in the Huaihe River basin, with the maximum capacity of flood storage reaching 8.89 billion m3. Because the period from 1975–2015 is not the prosperous period of reservoir construction in the Huai River basin, therefore, the research period is divided by the completion time of large and medium-sized reservoirs and storage capacity changing time in the Huaihe River basin. For example, the Banqiao reservoir began to be rebuilt in 1978, and the Huaihe River basin was flooded in 1991. Therefore, the period is divided into 1975–1978, 1979–1991, and 1992–2015. The reservoir capacity increased from 14.75 billion m3 to 15.854 billion m3, the average inflow sediment decreased from 7.98 million t to 5.22 million t, and the average outflow sediment decreased from 5.24 million t to 2.27 million t. As shown in Figure 11, the inflow sediment and outflow sediment decreased with the increase of the total reservoir capacity, and the silt trapping of the reservoir has a significant effect on the inflow and outflow sediment.
According to the above study, the change point of sediment flowing into and out of Hongze Lake occurred in 1991. although there was no significant change in rainfall from 1975–2015, but heavy rainfalls affect the variation of runoff and sediment in a short time. For example, in 1991, the average rainfall of the Huaihe River was 1082 mm, 20% more than the average year. The rainfall is concentrated from June to August, then the runoff and sediment flowing into Hongze Lake increased significantly, and the largest value occurred in July. Meanwhile, after 1991, the rainfall decreased and the M–K test statistic of rainfall is −0.37 < 0 during 1991–2015, which showed that the rainfall decreased after 1991. Rainfall reinforced the decreasing trend of runoff and sediment.
In terms of anthropogenic activities, LUCC can result in alterations in rainfall–sediment yield relationship in the Huaihe River basin [53]. According to statistics, anthropogenic activities strongly disturbed the surface of the Huaihe River basin, causing the changes of land use in the region. Before the 1980s, the Huaihe River basin was dominated by cultivated land and forest. With the increase of the regional population, more natural wetlands and forests were transformed into construction land and farmland, water and soil erosion in the basin was becoming more and more serious, the ecological environment of the river basin was seriously damaged. In the 1980s, the government started soil and water conservation work in the basin, focusing on reducing sloping farmland, increasing vegetation, and closing mountains for forest and grass, thus controlling soil erosion to a certain extent. These anthropogenic activities have changed the land use and cover of the study area, thus causing the decrease of runoff and sediment to some extent. Besides, hydraulic engineering projects played an important role to decrease the sediment, due to the series flood disaster in the Huaihe River basin, China has designed 19 projects to control the Huaihe River, by 1998 (when the ShiMantan reservoir was completed), the upstream reservoir of Hongze Lake had increased by 0.77 billion m3, part of the sediment was intercepted by the reservoir. At the same time, the implementation of the projects to control the Huaihe River is beneficial to soil and water conservation, since 1991, the upstream of Hongze Lake has been treated with 2184 km2 of soil erosion.
So, the climate variability and anthropogenic activities have a significant impact on the sediment flowing into and out of Hongze Lake, while changes in heavy rainfall patterns, the construction of hydraulic engineering projects, and LUC are the main factors.

4. Conclusions

This paper based on the M–K test and Pettitt test, a combinatorial mutation test method with high precision was proposed to analyze the trend of runoff and sediment time series of Hongze Lake from 1975 to 2015. The results show that the runoff flowing into and out of Honze Lake were within the confidence interval of significance level a = 0.05, but didn’t exceed the significance level, and there were no obvious trend variation and change points. While the sediment flowing into and out of Honze Lake showed a decreasing trend, and the change point is 1991.
The Morlet wavelet analysis method was used to analyze the periodicity of annual runoff and sediment time series flowing into Hongze Lake from 1975 to 2015. There existed four scales of the periodic variation in the time series, and in different time scales. The rich and dry variation trends of inflow runoff and sediment time series were different and closely related to the time scales. The annual inflow runoff and sediment time series had a similar variation period, with the same first main period and the characteristic scale was 30 a , which played a leading role in the rich and dry variation trend of annual inflow runoff and sediment in Hongze Lake. Under this characteristic scale, it can be predicted that the annual inflow runoff and sediment would enter into the low-value period respectively in a short time after 2015, and both would be in the valley floor stage.
Finally, analyzing the variation trend and mutation cause of runoff and sediment in Hongze Lake from the climate variability and anthropogenic activities. Changes in heavy rainfalls pattern, the construction of hydraulic engineering projects and LUCC in the Huaihe River basin, leading to the decreasing trend of sediment flowing into and out of Hongze Lake. The results show that the combinatorial mutation test method has higher accuracy, the time series of annual runoff and sediment flowing into and out of Hongze Lake had the characteristics of multi-time scale variation, the variation trends of runoff were mainly affected by rainfall, and the sediment variation trends and change point were mainly affected by changes in heavy rainfall patterns, the construction of hydraulic engineering projects, and LUCC. The analysis methods and results provide the theoretical basis for flood prevention and control in the Huaihe River basin and further study on runoff and sediment in Hongze Lake.

Author Contributions

Conceptualization, Y.D. and G.X.; methodology, Y.D. and G.X.; investigation, Y.L. (Yuan Liu); data curation, X.F.; writing—original draft preparation, Y.L. (Yuan Liu) and X.F.; writing—review and editing, Y.L. (Yijun Liu) and S.Z.; visualization, Y.D.; supervision, G.X. All authors have read and agreed to the published version of the manuscript.

Funding

This research was funded by the NATIONAL KEY R&D PROGRAM OF CHINA, grant number 2017YFC0405602.

Acknowledgments

The authors gratefully acknowledge the editors and the anonymous reviewers for their insightful and professional comments, which helped to improve the manuscript.

Conflicts of Interest

The authors declare no conflict of interest.

References

  1. Rice, J.S.; Emanuel, R.E.; Vose, J.M.; Nelson, S. Continental U.S. Streamflow trends from 1940 to 2009 and their relationships with watershed spatial characteristics. Water Resour. Res. 2015, 51, 6262–6275. [Google Scholar] [CrossRef]
  2. Lins, H.F.; Slack, J.R. Streamflow trends in the United States. Geophys. Res. Lett. 1999, 26, 227–230. [Google Scholar] [CrossRef] [Green Version]
  3. Lettenmaier, D.P.; Wood, E.F.; Wallis, J.R. Hydro-Climatological Trends in the Continental United States, 1948–1988. J. Climate. 1994, 7, 586–607. [Google Scholar] [CrossRef] [Green Version]
  4. Kalra, A.; Ahmad, S.; Nayak, A. Increasing Streamflow Forecast Lead Time for Snowmelt Driven Catchment Based on Large Scale Climate Patterns. Adv. Water Resour. 2013, 53, 150–162. [Google Scholar] [CrossRef]
  5. Zhou, Y.; Ma, Z.; Wang, L. Chaotic dynamics of the flood series in the Huaihe River Basin for the last 500 years. J. Hydrol. 2002, 258, 100–110. [Google Scholar] [CrossRef]
  6. Lin, C.A.; Wen, L.; Lu, G.; Wu, Z.; Zhang, J.Y.; Yang, Y.; Zhu, Y.F.; Tong, L.Y. Atmospheric-hydrological modeling of severe precipitation and floods in the Huaihe River Basin, China. J. Hydrol. 2006, 330, 249–259. [Google Scholar] [CrossRef]
  7. Zhu, Y.; Wang, W.; Liu, Y.; Wang, H.J. Runoff changes and their potential links with climate variability and anthropogenic activities: A case study in the upper Huaihe River Basin, China. Hydrol. Res. 2015, 2015, 1019–1036. [Google Scholar] [CrossRef]
  8. Ye, Z.W.; Li, Z.H. Spatiotemporal Variability and Trends of Extreme Precipitation in the Huaihe River Basin, a Climatic Transitional Zone in East China. Adv. Meteorol. 2017, 2017, 1–15. [Google Scholar] [CrossRef]
  9. Yu, Z.; Yan, D.; Ni, G.; Do, P.; Yan, D.; Cai, S.; Qin, T.; Weng, B.; Yang, M. Variability of Spatially Grid-Distributed Precipitation over the Huaihe River Basin in China. Water 2017, 9, 489. [Google Scholar] [CrossRef] [Green Version]
  10. Jiang, J.H.; Yuan, J.X. Analysis on the historical flood of Hongze Lake (1736–1992). J. Lake Sci. 1997, 1997, 231–236. [Google Scholar] [CrossRef]
  11. Yin, Y.; Chen, Y.; Yu, S.; Xu, W.; Wang, W.; Xu, Y. Maximum water level of Hongze Lake and its relationship with natural changes and human activities from 1736 to 2005. Quatern. Int. 2013, 304, 85–94. [Google Scholar] [CrossRef]
  12. Duan, H.; Cao, Z.; Shen, M.; Liu, D.; Xiao, Q. Detection of illicit sand mining and the associated environmental effects in China’s fourth largest freshwater lake using daytime and nighttime satellite images. Sci. Total Environ. 2019, 647, 606–618. [Google Scholar] [CrossRef] [PubMed]
  13. Milly, P.C.D.; Wetherald, R.T.; Dunne, K.A.; Delworth, T.L. Increasing risk of great floods in a changing climate. Nature (London) 2002, 415, 514–517. [Google Scholar] [CrossRef] [PubMed]
  14. Tamaddun, K.A.; Kalra, A.; Ahmad, S. Patterns and Periodicities of the Continental U.S. Streamflow Change. World Environ. Water Resour. Congr. 2016, 2016, 658–667. [Google Scholar] [CrossRef]
  15. Mann, H.B. Non-Parametric Test Against Trend. Econometrica 1945, 13, 245–259. [Google Scholar] [CrossRef]
  16. Kendall, M.G. Rank Correlation Methods; Charles Griffin: London, UK, 1975. [Google Scholar] [CrossRef]
  17. Mondal, A.; Kundu, S.; Mukhopadhyay, A. Rainfall trend analysis by Mann-Kendall test: A case study of north-eastern part of Cuttack district, Orissa. Int. J. Earth Sci. 2012, 2, 70–78. [Google Scholar]
  18. Nourani, V.; Mehr, A.D.; Azad, N. Trend analysis of hydroclimatological variables in Urmia lake basin using hybrid wavelet Mann–Kendall and Sen tests. Environ. Earth Sci. 2018, 77, 207. [Google Scholar] [CrossRef]
  19. Daubechies, I. The wavelet transform, time-frequency localization and signal analysis. IEEE T. Inform. Tteory. 1990, 36, 961–1005. [Google Scholar] [CrossRef] [Green Version]
  20. Tamaddun, K.A.; Kalra, A.; Ahmad, S. Wavelet analyses of western US streamflow with ENSO and PDO. J. Water Clim. Chang. 2017, 8, 26–39. [Google Scholar] [CrossRef] [Green Version]
  21. Thakur, B.; Pathak, P.; Kalra, A.; Ahmad, S.; Bernardez, M. Using Wavelet to Analyze Periodicities in Hydrologic Variables. World Environ. Water Resour. Congr. 2017, 2017, 499–510. [Google Scholar] [CrossRef]
  22. Chong, K.L.; Lai, S.H.; El-Shafie, A. Wavelet Transform Based Method for River Stream Flow Time Series Frequency Analysis and Assessment in Tropical Environment. Water Resour. Manag. 2019, 33, 2015–2032. [Google Scholar] [CrossRef]
  23. Mann, H.B.; Whitney, D.R. On a test of whether one of two random variables is stochastically larger than the other. Ann. Math. Stat. 1947, 18, 50–60. [Google Scholar] [CrossRef]
  24. Kruskal, W.H.; Wallis, A.W. Use of ranks in one-criterion variance analysis. J. Am. Stat. Asso. 1952, 47, 583–621. [Google Scholar] [CrossRef]
  25. Pettitt, A.N. A Non-Parametric Approach to the Change-Point Problem. J. R. Stat. Soc. C Appl. 1979, 28, 126–135. [Google Scholar] [CrossRef]
  26. Chandler, R.E.; Scott, M. Statistical Methods for Trend Detection and Analysis in the Environmental Sciences; John Wiley & Sons Ltd.: Hoboken, NJ, USA, 2011. [Google Scholar] [CrossRef]
  27. Conte, L.C.; Débora, M.B.; Fábio, M.B. Bootstrap Pettitt test for detecting change points in hydroclimatological data: Case study of Itaipu Hydroelectric Plant, Brazil. Hydrolog. Sci. J. 2019, 64, 1312–1326. [Google Scholar] [CrossRef]
  28. Villarini, G.; Smith, J.A. Flood peak distributions for the eastern United States. Water Resour. Res. 2010, 46, 1–17. [Google Scholar] [CrossRef] [Green Version]
  29. Wang, W.; Shao, Q.; Yang, T.; Peng, S.; Xing, W.; Sun, F.; Luo, Y. Quantitative assessment of the impact of climate variability and human activities on runoff changes: A case study in four catchments of the Haihe River basin, China. Hydrol. Process. 2013, 27, 1158–1174. [Google Scholar] [CrossRef]
  30. Suhaila, J.; Yusop, Z. Trend analysis and change point detection of annual and seasonal temperature series in Peninsular Malaysia. Meteorol. Atmos. Phys. 2017, 130, 565–581. [Google Scholar] [CrossRef]
  31. Alexander, L.V.; Zhang, X.; Peterson, T.C.; Caesar, J.; Gleason, B.; Klein Tank, A.M.G.; Haylock, M.; Collins, D.; Trewin, B.; Rahimzadeh, F. Global observed changes in daily climate extremes of temperature and precipitation. J. Geophys. Res. Atmos. 2006, 111, 1–22. [Google Scholar] [CrossRef] [Green Version]
  32. Liang, K.; Bai, P.; Li, J.J.; Liu, C. Variability of temperature extremes in the Yellow River basin during 1961–2011. Quat. Int. 2014, 336, 52–64. [Google Scholar] [CrossRef]
  33. Klaus, S.; Christian, D.; Matthias, H.; Stötter, J. Assessing potential climate change impacts on the seasonality of runoff in an Alpine watershed. J. Water Clim. Chang. 2015, 6, 263–277. [Google Scholar] [CrossRef]
  34. Wang, L.; Liu, H.L.; Bao, A.M.; Pan, X.L.; Chen, X. Estimating the sensitivity of runoff to climate change in an alpine-valley watershed of Xinjiang, China. Hydrol. Sci. J. 2016, 61, 1069–1079. [Google Scholar] [CrossRef] [Green Version]
  35. Walling, D.E.; Fang, D. Recent trends in the suspended sediment loads of the world’s rivers. Glob. Planet. Chang. 2003, 39, 111–126. [Google Scholar] [CrossRef]
  36. Vorosmarty, C.J.; Green, P.; Salisbury, J.; Lammers, R.B. Global water resources: Vulnerability from climate change and population growth. Science 2000, 289, 284–288. [Google Scholar] [CrossRef] [Green Version]
  37. Carlson, T.N.; Arthur, S.T. The impact of land use-land cover changes due to urbanization on surface microclimate and hydrology: A satellite perspective. Glob. Planet. Chang. 2000, 25, 49–65. [Google Scholar] [CrossRef]
  38. Ervinia, A.; Huang, J.; Zhang, Z. Land-use changes reinforce the impacts of climate change on annual runoff dynamics in a southeast China coastal watershed. Hydrol. Earth Syst. Sci. 2015, 12, 6305–6325. [Google Scholar] [CrossRef]
  39. Dao, N.K.; Tadashi, S. Impact of climate and land-use changes on hydrological processes and sediment yield-A case study of the Be River catchment, Vietnam. Hydrol. Sci. J. 2014, 59, 1095–1108. [Google Scholar] [CrossRef]
  40. Apollonio, C.; Balacco, G.; Novelli, A.; Tarantino, E.; Piccinni, A.F. Land Use Change Impact on Flooding Areas: The Case Study of Cervaro Basin (Italy). Sustainability 2016, 8, 996. [Google Scholar] [CrossRef] [Green Version]
  41. Bussi, G.; Dadson, S.J.; Prudhomme, C.; Whitehead, P.G. Modelling the future impacts of climate and land-use change on suspended sediment transport in the River Thames (UK). J. Hydrol. 2016, 542, 357–372. [Google Scholar] [CrossRef] [Green Version]
  42. Cao, Z.; Duan, H.; Feng, L.; Ma, R.; Xue, K. Climate- and human-induced changes in suspended particulate matter over Lake Hongze on short and long timescales. Remote Sens. Environ. 2017, 192, 98–113. [Google Scholar] [CrossRef]
  43. Xing, L.; Huang, L.; Chi, G.; Yang, L.; Li, C.; Hou, X. A Dynamic Study of a Karst Spring Based on Wavelet Analysis and the Mann-Kendall Trend Test. Water 2018, 10, 698. [Google Scholar] [CrossRef] [Green Version]
  44. Li, W.W.; Fu, X.D.; Wu, W.Q.; Wu, B.S. Study on runoff and sediment process variation in the lower Yellow River. J. Hydroelectr. Eng. 2014, 33, 108–113. [Google Scholar]
  45. Labat, D. Recent advances in wavelet analyses: Part 1. A review of concepts. J. Hydrol. 2008, 314, 275–288. [Google Scholar] [CrossRef]
  46. Kovács, J.; Hatvani, I.G.; Korponai, J.; Kovács, I.S. Morlet wavelet and autocorrelation analysis of long-term data series of the Kis-Balaton water protection system (KBWPS). Ecol. Eng. 2010, 36, 1469–1477. [Google Scholar] [CrossRef]
  47. Hermida, L.; López, L.; Merino, A.; Berthet, C.; Gercía-Ortega, E.; Sánchez, J.L.; Dessens, J. Hailfall in southwest France: Relationship with precipitation, trends and wavelet analysis. Atmos. Res. 2015, 156, 174–188. [Google Scholar] [CrossRef]
  48. Oloruntade, A.J.; Mohammad, T.A.; Ghazali, A.H.; Wayayok, A. Analysis of meteorological and hydrological droughts in the Niger-South Basin, Nigeria. Glob. Planet. Chang. 2017, 155, 225–233. [Google Scholar] [CrossRef]
  49. Guignard, F.; Mauree, D.; Kanevski, M.; Telesca, L. Wavelet variance scale-dependence as a dynamics discriminating tool in high-frequency urban wind speed time series. Phys. A Stat. Mech. Its Appl. 2019, 525, 771–777. [Google Scholar] [CrossRef] [Green Version]
  50. Sun, P.; Sun, Y.Y.; Zhang, Q.; Wen, Q.Z. Temporal and spatial variation characteristics of runoff processes and its causes in Huaihe Basin. J. Lake Sci. 2018, 30, 497–508. [Google Scholar] [CrossRef] [Green Version]
  51. Mario, V.S.; Le, B.Y.; Moussa, R.; Bruno, R. Temporal dynamics of runoff and soil loss on a plot scale under a coffee plantation on steep soil (Ultisol), Costa Rica. J. Hydrol. 2015, 523, 409–426. [Google Scholar] [CrossRef]
  52. Jiang, Y.; Peng, Q.D.; Luo, H.H.; Ma, W. Analysis of spatial and temporal variation of water quality in Huaihe River Basin. J. Hydraul. Eng. 2011, 42, 1283–1288. [Google Scholar] [CrossRef]
  53. Cai, T.; Li, Q.F.; Yu, M.X.; Lu, G.B.; Cheng, L.P.; Wei, X. Investigation into the impacts of land-use change on sediment yield characteristics in the upper Huaihe River basin, China. Phys. Chem. Earth 2012, 53, 1–9. [Google Scholar] [CrossRef]
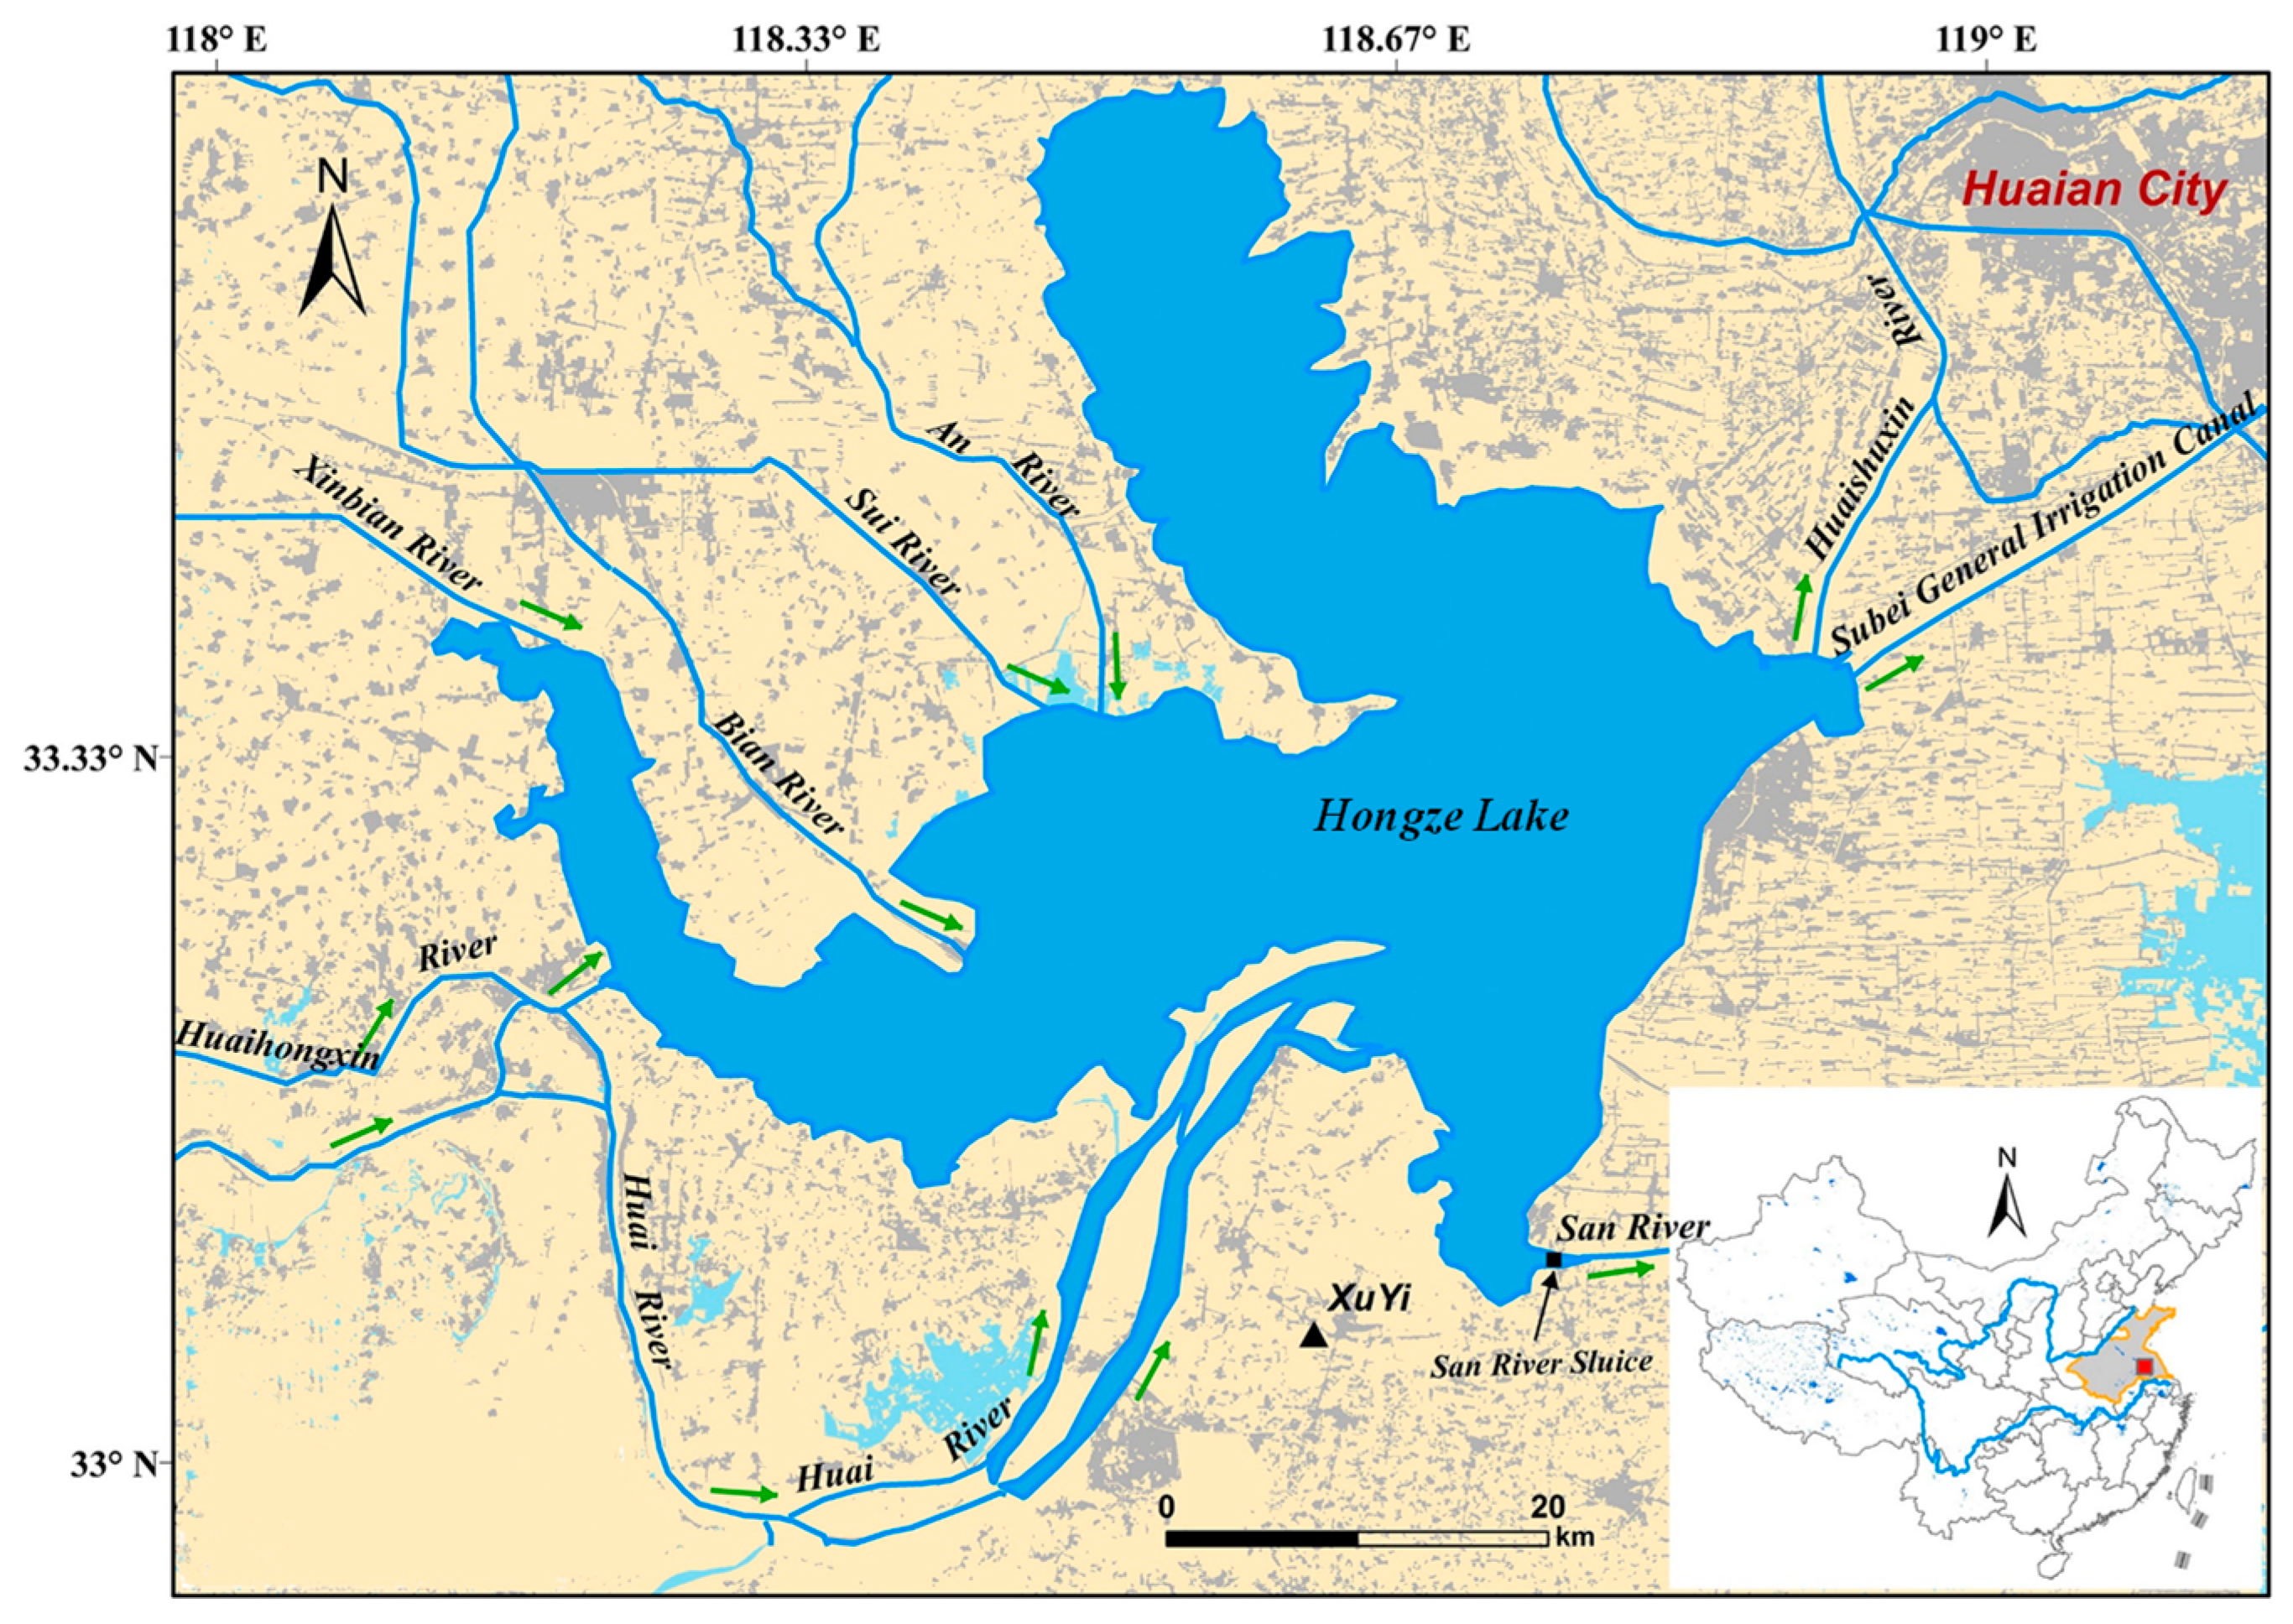
Figure 1. Hongze Lake water system map.
Water 12 00999 g001
Figure 2. The runoff and sediment time series flowing into and out of Hongze Lake from 1975 to 2015. (a) Runoff time series; (b) Sediment time series.
Water 12 00999 g002
Figure 3. Results of M–K statistics series. (a) Runoff M–K statistics series; (b) Sediment M–K statistics series.
Water 12 00999 g003
Figure 4. Inflow sediment time series combinatorial mutation test. (a) M–K test; (b) First order change point identification; (c) Second order change point identification (1975–1991); (d) Second order change point identification (1991–2015). Where, UF and UB are the statistics, T is the year, P is the significance probability.
Water 12 00999 g004
Figure 5. Outflow sediment time series combinatorial mutation test. (a) M–K test; (b) First order change point identification; (c) Second order change point identification (1975–1991); (d) Second order change point identification (1991–2015).
Water 12 00999 g005
Figure 6. Inflow runoff and sediment anomaly series of wavelet coefficient contour map. (a) Real part contour map of runoff; (b) Real part contour map of sediment; (c) Modular square contour map of runoff; (d) Modular square contour map of sediment. Where, a is the time scale.
Water 12 00999 g006
Figure 7. Wavelet variance diagram of runoff and sediment anomaly series. (a) Runoff wavelet variance; (b) Sediment wavelet variance.
Water 12 00999 g007
Figure 8. Real part variation process of annual runoff anomaly series wavelet coefficients. (a) Time scale of 30 a ; (b) Time scale of 11 a ; (c) Time scale of 6 a ; (d) Time scale of 4 a .
Water 12 00999 g008aWater 12 00999 g008b
Figure 9. Real part variation process of annual sediment anomaly series wavelet coefficients. (a) Time scale of 30 a ; (b) Time scale of 12 a ; (c) Time scale of 7 a ; (d) Time scale of 3 a .
Water 12 00999 g009
Figure 10. Rainfall and inflow runoff variation process. (a) Hydrologic time series; (b) M–K statistic analysis.
Water 12 00999 g010
Figure 11. The relationship between sediment flowing into and out of Hongze Lake and the total volume of the upstream reservoir.
Water 12 00999 g011
Table 1. The runoff and sediment (Mann-Kendall) M–K statistic of flowing into and out of Hongze Lake.
M–K testInflow
Runoff
Outflow RunoffInflow SedimentOutflow Sediment
Statistic−0.98−0.60−1.83−2.53
Inspection criterion−1.96 ≤ Z ≤ 1.96−1.96 ≤Z ≤ 1.96−1.96 ≤ Z ≤ 1.96−1.96 ≤ Z ≤ 1.96
Significance levelNo significant downtrendNo significant downtrendSlightly
downtrend
Significantly downtrend
Table 2. Mutation analysis of sediment time series of inflow and outflow.
SedimentChange PointFormer MutationAfter MutationMean Difference/t
YearSignificantMean/tStandard Deviation/tCoefficient of VariationMean/tStandard Deviation/tCoefficient of Variation
Inflow19910.058605460.644424060.92418
Outflow19910.054673210.692051870.91262
Table 3. Analysis results of runoff time series different characteristic time scales.
Time ScaleVariation Period
/Year
Cycle TimesRunoff Variation Trend after 2015
30 a 202Maintain in a low water period and will reach the valley floor valueFigure 8a
11 a 85Enter into a relatively rich water periodFigure 8b
6 a 410Enter into a relatively rich water periodFigure 8c
4 a The distribution characteristics are not obviousFigure 8d
Note: a is the time scale.
Table 4. Analysis results of sediment time series different characteristic time scales.
Time ScaleVariation Period/YearCycle TimesSediment Variation Trend after 2015
30 a 202Maintain in a low sediment period and will reach the valley floor valueFigure 9a
12 a 85Enter into a relatively rich sediment periodFigure 9b
7 a The distribution characteristics are not obviousFigure 9c
3 a The distribution characteristics are not obviousFigure 9d