Article

Study on the Transport of Terrestrial Dissolved Substances in the Pearl River Estuary Using Passive Tracers

1
School of Civil and Transportation Engineering, South China University of Technology, Wushan Rd., Tianhe District, Guangzhou 510641, China
2
Southern Laboratory of Ocean Science and Engineering (Guangdong, Zhuhai), Zhuhai, 519000, China
3
Institute of Deep-sea Science and Engineering, Chinese Academy of Sciences, Luhuitou Rd., Sanya 572000, China
4
State Key Laboratory of Tropical Oceanography, South China Sea Institute of Oceanology, Chinese Academy of Science, Guangzhou 510301, China
*
Authors to whom correspondence should be addressed.
Water 2020, 12(5), 1235; https://doi.org/10.3390/w12051235
Submission received: 12 November 2019 / Revised: 14 April 2020 / Accepted: 23 April 2020 / Published: 26 April 2020

Abstract

:
Highly populated river deltas are experiencing marine environment degradation resulting from the tremendous input of terrestrial dissolved substances (TeDS). The Pearl River Delta is one of the deltas with degradation of the water quality and ecological condition. The Pearl River Estuary (PRE) was investigated to reveal the fate and transport timescales of TeDS in order to provide guidance on water resource management and pollutant transport prediction. By using passive tracers in a calibrated 3D numerical model, the TeDS transports from five different outlet groups were investigated systematically. The TeDS transport time was computed by using the concept of water age, which is a measure of the time that has elapsed since the tracer was transported from the upstream boundary to the downstream concerned area. The tracer impacted area was defined by the area with tracer concentrations > 0.2 (arbitrary unit). The domains that were impacted by the tracer coming from each outlet group were identified separately. In the wet season, the impacted area was larger than in other seasons. The most prominent variations appeared in the Jiaomen–Hengmen–Hongqili (JHH) and Modaomen (MD) outlets. The hydrodynamic conditions controlled the offshore spreading of the TeDS. Assuming the TeDS were conservative, it took approximately 10–20 days for the TeDS to be transported from the head water to the entrance of the outlet. For the TeDS coming from the head water of the Humen outlet, it took approximately 40 (80) days for the TeDS to be transported out of the mouth of the Lingding Bay during the wet (dry) season. For the case of the TeDS coming from the head water of the JHH outlets, it took approximately 20 (40) days for the TeDS to be transported out of the Lingding Bay during the wet (dry) season. For the MD, Jiti and Yamen–Hutiao outlets, it usually took approximately 10 days for the TeDS to be transported from the head water to the inner shelf. The correlation coefficient between the river flow and tracer concentrations was 0.78, and between the river flow and transport time it was −0.70 at a station in the lower Lingding Bay. At the estuary mouth, the impacts of other forcing fields got stronger.

1. Introduction

In recent decades, a number of studies have shown evidence of coastal marine environment degradation resulting from tremendous inputs of terrestrial dissolved substances (TeDS), which include pollutants, nutrients, organic matter, etc. [1,2,3,4]. In developing countries, 80% of domestic sewage is discharged into rivers, lakes and oceans without any treatment [5]. A growing number of anthropogenic activities create more environmental pressures on river deltas compared to other regions [6,7]. Understanding the fate and transport dynamics of TeDS in river deltas is especially urgent in dealing with coastal marine pollution and eutrophication and making efficient policies to alleviate the impact of human activities.
The transport of water and dissolved substances in an estuary is influenced by numerous factors, such as river discharge, tides, winds, bottom topography, the Coriolis effect, etc. It is usually difficult to track TeDS coming from different source regions, since hydrodynamic processes usually result in a mixture of them. Meanwhile, it is also challenging to estimate the transport timescales of TeDS, because the calculation of spatially and temporally varied TeDS transport times is not straightforward when using traditional data like velocity, salinity or nutrient concentration. However, accurately mapping the fate and transport timescales of these biogeochemical substances is essential to both oceanographic research and environmental management. Using artificial tracers in numerical modeling is one of the feasible methods that can be used to adequately quantify the transport of TeDS in complicated coastal marine environments.
The advantages of using artificial tracers in marine environments have been demonstrated in several previous studies. For example, Du and Shen [8] used passive tracers (dye) to understand the influence of estuarine circulation on the redistribution of riverine materials from different sources. Hirst [9] examined the penetration and fate of North Atlantic deep water in a global ocean model. Delhez and Deleersnijder [10] simulated the advection–dispersion of tracers discharged at the nuclear fuel reprocessing plant of Cap de La Hague and demonstrated the advantages of the method in the description of temporal variations of the mean age. Both particle trajectories and passive tracers were used in a three-dimensional circulation model by Döös and Engqvist [11] to estimate the potential fate and distribution of radio-nuclides released in the coastal region of the Baltic Sea. Hong et al. [12] used passive tracers to investigate the water exchange between Baltimore Harbor and Chesapeake Bay. Additionally, transport times are frequently used to diagnose circulation and mixing in estuaries and the ventilation rates of lakes, estuaries and ocean basins. Shen and Haas [13] used a three-dimensional numerical model to calculate the age distribution for the substances released from the head waters of the York River Estuary under different hydrodynamic conditions. Through age tracer modeling, Gustafsson and Bendtsen [14] quantified the timescales of downward (upward) mixing of surface (bottom) water in a shallow fjord. Hong and Shen [15] also used passive tracer transport timescales to estimate the sea-level rise effect on the gravitational circulation of Chesapeake Bay. The vertical transport timescale was used as an index to estimate bottom water dissolved oxygen replenishment in Chesapeake Bay by Hong and Shen [16]. Karna and Baptista [17] applied the concept of water age to investigate water renewal timescales in the Columbia River Estuary. A recent study by Du et al. [18] used passive particles to study the fate and retention of pollutants in Galveston Bay. They used a new transport timescale, called the local exposure time, to quantify the spatially varying susceptibility to released pollutants.
In recent decades, concerns about the fate and transport timescales of TeDS have risen in highly populated river delta areas. Being an estuary with complex river networks and profound anthropogenic impacts, the Pearl River Estuary (PRE) is a good candidate to investigate TeDS transport processes. The PRE is a large and productive estuary located in the Guangdong–Hong Kong–Macao Greater Bay Area of southern China (Figure 1). The PRE has eight outlets (Humen, Jiaomen, Hongqili, Hengmen, Modaomen, Jitimen, Hutiaomen and Yamen) and several bays and sub-estuaries (Lingding Bay, Modaomen estuary, Jitimen estuary, Huangmao Bay, and Shenzhen Bay). The Lingding Bay is the largest bay in the PRE. The water body of the PRE receives a high load of anthropogenic organic pollutants from increased industry, agricultural activities, fish dike farming and sewage effluents [19,20,21]. The degradation of the water quality and ecological condition of the PRE has been frequently reported [21,22,23,24]. Data released by the 2016 Guangdong Marine Environment Bulletin indicated that the total mass of pollutants released into the Pearl River in 2016 was 2.03 × 10⁶ tons, which includes chemical oxygen at 1.52 × 10⁶ tons, ammonia at 2.82 × 10⁴ tons, nitrate at 4.12 × 10⁵ tons, nitrite nitrogen at 2.74 × 10⁴ tons and total phosphorus at 2.40 × 10⁴ tons. Because of the large number of rivers and streams and frequent precipitations events in the Pearl River Delta (PRD), surface runoff is a major source of contaminants and nutrient loads in the adjacent coastal water. Large amounts of wastes and nutrients are continuously generated throughout the PRD, resulting in a substantial increase in the number of contamination sources and a deterioration of water quality and ecological conditions in the PRE.
To date, the fate and transport timescales of TeDS in the PRE have not been fully investigated. With a drainage area of approximately 4.5 × 10⁵ km2, the Pearl River discharges both freshwater and TeDS into the continental shelf of the northern South China Sea (SCS) through eight outlets (Figure 1c). It is usually difficult to isolate pollutants coming from the different outlets of the PRE. Once the TeDS have entered an outlet, how to locate their impacted area? This type of information, however, would help to identify the dominant sources of pollutants in the inner shelf. Additionally, once the pollution event has happened in the upstream, how long will it take for pollutants to be transported into the concerned area and what are their major pathways? To answer these questions, a systematic assessment of TeDS transport processes in response to various hydrodynamic conditions is required. In this study, a three-dimensional hydrodynamic model with a passive tracer transport module was applied to investigate the transport processes of TeDS under realistic hydrodynamic conditions in the PRE. By using passive tracers, both the temporal and spatial variations of TeDS and their corresponding transport timescales could be calculated within assumptions. The transport of TeDS can be modulated by both physical and biochemical processes that vary over time scales ranging from minutes to decades. The physical and biochemical processes are tightly coupled. However, several previous studies have indicated that the contributions of physical processes are especially important in controlling the transport of nutrients and pollutants, and that a complete understanding of the physical processes is essential to quantify the impact of biochemical processes on estuarine systems [16,25,26]. To isolate the biochemical processes from the physical processes in the PRE, the biochemical processes were excluded from the three-dimensional numerical model and the TeDS were simulated by passive tracers only. This was an efficient way to evaluate the modulation of physical processes on the fate and transport timescales of the TeDS. Detailed information on the TeDS simulation can be found in Section 2. The findings of this study will provide important information and function as a scientific reference for the management of water resources and marine environment protection in the Guangdong–Hong Kong–Macao Greater Bay Area.
The paper is organized as follows. Section 2 describes the model configuration and strategy of modeling the tracer transport processes to understand the transport of TeDS. Section 3 presents the results. Discussion and conclusions are presented in Section 4 and Section 5, respectively.

2. Materials and Methods

2.1. Numerical Model Description

The three-dimensional Hydrodynamic-Eutrophication Model (HEM-3D) developed by the Virginia Institute of Marine Science was used for this study. The hydrodynamic portion of the HEM-3D model is the Environmental Fluid Dynamics Code (EFDC) [27]. It uses boundary-fitted curvilinear grids in the horizontal and sigma grids in the vertical. This model has been successfully applied in Chesapeake Bay [8,15], estuaries in Virginia, USA [13,28,29], and the PRE [30]. In its application in the PRE, the model was fully calibrated for tides, salinity and current velocity against all available observations [30]. The same model configurations and external forcing fields were used in this study. As shown in Figure 2, the model domain covered the entire PRE and the adjacent upstream river network. The horizontal resolution of the model grids ranged from approximately 40 m inside the PRE to approximately 1000 m in the shelf area. The open boundary was extended far from the PRE mouth to exclude potential numerical noise from the open boundary conditions. The radiation open boundary condition was used at the open ocean boundary. There were 20 vertical sigma layers with high resolutions near the surface and bottom layers, respectively. The model was initialized by interpolating the cruise-observed winter-time salinity and temperature profiles to the model grids. The red dots in Figure 2 mark the locations where the upstream river flow entered the model domain. These open boundaries were located in an area with crisscrossed water channels. Because no long-term data were available to directly specify the open boundary conditions in these crisscrossed water channels, both the daily river discharge data observed at stations in the major tributaries of the Pearl River (blue dots in Figure 2, data obtained from the Pearl River Information Center of Water Resources of PR China) and the ratios of freshwater distribution among the eight outlets [31,32] were used to determine the distribution of river discharge in each water channel. More detailed information about the model configuration can be found in Hong et al. [30].

2.2. Strategy for Modeling the Transport of Terrestrial Dissolved Substances

The Pearl River is the second largest river in China. The total river discharge reaches a maximum in summer (~2.1 × 10⁴ m3 s−1) and a minimum in winter (~3.4 × 10³ m3 s−1) [33]. From the hydrological perspective, pollutants and nutrients from the Pearl River basin are transported to the PRE and finally enter the open shelf of the northern SCS. TeDS from the Pearl River basin are transported to the estuary through eight outlets (marked in Figure 1c). According to their geographic locations, these outlets can be divided into five groups, i.e., the Humen (HM) outlet, the Jiaomen–Hengmen–Hongqili (JHH) outlets, the Modaomen (MD) outlet, the Jiti (JT) outlet, and the Yamen–Hutiao (YH) outlets. The transport of TeDS from upstream to the open sea was simulated by the numerical model, with passive tracers entering the domain through upstream open boundaries. The locations where the upstream river flow entered the model domain (red dots, Figure 2) were also where the passive tracers were released. For a specific outlet group, the TeDS were simulated by the model run, with passive tracers entering the domain from the corresponding river inflow spots that entered a given outlet group. In each case, the tracers came from different outlet groups, but the hydrodynamic conditions were identical. The model was run from 2006 to 2007, and only the results from 2007 were used for analyses in order to exclude the impact of the model spin-up. There are two aspects that must be addressed in the monitoring of TeDS transport. One is the amount of TeDS, which was represented in a simplified way by the tracer concentration. The other is the TeDS transport timescale, which was calculated using the concept of water age. The age of a particle of water constituent was defined as the time elapsed since the particle under consideration left the region in which its age was prescribed to be zero [34,35]. Besides the water age, the flushing time and residence time are the two other fundamental concepts of transport time [36,37,38,39]. The flushing time is usually regarded as a bulk or integrative property that describes the overall exchange or renewal capability of a water body [40,41]. The flushing time can be used to estimate the overall flushing capability of a water body and it establishes the time scale for the physical transport of river-borne material [42]. The residence time of a water parcel is defined as the time needed for the water parcel to reach the outlet [43]. The residence time is usually used to measure the time that a water parcel remains in a waterbody [36]. The residence time is not suitable for measuring the timescales of a water parcel that was transported from the upstream head point to the downstream concerned area. In our case, the water ages were computed as a measure of the time that had elapsed since the TeDS were transported from the upstream open boundary to the downstream concerned area. Using the water age allowed us to show the spatial and temporal variations of TeDS transport time in the PRE.
The movement of the TeDS was traced by artificial passive tracers governed by the following equation [10,34]:
c / t + V · c · ( K · c ) = 0
Here, c is the tracer concentration, V is the velocity vector, K is the diffusivity tensor, = i / x + j / y + k / k and t is time. There was no sinking of the tracer within the study area. According to Deleersnijder et al. [34] and Delhez et al. [35], the evolution of age concentration ( α ( t , x , y , z ) ) is described as
α / t + V · α · ( K · α ) = c
The transport time (water age) can be calculated as τ = α / c . At the upstream boundary where the tracer entered the computation domain, the tracer concentration was prescribed as 1 (arbitrary unit) and the water age was prescribed as 0 (days) in each model layer. When the tracer concentration in the downstream estuary was 0.5, it meant that at this location the tracer concentration was 50% of the concentration measured at the upstream boundary. The river discharge was converted to velocity and used as the normal velocity at the upstream boundary.
Unlike other estuaries with a single river discharge spot from the head, the PRE has a very complicated river network and several river discharge spots (see red dots in Figure 2). When simulating the TeDS transport time (water age), the tracers were released from the upstream boundary of each outlet group. Different outlet groups were calculated separately. Although there was more than one release spot per outlet group, these spots were regarded as one unit that brought TeDS to this outlet group. It should be noted that the tracer concentrations and transport times from the model results represented the spatial and temporal distributions of a single nutrient or contaminant, not the mixture of different nutrients or different contaminants. However, for different nutrients or contaminants, the concentration distribution in the estuary depended on the total loading at the release spots of a given outlet group (regarded as a unity, tracer concentration = 1). A more precise method would be to investigate each release spot separately. However, for the crisscrossed river network of the PRE, dividing these spots into five outlet groups was a more efficient method to conduct a systematic assessment. Our results indicated that the water age difference within the head water of a given outlet group was minor. Our strategy was therefore feasible and efficient for investigating the transport timescales of TeDS coming from different outlets.
The artificial passive tracers defined here represented a generic constituent with boundary concentrations specified to be 1 and kept constant with time. The boundary tracer concentration could be taken to represent the normalized TeDS concentration, which was normalized by the incoming TeDS concentration at the river boundary. The simulated tracer concentrations could be used to quantify the redistribution of TeDS in the PRE. The five outlet groups divided the sources into five groups by location. Many real TeDS undergo transformations and are accompanied by other source/sink processes along their journey from the river head to the open sea. As biogeochemical processes were not included in this model, the high tracer concentrations meant only potentially high TeDS concentrations in the estuary. The transport time (water age) defined here represented the time elapsed since the dissolved substances entered the domain through the upstream boundary. Because the modeling all of the relevant TeDS transport processes was not feasible, we chose to model the tracer behavior to provide diagnostic information relevant to the transport of TeDS under the impact of physical forcing. Reliance on generic tracers and their associated diagnostics is now standard practice in similar studies (e.g., Shen and Hass [13]; Kärnä and Baptista [17]; deBrye et al. [44]; Li et al. [45]).
The spatial and temporal variations of the tracer concentrations and transport times were used in the following to quantify the transport of TeDS in the PRE under realistic hydrodynamic conditions. The advantage of this method was that the results could be used to index any kind of dissolved substances coming from upstream, including pollutants or nutrients. Once they entered the aquatic system, the tracers tracked their pathway and revealed their responses to physical processes in the calibrated 3D numerical model. The spatial–temporal variations of the tracer concentrations provided a clear map of the TeDS concentration variations controlled by the physical forcing fields. Although biochemical processes were excluded from our model, the results are still very instructive for water resource management and pollutant transport prediction.

3. Results

3.1. Distribution of Terrestrial Dissolved Substances Coming from Different Outlets

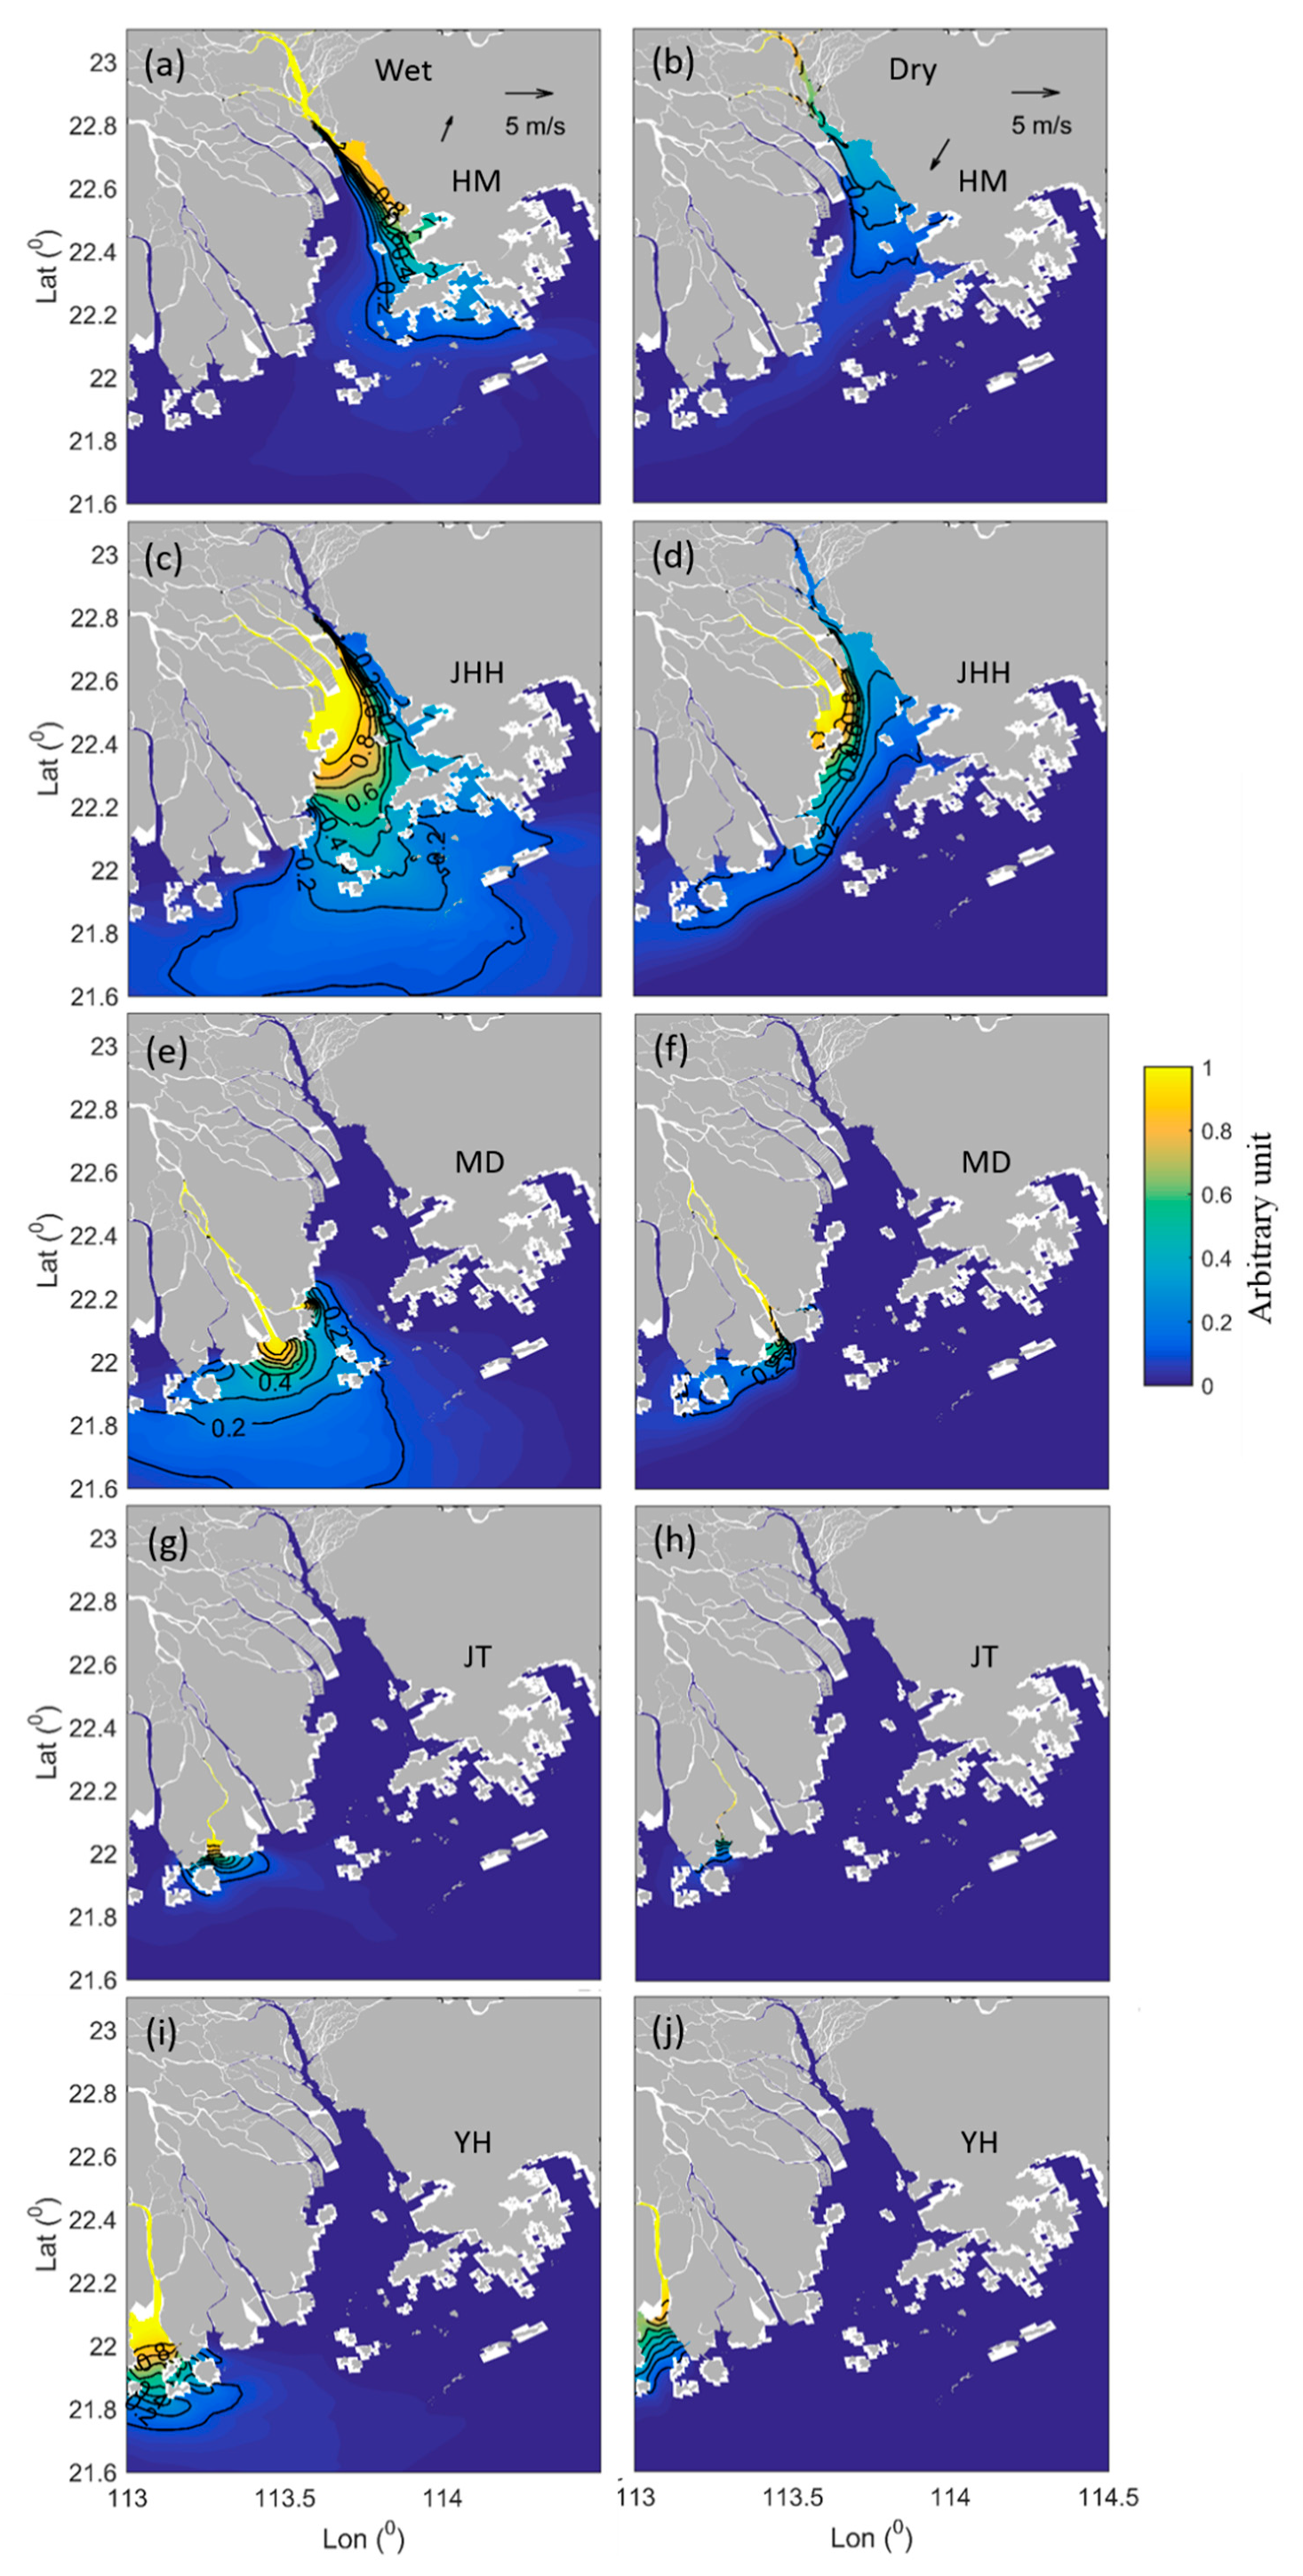
Analyses of the transport of TeDS coming from different outlets were conducted first to identify areas that could be influenced by the TeDS from each outlet. Because the monthly mean river discharge in 2007 was slightly lower than the long-term mean data (Figure 3), the hydrodynamic conditions in 2007 can be regarded as a normal year versus a typical wet or dry year. The monthly mean results in January and June were selected to represent the typical dry and wet season, respectively. The TeDS were simulated by tracers released from different outlet groups under identical hydrodynamic conditions. The tracer concentrations during the typical wet and dry seasons are shown in Figure 4. Obvious seasonal variations can be clearly identified. High concentrations of tracers appeared during the wet season and occupied a much larger area than during the dry season. The high tracer concentrations indicated potentially high TeDS concentrations in the PRE.
It can be discerned from the tracer distribution (Figure 4) that TeDS coming from the head water of the HM outlet mainly impact the Humen channel and the upper eastern portion of the PRE. Even during the wet season, the tracer mainly lingered along the eastern coast of the Lingding Bay. TeDS coming from the head water of the JHH outlets potentially have the largest impact area among all of the outlet groups. These tracers occupied a large portion of the Lingding Bay. More importantly, TeDS from the JHH outlets have a potentially strong impact on the inner shelf. These TeDS can be transported southeastward toward the open sea during the wet season and westward along the coastline during the dry season. At Shenzhen Bay and in the area around Hong Kong Island, both the HM and JHH outlets are potentially important sources of TeDS. The MD outlet provides an important potential source of TeDS to the coastal area, especially during the wet season, as at that time large amounts of tracer were injected toward the shelf and spread southeastward to the open sea. TeDS from the JT and YH outlets are expected to have limited impacts and mainly remain in the area close to the mouth of the outlets.
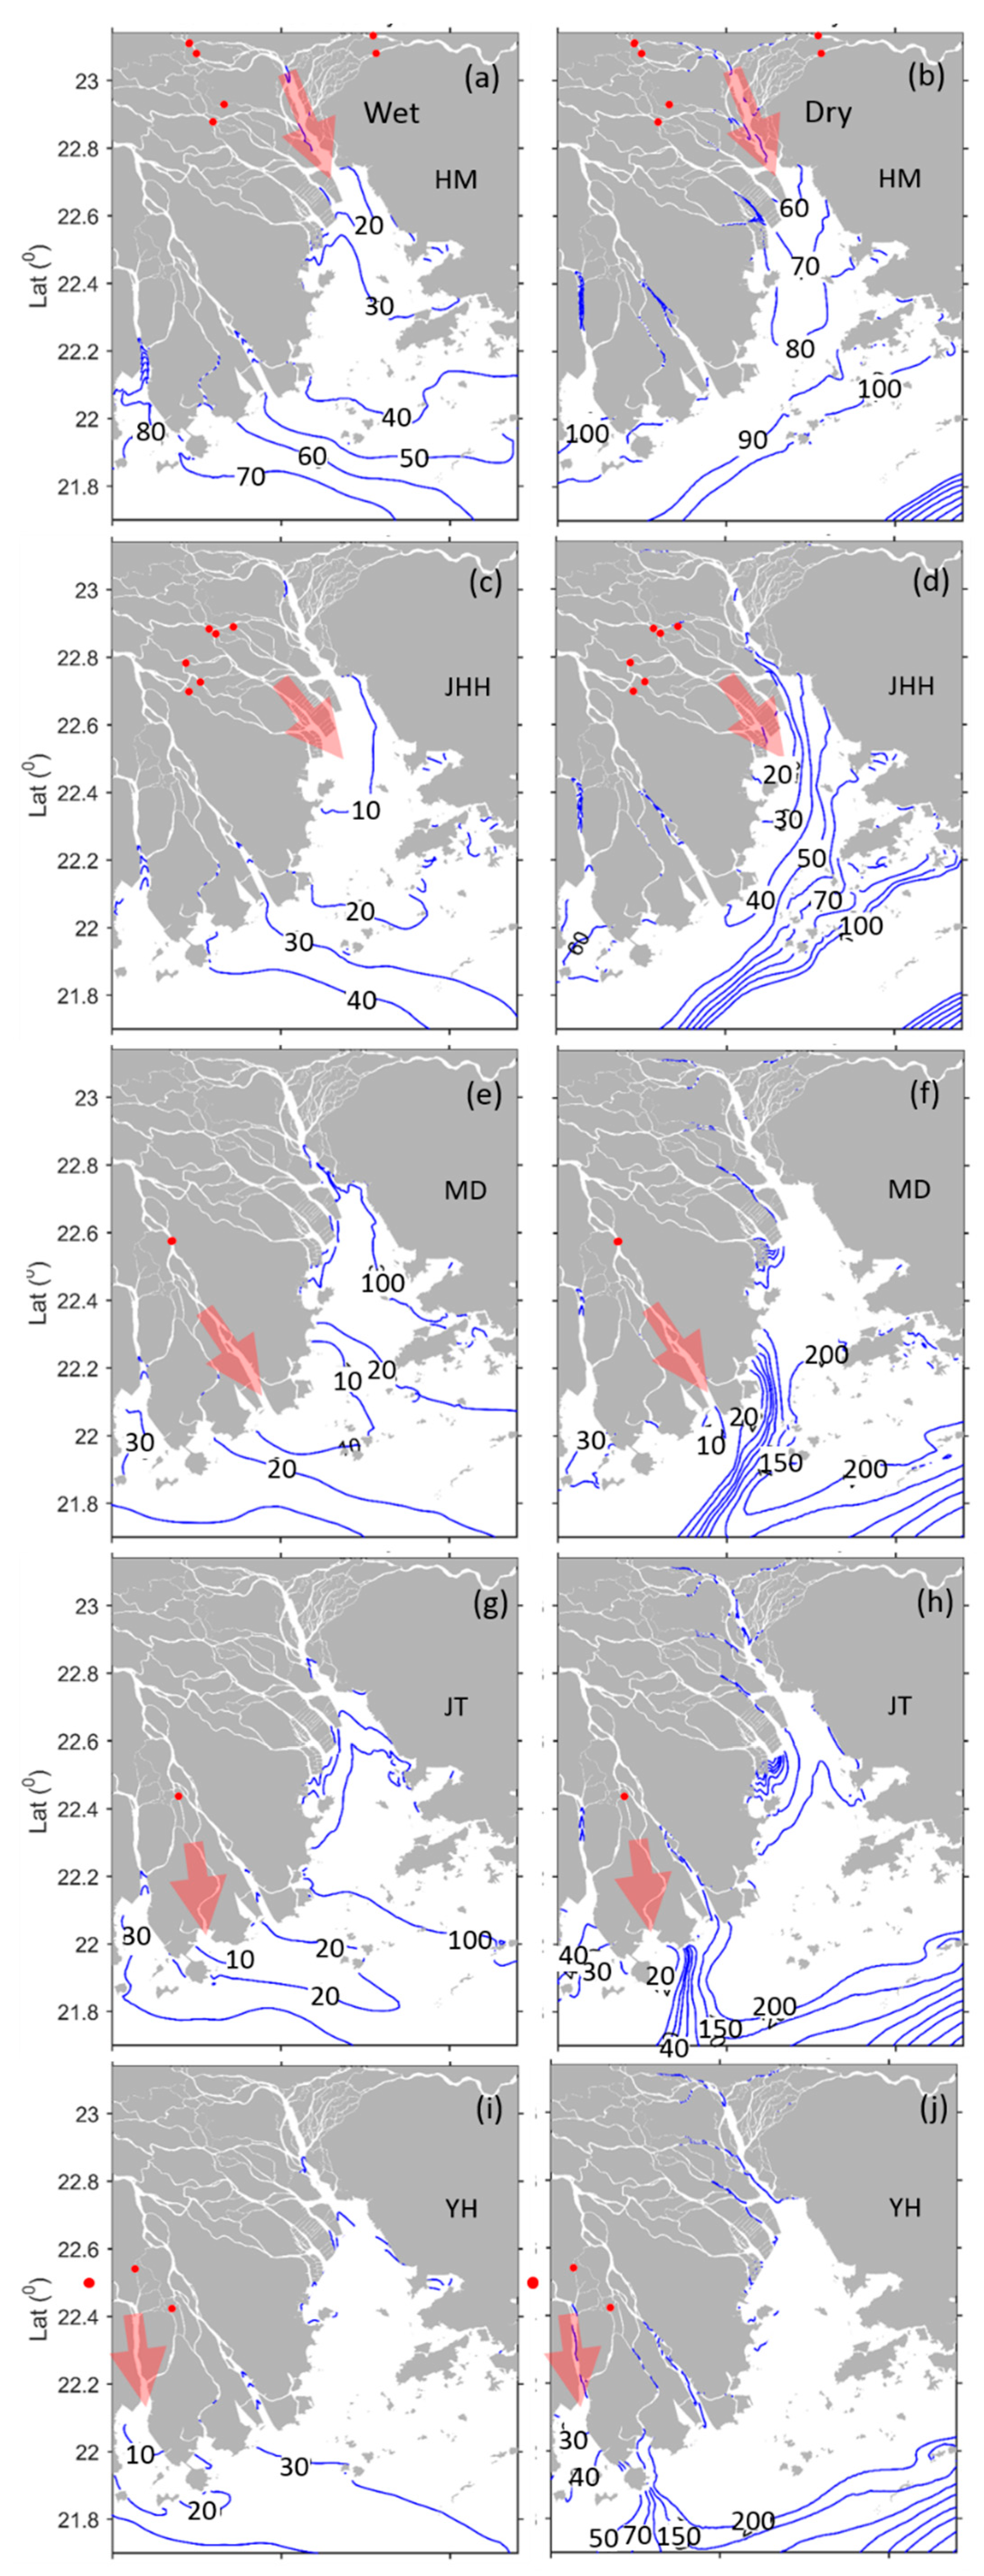
To clarify the domains that can be influenced by each outlet, we calculated the total percentage of time that the tracer concentrations were greater than 0.2 (arbitrary unit) in a year. It could be expected that the direct influence of each outlet group disappeared in areas when the percentage was zero, while the major influenced spots could be identified as those with a high percentage. The results (Figure 5) revealed that the influence of the HM outlet only dominated in the upper eastern part of the Lingding Bay, as the lower bay experienced tracer concentrations greater than 0.2 (arbitrary unit) only 20%–30% of the time during one year. For tracers coming from the JHH outlets, the major influenced area (with a percentage greater than 60%) covered a significant portion of the Lingding Bay. This indicates that high concentrations of TeDS could be observed very frequently in this area. In the coastal area adjacent to the PRE mouth, the percentage was around 40%. The westward and southeastward transport showed relatively higher percentages than other directions did. The MD outlet resulted in a high percentage along the coastline. This indicates that the impacts of TeDS decrease toward the offshore regions. The percentages of westward and southeastward tracer transport were relatively higher than that in other directions. The JT and YH outlet groups had a limited impact, with significant seaward spreading occurring less than 10% of the time during one year.

3.2. Transport Time of Terrestrial Dissolved Substances from Each Outlet

The transport time (water age) of the tracers coming from the head waters of each outlet group could be calculated (Figure 6). The spots for tracers entering the domain in each case are marked by red dots, which are part of the river inflow spots shown in Figure 2. Significant spatial variations can be observed. For the case of tracers coming from the head waters of the HM outlet during the wet season (Figure 6a), it took approximately 20 days for the tracers to be transported from the head waters to the entrance of the outlet, and approximately 40 days from the head waters to the mouth of Lingding Bay. During the dry season (Figure 6b), such transport will take approximately 60 days and 80 days, respectively. During the dry season, transport requires a long time in the HM channel, which means that the TeDS will move slowly from the head waters to the entrance of the HM outlet. This indicates that the TeDS could stay in the channel for a long time. Previous studies indicated that low dissolved oxygen levels (reaching the threshold of hypoxia) can be observed all year in the upper reaches of the PRE, extending from the Guangzhou Channel to downstream of the HM outlet [19,46], which is consistent with our results showing a long transport time of tracer in this area. Our numerical model experiments indicated that the downstream water age differences between the individual spot release locations in the model run were minor. Therefore, although there are six tracer releasing spots for the HM outlet in our calculations, they can be regarded as one unit.
In the case of the tracers released from the head waters of the JHH outlets, it took less than 10 days to reach the outlet entrance and about 20 days to reach the Lingding Bay mouth during the wet season, and approximately 20 and 40 days to reach the outlet entrance and Lingding Bay mouth, respectively, during the dry season. This indicates that the seaward transport of TeDS from the JHH outlets is faster than their transport from the HM outlet. It is interesting that the dry season hydrodynamic conditions resulted in a large difference in water age between the western and eastern parts of Lingding Bay. Transport along the eastern part took an extra 20 days to reach the open shelf. The MD, JT and YH outlets discharged the tracers directly at the inner shelf; during the wet season it took approximately 10 days for the tracers to be transported from the head water of these outlets to the inner shelf, and approximately 20–30 days for the TeDS to be spread over the shelf. During the dry season, the seaward spreading of the tracers from these outlets was limited to the inner shelf.
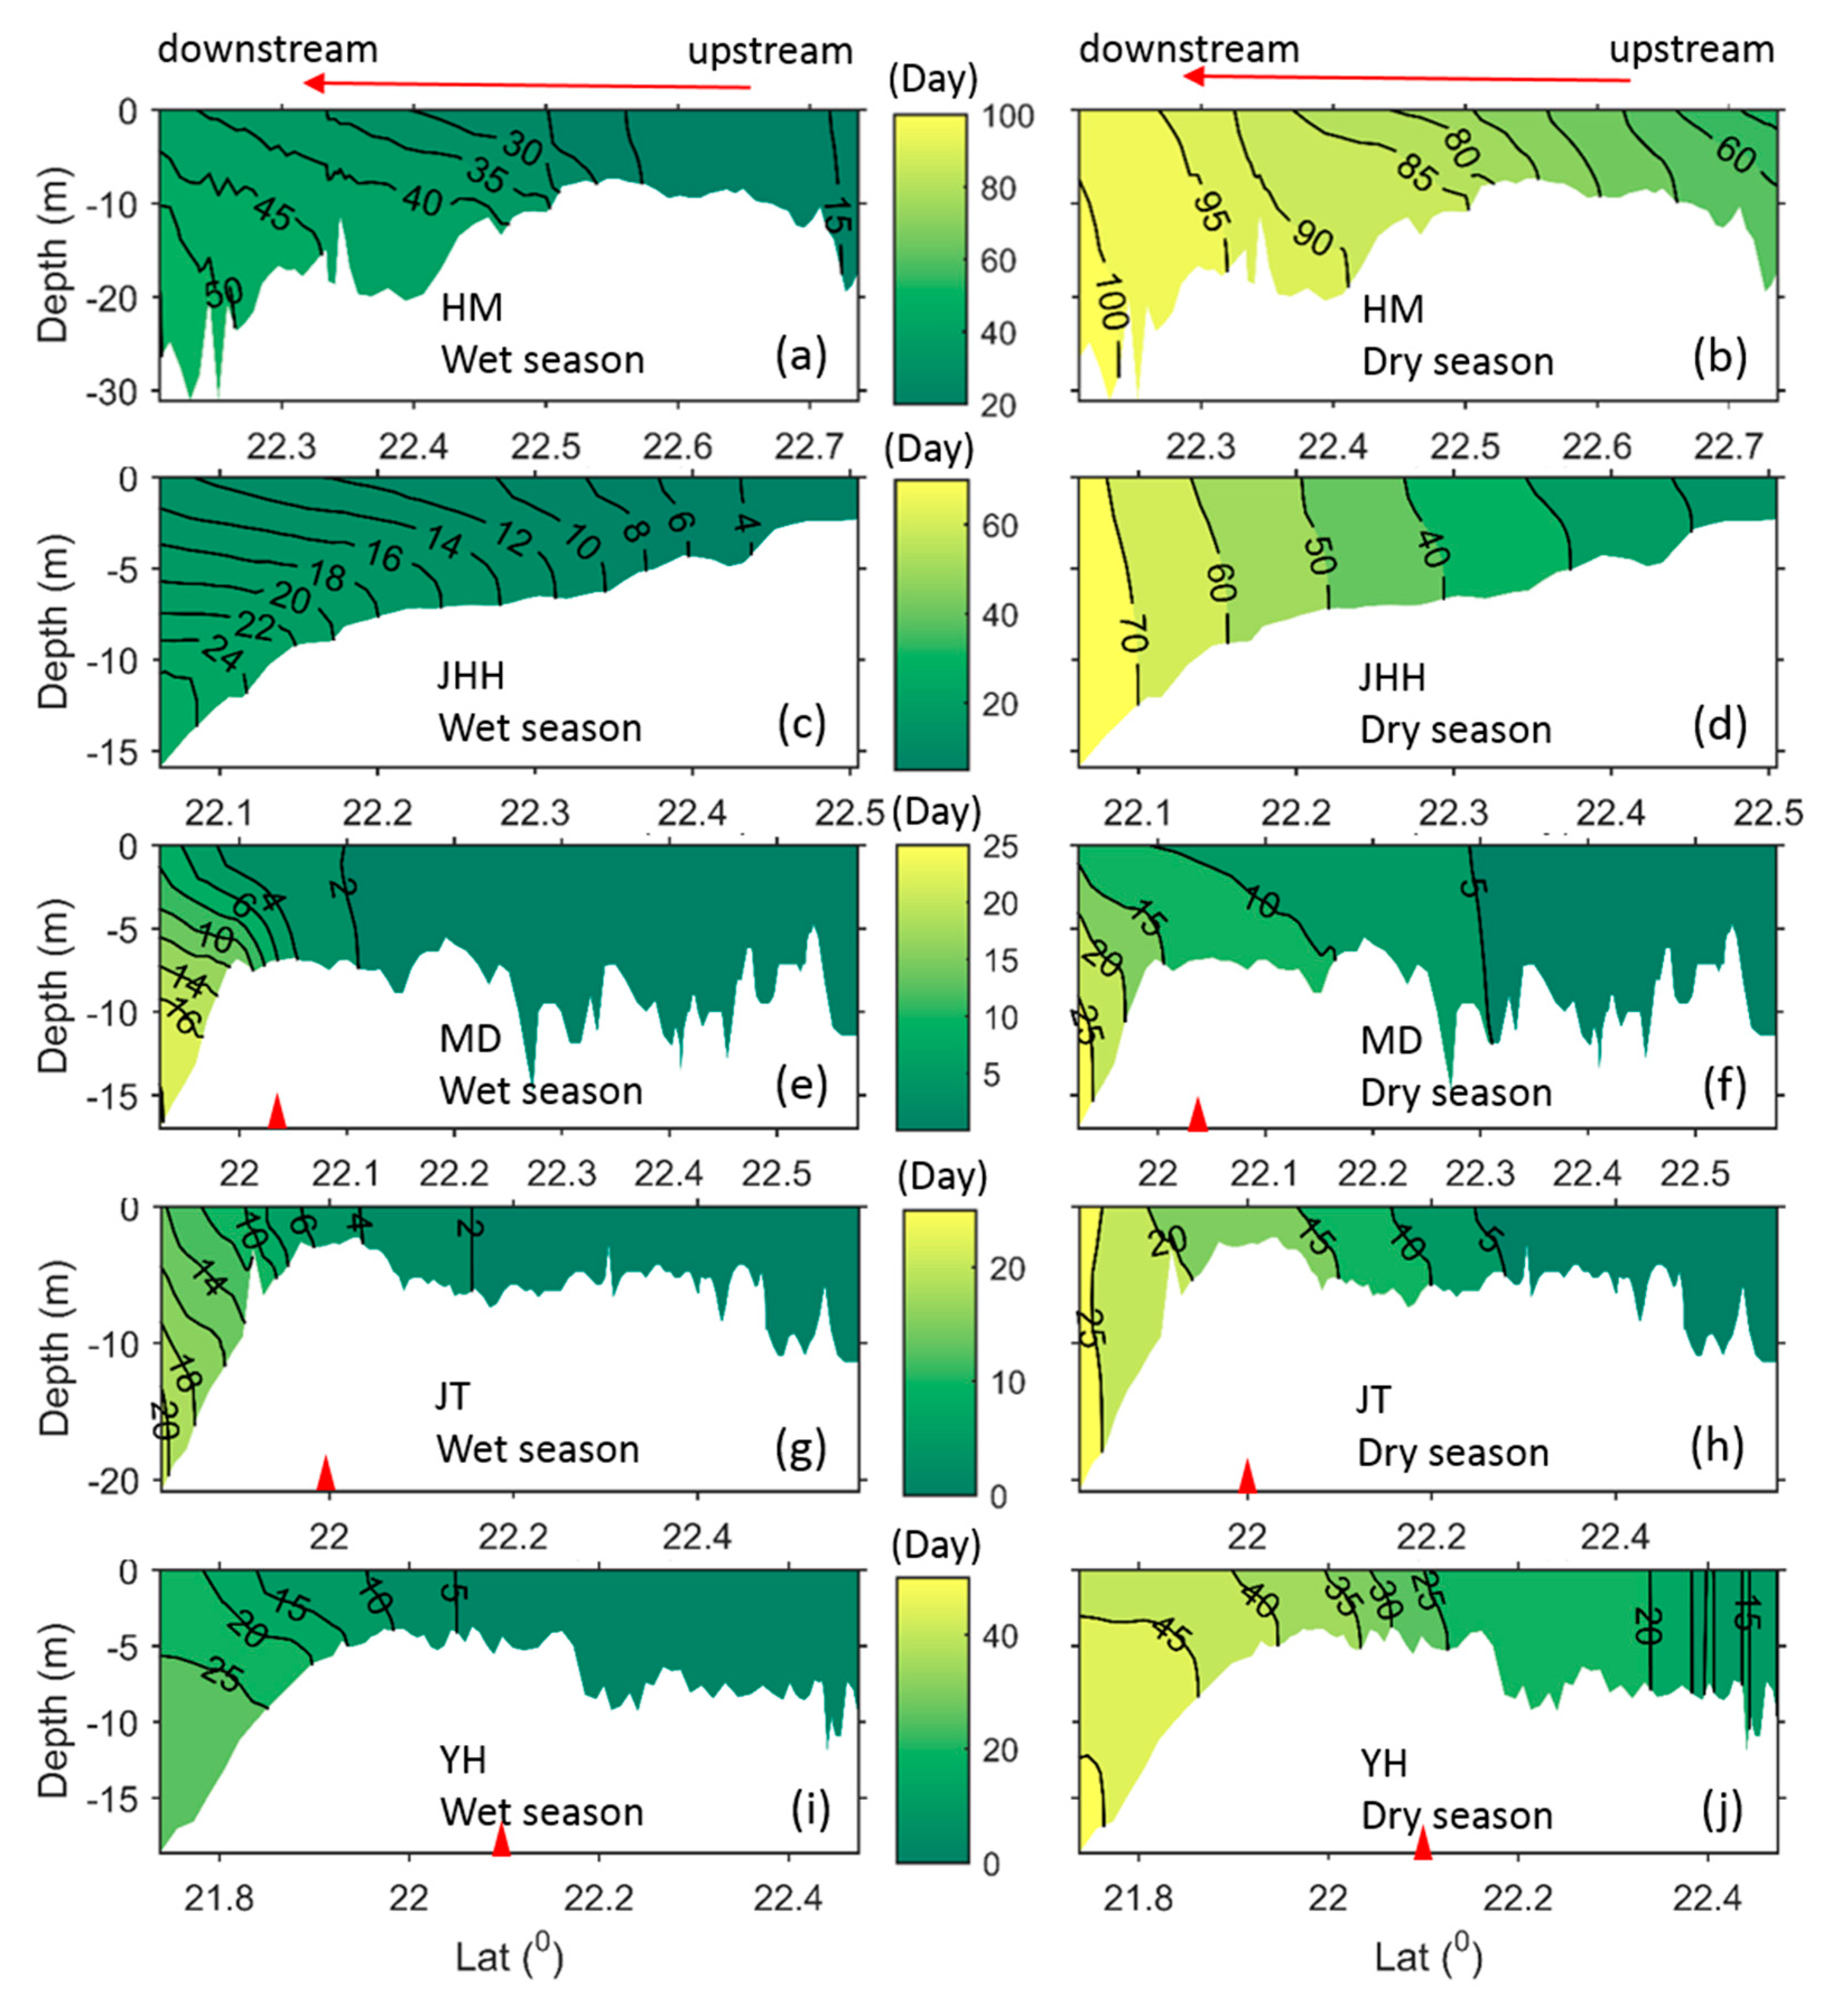
Transects of the transport time are plotted in Figure 7 to show the various transport time scales of TeDS coming from different outlets. The locations of these transects are indicated in Figure 1c, which follow the major pathways of tracers according to the results in Section 3.1. The results are averaged for June or January are used to represent the typical results in wet or dry season conditions. The vertical structure of the transport time (water age) can be clearly discerned. The HM (Figure 7a,b) and JHH transects (Figure 7c,d) show the transport time of TeDS coming from the HM and JHH outlets, respectively. The transport process during the wet season is faster than during the dry season. The dry season transport takes 50 days longer than the wet season to progress from the head water to the inner shelf. Along the MD outlet transect, less than 5 days are required for the TeDS to be transported from the head water to the entrance of the MD outlet during the wet season. The water age difference, and therefore the TeDS transport time, between the MD mouth and the open shelf is approximately 10 days. The offshore transport adjacent to the MD mouth is relatively slow and the tracer concentrations are relatively high (Figure 4e). Hypoxia can occasionally be observed in this area in summer [47], which may be due to the slow transport process of nutrients. During the dry season, transport from the head water to the MD mouth takes approximately 10 days. Transport along the JT and YH outlets shows similar behavior to the MD outlet. The dry season transport time along the YH outlet is very slow compared with the wet season. It can be expected that the dry season longitudinal circulation in this outlet is the weakest of all the studied outlets.

4. Discussion

4.1. Variations in Impacted Area

The impacted area is defined as an area with tracer concentrations > 0.2. If the initial tracer concentration at the upstream releasing point is defined as 1, the tracer concentration will have decayed to 0.2 (which is 20% of the initial concentration, implying that the impact of the TeDS has been greatly decreased) at the edge of the impacted area. For comparison, the area with a tracer concentration > 0.1 was also calculated. Figure 8a–e shows the variations in the impacted area for each outlet group and Figure 8f shows the total impacted area in the PRE. The total impacted area was calculated by adding the impacted areas of each outlet group, with the overlapped area excluded. The increase in the area can be clearly observed during the wet season. The most prominent variations appear in the JHH and MD outlets. The increase in the impacted area (black lines in Figure 8) during the wet season can be several thousand km2 for the JHH (Figure 8b) and MD (Figure 8c) outlets. For the other outlet groups, the increase can be several hundred km2 (Figure 8a,d,e). Compared with the river flow (shown in Figure 8f), the flow peak leads the area peak by approximately 14 days. This time scale is consistent with the mean wet season TeDS transport time shown in Figure 6.

4.2. Effect of Hydrodynamic Condition

From the results of the impact areas shown in Figure 8, we selected days 163, 176 and 219 as representative days to show the variation in the impacted areas (marked by vertical gray lines in Figure 8). On day 163, the river flow reaches its peak. On day 176, the total impacted area reaches its peak (Figure 8f). Day 219 was selected to show the condition without river flow pulses. The distributions of the tracer at the selected days are demonstrated in Figure 9. The wind conditions on the corresponding day are also given in each panel. The river flow starts to increase from day 156 and reaches its peak on day 163. High tracer concentrations can be observed, especially at the JHH, MD and YH outlets. At day 176, large amounts of the tracers are transported offshore to the open sea. The strong southwesterly wind generates offshore Ekman transport, which plays an important role. On day 219, the river flow is relatively stable and the effect of the river pulse has disappeared. The tracers are transported out of the estuary along the west coast of the PRE. The southeasterly wind forcing also prevents the offshore transport of the tracers. These results indicate that TeDS coming from different outlet groups follow different pathways and that their impacted areas vary under different hydrodynamic conditions.
We noticed that the pathways, tracer concentrations and the impacted area showed large variations under different hydrodynamic conditions. The circulation and salinity conditions on day 163, 176 and 219 are presented in Figure 10. On day 176 (Figure 10c), the current directions of the lower estuary and the inner shelf are mostly eastward, with a strong southeastward flow appearing in the area adjacent to the PRE mouth. Such eastward flow disappears on days 163 and 219. However, the southwestward flow is strong along the west coast of the PRE on days 163 and 219 (Figure 10a,e), while the circulation on day 219 is much weaker. The distribution of salinity (Figure 10b,d,f) is used to show the freshwater distribution. It seems that the southwesterly wind facilitates offshore transport of the river plume, while the southeasterly wind tends to push the river plume flow westward along the west coast of the PRE. More detailed analyses on the wind effects will be performed in a separate paper. In this study, we focused on identifying the relative contributions of each outlet group and their impacted domains.
Table 1 presents statistics on the tracer occupation days at stations 1–5 (marked in Figure 1c). The days with daily mean tracer concentrations > 0.2 are counted. Stations 1, 2, 3 and 4 were selected to represent the conditions from the upper estuary to lower estuary. Stn. 5 is located in the inner shelf adjacent to the MD outlet. It can be seen that the tracer coming from the JHH outlets has the largest number of occupation days. From the upper estuary to the inner shelf, the tracer occupation days range from 365 days to 154 days. The impact of the HM outlet mainly lies in the upper reaches of the estuary. In the lower estuary (Stns. 3, 4), its impact ranges from 20 days to only a few days. The impact of the MD outlet on Stn. 5 reaches up to 293 days. At Stn. 4, the impact of the MD outlet can occasionally be observed, with only 10 days’ occupation in 2007. The impact of the JT and YH outlets cannot be observed at Stns. 1–5, which implies that the TeDS coming from these outlets are seldom transported into Lingding Bay and the inner shelf adjacent to the MD outlet.

4.3. Correlation Analysis

Owing to the high levels of nutrients at the HM and JHH outlets [19,22,24], and the fact that the TeDS coming from these outlets are firstly discharged into Lingding Bay then the open sea, we conducted a model run with the tracer coming from both HM and JHH simultaneously. This was reasonable because the impacts of the MD, JT and YH outlets are very minor inside Lingding Bay. The model was run from 2005–2009. Figure 11a,b presents the correlation analyses of the river flow, tracer concentration and transport time at Stn. 3, a station in lower Lingding Bay. The correlation coefficient of the river flow and tracer concentration is 0.78 (at the 95% confidence level). According to Section 4.1, a 14-day time lag exists between the river flow and the impacted area. We conducted the time-lag correlation between the river flow and tracer concentration at Stn. 3. The highest correlation coefficient (=0.79) can be obtained with a tracer concentration time series lag of 2 days. A negative correlation between the river flow and transport time was found, with a correlation coefficient of −0.70. The river pulses could reduce the transport time (water age) in a very short time. The curvilinear fits of the river flow, tracer concentration (Figure 11c–e) and transport time (Figure 11f–h) at Stns. 2, 3 and 4 shows that from the upper to the lower estuary, the correlation of the river flow with the TeDS transport process weakens. At Stn. 4, the diagram is more scattered than at Stns. 2 and 3, which means that the impacts of other forcing fields (like wind, open sea circulation, etc.) are getting stronger. Being a bell-shaped estuary, the hydrodynamic circulation in the lower PRE is different from the traditional estuarine circulation, and the interaction with the open shelf is very active and complicated. It is worthwhile to thoroughly investigate the external forcing effect on the estuary–ocean exchange of the PRE, which will be conducted in a separate paper.

5. Conclusions

Understanding the fate and transport processes of TeDS in the PRE is essential for dealing with the coastal marine pollution and alleviating the impact of human activities on marine environments. In this study, the outlets of the PRD are divided into five groups according to their geographic locations. By adding passive tracers in a calibrated three-dimensional numerical model, the potential TeDS transport from each outlet group was investigated systematically under realistic forcing conditions. The major conclusions include: (1) During the wet season, the potential impacted area is much larger than during other seasons of the year, and the offshore transport of TeDS to the open sea can be frequently discerned. During the dry season, the tracers were transported mainly along the west coast of the PRE. (2) The JHH outlet has the largest impact among all of the outlet groups. The TeDS coming from the HM outlet are likely to mainly impact the Humen channel and the upper eastern portion of the PRE. Inside Lingding Bay, the impact of the tracers from the MD outlet can occasionally be observed, while the impact of the JT and YH outlets can seldom be observed. (3) For tracers coming from the head water of the HM outlet, it takes approximately 20 days for the tracer to be transported from the head water to the entrance of the outlet and approximately 40 days for the tracer to be transported to the mouth of Lingding Bay during the wet season. During the dry season, these times increase to 60 and 80 days, respectively. For the case of tracers released from the head water of the JHH outlets, the potential seaward transport of TeDS is fast. It takes less than 10 days for tracers to reach the outlet entrance and approximately 20 days to reach Lingding Bay mouth during the wet season, while in the dry season it takes 20 and 40 days, respectively. For the MD, JT and YH outlets, it usually takes approximately 10 days for the tracer to be transported from the head water to the inner shelf, and it takes 20–30 days for the tracer to be spread over the shelf during the wet season. Transport from the MD outlet is fast, but at the inner shelf adjacent to the MD outlet mouth, the offshore transport is slow. (4) The correlation coefficients between the river flow and tracer concentration (transport time) is 0.78 (−0.70) inside the PRE. In the areas adjacent to the estuary mouth, the impacts of other forcing fields are stronger. Although biochemical processes are excluded from our model, the results are still very instructive for water resource management and pollution transport prediction in the Pearl River Delta.

Author Contributions

Conceptualization, B.H.; methodology, B.H.; validation, B.H., G.W. and H.X.; formal analysis, B.H., G.W.; investigation, B.H., H.X.; resources, H.X., D.W.; data curation, B.H., H.X.; writing—original draft preparation, B.H., H.X., G.W.; writing—review and editing, B.H., H.X.; visualization, B.H., G.W.; funding acquisition, B.H., D.W. All authors have read and agreed to the published version of the manuscript.

Funding

This research was funded by the Key Research Program of Frontier Sciences, CAS (No. QYZDJ-SSW-DQC022) and National Natural Science Foundation of China, Grant number 41976014, 51761135021, 41666001).

Acknowledgments

We would like to thank the anonymous reviewers and the Editor for their efforts to improve the manuscript.

Conflicts of Interest

The authors declare no conflict of interest.

References

  1. Kemp, W.; Boynton, W.; Adolf, J.; Boesch, D.; Boicourt, W.; Brush, G.; Cornwell, J.; Fisher, T.; Glibert, P.M.; Hagy, J.; et al. Eutrophication of Chesapeake Bay: Historical trends and ecological interactions. Mar. Ecol. Prog. Ser. 2005, 303, 1–29. [Google Scholar] [CrossRef]
  2. Murphy, R.R.; Kemp, W.M.; Ball, W.P. Long-Term Trends in Chesapeake Bay Seasonal Hypoxia, Stratification, and Nutrient Loading. Chesap. Sci. 2011, 34, 1293–1309. [Google Scholar] [CrossRef]
  3. Nixon, S.W. Coastal marine eutrophication: A definition, social causes, and future concerns. Ophelia 1995, 41, 199–219. [Google Scholar] [CrossRef]
  4. Paerl, H.W.; Valdes, L.M.; Peierls, B.L.; Adolf, J.E.; Harding, L.W. Anthropogenic and climatic influences on the eutrophication of large estuarine ecosystems. Limnol. Oceanogr. 2006, 51, 448–462. [Google Scholar] [CrossRef] [Green Version]
  5. WWAP (World Water Assessment Programme). United Nations World Water Development Report 2015: Water for a Sustainable World; United Nations Educational, Scientific and Cultural Organization: Paris, France, 2015. [Google Scholar]
  6. Liu, B.; Peng, S.; Liao, Y.; Long, W. The causes and impacts of water resources crises in the Pearl River Delta. J. Clean. Prod. 2018, 177, 413–425. [Google Scholar] [CrossRef]
  7. Rahman, M.; Penny, G.; Mondal, M.; Zaman, M.; Kryston, A.; Salehin, M.; Nahar, Q.; Islam, M.; Bolster, D.; Tank, J.; et al. Salinization in large river deltas: Drivers, impacts and socio-hydrological feedbacks. Water Secur. 2019, 6, 100024. [Google Scholar] [CrossRef]
  8. Du, J.; Shen, J. Transport of Riverine Material From Multiple Rivers in the Chesapeake Bay: Important Control of Estuarine Circulation on the Material Distribution. J. Geophys. Res. Biogeosci. 2017, 122, 2998–3013. [Google Scholar] [CrossRef]
  9. Hirst, A.C. Determination of water component age in ocean models: Application to the fate of North Atlantic Deep Water. Ocean Model. 1999, 1, 81–94. [Google Scholar] [CrossRef]
  10. Delhez, E.J.M.; Deleersnijder, E. The concept of age in marine modeling II. Concentration distribution function in the English Channel and the North Sea. J. Mar. Syst. 2002, 31, 279–297. [Google Scholar] [CrossRef] [Green Version]
  11. Döös, K.; Engqvist, A. Assessment of water exchange between a discharge region and the open sea—A comparison of different methodological concepts. Estuar. Coast. Shelf Sci. 2007, 74, 709–721. [Google Scholar] [CrossRef]
  12. Hong, B.; Panday, N.; Shen, J.; Wang, H.V.; Gong, W.; Soehl, A. Modeling water exchange between Baltimore Harbor and Chesapeake Bay using artificial tracers: Seasonal variations. Mar. Environ. Res. 2010, 70, 102–119. [Google Scholar] [CrossRef] [PubMed] [Green Version]
  13. Shen, J.; Haas, L. Calculating age and residence time in the tidal York River using three-dimensional model experiments. Estuar. Coast. Shelf Sci. 2004, 61, 449–461. [Google Scholar] [CrossRef]
  14. Gustafsson, K.E.; Bendtsen, J. Elucidating the dynamics and mixing agents of a shallow fjord through age tracer modelling. Estuar. Coast. Shelf Sci. 2007, 74, 641–654. [Google Scholar] [CrossRef]
  15. Hong, B.; Shen, J. Responses of estuarine salinity and transport processes to potential future sea-level rise in the Chesapeake Bay. Estuar. Coast. Shelf Sci. 2012, 104, 33–45. [Google Scholar] [CrossRef]
  16. Hong, B.; Shen, J. Linking dynamics of transport timescale and variations of hypoxia in the Chesapeake Bay. J. Geophys. Res. Oceans 2013, 118, 6017–6029. [Google Scholar] [CrossRef] [Green Version]
  17. Kärnä, T.; Baptista, A.M. Water age in the Columbia River estuary. Estuar. Coast. Shelf Sci. 2016, 183, 249–259. [Google Scholar] [CrossRef] [Green Version]
  18. Du, J.; Park, K.; Yu, X.; Zhang, Y.J.; Ye, F. Massive pollutants released to Galveston Bay during Hurricane Harvey: Understanding their retention and pathway using Lagrangian numerical simulations. Sci. Total. Environ. 2020, 704, 135364. [Google Scholar] [CrossRef]
  19. He, B.; Dai, M.; Zhai, W.-D.; Guo, X.; Wang, L. Hypoxia in the upper reaches of the Pearl River Estuary and its maintenance mechanisms: A synthesis based on multiple year observations during 2000–2008. Mar. Chem. 2014, 167, 13–24. [Google Scholar] [CrossRef]
  20. Dai, M.; Guo, X.; Zhai, W.-D.; Yuan, L.; Wang, B.; Wang, L.; Cai, P.; Tang, T.; Cai, W. Oxygen depletion in the upper reach of the Pearl River estuary during a winter drought. Mar. Chem. 2006, 102, 159–169. [Google Scholar] [CrossRef]
  21. Yan, M.; Nie, H.; Xu, K.; He, Y.; Hu, Y.; Huang, Y.; Wang, J. Microplastic abundance, distribution and composition in the Pearl River along Guangzhou city and Pearl River estuary, China. Chemosphere 2019, 217, 879–886. [Google Scholar] [CrossRef]
  22. Dai, M.; Gan, J.; Han, A.; Kung, H.S.; Yin, Z. Physical dynamics and biogeochemistry of the Pearl River plume. In Biogeochemical Dynamics at Major River-Coastal Interfaces; Bianchi, T.S., Allison, M.A., Cai, W., Eds.; Cambridge University Press (CUP): Cambridge, UK, 2013; pp. 321–352. [Google Scholar]
  23. Hu, J.; Li, S.; Geng, B. Modeling the mass flux budgets of water and suspended sediments for the river network and estuary in the Pearl River Delta, China. J. Mar. Syst. 2011, 88, 252–266. [Google Scholar] [CrossRef]
  24. Qiu, D.; Huang, L.; Zhang, J.; Lin, S. Phytoplankton dynamics in and near the highly eutrophic Pearl River Estuary, South China Sea. Cont. Shelf Res. 2010, 30, 177–186. [Google Scholar] [CrossRef]
  25. Wilson, R.E.; Swanson, R.L.; Crowley, H.A. Perspectives on long-term variations in hypoxic conditions in western Long Island Sound. J. Geophys. Res. Space Phys. 2008, 113. [Google Scholar] [CrossRef] [Green Version]
  26. Scully, M.E. Wind Modulation of Dissolved Oxygen in Chesapeake Bay. Chesap. Sci. 2010, 33, 1164–1175. [Google Scholar] [CrossRef]
  27. Hamrick, J.M.; Wu, T.S. Computational design and optimization of the EFDC/HEM3D surface water hydrodynamic and eutrophication models. In Next Generation Environmental Models and Computational Methods; Delich, G., Wheeler, M., Eds.; Society for Industrial and Applied Mathematics: Philadelphia, PA, USA, 1997; pp. 143–161. [Google Scholar]
  28. Gong, W.; Shen, J.; Hong, B. The influence of wind on the water age in the tidal Rappahannock River. Mar. Environ. Res. 2009, 68, 203–216. [Google Scholar] [CrossRef] [PubMed] [Green Version]
  29. Hong, B.; Shen, J.; Xu, H. Upriver transport of dissolved substances in an estuary and sub-estuary system of the lower James River, Chesapeake Bay. Front. Earth Sci. 2018, 12, 583–599. [Google Scholar] [CrossRef]
  30. Hong, B.; Liu, Z.; Shen, J.; Wu, H.; Gong, W.; Xu, H.; Wang, D. Potential physical impacts of sea-level rise on the Pearl River Estuary, China. J. Mar. Syst. 2020, 201, 103245. [Google Scholar] [CrossRef]
  31. PRWRC (Pearl River Water Resource Conservancy). The Pearl River Records 1 (Zhujiang Zhi); Guangdong Science & Technology Press: Guangzhou, China, 1991. (In Chinese) [Google Scholar]
  32. Cheng, Z.L. Decadal variation of hydrological status in stream network area and the eight outlets of Pearl River Delta. Acta Sci. Nat. Univ. Sunyatseni 2001, 40 (Suppl. 2), 29–31. [Google Scholar]
  33. Zhao, H. The Evolution of the Pearl River Estuary; China Ocean Press: Beijing, China, 1990; p. 357. [Google Scholar]
  34. Deleersnijder, E.; Campin, J.; Delhez, E. The concept of age in marine modeling I. Theory and preliminary model results. J. Marine Syst. 2001, 28, 229–267. [Google Scholar] [CrossRef] [Green Version]
  35. Delhez, E.J.; Campin, J.-M.; Hirst, A.C.; Deleersnijder, E. Toward a general theory of the age in ocean modelling. Ocean Model. 1999, 1, 17–27. [Google Scholar] [CrossRef] [Green Version]
  36. Du, J.; Shen, J. Water residence time in Chesapeake Bay for 1980–2012. J. Mar. Syst. 2016, 164, 101–111. [Google Scholar] [CrossRef] [Green Version]
  37. Huang, W.; Liu, X.; Chen, X.; Flannery, M.S. Estimating river flow effects on water ages by hydrodynamic modeling in Little Manatee River estuary, Florida, USA. Environ. Fluid Mech. 2009, 10, 197–211. [Google Scholar] [CrossRef]
  38. Alber, M.; Sheldon, J. Use of a Date-specific Method to Examine Variability in the Flushing Times of Georgia Estuaries. Estuar. Coast. Shelf Sci. 1999, 49, 469–482. [Google Scholar] [CrossRef]
  39. Hagy, J.D.; Boynton, W.; Sanford, L.P. Estimation of Net Physical Transport and Hydraulic Residence Times for a Coastal Plain Estuary Using Box Models. Estuaries 2000, 23, 328. [Google Scholar] [CrossRef]
  40. Geyer, W.R.; Morris, J.T.; Pahl, F.G.; Jay, D.A. Interaction between physical processes and ecosystem structure: A comparative approach. In Estuarine Science: A Synthetic Approach to Research and Practice; Hobbie, J.E., Ed.; Island Press: Washington, DC, USA, 2000; pp. 177–210. [Google Scholar]
  41. Oliveira, A.; Baptista, A. Diagnostic modeling of residence times in estuaries. Water Resour. Res. 1997, 33, 1935–1946. [Google Scholar] [CrossRef]
  42. Rayson, M.; Gross, E.S.; Hetland, R.D.; Fringer, O.B. Time scales in Galveston Bay: An unsteady estuary. J. Geophys. Res. Oceans 2016, 121, 2268–2285. [Google Scholar] [CrossRef] [Green Version]
  43. Zimmerman, J. Mixing and flushing of tidal embayments in the western Dutch Wadden Sea part I: Distribution of salinity and calculation of mixing time scales. Neth. J. Sea Res. 1976, 10, 149–191. [Google Scholar] [CrossRef]
  44. De Brye, B.; De Brauwere, A.; Gourgue, O.; Delhez, E.J.; Deleersnijder, E. Water renewal timescales in the Scheldt Estuary. J. Mar. Syst. 2012, 94, 74–86. [Google Scholar] [CrossRef]
  45. Li, Y.; Feng, H.; Zhang, H.; Sun, J.; Yuan, D.; Guo, L.; Nie, J.; Du, J. Hydrodynamics and water circulation in the New York/New Jersey Harbor: A study from the perspective of water age. J. Mar. Syst. 2019, 199, 103219. [Google Scholar] [CrossRef]
  46. Harrison, P.J.; Yin, K.; Lee, J.; Gan, J.; Liu, H. Physical–biological coupling in the Pearl River Estuary. Cont. Shelf Res. 2008, 28, 1405–1415. [Google Scholar] [CrossRef]
  47. Cui, Y.; Wu, J.; Ren, J.; Xu, J. Physical dynamics structures and oxygen budget of summer hypoxia in the Pearl River Estuary. Limnol. Oceanogr. 2018, 64, 131–148. [Google Scholar] [CrossRef]
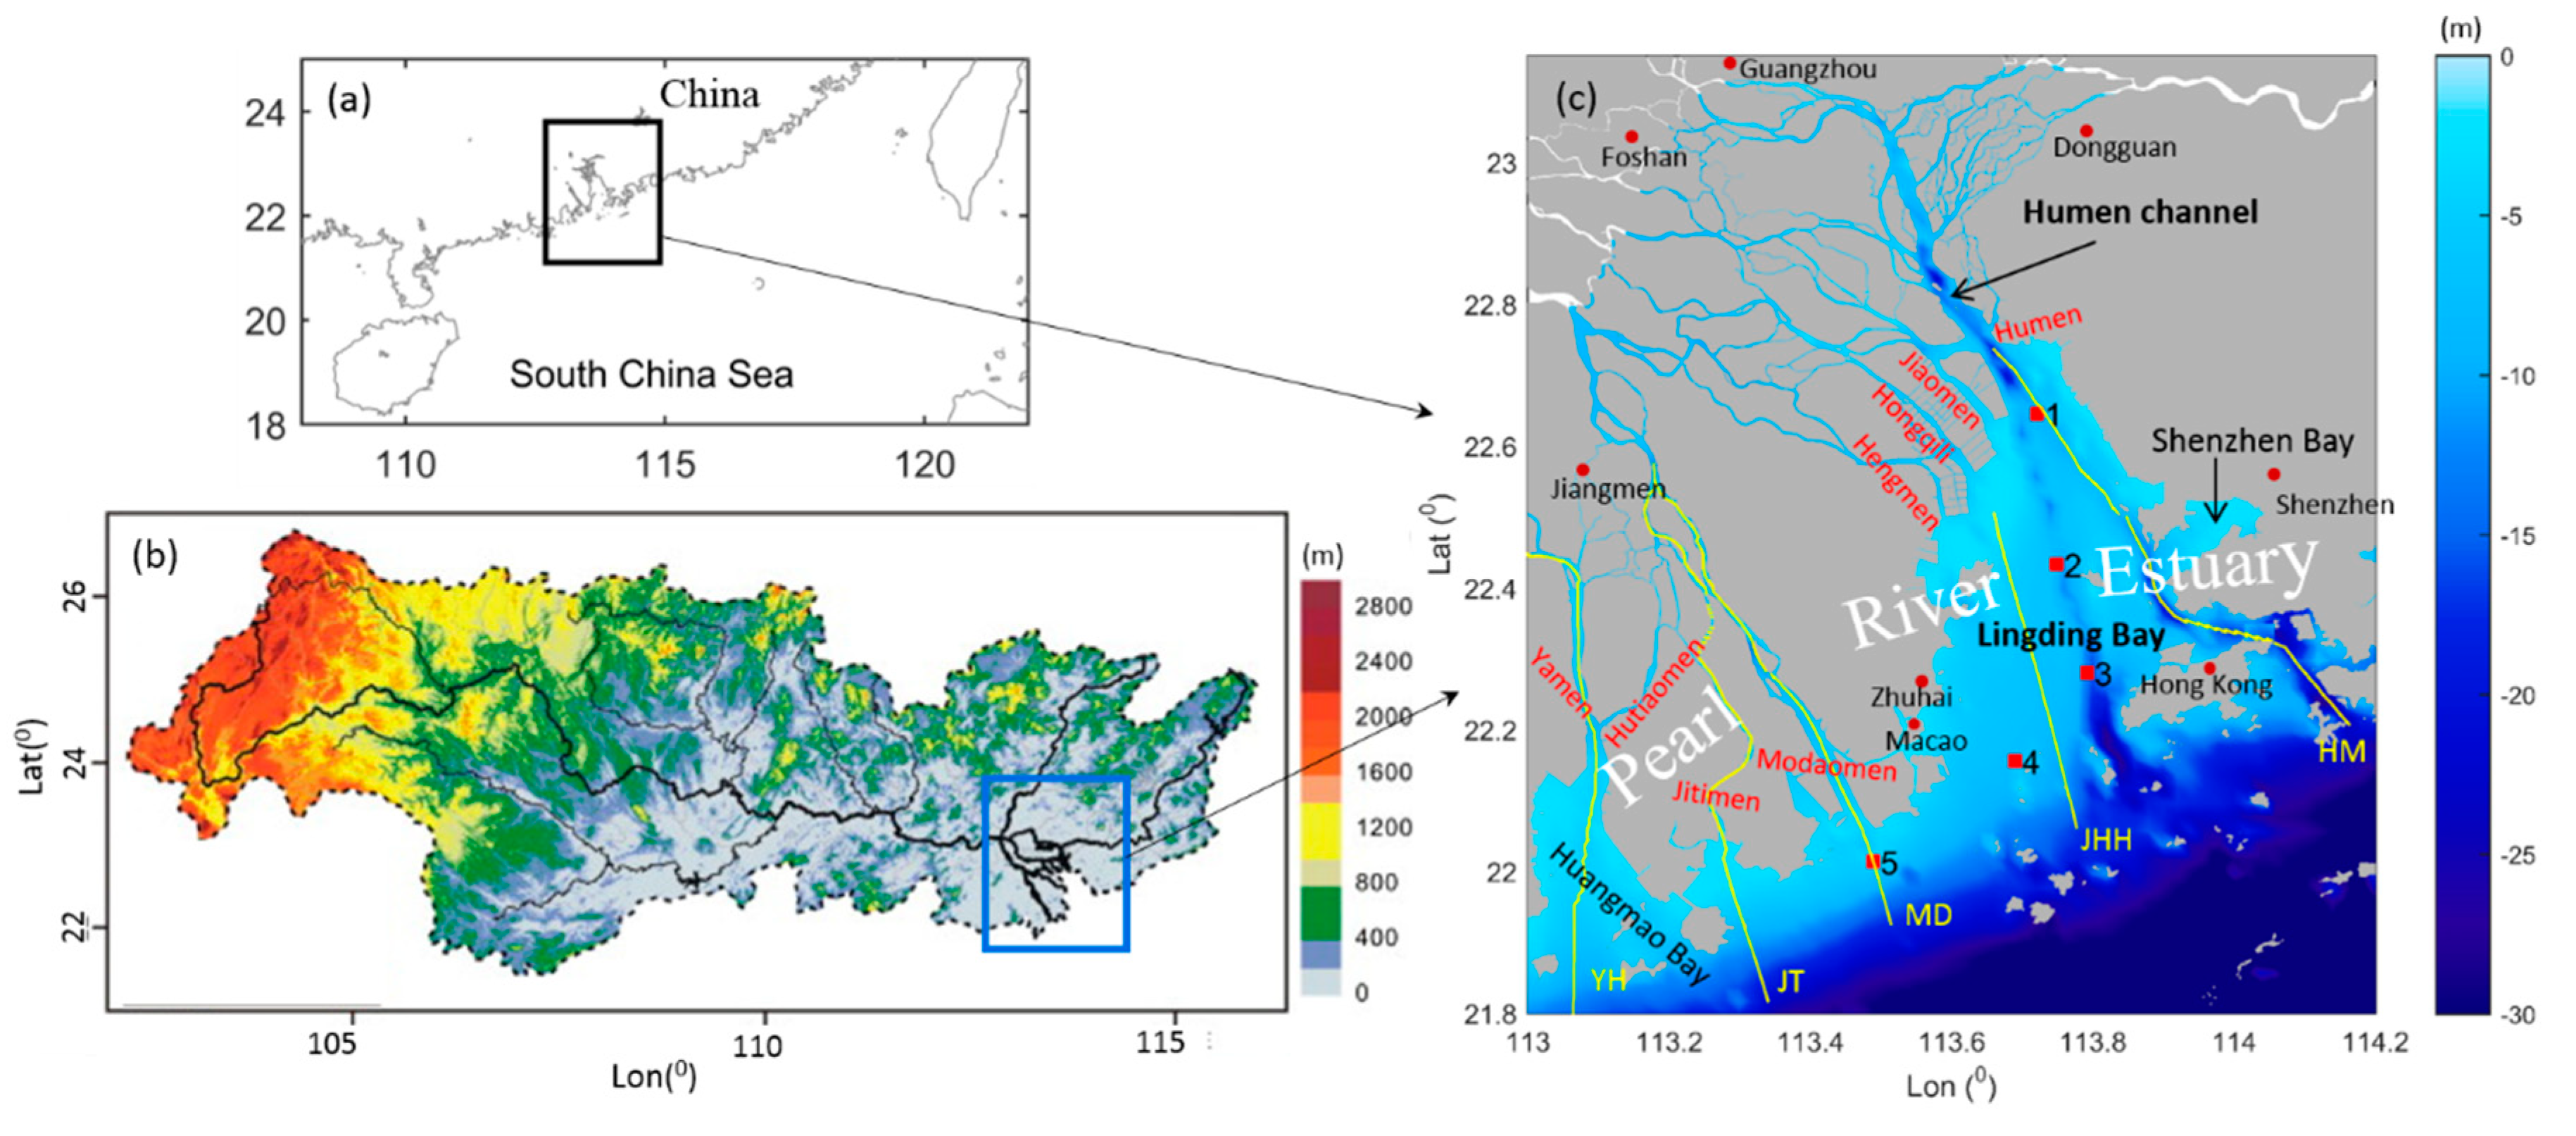
Figure 1. (a) The Pearl River Estuary (PRE) on the southern coast of China; (b) the Pearl River basin. The color scale represents the elevation above mean sea level in meters; (c) the bathymetry of the PRE. The PRE includes eight outlets (Humen, Jiaomen, Hongqili, Hengmen, Modaomen, Jitimen, Hutiaomen and Yamen) that bring fresh water to the estuary. The Lingding Bay is the largest bay in the PRE. Stations (red squares, named 1–5 from upstream to downstream) and transects (yellow lines, named HM, JHH, MD, JT and YH from east to west) are used for later analyses. Major cities (Guangzhou, Foshan, Dongguan, Shenzhen, Jiangmen, Zhuhai, Hong Kong and Macao) around the river delta are also marked (red circles). Among these cities, Guangzhou and Shenzhen are megalopolises.
Water 12 01235 g001
Figure 2. Model grids. The red dots mark the locations where the upstream river flow entered the model domain and the blue dots represent the gauge stations where in situ daily river flow measurements were obtained in the major tributaries of the Pearl River.
Water 12 01235 g002
Figure 3. Daily and monthly flow of the Pearl River (summation of river flow measured at blue gauge stations in Figure 2) in 2007. The multi-year (2000–2014) mean daily and monthly river discharge and its standard deviation are also plotted for comparison.
Water 12 01235 g003
Figure 4. Tracer concentrations (arbitrary unit) in the case of tracers entering the domain from the HM (a,b), JHH (c,d), MD (e,f), JT (g,h) and YM (i,j) outlets, respectively. High tracer concentrations indicate potentially high TeDS concentrations. Left panels: typical wet season (monthly mean result in June). Right panels: typical dry season (monthly mean result in January). The corresponding monthly mean wind velocity (m/s) is superimposed on the top panel.
Water 12 01235 g004
Figure 5. Contours showing the total percentage of time that the tracer concentration was greater than 0.2 (arbitrary unit) for the year 2007. The shaded area shows the percentage > 0. Each panel shows a case of tracers coming from the HM (a), JHH (b), MD (c), JT (d) and YM (e) outlets.
Water 12 01235 g005
Figure 6. Transport time (days) of tracers coming from the HM (a,b), JHH (c,d), MD (e,f), JT (g,h) and YH (i,j) outlets. Left panel: typical wet season (monthly mean result in June). Right panel: typical dry season (monthly mean result in January). The spots for tracers entering the domain are marked by the red dots in each case, and are also part of the river inflow locations shown in Figure 2.
Water 12 01235 g006
Figure 7. Transport time (days) along the five transects: (a,b) HM; (c,d) JHH; (e,f) MD; (g,h) JT; (i,j) YH. For each transect, the wet season (left column, averaged in June) and dry season (right column, averaged in January) conditions are plotted. The locations of these transects are indicated in Figure 1c, which follows the major pathways of the tracers according to the results in Section 3.1. The upstream and downstream directions are indicated. The red triangles (in (ej)) indicate the entrance of each outlet.
Water 12 01235 g007
Figure 8. Tracer impacted area (km2), calculated by the area with a tracer concentration greater than 0.2 (black lines). For comparison, the area with a tracer concentration > 0.1 (gray lines) was also calculated. (a) HM; (b) JHH; (c) MD; (d) JT; (e) YH. The areas were calculated from the model run of each case. (f) The total impacted area was calculated by adding the impacted area of each outlet group, with the overlapped area excluded. The river flow is also superimposed.
Water 12 01235 g008
Figure 9. Transport of tracers on day 163 (left column), 176 (mid column) and 219 (right column), indexed by the tracer concentration (arbitrary unit) coming from the HM (ac), JHH (df), MD (gi), JT (jl) and YH (mo) outlet groups. The labeled isolines are 0.8, 0.5, 0.2 and 0.1. The wind vector on the corresponding day is also presented.
Water 12 01235 g009
Figure 10. Daily averaged current (a,c,e; cm/s) and salinity (b,d,f; ppt) from the model results on day 163 (top row), 176 (center row) and 219 (bottom row). The shaded plots in (a,c,e) are the current speed, showing the strength of circulation.
Water 12 01235 g010
Figure 11. (a) Time series of the flow and tracer concentrations at station 3. The correlation coefficient is 0.78; (b) Time series of the flows and transport times at station 3. The correlation coefficient is −0.70. (ce) Scatter diagram of the flows and tracer concentrations at stations 2, 3 and 4; (fh) scatter diagram of the flow and transport times at stations 2, 3 and 4. The polynomial fitting is superimposed for (ch).
Water 12 01235 g011
Table 1. Days with tracer concentrations greater than 0.2 (arbitrary unit) in 2007 at stations 1, 2, 3, 4 and 5. Tracers coming from the Humen (HM), Jiaomen–Hengmen–Hongqili (JHH), Modaomen (MD), Jiti (JT) and Yamen–Hutiao (YH) outlets are calculated separately.
StationHMJHHMDJTYH
Stn. 1365365000
Stn. 271365000
Stn. 321197000
Stn. 421701000
Stn. 5015429300