Article

Development of Decay in Biofilms under Starvation Conditions—Rethinking of the Biomass Model

Department of Water Management, University of Rostock, 18059 Rostock, Germany
*
Author to whom correspondence should be addressed.
Water 2020, 12(5), 1249; https://doi.org/10.3390/w12051249
Submission received: 27 March 2020 / Revised: 22 April 2020 / Accepted: 25 April 2020 / Published: 27 April 2020
(This article belongs to the Special Issue Design, Operation and Economics of Wastewater Treatment Plant)

Abstract

:
The study investigates the decay of heterotrophic biomass in biofilms under starvation conditions based on measurements of the oxygen uptake rate (OUR). Original incentive was to understand the preservation of active biomass in SBR-trickling filter systems (SBR-TFS), treating event-based occurring, organically polluted stormwater. In comparison with activated sludge systems, the analyzed biofilm carrier of SBR trickling filters showed an astonishing low decay rate of 0.025 d−1, that allows the biocenosis to withstand long periods of starvation. In activated sludge modeling, biomass decay is regarded as first order kinetics with a 10 times higher constant decay rate (0.17–0.24 d−1, depending on the model used). In lab-scale OUR measurements, the degradation of biofilm layers led to wavy sequence of biomass activity. After long starvation, the initial decay rate (comparable to activated sludge model (ASM) approaches) dropped by a factor of 10. This much lower decay rate is supported by experiments comparing the maximum OUR in pilot-scale biofilm systems before and after longer starvation periods. These findings require rethinking of the approach of single-stage decay rate approach usually used in conventional activated sludge modelling, at least for the investigated conditions: the actual decay rate is apparently much lower than assumed, but is overshadowed by degradation of either cell-internal substrate and/or the ability to tap “ultra-slow” degradable chemical oxygen demand (COD) fractions. For the intended stormwater treatment, this allows the application of technical biofilm systems, even for long term dynamics of wastewater generation.

1. Introduction

Biological wastewater treatment is based on the accumulation of a complex consortium of microorganisms in suspended systems (activated sludge), as biofilms attached to carriers (biofilm systems), or a combination of both. Provided optimal living conditions and substrate supply, the performance of those systems is mainly dependent on mass of metabolic active microorganisms. In situations with strongly varying loading (e.g., periodic wastewater generation, treatment of organic polluted stormwater), the varying substrate supply can lead to strong variations of active biomass and related substrate transformation rates. Especially long starvation conditions may lead to a significant decrease of performance due to biomass decay. This needs to be assessed when designing treatment technologies for those conditions.
Bacteria (as the most relevant group for substrate metabolism in activated sludge and biofilm systems) apply various adaptation strategies to starvation. The most prominent are altering the macromolecular composition [1,2] and reducing the cell size [3,4]. Besides, a reduction of the protein synthesizing system, the ribosomes, has been observed. This process, known as ribophagy is so far not completely understood, but simplified, the degradation of ribosomes seems to serve as a source of energy supply [3,5,6]. It can be postulated that periodic changing substrate supply will perform a selective pressure on the biocenosis and define the phenotypic state of the bacteria [7]. However, these complex starvation-survival response strategies of bacteria can hardly be considered when describing biologic wastewater treatment mathematically.
Instead, the extensive variety of organism groups and their individual response to the environment needs to be streamlined, the governing biological processes, which again can only be described in a strongly simplified way. Currently, mathematical modeling of aerobic biologic wastewater treatment is based on the concepts developed in the activated sludge models [8]. This also applies for biofilm systems with additional challenge of describing matter transport through the biofilm and related formation layers with different environmental conditions and processes [8,9,10]. In activated sludge modelling (ASM), the variety of heterotrophic bacteria families is summarized in these models as one group (XH), expressed as chemical oxygen demand (COD).
The dynamics of heterotrophic biomass and the associated COD degradation are mostly mathematically described by combining growth and decay kinetics, both with a first order dependence on active biomass. Regarding decay, two different approaches were proposed and alternatively applied in activated sludge and biofilm modeling: (i) endogenous respiration model [11,12] and (ii) the death-regeneration model [13,14,15].
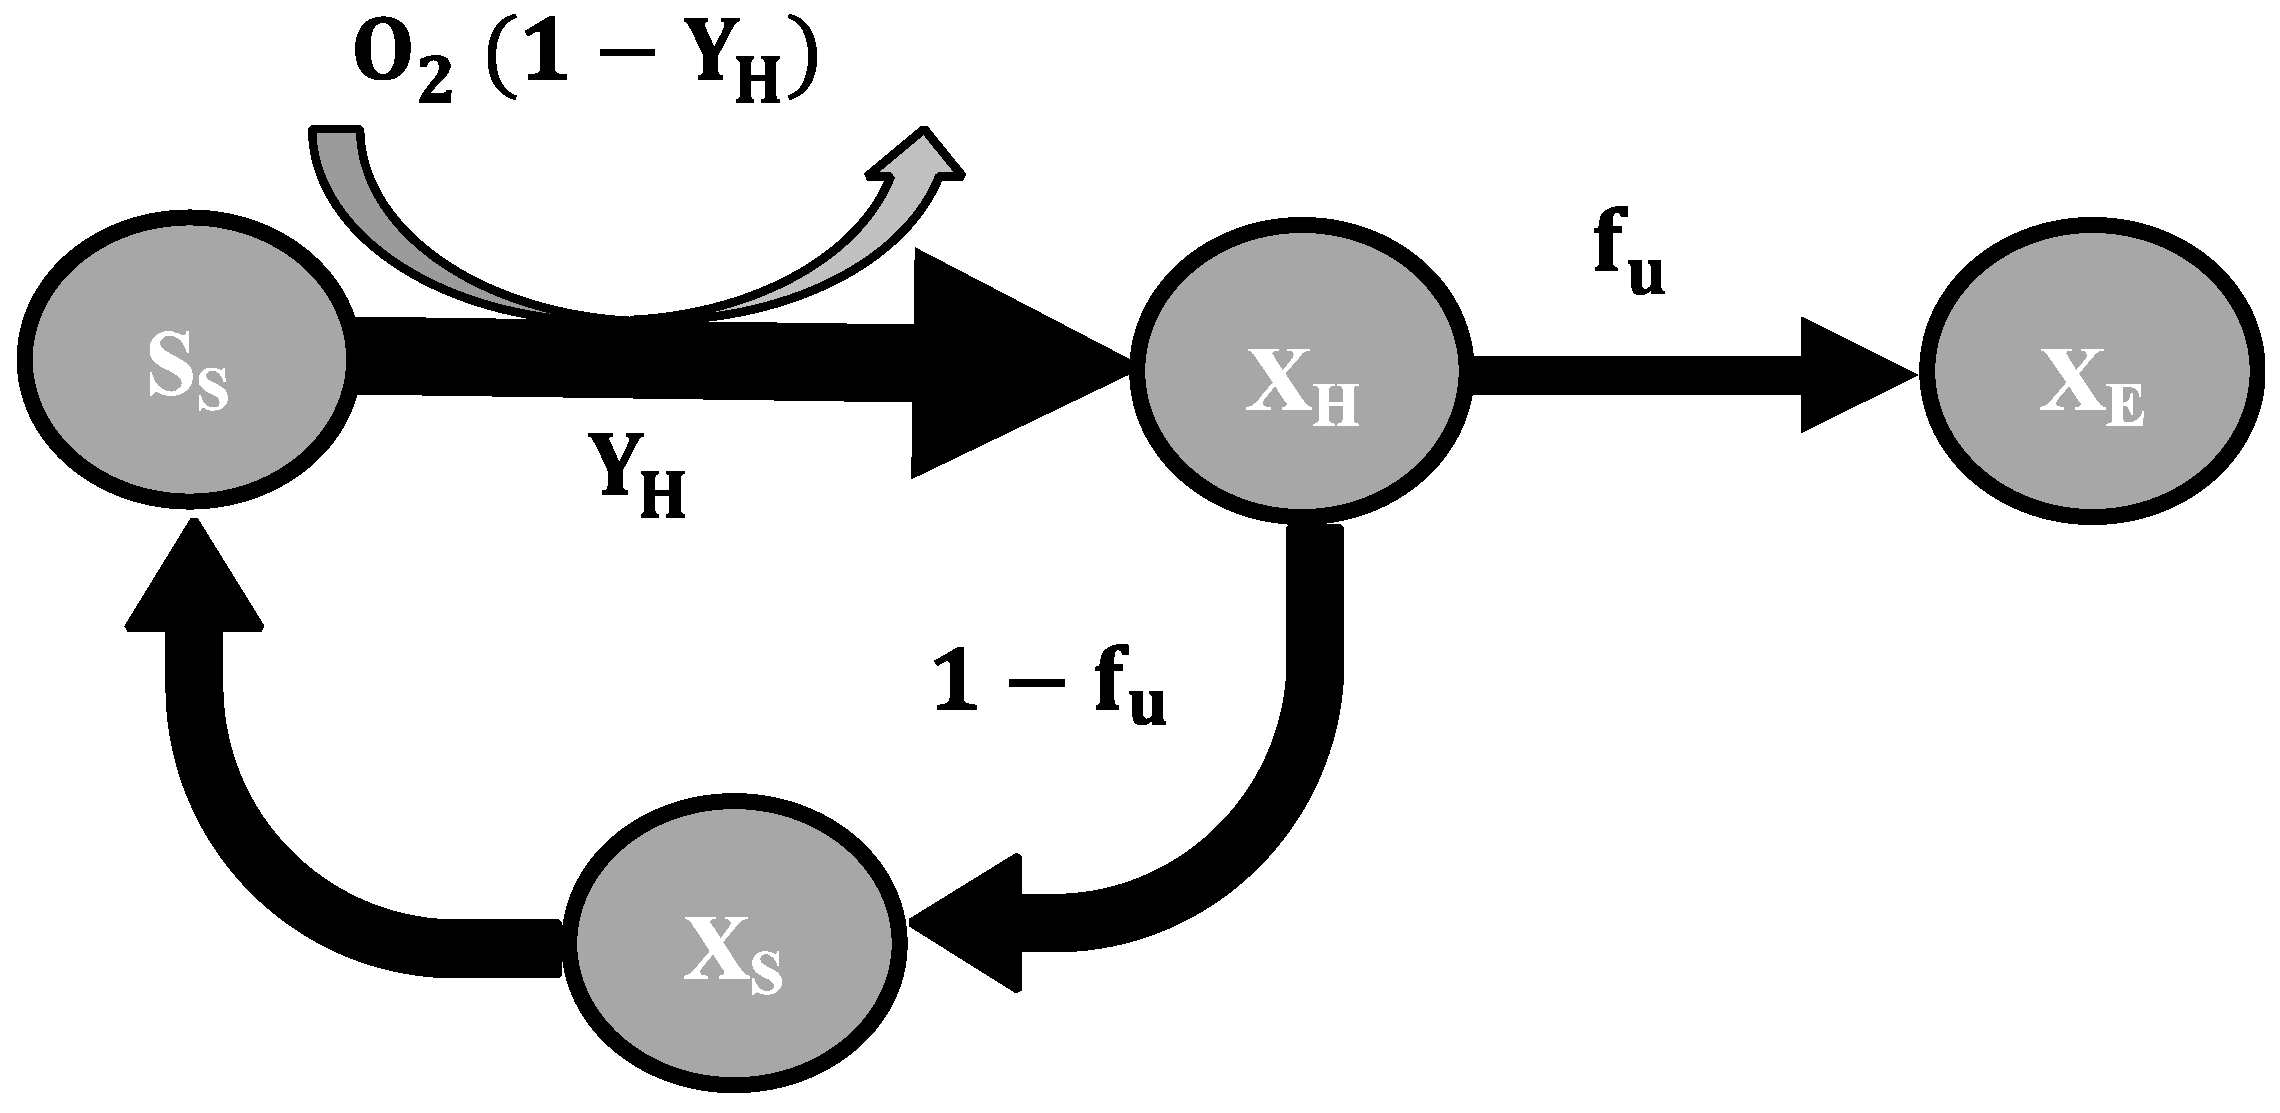
In the first commonly used endogenous respiration approach as shown in Figure 1, the active biomass can be directly consumed for providing maintenance energy for microorganisms as a consequence of decay [11]. As result of decay, a fraction (fU) remains as endogenous residue XE.
The death-regeneration model was introduced by Dold, Ekama, and Marais (1980). In this approach, heterotrophic microorganisms are releasing an unbiodegradable endogenous residue fraction XE and a biodegradable COD fraction XS during decay, which is then consumed by an organism, justifying oxygen consumption under starvation conditions (Figure 2). As a by-product of these decayed bacteria and, therefore, released bioavailable XS fraction, new growth is obtained, which is called regeneration. With this approach, increasing respiration rate after anaerobic periods can firstly be explained with the substrate release as a consequence of decay. If decay is an independent process, it would not stop under anaerobic conditions and, therefore, the substrate would accumulate, which then can be oxidized under aerobic conditions.
According to this model, the decay rate bH must become larger than in the endogenous respiration approach to compensate for regeneration. The decay rate from the respiration model b’ can be converted to the death-regeneration model with Equation (1): for this, an endogenous residue factor fU of 0.08 was assumed [13].
b = b 1 Y H · ( 1 f U )   [ d 1 ]
where YH is the heterotrophic biomass yield, b and b’ is the decay rate within the death-regeneration and endogenous respiration approach, respectively. Applying the proposed biological constants of ASM [12], the corresponding decay rate for domestic wastewater is b = 0.62 d−1 and b’ = 0.24 d−1.
A simple and well-established method to evaluate the activity of heterotrophic microorganism XH is measuring the respiration rate, expressed as biological oxygen uptake rate (OUR). With slight variations, the same method is commonly used for various research questions [16,17,18,19]. In the state of the art, OUR is measured with respirometers under strictly controlled conditions to avoid side-effects. The magnificent advantage of this method is highly time resolved and low-cost measuring of kinetic parameters and COD fractions as it is just based on measuring dissolved oxygen. Figure 3 shows in a schematic way the conversion of COD fraction in the raw water (left) and into biomass (right) during the biological process. The influent CODh,in can either be degraded, which can be measured with the oxygen respiration rate for degradation OURdeg or incorporated into biomass as excess sludge XES.
For a long time it had been generally assumed that the decay rate is a constant and independent from substrate supply conditions (expressed for activated sludge systems by the sludge retention time SRT) for the particular biological environmental [8,11,18,21]. Besides, the endogenous residue fraction XE and yield coefficient for heterotrophic organism YH is regarded to be constant for a particular substrate in the ASM. These are rather mechanistic assumptions and only valid for systems with rather low load variations. Current research in activated sludge systems proved that both the XE fraction [22] and the decay rate bH [23] are a function of sludge retention time SRT (i.e., function of substrate supply). Due to this observation at extreme conditions of low COD, the question arises if organisms can adapt their decay rate and the assumption of a constant decay rate has to be reconsidered or if the existing ASM has to be extended with an additional very slowly degradable COD fraction (consisting of “hard” external COD and/or cell-internal reserves) and according degradation process. Consequently, this would mean that the actual decay leading to cell death would occur at a lower rate than previously calculated. This is important for the activity and sludge production of all systems running with permanent or periodically occurring starvation conditions.
Those conditions occur for example in systems that treat rainwater runoff with high organic pollution. A practical application is stormwater-runoff from agricultural silo facilities which can be heavily contaminated by organic and nutrient pollutants and has to be treated before discharge into surface waters [24]. In contrast to domestic wastewater, the inflow to a treatment facility is rain dependent with dry weather periods of several weeks to months. Although, storage devices prior to a treatment plant can dampen these dynamics and biologic treatment systems should be able to survive starvation periods of several weeks and recover quickly in case of rain events. Attached growth systems are for those conditions interesting as they combine rather simple and robust technology with a certain ability to cope with load dynamics [25,26].
Applied to the original question, the development of active heterotrophic biomass (here, in attached growth systems) under long lasting starvation conditions, the main objectives of this paper are
  • The quantification of cell-decay rate under starvation conditions;
  • To identify and quantify degradation of a “new” COD fraction, made accessible under those conditions;
  • To quantify the recovery of the biofilm after starvation.
To verify the results achieved under lab-scale conditions a pilot plant for treating stormwater runoff with high organic pollution is operated, accordingly.

2. Material and Methods

2.1. Design of Wastewater Treatment Plant

Stormwater-runoff and silage effluent of a biogas plant was treated by an SBR trickling filter system (SBR-TFS) which is based on a trickling filter and a secondary clarification and storage tank. A compact description is given here. The entire process of SBR trickling filter is discussed in [27].
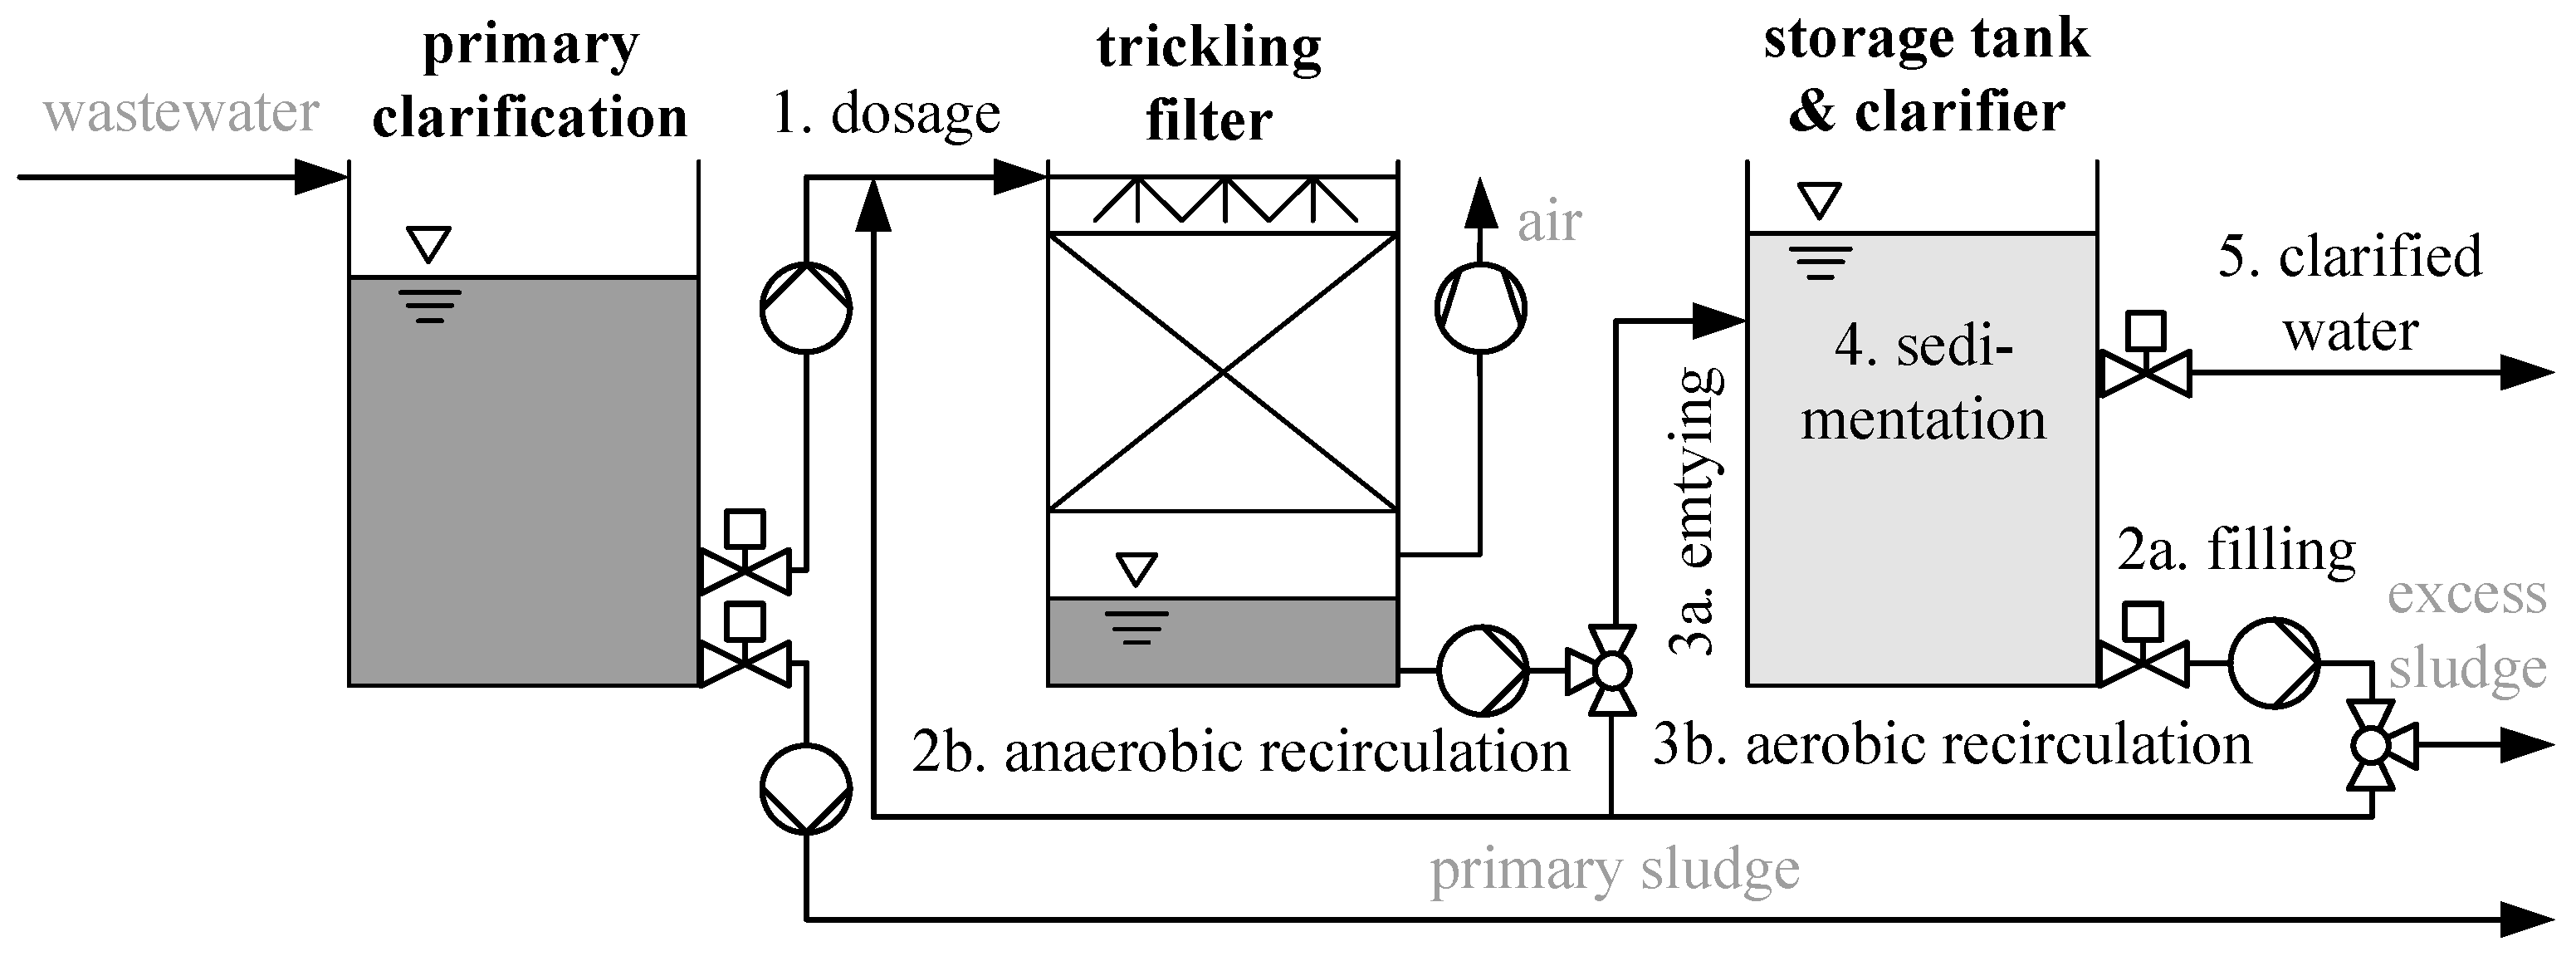
Figure 4 shows a principle schema of the treatment system. In contrast to conventional trickling filters (see e.g., [28]), the SBR-TFS is operated as a sequence-batch-reactor (SBR) to allow anaerobic phases for a systematic nutrient removal. Like typical SBR as known from activated sludge systems (ASS), the process is divided into an anaerobic and aerobic step. The anaerobic step acts as an upstream denitrification. During this step, the trickling filter is firstly fed with stormwater-runoff from the combined retention and primary clarification tank (rich in COD, ammonia, and phosphorous) and distributed with a rotary sprayer for a homogeneous spread all over the surface. After dosage, the trickling filter is filled up with treated water from the combined storage and secondary clarification tank (containing nitrate from the previous cycle) to the highest level to avoid oxygen diffusion during anaerobic recirculation (step 2b). The completely ponded system is then internally recirculated to achieve denitrification (and anaerobic P-release, if enhanced biological removal shall be performed). The aerobic phase follows the anaerobic phase in which the wastewater in the trickling filter is emptied into the storage tank. In this phase, the trickling filter sump is constantly pumped into the storage tank and back to the rotary sprayer of the trickling filter until COD degradation and nitrification are completed (step 3b). Distributing the water over a high surface area of the biofilm carrier provides a sufficient oxygen supply through diffusion. The final step is the sedimentation, separating the activated sludge from the clarified water, which is finally discharged.
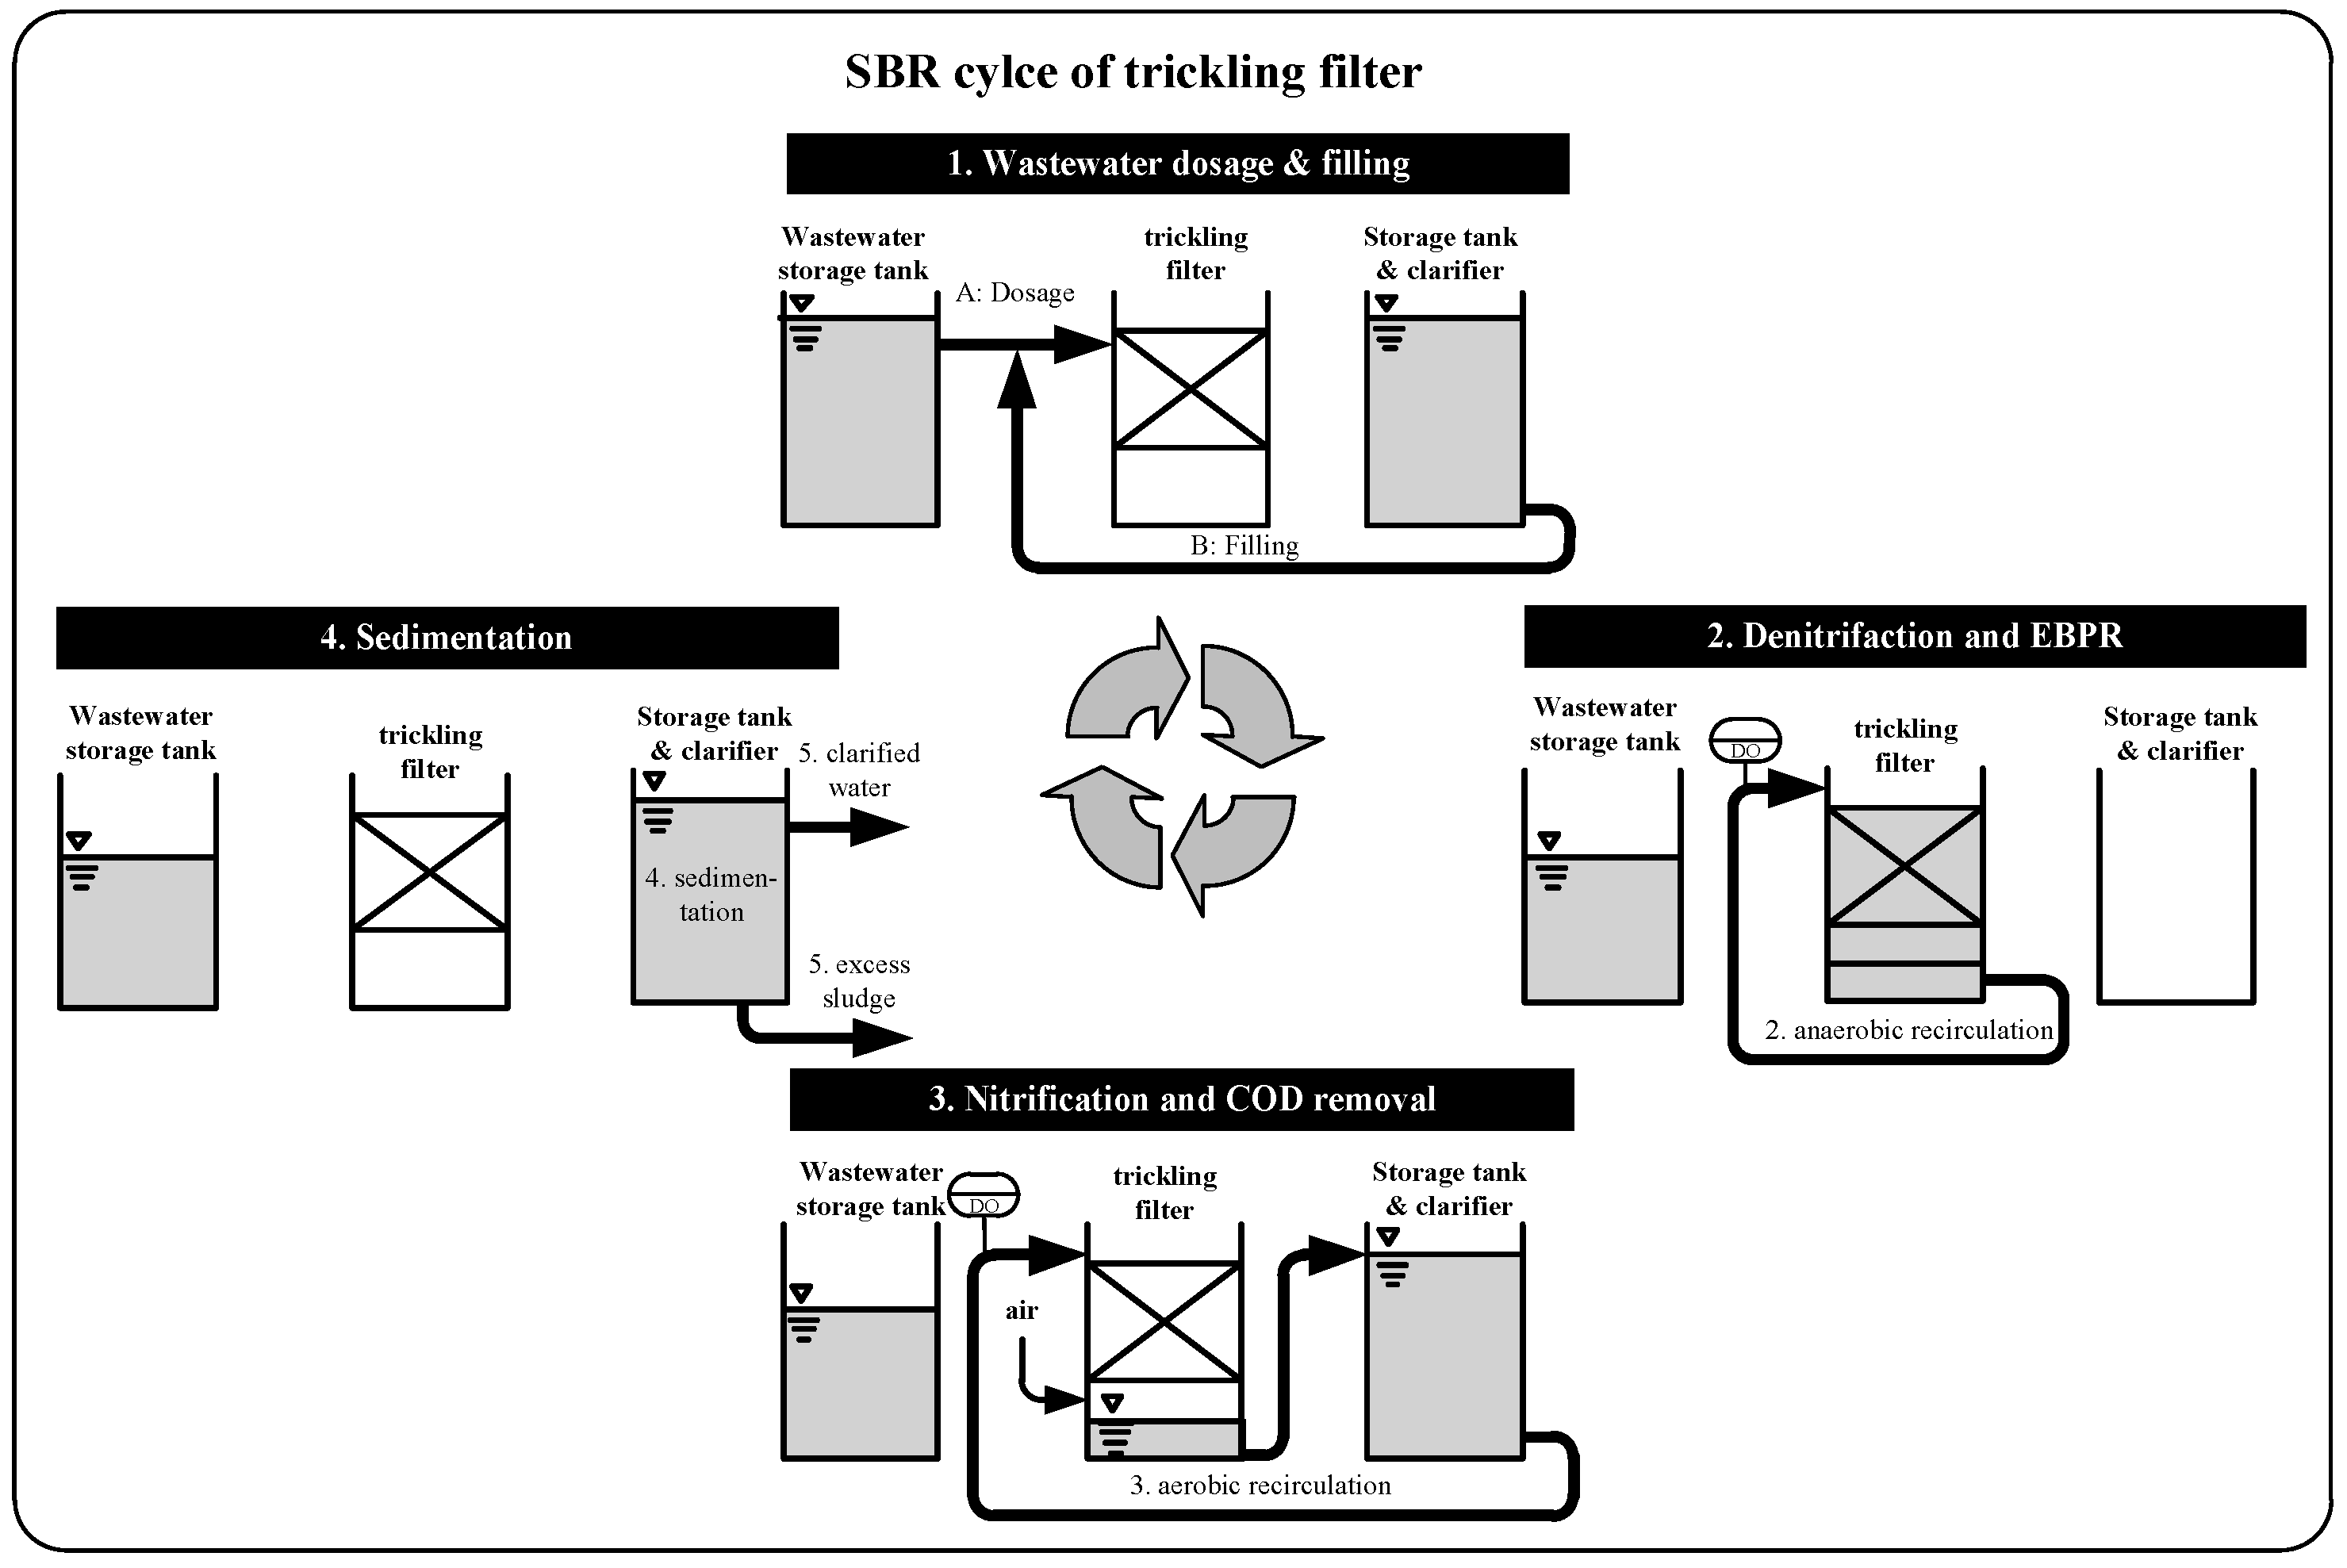
For the decay experiments, a small-scale SBR-TFS was operated. The steps of one SBR cycle including anoxic, anaerobic, and aerobic conditions are presented in Figure 5. The total volume of the trickling filter was 80 L with a packing bed volume of 54 L and a specific surface area of the biofilm carrier of 322 m2·m–3. During the starvation period, no stormwater was added and the SBR-TFS was only operated with the same treated wastewater.

2.2. Analytical Procedure

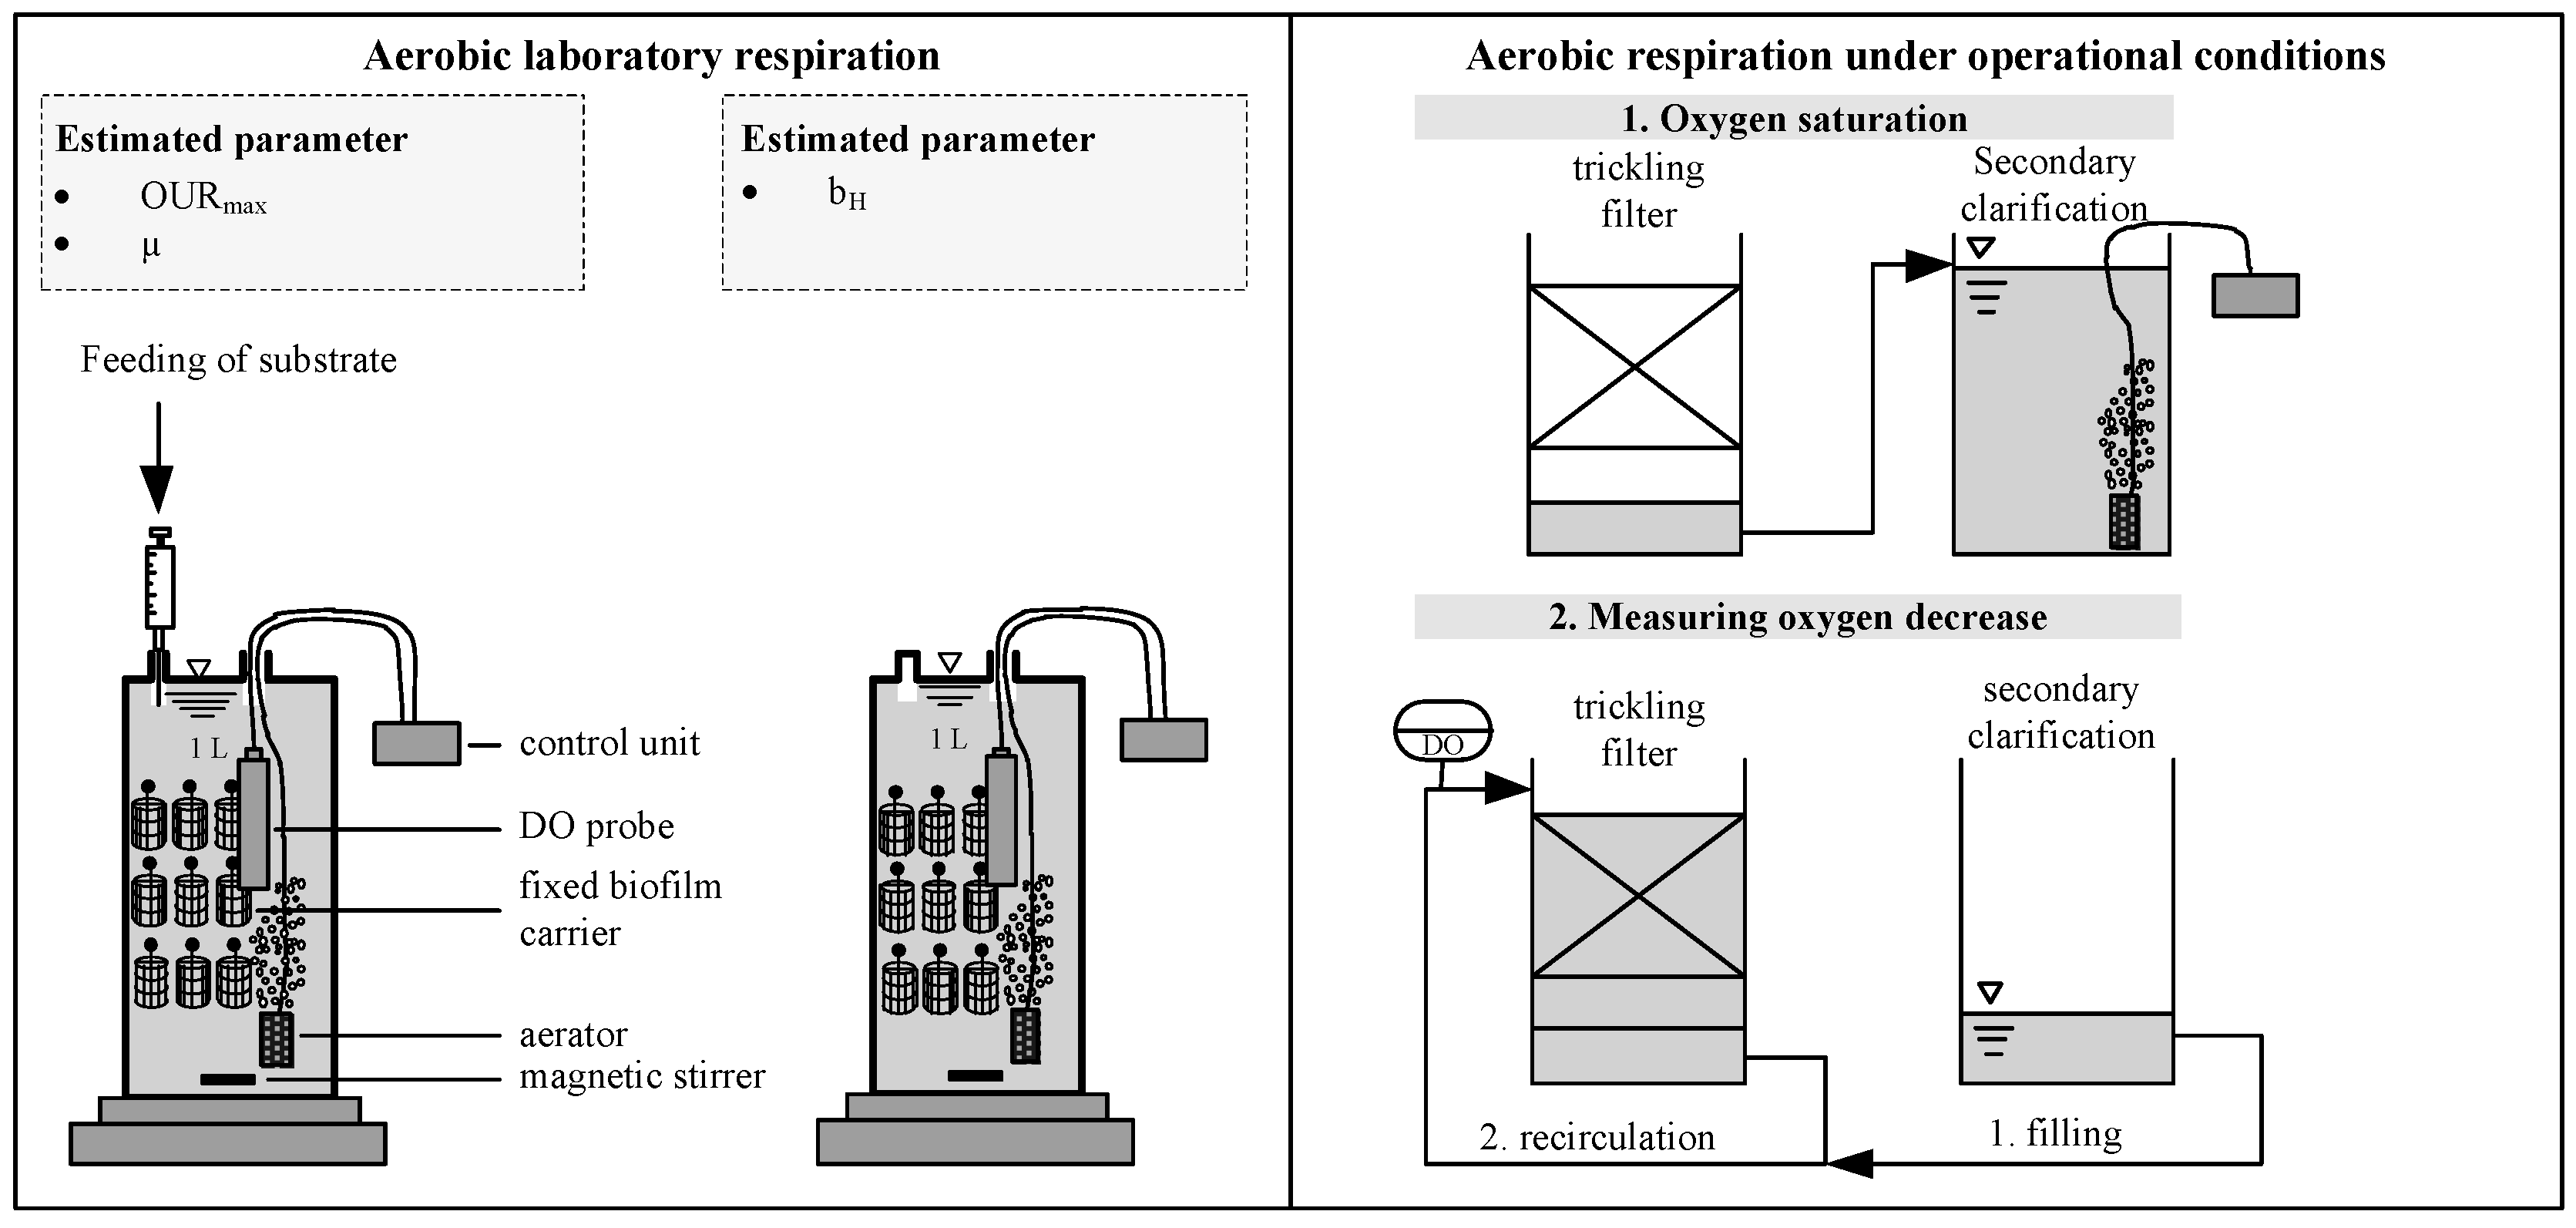
For measuring the decay rate of attached growth system, a modified OUR method was used for aerobic respiratory in laboratory scale. The schema is presented in Figure 6, left. OUR tests have been developed and widely applied for activated sludge systems [12,29]. In order to meet the conditions in the SBR-TFS system closely, activated sludge was replaced by 13 biofilm carrier fixed on a line in a 1 L reactor filled with tap water. The carriers were taken from the pilot plant described above, which was operated for 6 months to treat stormwater-runoff from a biogas plant. A magnetic stirrer provided a homogenous mixture. The dissolved oxygen DO was measured with an optical DO probe (time resolution: 1 s) and controlled in a range of 2–4 g m−3. OUR was calculated for each switch-off phase by a linear regression of the declining DO. During the starvation period, the reactor filled with biofilm carriers was aerated without substrate supply. From the resulting respirogramm during starvation, the endogenous respiration rate OURe was calculated according to [20], (see “mathematical model” below, Section 2.3).
For measuring maximum growth rates, the bacteria were fed with silage effluent as highly degradable substrate [20]. The substrate was injected into the reactor after 3, 4, 7, and 13 days of continuous starvation. After each dosage, the starvation period started again. After substrate dosage, the maximum respiration rate OURmax was calculated from the respirogramm in the same way as OURe. Assuming a typical value for fU and a substrate specific yield coefficient, the growth rate can be calculated from the endogenous and maximum OUR according to the mathematical model, described below.
In addition to the laboratory respiration tests, the oxygen consumption was measured in the pilot-scale trickling filter (Figure 6, right). To allow ponding, the aeration aperture at the bottom of the trickling filter is connected to a riser pipe, ending above the highest filling level. At aerobic conditions the same pipe is empty and provides air supply. To avoid unintended limitation of aeration, a fan on top of the rising pipe is sucking air through the unsubmerged trickling filter. For measuring the OUR in the trickling filter, an optical DO probe was installed in a measuring section of the recirculation pipe shortly before the rotary sprayer. The OUR measurement was performed in three succeeding steps: (1) the treated wastewater in the secondary clarification was aerated to oxygen saturation with an external aerator. (2) The oxygen saturated water was pumped to the trickling filter to the upper level. To minimize oxygen diffusion, the rotary sprayer was temporary replaced with a pipe that plunged into the water. (3) The water in the filled-up trickling filter was recirculated and the oxygen decline was recorded. This procedure results in one single OUR measuring point and was repeated each 2 days.

2.3. Mathematical Model

For mathematical derivation of endogenous decay rate based on the OUR method, see [20]. For endogenous respiration, OUR corresponds to the change of XH, reduced by an endogenous residue factor fU:
OUR e = ( 1 f U ) · dX H dt   [ g · m 3 · d 1 ]
The net growth of heterotrophic bacteria XH is the difference of growth and decay. Both growth and decay can be described as first order kinetics of actual biomass concentration. Additionally, there is a substrate dependency for the growth, usually expressed by a Monod kinetics (Equation (3)).
dX H dt = μ max · S K S + S · X H b H · X H   [ g · m 3 · d 1 ]
where bH is the decay rate of heterotrophic organism, μ is the bacteria growth rate, S is the substrate concentration, and KS is the substrate saturation coefficient.
The bacteria growth is stoichiometrically linked to the oxygen demand Equation (4):
OUR growth = μ max · 1 Y H Y H · X H   [ g · m 3 · d 1 ]
Substrate utilization results in oxygen consumption with respect to bacteria growth and endogenous respiration. With this in mind, the maximum oxygen consumption rate OURmax at time t(0) can be determined with Equation (5):
OUR max ( 0 ) = ( μ max · 1 Y H Y H + ( 1 f U ) · b H ) · X H   [ g · m 3 · d 1 ]
Substituting XH in Equation (5) by the rearranged Equation (2) results in:
OUR max ( 0 ) = ( μ max · 1 Y H Y H + ( 1 f U ) · b H ) OUR e ( 0 ) ( 1 f U ) · b H   [ g · m 3 · d 1 ]
Equation (6) can be arranged to calculate the maximum growth rate from respirometry:
μ max = Y H 1 Y H · ( 1 f U ) · b H · ( OUR max ( 0 ) OUR e ( 0 ) 1 )   [ g · m 3 · d 1 ]
The substrate specific yield coefficient YH of silage effluent was separately determined with 0.87 [20]. This rather high yield is attributable to its sugar-like ingredients as glucose have a yield coefficient of 0.90–0.91 [30]. The decay rate bH was calculated from the respirogramm and for fU, a typical value of 0.2 for heterotrophic biomass was assumed [12].

3. Results

3.1. Decay Rate During Starvation

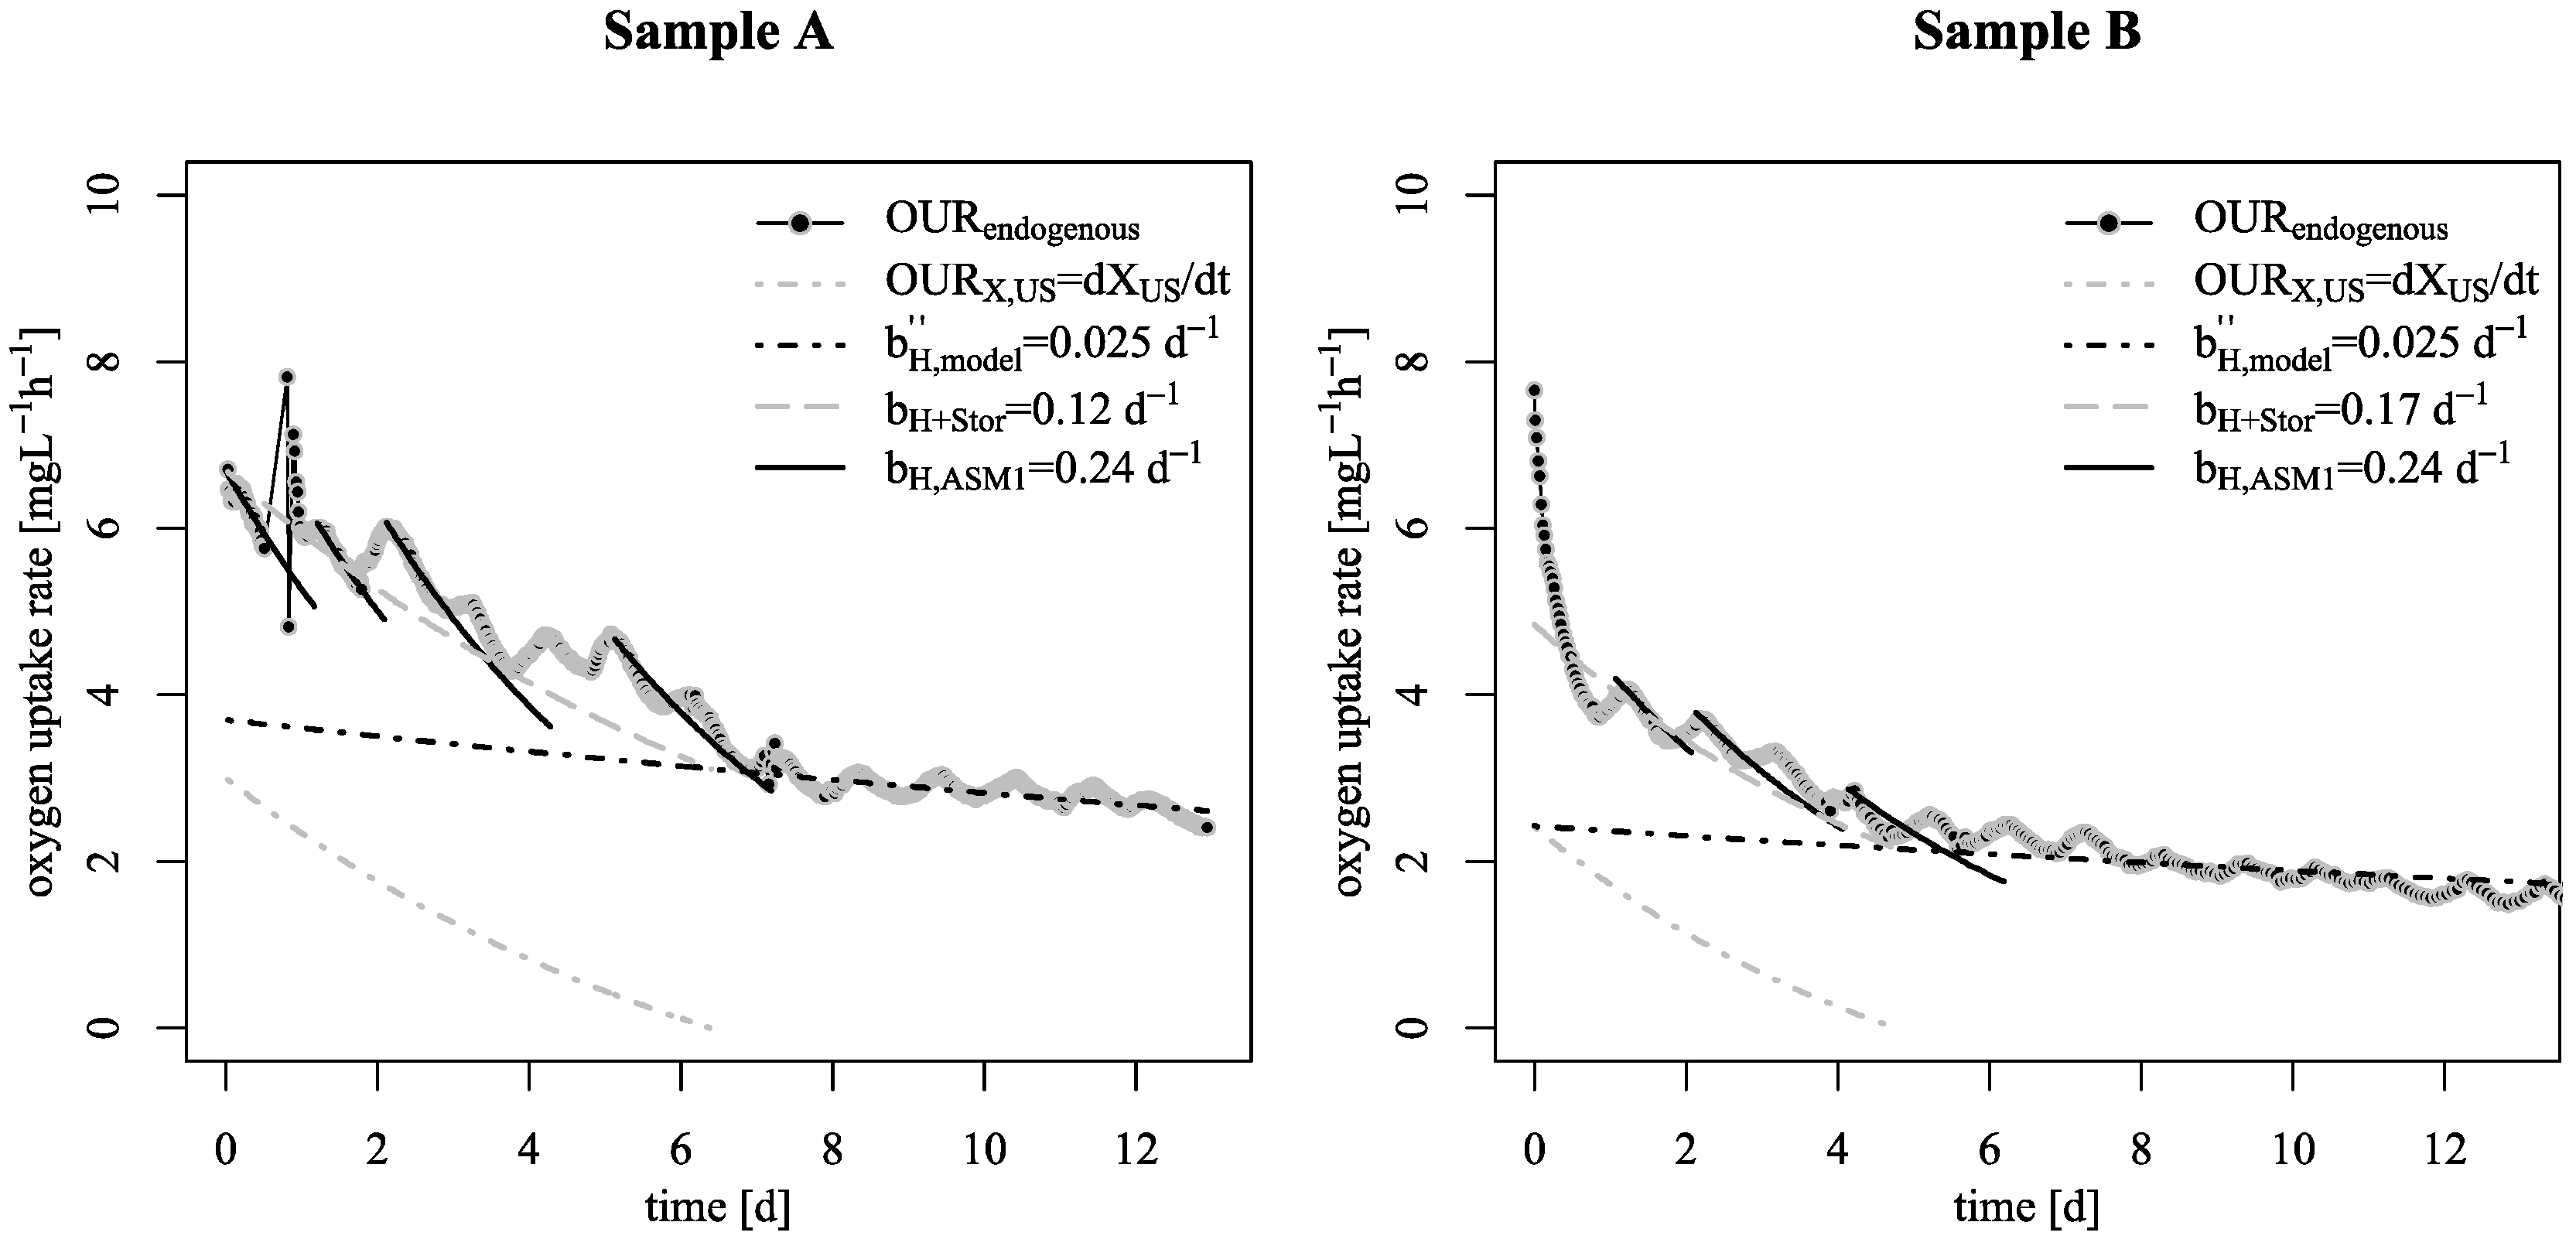
Typically, the decay rate of heterotrophic organism is graphically expressed as a logarithmical decrease of endogenous respiration for activated sludge system. However, for the investigated attached growth systems, this is hardly applicable as Figure 7 shows. The time series shows that repeatedly a logarithmical decrease of on average 15 h is followed by an exponential increase of on average 10 h with continuously decreasing amplitude. As the used biofilm carrier were grown with a thick biofilm, it seems that the organism makes organic compounds inside the biofilm stepwise accessible as substrate. The processes leading to periodic OUR increase are not clear yet. Working hypotheses are (i) hydrolysis of slowly degradable substrate in the biofilm and decay products, (ii) usage of intracellular storage of the organisms themselves and ribophagia or a combination of both. Layering and diffusional processes may be influencing, too [31,32].
According to the black line in Figure 7, the best model fit for endogenous decay rate during the time period of OUR decrease at the beginning of the experiment is the recommended decay rate of 0.24 d−1 as widely applied and proved in activated sludge modelling (ASM1) [21]. Considering both parts of the wavy respirogramm, the decreasing and increasing OUR, a net decay rate bH+stor of 0.17 d−1 in accordance with ASM3 would fit best for a certain time period, here 6–7 days. To express this switch of decay rate, the apparent OUR under endogenous condition is divided into OUR obtained by degradation of an additional fraction XUS (gray dot pointed line, Figure 7) and OUR obtained by base decay rate bH of active biomass (black dot pointed line, Figure 7). The total OUR is therefore the sum of both (gray dotted line). After this time period, the modelled net decay rate changes significantly to a lower value of 0.025 d−1, nearly a tenth of the conventionally applied decay rates. From this time on, all storage fractions are consumed and the sole decay rate is obtained (black dot pointed line).
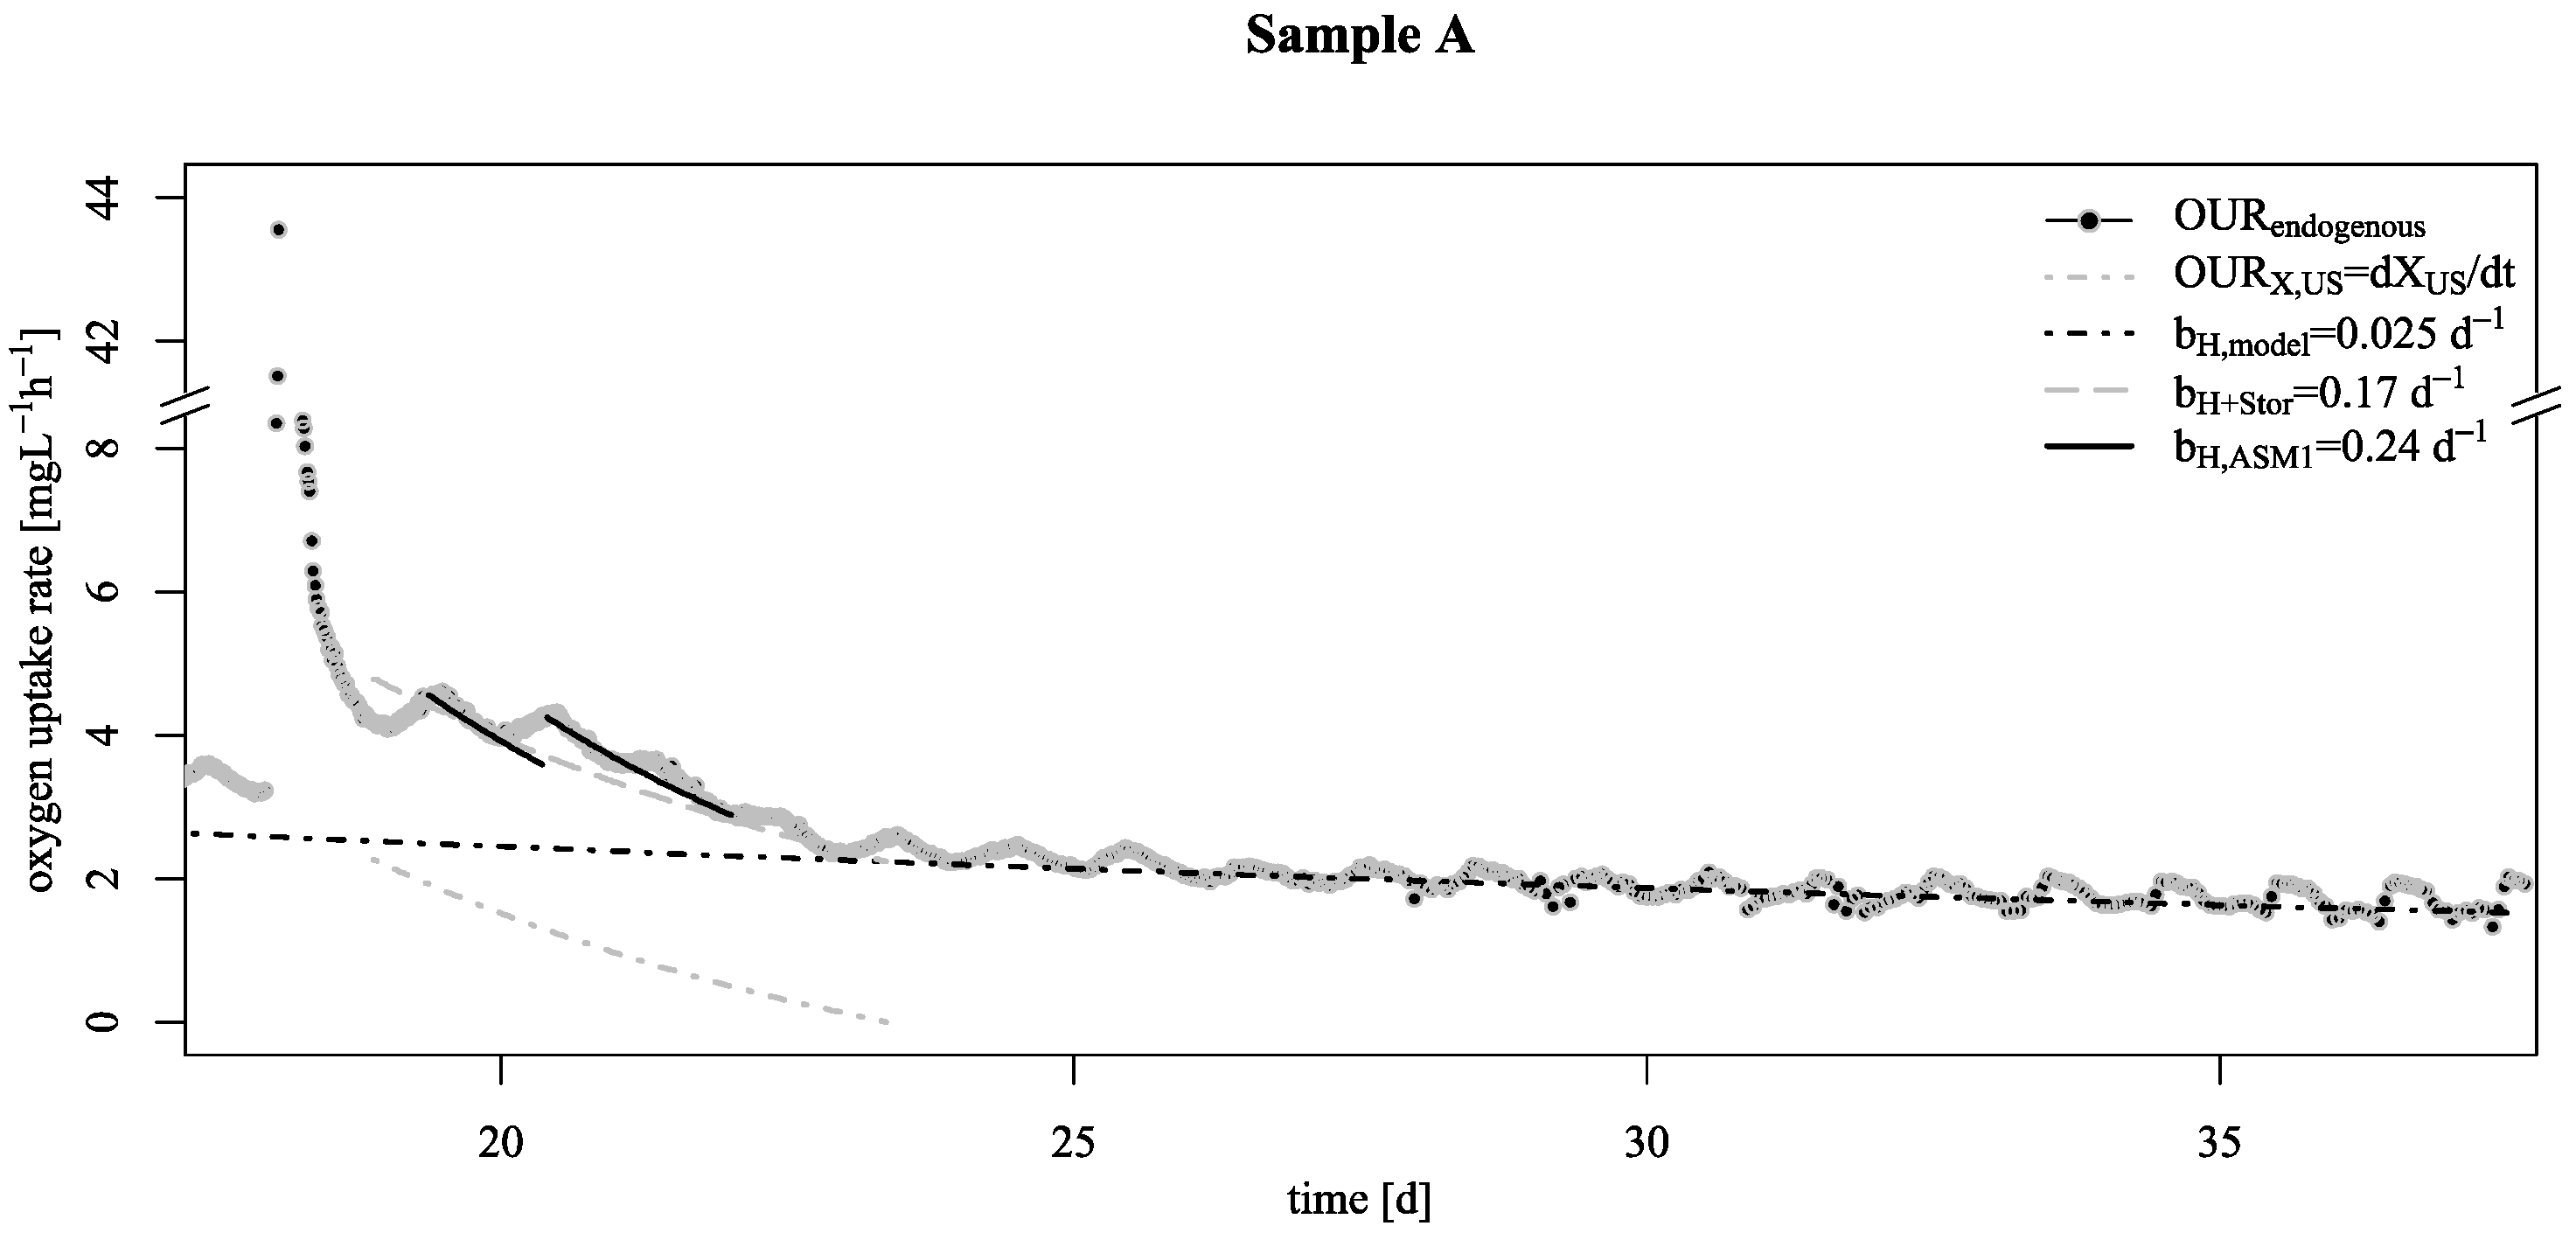
If the proposed concept of a base decay and a degradation of “ultra-slowly” degradable XUS applies, the net decay rate after substrate feed as sum parameter of decay and XUS degradation should be the same as in the beginning of the experiment (0.17 d−1) and then fall back to the base decay rate bH as soon as this additional storage fraction is consumed (0.025 d−1). To answer this, substrate was fed in excess to ensure an accumulation of XUS after 18 days of starvation. As Figure 8 shows, the brutto decay rate bH+stor increased again from 0.025 (before day 18) to 0.17 d−1 after substrate feed. After complete consumption of XUS, the decay rate during OUR decreased to 0.025 d−1 once more (=bH). Precisely, degradation of an addition fraction extended the base decay rate bH by this storage fraction, which can be expressed again with the degradation rate bH+stor. Hence, the best model fit for modelling the overall process for the base decay rate is 0.025 d−1 in addition with a consumption rate (=bH+stor) for XUS of 0.17−0.025 d−1. This shows that the alternation is only temporary and therefore can be related with an additional degradation process of the new fraction XUS.

3.2. Verification of the Low Decay Rate in Pilot Scale

The validity of at least two decay mechanisms—(1) a fast decay rate controlled by the availability of an additional XUS fraction and (2) a base decay rate in “real” starvation conditions—should be provable under operational conditions of the pilot plant. The proof can be performed with two experimental concepts: (i) decline of the “operational” OUR under starvation conditions and (ii) measuring maximum biomass activity after starvation. The latter experiment assumes that the identified base decay rate should preserve the biomass activity on a much higher level than calculated with the commonly proposed decay rate.
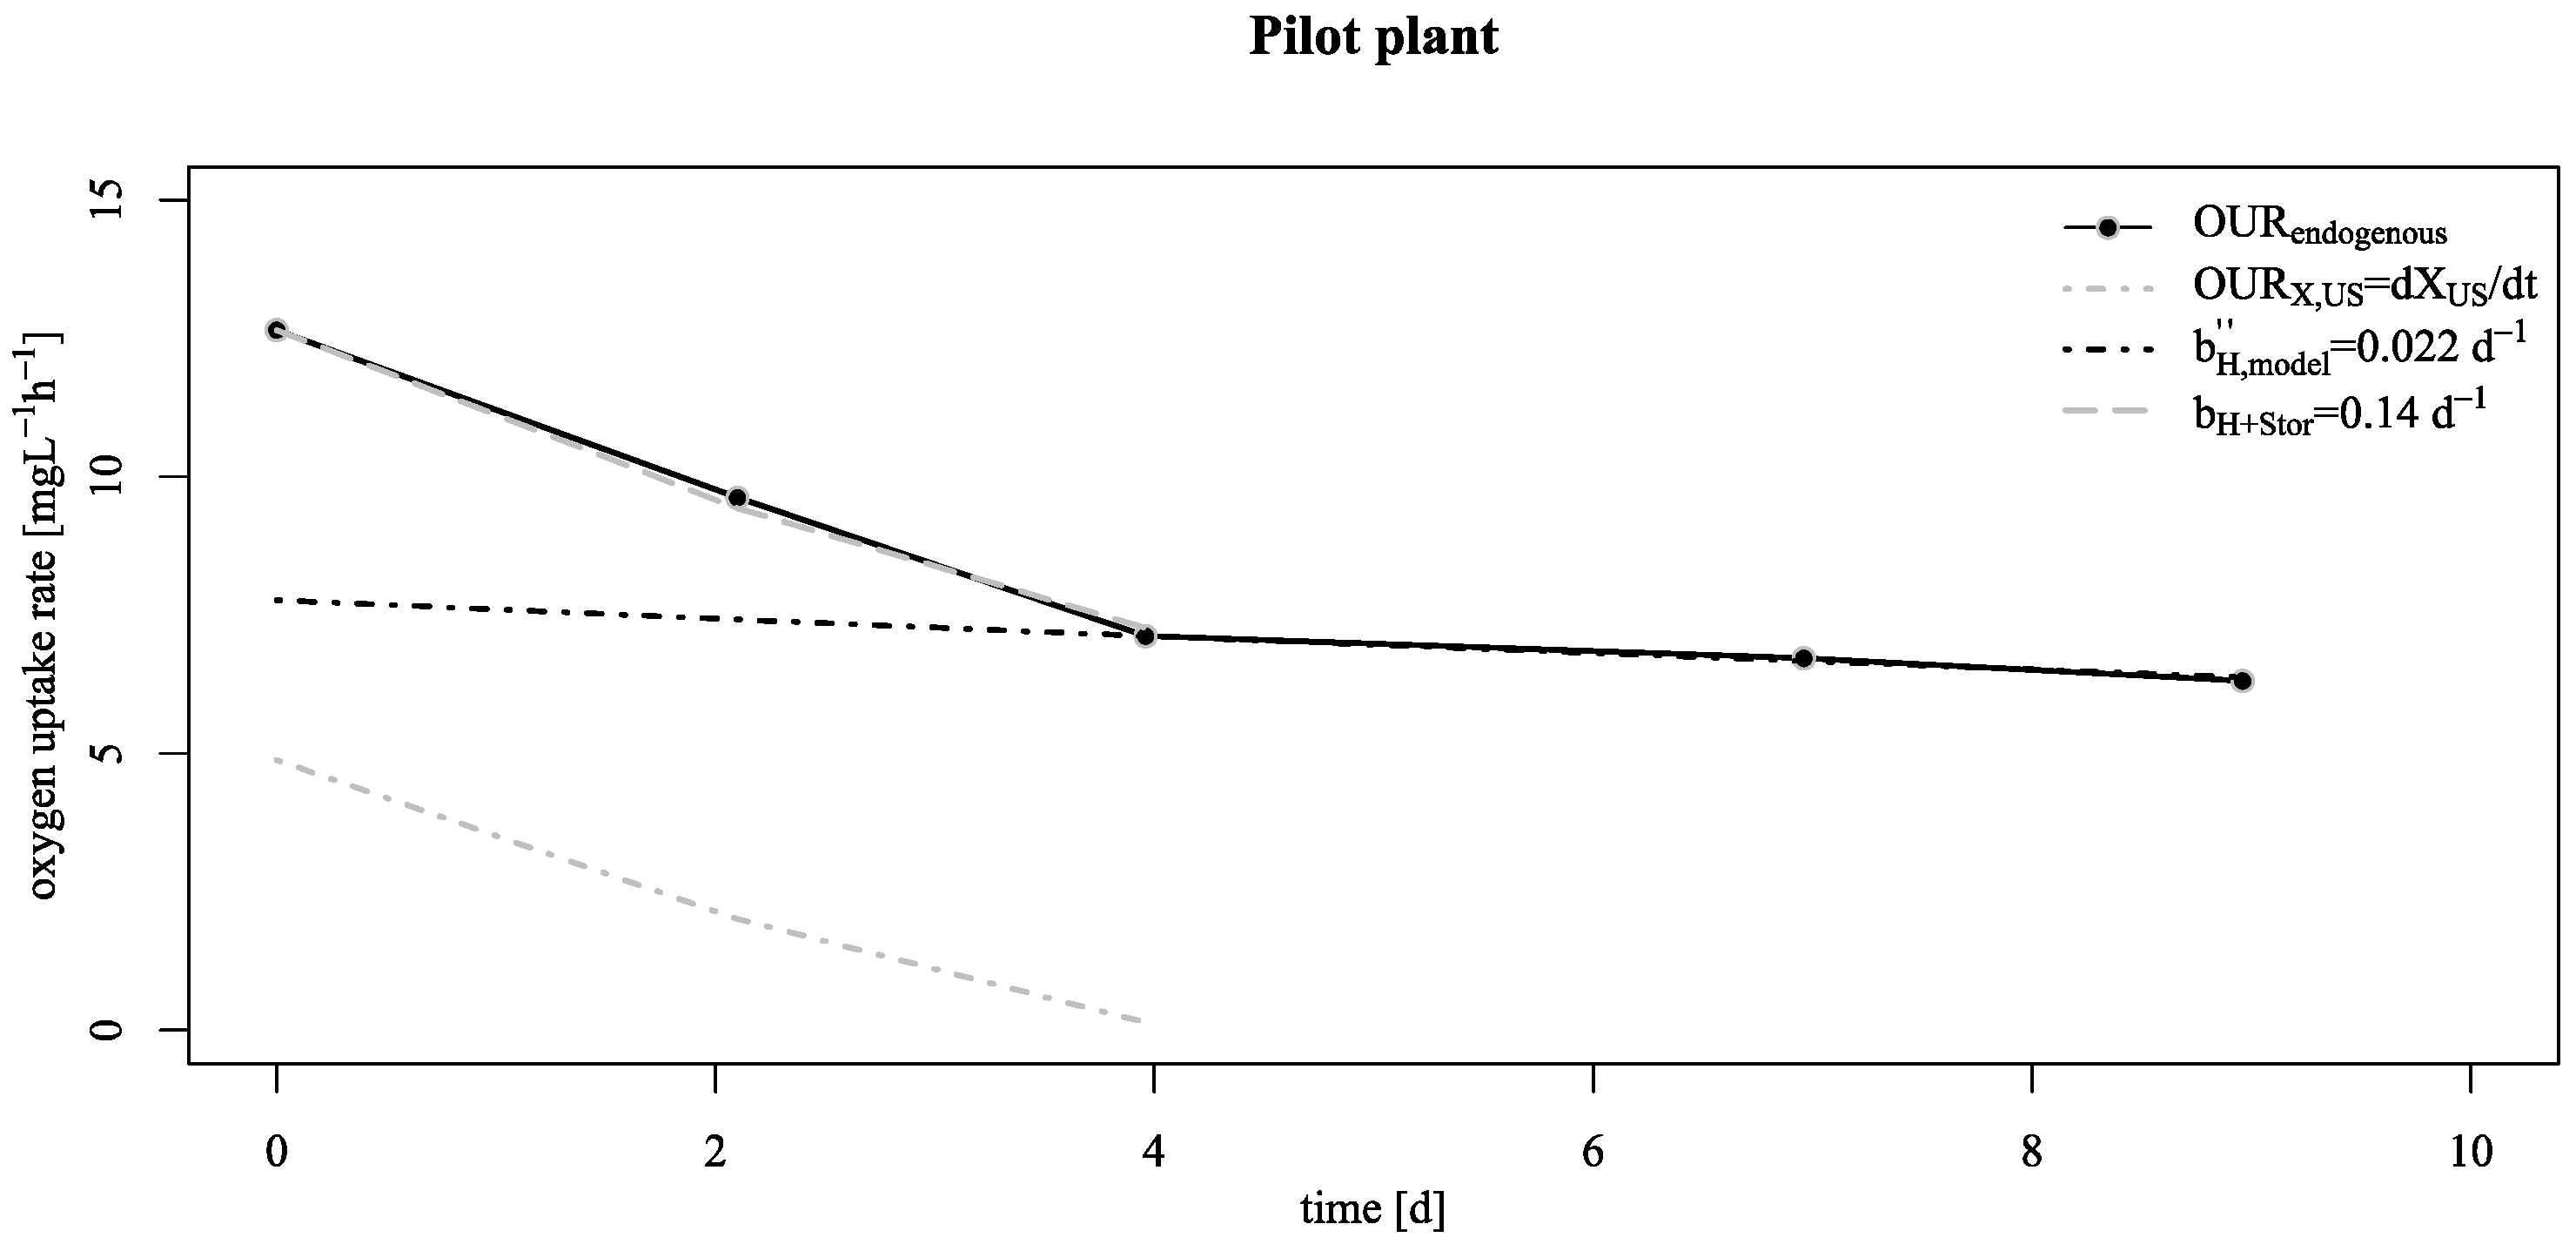
According to the schema of Figure 6 on the right, respirometry measurements were performed in the pilot plant. For this, the wastewater in the storage tank was aerated until oxygen saturation occurred and filled back to the highest level in the trickling filter. After filling, the inner recirculation was started to measure the dissolved oxygen decrease within the trickling filter. This decrease lasts up to 3 h, depending on the prior starvation period and the associated endogenous respiration rate (Figure 9). The figure illustrates the parametrized sequencing decay model after 9 days of starvation. Until the fourth day of starvation, the best model fit is a net decay rate of 0.14 d−1, including degradation of “ultra-slow” degradable COD fraction XUS (gray dotted line) and pure decay (black dotted line). At this point, XUS is consumed and the decay rate decreases to the base decay rate of 0.022 d−1. Separating both processes would yield a decay rate for the storage products of 0.14 d−1 (−0.022 d−1). In conclusion, the results show that the findings of a low decay rate are indeed representative under real operational conditions for treating stormwater-runoff from silo facilities.
Under starvation conditions, the decrease of OURmax represents (according to Equation (5)) directly the reduction of active biomass XH. Knowing the initial OURmax(0) and decay rate bH, OURmax at certain times of starvation can be calculated with Equation (8):
OUR max , calc . ( t ) = OUR max ( 0 ) · e b H · t   [ g · m 3 · d 1 ]
For this, silage effluent was dosed into the reactor after 5, 8, and 13 days of continuous starvation as depicted in Figure 10. As shown in Figure 10 on the left, the observed and calculated OURmax according to Equation (8) are nearly the same even after 13 days of continuous starvation. Therefore, it can be inferred that the decay rate of about 0.025 d−1 is true and is suitable for an adequate prediction of biomass decrease under long starvation periods. The respirogramm for the case of 13 days of continuous starvation is shown in Figure 10 on the right. Based on the measurements of OURe and OURmax and considering Equation (7), a growth rate μ m a x of 7.9 d−1 results at a constant YH and fU at a temperature of 25 °C. However, with respect to typical growth rates of 6 d−1 at 20 °C, a growth rate of approximately 8.5 d−1 would be expected. Therefore, the estimated rate is within the expected range.

4. Discussion

The results showed that long starvation periods in the investigated biofilms are linked to a significant lower decay rate of just a tenth of the recommended decay rate used in the ASM [12]. Experiments with activated sludge support these findings [22,23]. Actually, both decay rate and particulate inert fraction are rather a function of nutritional state than a constant. For rather steady state substrate supply as common in domestic wastewater treatment plants, this functional relationship is neither detectable nor relevant. However, for long or permanent extreme starvation conditions, the approach of the ASM is not sufficient to explain an alternation of the decay rate. This limitation could be overcome by slight changes of the modelling concept. The actual decay (as irreversible die-off of biomass) needs to be described with the observed much lower decay rate, but is superimposed by decay of “ultra-slow degradable” substrate XUS, which is not “tapped” under normal conditions. The identity of XUS is not clear yet. It can be thought as (i) cell internal reserve substrate or (ii) hardly accessible external substrate or a mix of both. From a modelling perspective, taking it as external substrate is the simplest approach, since XUS formation is in this case decoupled from bacterial growth. This conceptual idea could also explain the wavy decline of decay, especially if combined with the death-regeneration approach. Transformation processes within the rather thick biofilm used in our experiments were probably diffusion controlled and oxygen limited in deeper layers. The diffusion limitation and oxygen penetration into the biofilm are presented in the Supplementary Materials. However, in the death-regeneration approach, decay is defined to be independent from oxygen supply. Therefore, independent from the aerobic state, biodegradable fractions are released by decay of organism but not used due to oxygen limitation. The biodegradable fractions are preserved in the inward layer of the biofilm carrier. The preserved COD fractions in the lower layers would lead to an increased respiration rate as soon as the upper layer is fully decayed. This short-term regrowth is followed by aerobic decay of the newly formed biomass, leading to the wave-like behavior of the observed respiration rates. This layering effect causing diffusion limitations is often associated with a simultaneous nitrification and denitrification in biofilm systems [27,33]. In contrast to the biofilm experiments in this study, experiments with activated sludge will probably not allow such a clear distinction between decay of XUS and actual decay of biomass due to the stochastic distribution of both fractions. Accordingly, respirometry measurement would show a more continuous adaptation of the decay rate.
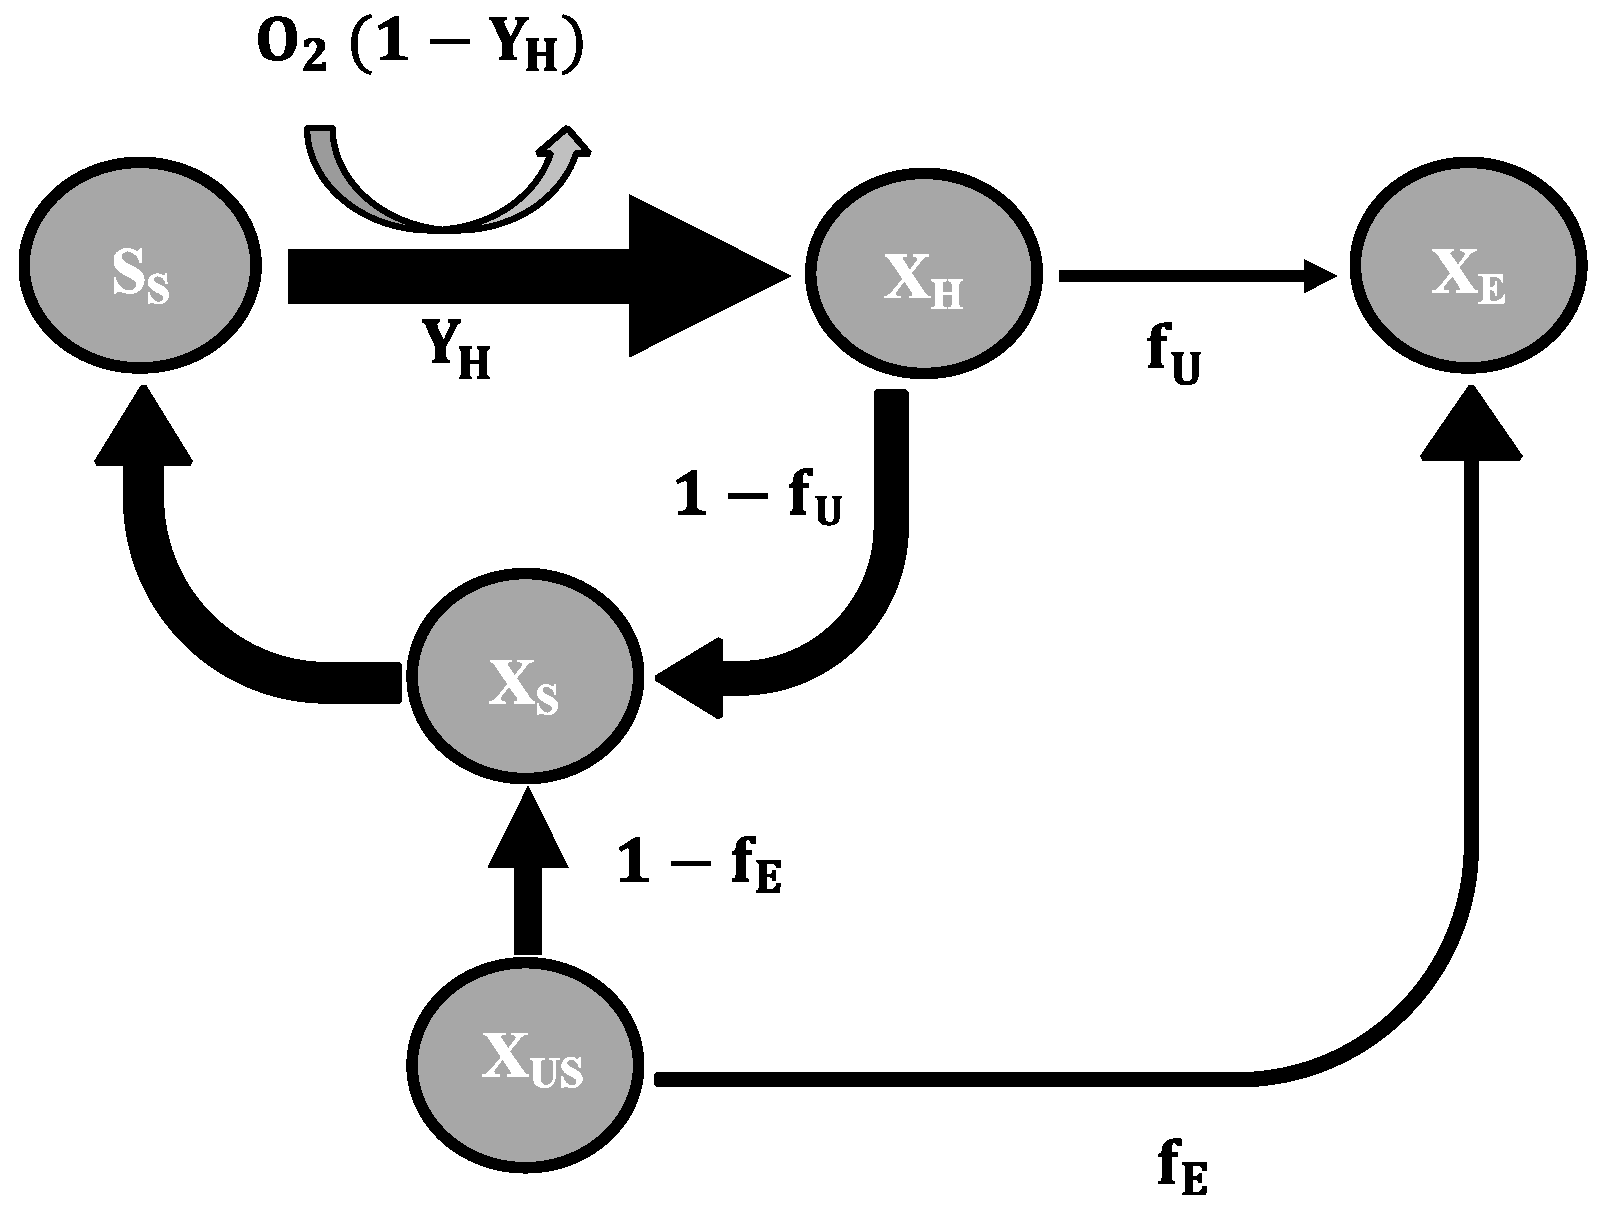
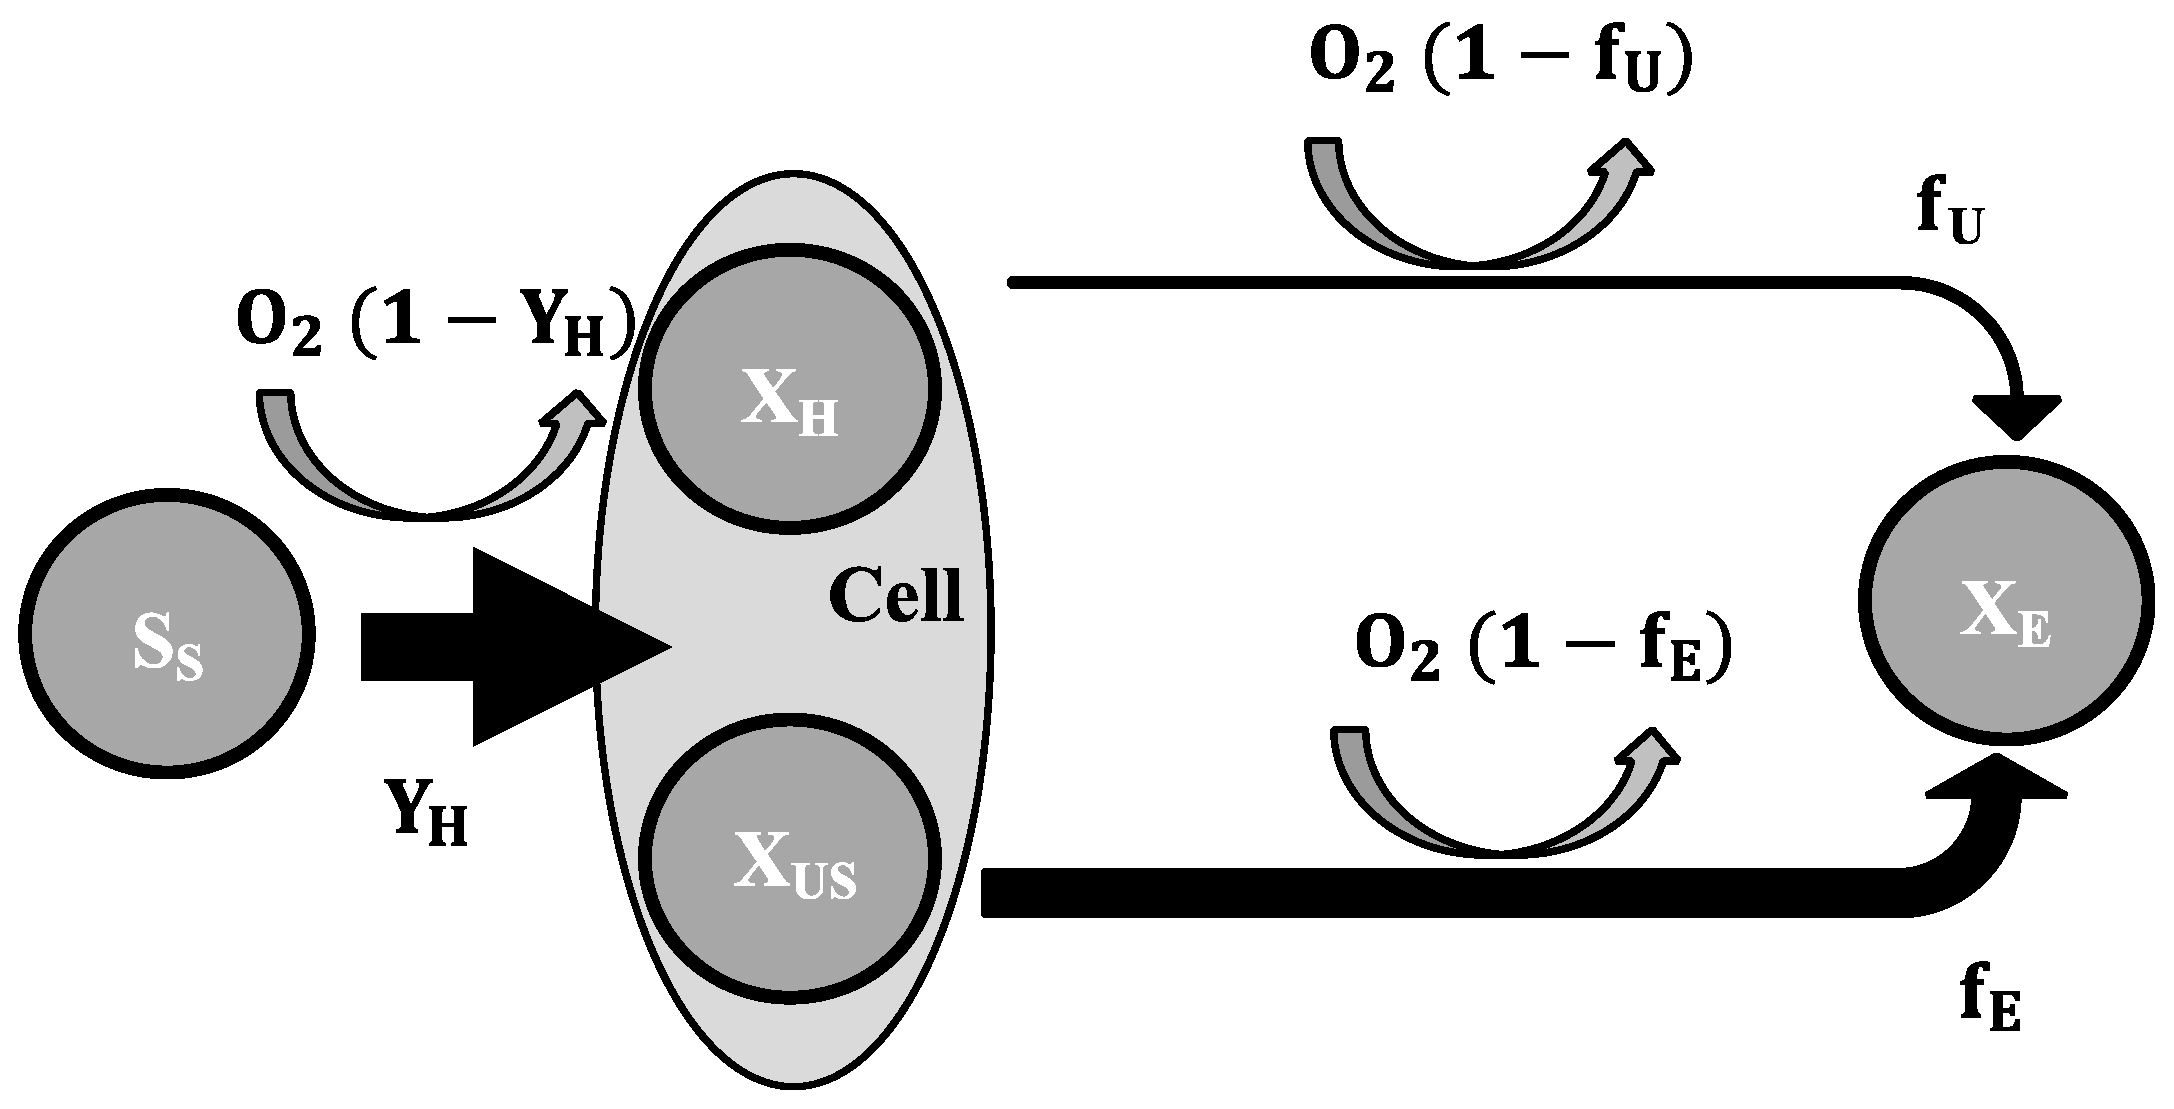
The extension of the death-regeneration approach by an “ultra-slow” degradable XUS fraction as an external substrate is illustrated in Figure 11. It can be made available via hydrolyzation to a slow degradable fraction (1 − fE) and is then consumed as SS. A small ratio fE remains as endogenous residue XE. The hydrolyzation itself is poorly understood, yet, due to the variety of substrates and apart from this, the experiments in the literature are mainly accomplished with pure substrates [34]. Most model concepts (for instance ASM1, ASM2d, ASM3) are based on a one step hydrolyzation. In the approach proposed here, the XUS fraction is firstly hydrolyzed into XS and further hydrolyzed into SS. However, XUS hydrolyzation is inhibited by the concentration of the better accessible XS and will only be degraded under real starvation conditions when XS is fully degraded. Once XUS is consumed, only the base decay rate is obtained. Mathematically, this can be considered with an inversed Monod kinetic (Equation (10)). The key idea behind this is that the term for XUS is “inactive” as long as XS is still available (Equation (9) is above zero). With decreasing XS, the term becomes more and more “active” and is most active when XS drops to zero. Now, XUS becomes the limiting step measured in respirometry. As soon as XUS is degraded also, the term reaches zero and only the base decay rate is active (see Equation (7)).
dX S dt = X H · k h · ( X S X H K S + X S X H )   [ g · m 3 · d 1 ]
dX US dt = X H · k h · ( X US X H K S + X US X H · K S K S + X S X H )   [ g · m 3 · d 1 ]
Similar to the death-regeneration approach, the endogenous approach can be extended in a similar way (Figure 12). Here, the possibility of a cell internal storage fraction was exemplarily used to integrate the additional XUS fraction. In this approach, the fast-degraded substrate during endogenous conditions (illustrated with a bold line) internal storage fraction XUS is directly degraded into the endogenous residue XE, without prior hydrolysis. Both base decay and XUS consumption are running parallel. The degradation rate of XUS can be expressed as the sum decay rate of storage product and base decay rate bH+stor discussed above minus the base decay rate (bH+stor − bH). The irreversible decay of active biomass is running in parallel with the observed much lower decay rate bH (illustrated with a thin line). Summarizing, as long as XUS is still available as substrate, the brutto degradation rate bH+stor is suitable as best model fit for describing the OUR decrease with time. As soon as XUS is fully degraded, the sole decay rate bH is obtained.
dX H dt = X H · b H   [ g · m 3 · d 1 ] .
b H = 0.025   d 1
dX US dt = X H · k h · ( X US X H K US + X US X H ) = X H · ( b H + stor b H )   [ g · m 3 · d 1 ]
b H + stor = 0.17   d 1
dX E dt = f E · X US · ( b H + stor b H ) + f U · X H · b H   [ g · m 3 · d 1 ]
f U = 0.20
f E = 0.48
A classification of XUS as a cell internal COD fraction or as an external fraction which can be made available to heterotrophic organism by a multi-step hydrolyzation depends on the model approach taken and can both be easily integrated. Compared to the complex adaptation of microorganisms to varying nutritional and environmental conditions, both approaches are still rather conceptual but would sufficiently describe the observed change of decay rate.

5. Conclusions

The aim of this work was to quantify the reduction of biomass activity in biofilm systems suffering from periodic starvation conditions. For this, two experimental approaches were combined: (i) OUR experiments with biofilm carriers taken from a pilot-scale trickling filter, (ii) adapted OUR experiments of the complete trickling filter. According to the findings of this work, the following conclusions are drawn:
  • Starvation of biofilm carrier was characterized by wavy increase and decrease of endogenous respiration, ending at a surprisingly low base decay rate. Justifying this effect with either the existing death-regeneration model or the endogenous respiratory model is not a straightforward task;
  • A possible explanation approach is the layering and the associated oxygen diffusion limitations, which preserves the lower layers from real degradation of COD but not from decay;
  • However, even taking these biofilm specific conditions apart: the base decay rate is considerably lower than the recommended value in existing ASM;
  • This lower decay rates allow a conservation of biological activity over long starvation periods as shown by reactivation experiments at the pilot SBR trickling filter;
  • To explain these findings, the common one step decay model needs be divided into at least two processes: (i) a fast degradation of cell internal reserves and/or hardly degradable external COD, named here as “ultra-slow” degradable COD XUS and (ii) the net decay of active biomass;
  • Based on recent publications, it can be assumed that these findings are transferrable to activated sludge systems;
  • The findings have practical consequences for aerobic biologic reactors suffering from long starvation conditions: (i) they should survive those conditions better than commonly presumed, (ii) biomass production is larger and aeration demand is lower than commonly presumed.
These findings seem to unmask a so far not relevant simplification of biological processes leading to knowledge a gap between reality and the model [34]. It became only evident here, due to the changed viewpoint of a new treatment challenge: intermittent runoff with high organic pollution. However, other investigations with activated sludge show similar findings [22], too. It should be worthwhile to revise the current approaches before extrapolating it to uninvestigated operational conditions.

Supplementary Materials

The following are available online at https://www.mdpi.com/2073-4441/12/5/1249/s1, Figure S1: Diffusion limitation with respect of oxygen penetration into the biofilm.

Author Contributions

Conceptualization, J.T. and M.C.; Methodology, J.T. and M.C.; Software, M.C.; Validation, M.C.; Formal Analysis, J.T.; Investigation, M.C.; Data Curation, M.C.; Writing—Original Draft Preparation, J.T. and M.C.; Writing—Review and Editing, J.T.; Visualization, M.C.; Supervision, J.T.; Project Administration, M.C.; Funding Acquisition, J.T. All authors have read and agreed to the published version of the manuscript.

Funding

This research was funded by the Federal Ministry for Education and Research [BMBF] grant number [FKZ WQ1361B].

Conflicts of Interest

The sponsors had no role in the design, execution, interpretation, or writing of the study.

Abbreviations

Nomenclature
Asurface area
ASMactivated sludge model
ASSactivated sludge system
bdecay rate
BFbiofilm
CODchemical oxygen demand
Ddiffusion coefficient
DOdissolved oxygen
EBPRenhanced biological phosphorus removal
fresidue factor
krate constant
Lcharacteristic length
nnumber of
Noxygen demand for nitrification
OURoxygen uptake rate
rrate expression
Sdissolved fraction
SBRsequence batch reactor
SBR-TFSSBR-trickling filter system
SRTsludge retention time
ßoxygen penetration factor
ttime
Xparticulate fraction
Yyield coefficient
Indices
0initial
degdegraded
Eendogenous residue
eendogenous
effeffluent
elielimination
ESexcess sludge
ffiltrated
Ffluid
Hheterotrophic organism
H+stordegradation of heterotrophic organism and storage fraction
hhomogeneous
iinert
i,BMinert biomass residue
ininfluent
Nnitrification
Ssubstrate
spspecific
tottotal
Uunbiodegradable
USultra slow

References

  1. Daigger, G.T.; Grady, C.P.L. An assessment of the role of physiological adaptation in the transient response of bacterial cultures. Biotechnol. Bioeng. 1982, 24, 1427–1444. [Google Scholar] [CrossRef] [PubMed]
  2. Hood, M.A.; Guckert, J.B.; White, D.C.; Deck, F. Effect of nutrient deprivation on lipid, carbohydrate, DNA, RNA, and protein levels in Vibrio cholerae. Appl. Environ. Microbiol. 1986, 52, 788–793. [Google Scholar] [CrossRef] [PubMed] [Green Version]
  3. White, D. Physiology and biochemistry of prokaryotes; Oxford University Press: Oxford, UK, 2000. [Google Scholar]
  4. Morita, R.Y. Bioavailability of Energy and the Starvation State; Springer: Boston, MA, USA, 1993; pp. 1–23. [Google Scholar]
  5. Cebollero, E.; Reggiori, F.; Kraft, C. Reticulophagy and ribophagy: Regulated degradation of protein production factories. Int. J. Cell Biol. 2012, 2012, 1–9. [Google Scholar] [CrossRef] [PubMed]
  6. MacIntosh, G.C.; Bassham, D.C. The connection between ribophagy, autophagy and ribosomal RNA decay. Autophagy 2011, 7, 662–663. [Google Scholar] [CrossRef] [PubMed] [Green Version]
  7. Kurland, G.C.; Mikkola, R. The Impact of Nutritional State on the Microevolution of Ribosomes, Starvation in Bacteria; Kjelleberg, S., Ed.; Plenum Press: New York, NY, USA, 1993; pp. 225–237. [Google Scholar]
  8. Henze, M.; Gujer, W.; Van Loosdrecht, M.C.M.; Mino, T. Activated sludge models ASM1, ASM2, ASM2d and ASM3; IWA Publishing: London, UK, 2000. [Google Scholar]
  9. Wanner, O.; Gujer, W. A Multispecies Biofilrn Model. Biotechnol. Bioeng. 1986, 28, 314–328. [Google Scholar] [CrossRef]
  10. Gikas, P.; Livingston, A.G. Specific ATP and specific oxygen uptake rate in immobilized cell aggregates: Experimental results and theoretical analysis using a structured model of immobilized cell growth. Biotechnol. Bioeng. 1997, 55, 660–673. [Google Scholar] [CrossRef]
  11. McKinney, R.E. Complete mixing activated sludge. Water Sew. Work. 1960, 107, 69. [Google Scholar]
  12. Gujer, W.; Henze, M.; Mino, T.; Loosdrecht, M.C.M. Van Activated sludge model No. 3. Water Sci. Technol. 1999, 39, 183–193. [Google Scholar] [CrossRef]
  13. Dold, P.L.; Ekama, G.; Marais, G.v.R. A General Model for the Activated Sludge Process. Water Res. Public Heal. Eng. 1980, 12, 47–77. [Google Scholar]
  14. Wanner, J.; Kucman, K.; Grau, P. Activated sludge process combined with biofilm cultivation. Water Res. 1988, 22, 207–215. [Google Scholar] [CrossRef]
  15. Wanner, O.; Morgenroth, E. Biofilm modeling with AQUASIM. Water Sci. Technol. 2004, 49, 137–144. [Google Scholar] [CrossRef] [PubMed] [Green Version]
  16. Spanjers, H.; Vanrolleghem, P. Respirometry as a tool for rapid characterization of wastewater and activated sludge. Water Sci. Technol. 1995, 31, 105–114. [Google Scholar] [CrossRef]
  17. Di Trapani, D.; Capodici, M.; Cosenza, A.; Di Bella, G.; Mannina, G.; Torregrossa, M.; Viviani, G. Evaluation of biomass activity and wastewater characterization in a UCT-MBR pilot plant by means of respirometric techniques. Desalination 2011, 269, 190–197. [Google Scholar] [CrossRef]
  18. Ramdani, A.; Dold, P.L.; Déléris, S.; Lamarre, D.; Gadbois, A.; Comeau, Y. Biodegradation of the endogenous residue of activated sludge. Water Res. 2010, 44, 2179–2188. [Google Scholar] [CrossRef] [PubMed]
  19. Tränckner, J.; Wricke, B.; Krebs, P. Estimating nitrifying biomass in drinking water filters for surface water treatment. Water Res. 2008, 42, 2574–2584. [Google Scholar] [CrossRef] [PubMed]
  20. Cramer, M.; Tränckner, J.; Schelhorn, P.; Kotzbauer, U. Degradation kinetics and COD fractioning of agricultural wastewaters from biogas plants applying biofilm respirometry. Environ. Technol. 2019, 17, 1–11. [Google Scholar] [CrossRef]
  21. Marais, G.v.R.; Ekama, G.A. The activated sludge process Part 1—Steady state behaviour. Water S.A. 1976, 2, 163–200. [Google Scholar]
  22. Friedrich, M.; Takács, I.; Tränckner, J. Experimental Assessment of the Degradation of “Unbiodegradable” Organic Solids in Activated Sludge. Water Environ. Res. 2016, 88, 272–279. [Google Scholar] [CrossRef]
  23. Friedrich, M.; Takács, I.; Tränckner, J. Physiological adaptation of growth kinetics in activated sludge. Water Res. 2015, 85, 22–30. [Google Scholar] [CrossRef]
  24. Cramer, M.; Rinas, M.; Kotzbauer, U.; Tränckner, J. Surface contamination of impervious areas on biogas plants and conclusions for an improved stormwater management. J. Clean. Prod. 2019, 217, 1–11. [Google Scholar] [CrossRef]
  25. Ye, L.; Hu, S.; Poussade, Y.; Keller, J.; Yuan, Z. Evaluating a strategy for maintaining nitrifier activity during long-term starvation in a moving bed biofilm reactor (MBBR) treating reverse osmosis concentrate. Water Sci. Technol. 2012, 66, 837–842. [Google Scholar] [CrossRef] [PubMed]
  26. Buitrón, G.; Moreno-Andrade, I. Biodegradation kinetics of a mixture of phenols in a sequencing batch moving bed biofilm reactor under starvation and shock loads. J. Chem. Technol. Biotechnol. 2011, 86, 669–674. [Google Scholar] [CrossRef]
  27. Cramer, M.; Tränckner, J.; Kotzbauer, U. Kinetic of denitrification and enhanced biological phosphorous removal (EBPR) of a trickling filter operated in a sequence-batch-reactor-mode (SBR-TF). Environ. Technol. 2019, 1–10. [Google Scholar] [CrossRef]
  28. Metcalf, E.; Eddy, M. Wastewater Engineering: Treatment and Resource Recovery; McGraw-Hill: New York, NY, USA, 2014. [Google Scholar]
  29. Friedrich, M.; Takacs, I. A new interpretation of endogenous respiration profiles for the evaluation of the endogenous decay rate of heterotrophic biomass in activated sludge. Water Res. 2013, 47, 5639–5646. [Google Scholar] [CrossRef]
  30. Dircks, K.; Pind, P.F.; Mosbæk, H.; Henze, M. Yield determination by respirometry—The possible influence of storage under aerobic conditions in activated sludge. Water S.A. 1999, 25, 69–74. [Google Scholar]
  31. Kwok, W.K.; Picioreanu, C.; Ong, S.L.; Van Loosdrecht, M.C.M.; Ng, W.J.; Heijnen, J.J. Influence of biomass production and detachment forces on biofilm structures in a biofilm airlift suspension reactor. Biotechnol. Bioeng. 1998, 58, 400–407. [Google Scholar] [CrossRef]
  32. Kuenen, J.G.; Jorgensen, B.B.; Revsbech, N.P. Oxygen Microprofiles of Trickling Filter Biofilms. Water Res. 1986, 20, 1589–1598. [Google Scholar] [CrossRef] [Green Version]
  33. Virdis, B.; Read, S.T.; Rabaey, K.; Rozendal, R.A.; Yuan, Z.; Keller, J. Biofilm stratification during simultaneous nitrification and denitrification (SND) at a biocathode. Bioresour. Technol. 2011, 102, 334–341. [Google Scholar] [CrossRef]
  34. Hauduc, H.; Rieger, L.; Oehmen, A.; van Loosdrecht, M.C.M.; Comeau, Y.; Héduit, A.; Vanrolleghem, P.A.; Gillot, S. Critical review of activated sludge modeling: State of process knowledge, modeling concepts, and limitations. Biotechnol. Bioeng. 2013, 110, 24–46. [Google Scholar] [CrossRef]
Figure 1. Principle of the endogenous respiration model.
Water 12 01249 g001
Figure 2. Principle of the death-regeneration model.
Water 12 01249 g002
Figure 3. Chemical oxygen demand (COD) fractions during biological treatment [20].
Water 12 01249 g003
Figure 4. Principle schema of the trickling filter system [27].
Water 12 01249 g004
Figure 5. Steps of one SBR cycle [27].
Water 12 01249 g005
Figure 6. Schema of the respirometry measurement of the oxygen uptake rate.
Water 12 01249 g006
Figure 7. Alternation of decay rate during starvation of biofilm carrier.
Water 12 01249 g007
Figure 8. Results of endogenous OUR after substrate feeding.
Water 12 01249 g008
Figure 9. Results of respirometry measurement in a pilot scale trickling filter.
Water 12 01249 g009
Figure 10. Reactivity of microorganism after starvation.
Water 12 01249 g010
Figure 11. Extending of the death-regeneration model.
Water 12 01249 g011
Figure 12. Adjusting of the endogenous respiration model.
Water 12 01249 g012