Article

Characteristics of a Debris Flow Disaster and Its Mitigation Countermeasures in Zechawa Gully, Jiuzhaigou Valley, China

1
Key Laboratory of Mountain Hazards and Earth Surface Processes, Institute of Mountain Hazards and Environment, Chinese Academy of Sciences, Chengdu 610041, China
2
CAS Center for Excellence in Tibetan Plateau Earth Sciences, Beijing 100101, China
3
University of Chinese Academy of Sciences, Beijing 100049, China
4
Jiuzhai Valley National Park Administration Bureau, Sichuan 623402, China
*
Author to whom correspondence should be addressed.
These authors contributed equally to this work.
Water 2020, 12(5), 1256; https://doi.org/10.3390/w12051256
Submission received: 5 March 2020 / Revised: 24 April 2020 / Accepted: 26 April 2020 / Published: 28 April 2020
(This article belongs to the Special Issue Soil–Water Conservation, Erosion, and Landslide)

Abstract

:
On 8 August 2017, an Ms 7.0 earthquake struck Jiuzhaigou Valley, triggering abundant landslides and providing a huge source of material for potential debris flows. After the earthquake debris flows were triggered by heavy rainfall, causing traffic disruption and serious property losses. This study aims to describe the debris flow events in Zechawa Gully, calculate the peak discharges of the debris flows, characterize the debris flow disasters, propose mitigation countermeasures to control these disasters and analyse the effectiveness of countermeasures that were implemented in May 2019. The results showed the following: (1) The frequency of the debris flows in Zechawa Gully with small- and medium-scale will increase due to the influence of the Ms 7.0 Jiuzhaigou earthquake. (2) An accurate debris flow peak discharge can be obtained by comparing the calculated results of four different methods. (3) The failure of a check dam in the channel had an amplification effect on the peak discharge, resulting in a destructive debris flow event on 4 August 2016. Due to the disaster risk posed by dam failure, both blocking and deposit stopping measures should be adopted for debris flow mitigation. (4) Optimized engineering countermeasures with blocking and deposit stopping measures were proposed and implemented in May 2019 based on the debris flow disaster characteristics of Zechawa Gully, and the reconstructed engineering projects were effective in controlling a post-earthquake debris flow disaster on 21 June 2019.

1. Introduction

A debris flow—a very to extremely rapid surging flow of saturated debris in a steep channel—is a widespread hazardous phenomenon in mountainous areas [1,2,3]. Because of their characteristics of high flow velocities, high impact forces and long run-out distances, debris flows pose a great threat to the safety of people, can cause catastrophic damage to infrastructure elements (such as roads and houses), and can even block rivers, leading to fatalities and property damage downstream [4,5,6,7,8,9,10]. In recent years, post-earthquake debris flow hazards have been widely investigated due to their long activity duration, high occurrence frequency and catastrophic damage [11,12,13,14]. Numerous studies have focused on rainfall thresholds and sediment supply to characterize the occurrence of post-earthquake debris flows. In the areas affected by the 1999 Chi-Chi earthquake and the 2008 Wenchuan earthquake, the thresholds for rainfall triggering post-earthquake debris flows were analysed, and it was recognized that the rainfall threshold in periods shortly after the earthquakes was markedly lower than that before the earthquake and gradually recovered over time [14,15,16,17,18,19,20]. In fact, a devastating earthquake generates a large sediment supply in the form of co-seismic collapses and landslides and changes the grain size of the material and the watershed permeability characteristics, thereby indirectly reducing the debris flow-triggering rainfall thresholds [18,21]. Because earthquakes tend to produce abundant loose material, if sufficient rainfall occurs soon after an earthquake, a catastrophic debris flow can be triggered. For example, influenced by the Wenchuan earthquake on 12 May 2008, a catastrophic debris flow event was triggered on 14 August 2010 in Hongchun Gully, claiming the lives of 32 people [8]. Similarly, five debris flow events were triggered in Wenjia Gully in the three rainy seasons after the Wenchuan earthquake, including a giant debris flow event on 13 August 2010 [9,13].
As an effective way to mitigate debris flow hazards, engineering countermeasures have attracted widespread attention [22,23,24,25,26,27,28,29,30,31,32,33], and the mitigation of debris flows is usually carried out by stabilizing, blocking, drainage and deposit stopping measures [11,23]. Check dams, which act to stabilize the bed, consolidate hillslopes, decrease the slope, and retain and control the transport of sediment, are commonly used engineering structures for controlling debris flows and can generally be divided into solid-body dams and open dams [25,28,29]. Because solid-body dams are associated with many drawbacks, such as the erosion of the dam foundation and changes in the hillslope-to-channel connectivity [26,27], open dams are more efficient at controlling debris flows [28,29]. After the Wenchuan earthquake, to protect people’s lives and property and ensure smooth traffic, a large number of debris flow engineering structures, especially check dams, were built. However, due to the insufficient realization on the characteristics and formation mechanisms of post-earthquake debris flows, many newly-built engineering structures have failed to mitigate debris flows and have instead caused catastrophic damage. For example, due to the failure of check dams in Sanyanyu Valley on 8 August 2010, more than 200 buildings were damaged, and approximately 1700 people died [34]. Similarly, during the “8.13” Wenjiagou debris flow event, engineering structures failed, causing seven deaths and the burial of more than 497 houses [9,35]. Therefore, further research should be carried out to propose appropriate mitigation countermeasures for post-earthquake debris flows.
Recently, an Ms 7.0 earthquake struck Jiuzhaigou Valley on 8 August 2017, triggering abundant landslides and providing a vast source of material for debris flows. Due to the influence of heavy rainfall, post-earthquake debris flows were triggered in Jiuzhaigou Valley and heavily damaged infrastructure elements, such as pedestrian walkways and scenic roads, causing traffic disruption and serious property losses [36,37,38]. It is necessary to evaluate the characteristics of post-earthquake debris flows in Jiuzhaigou Valley, and to propose appropriate mitigation countermeasures to avoid catastrophic events, but only a few studies related to post-earthquake debris flow mitigation in this area have been published to date. In this paper, Zechawa Gully is taken as a case study to characterize a debris flow disaster and then discuss mitigation countermeasures. To improve the accuracy of parameter calculation, four different methods were used to calculate the debris flow peak discharge and quantify the debris flow magnitude. According to the survey and analysis, the destructive debris flow event in 2016 was caused by a dam breach. After the Ms 7.0 Jiuzhaigou earthquake on 8 August 2017, abundant loose solid material was available for debris flow activity, and at least one post-earthquake debris flow occurred in September 2017. The risk of dam breaches led to the implementation of engineering countermeasures with blocking and deposit stopping measures. Such works were finished on May 2019. On 21 June 2019, a post-earthquake debris flow was triggered by heavy rainfall, and the engineering countermeasures played a useful role in controlling the debris flow disaster even though the debris flow magnitude was greater than the design standard of the reconstruction engineering projects.

2. Background

2.1. Formation Conditions of the Zechawa Gully Debris Flow

Zechawa Gully, with gully mouth coordinates of 103°55′22.8″ E, 33°08′34.8″ N, is located in Jiuzhaigou Valley, Sichuan Province, China, and lies approximately 13.9 km from a scenic entrance (Figure 1a,b). The outlet of the Zechawa Gully debris flow coincides with the location of the only scenic road from Nuorilang Waterfall to Long Lake (Figure 1c). The study area is the transition zone from the Qinghai-Tibet Plateau to the Sichuan Basin and belongs to the peripheral mountainous area of the Sichuan Basin. The watershed covers an area of 1.96 km2 and features five tributaries; the main channel is 2.57 km long and has a 61.1% longitudinal slope. The elevation difference of Zechawa Gully is approximately 1601 m, with a maximum elevation of 4040 m in the southwest of the watershed and a minimum elevation of 2439 m at the gully mouth near the scenic road. The topography of Zechawa Gully is steep, with 86.9% of the total area of the watershed having a slope exceeding 25°. The flow path of debris flow along Zechawa Gully can be divided into a formation zone, transport zone and deposition zone (Table 1). The formation zone is located in the upper reaches of Zechawa Gully (elevation above 3620 m), with an area of 0.26 km2 and a channel length of 470 m. The transport zone is situated in the middle reaches, with the elevations ranging from 3620 m to 2600 m. The area of the transport zone is approximately 1.47 km2, and the channel length is approximately 1530 m. The deposition zone, with an area of 0.23 km2 and a channel length of approximately 570 m, is located in the area below an elevation of 2600 m.
Compared with the characteristics of the formation zone and transport zone, the topography of the deposition zone is gentle, with no collapses and landslides, and debris flow material tends to be deposited in this area, forming a large debris flow fan. Zechawa Gully is generally a “v”-shaped channel with the characteristics of a narrow gully bed, steep lateral slopes and a high longitudinal slope, providing favourable topographic conditions for the formation of debris flows.
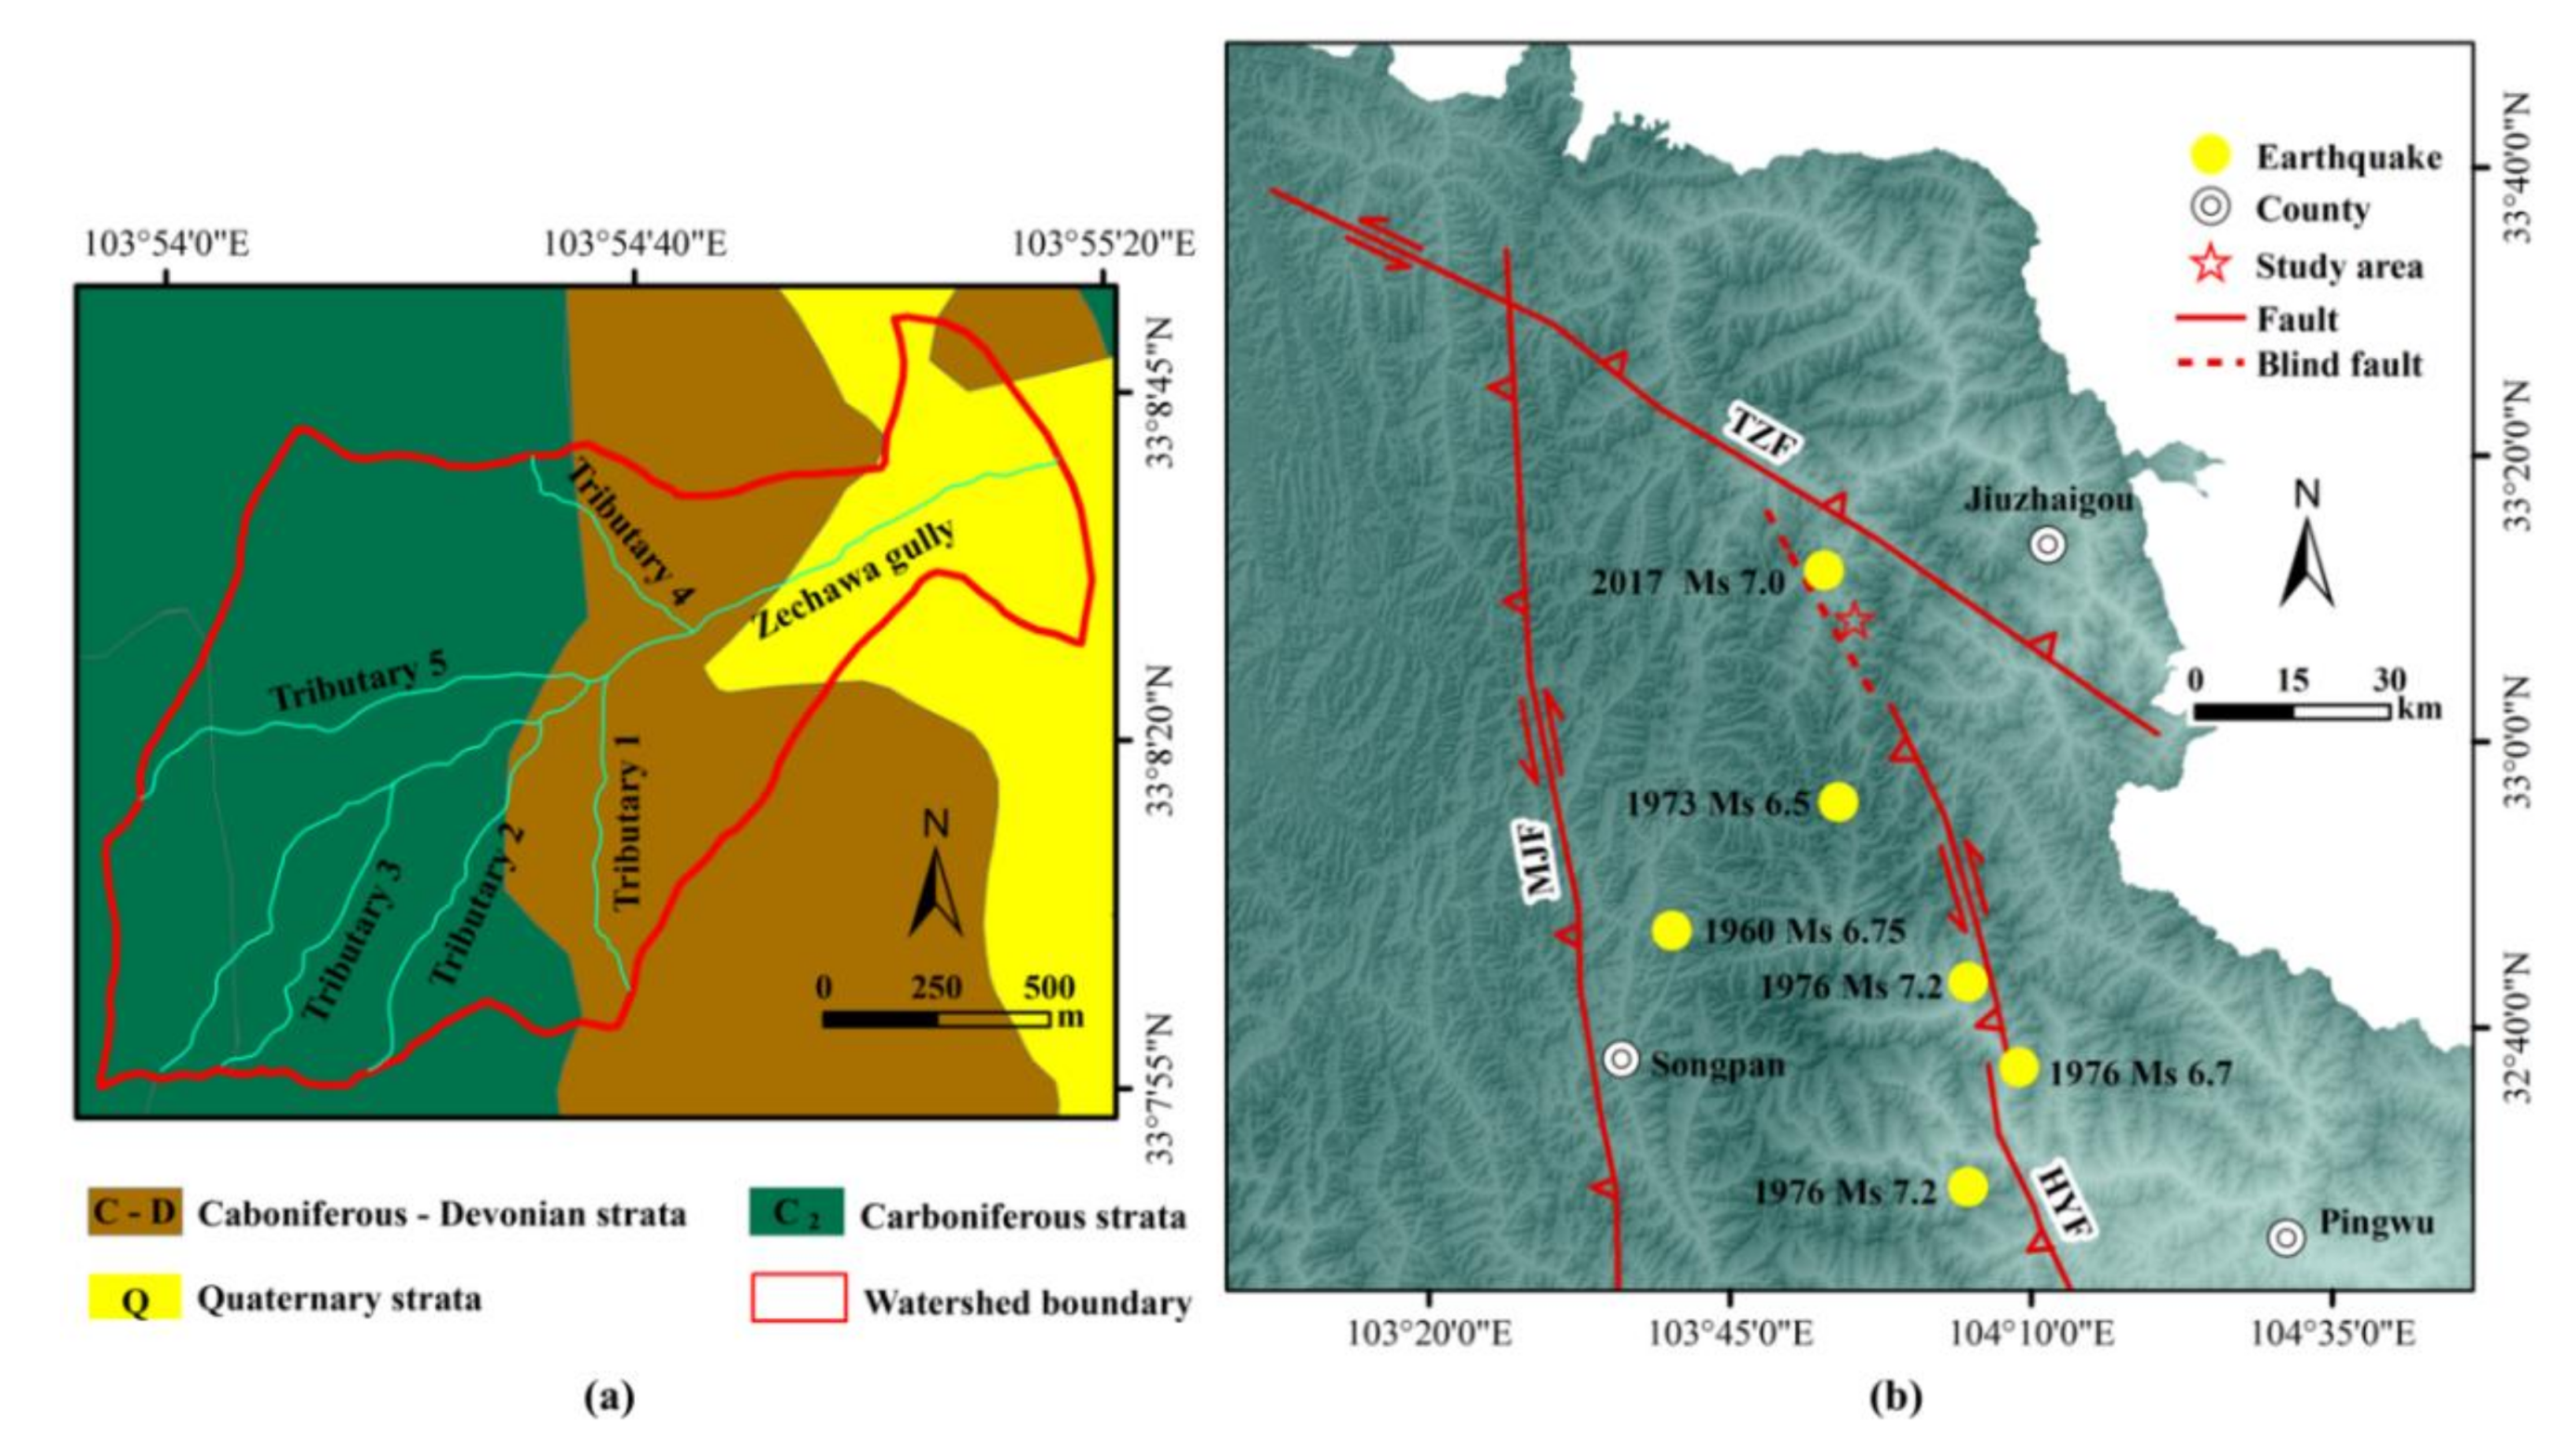
The study area is located in the Songpan-Ganzi Block, and the outcropping strata are mainly Quaternary and Mesozoic (Figure 2a). The lithology consists mainly of limestone and slate with a small amount of sandstone, which were intensely deformed by folding and thrusting during the Late Triassic and Early Jurassic [39,40]. In addition, since the Quaternary, the geological tectonic movement in this area has been intense due to the influence of the Tazang fault (the eastern part of the East Kunlun Fault Zone), Minjiang fault and Huya fault [41,42,43,44,45] (Figure 2b). Historically, seismicity has occurred on the Minjiang fault and Huya fault, including the 1960 Zhangla Ms 6.7 earthquake, the 1973 Huanglong Ms 6.5 earthquake, and the 1976 Songpan-Pingwu earthquake swarm (Ms = 7.2, 6.7, and 7.2). A recent earthquake was the Jiuzhaigou 7.0 earthquake, which occurred on 8 August 2017 on the north-western extension of the Huya fault; the rupture was dominated by left-lateral strike-slip motion [41,46,47,48]. On the whole, seismicity is frequent in the study area due to the geological conditions of the region, resulting in the fracture of the rock mass in the study area and triggering abundant collapses and landslides, which provide a rich source of loose material for incorporation into debris flows.
The study area features a plateau cold temperate-subarctic monsoon climate. Due to the blocking effect of the Longmen Mountains to the southeast of the study area, most of the warm and humid air currents from the Pacific Ocean stay to the east of the Longmen Mountains. Therefore, the rainfall in Jiuzhaigou Valley west of the Longmen Mountains is relatively low, and the annual average precipitation is only 761.8 mm. The impact of cold air and high-pressure cold air currents from Mongolia in the winter is greatly weakened by the blocking of the Qinling Mountains to the north of the study area, causing this region to exhibit a mild climate, moderate precipitation and an annual average temperature of 7.3 °C [49]. There are more than 150 rainfall days annually in the study area, and the rainfall is concentrated mainly in May to September in the form of rainstorms. According to the rainfall data from the Jiuzhaigou Administration Bureau, the maximum rainfall over 24 h in Jiuzhaigou Valley is greater than 50 mm, and the precipitation increases with increasing elevation. The lowest average annual precipitation, at 696.6 mm, is found at the outlet of Jiuzhaigou Valley at an elevation of 1996 m. The highest annual average precipitation, at 957.5 mm, is found at Long Lake at an elevation of 3100 m. The snowpack period is from October to April, and the largest recorded snowpack depth exceeded 150 mm. The rainfall conditions of the study area are characterized by concentrated heavy rainfall, which is favourable for the formation of debris flows.

2.2. Description of the Debris Flow Events in Zechawa Gully

Due to the steep topography, adequate supply of loose material and intense precipitation in the study area, debris flows are active in Zechawa Gully. The earliest recorded debris flow event occurred in August 2006 and buried pedestrian walkways. In July 2008, another debris flow occurred again and blocked the scenic road. To prevent debris flows from causing further damage to the downstream pedestrian walkways and the only scenic road and to ensure the safety of residents and tourists in scenic areas, engineering countermeasures were taken in 2009. These countermeasures were designed to resist a debris flow with a 20-year return period. One stone masonry check dam 34.7 m long and 8 m high was constructed at the end of the transport zone of Zechawa Gully in 2009 (Figure 1c), and one auxiliary dam was constructed close to the stone masonry check dam. The stone masonry check dam was designed to be able to trap a volume of 2.24 × 10⁴ m3 of debris flow material [50].
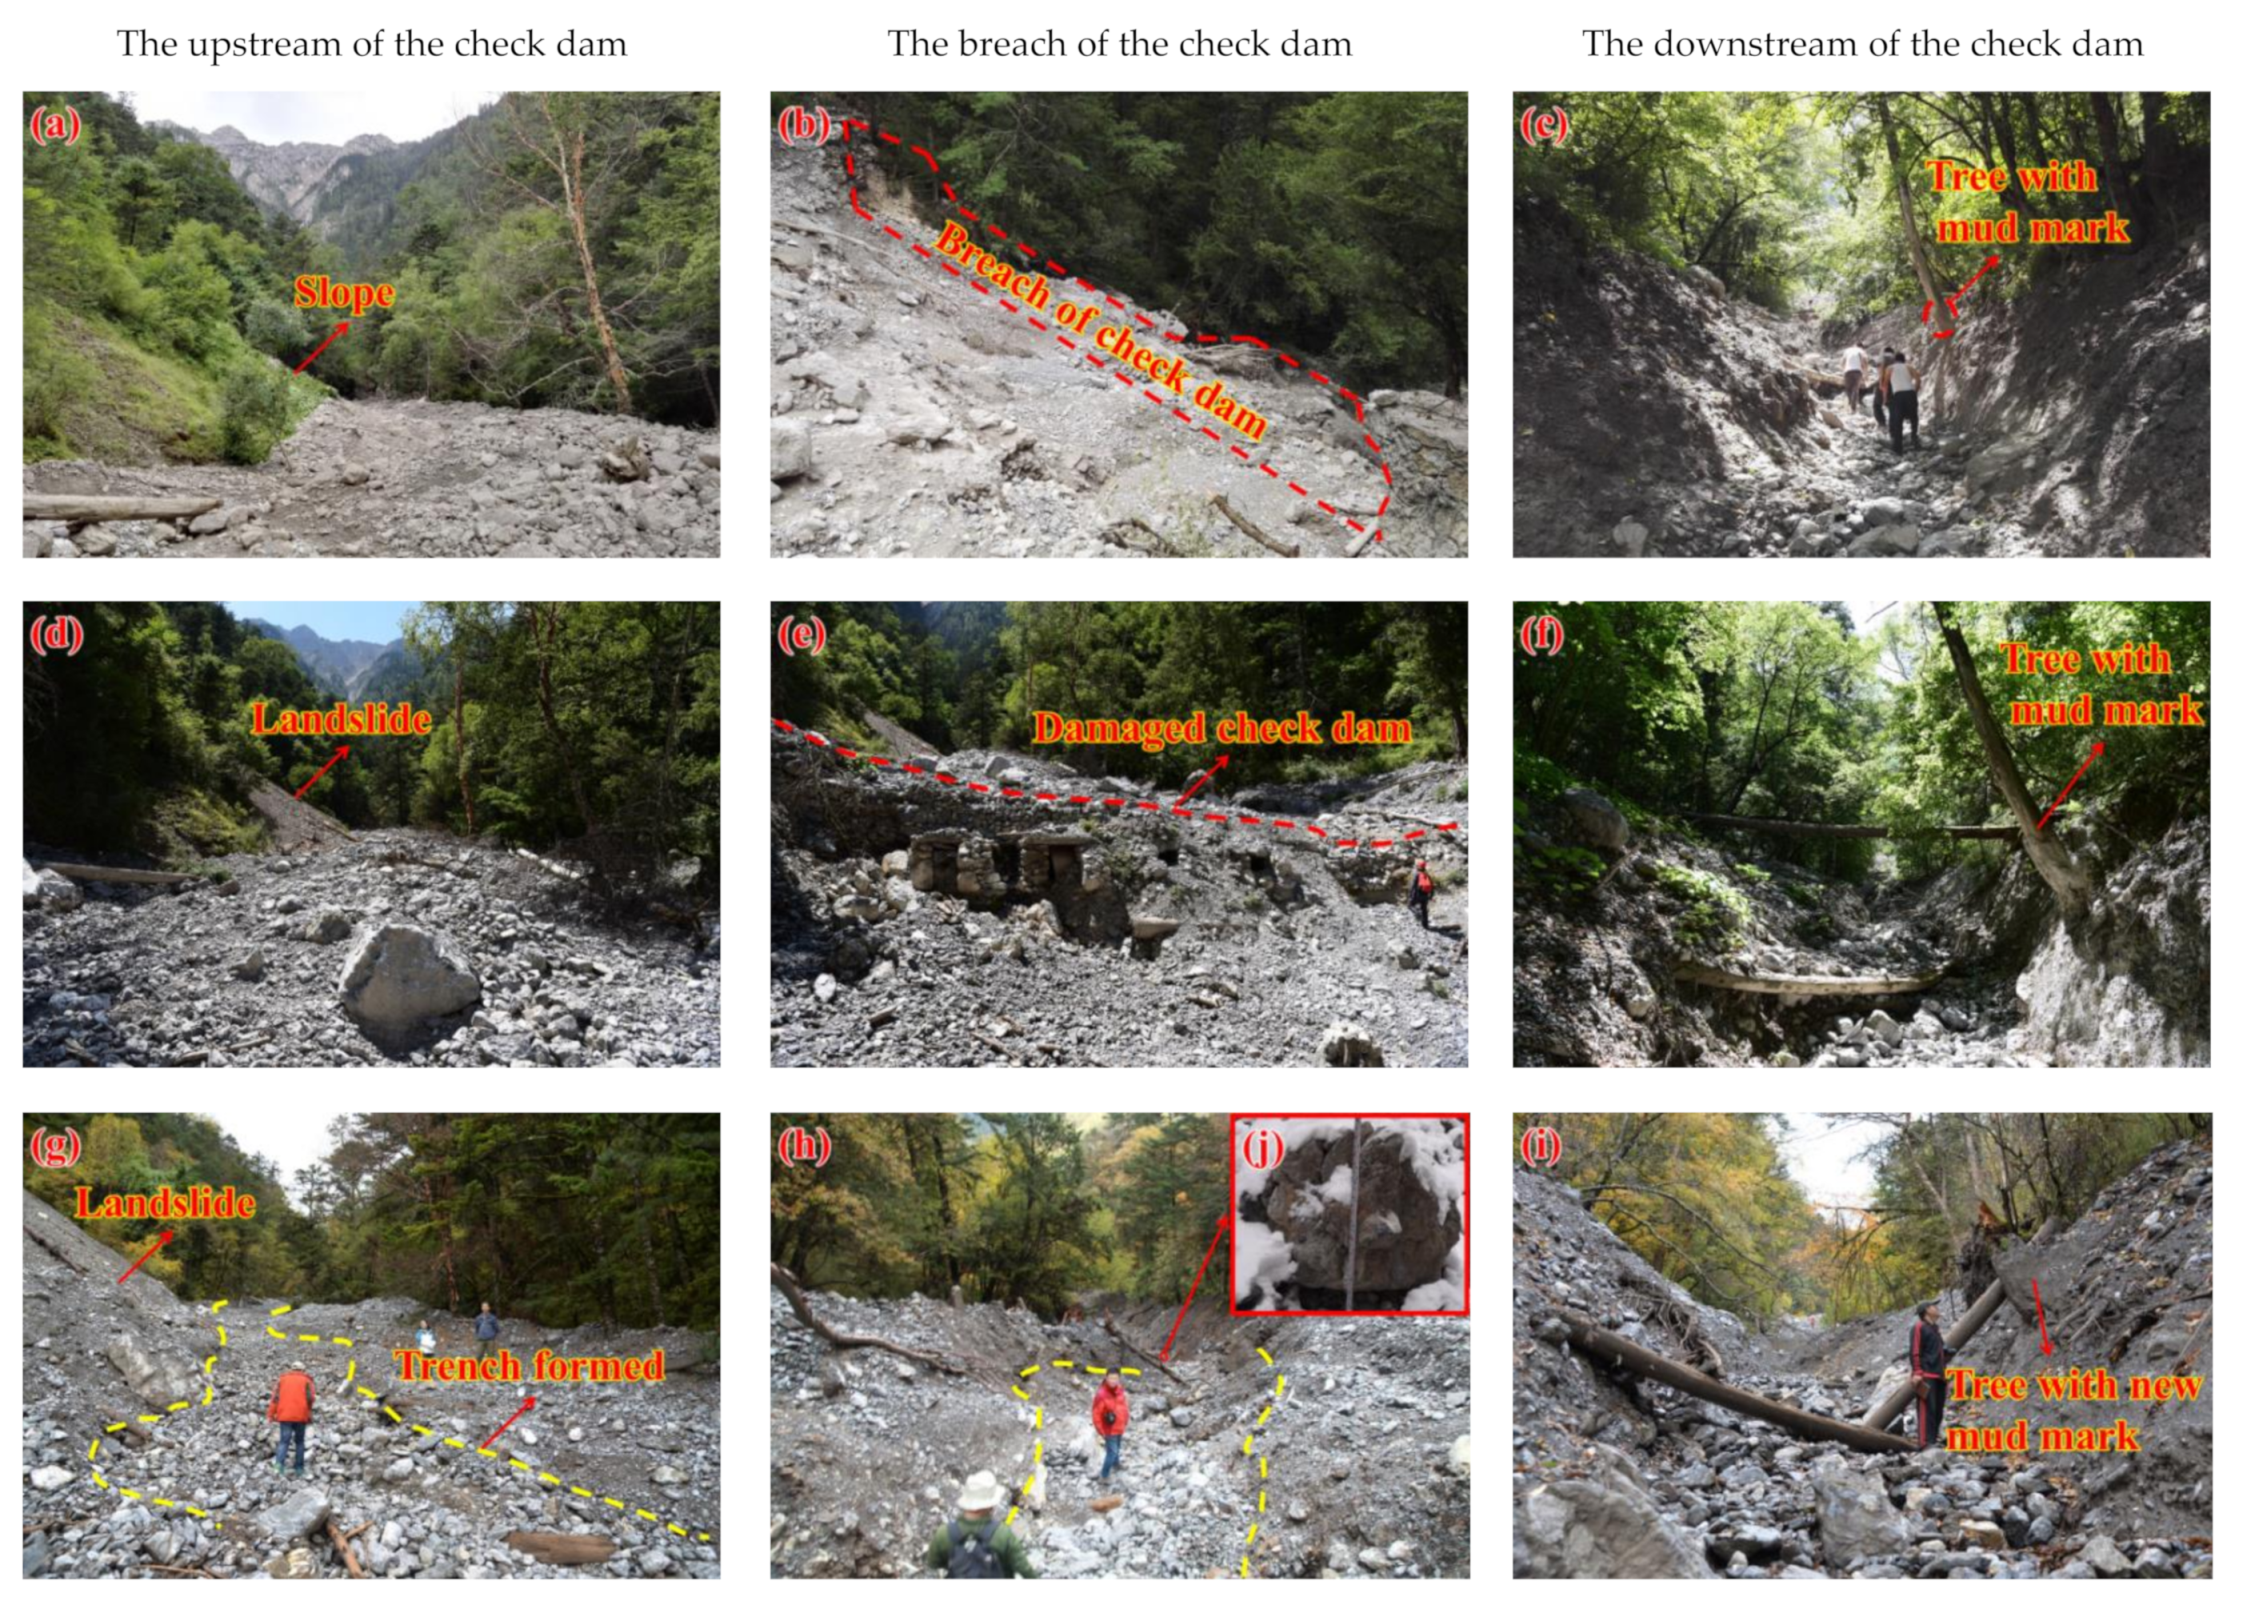
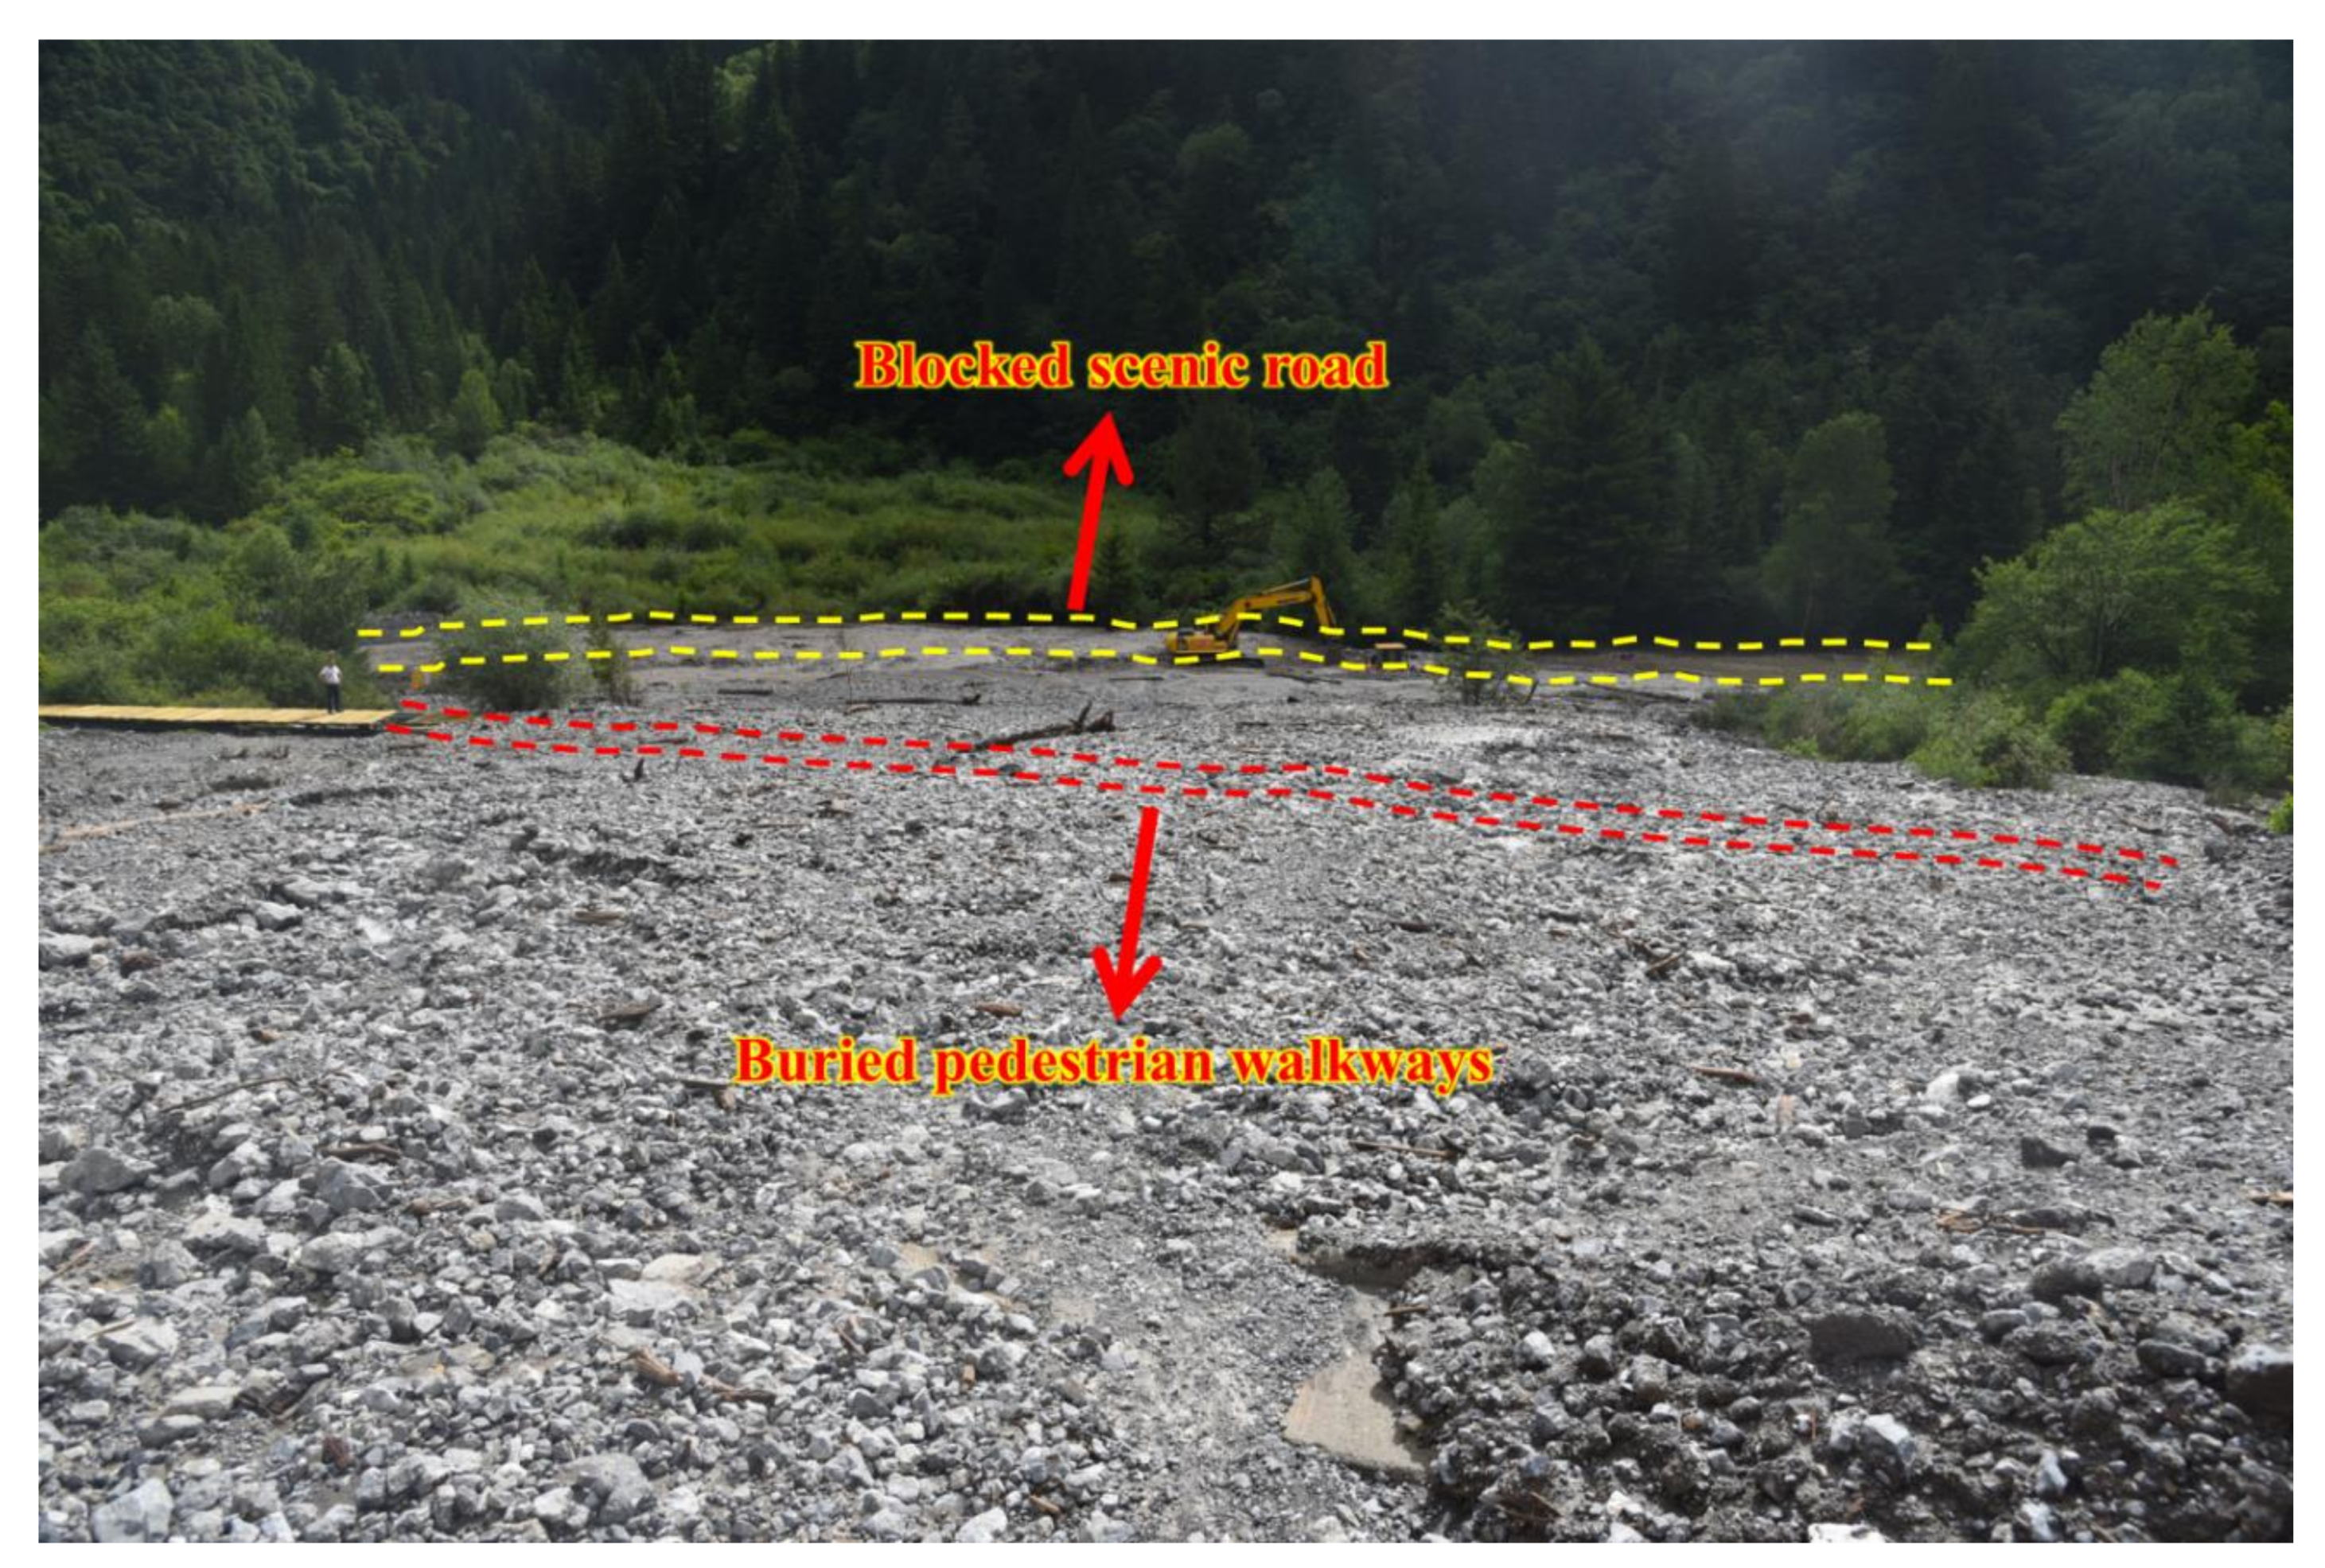
On 4 August 2016, another destructive debris flow was triggered in Zechawa Gully. The rainfall data from the Zechawa precipitation station (103°55′04.8″ E, 33°09′18.0″ N, Figure 1b) showed that the preceeding rainfall that accumulated from 26 July 2016 to 3 August 2016 was only 8.8 mm, and the intraday rainfall was 6.7 mm on 4 August 2016. During this debris flow event, large amounts of sediment were trapped in front of the stone masonry check dam, resulting in a deposited thickness of 7 m and width of 30 m, and the length of the debris flow deposit behind the check dam was 44 m according to field measurements (Figure 3a). As sediments deposited, a breach formed in the check dam. Ultimately, the average width of the breach was 20.5 m, and the residual height of the check dam was 6 m (Figure 3b). The large kinetic energy of strong flow waves formed by the breach of check dam caused a high erosion of the downstream gully bed. During the movement of the debris flow material, the trees on both sides of the channel were impacted, leaving noticeable mud marks (Figure 3c). According to the field investigation, the total volume of the debris flow material transported downstream the failed check dam was approximately 1.39 × 10⁴ m3. Some of the material was deposited on the debris flow fan with a deposit area of 0.77 × 10⁴ m2, a thickness of 0.8–1.5 m and a volume of 0.89 × 10⁴ m3. Additional material with a volume of 0.5 × 10⁴ m3 was transported to the scenic road. During this debris flow event, the pedestrian walkways were buried again, and the only scenic road from Nuorilang Waterfall to Long Lake was blocked, causing traffic disruption and serious property loss [37,51].
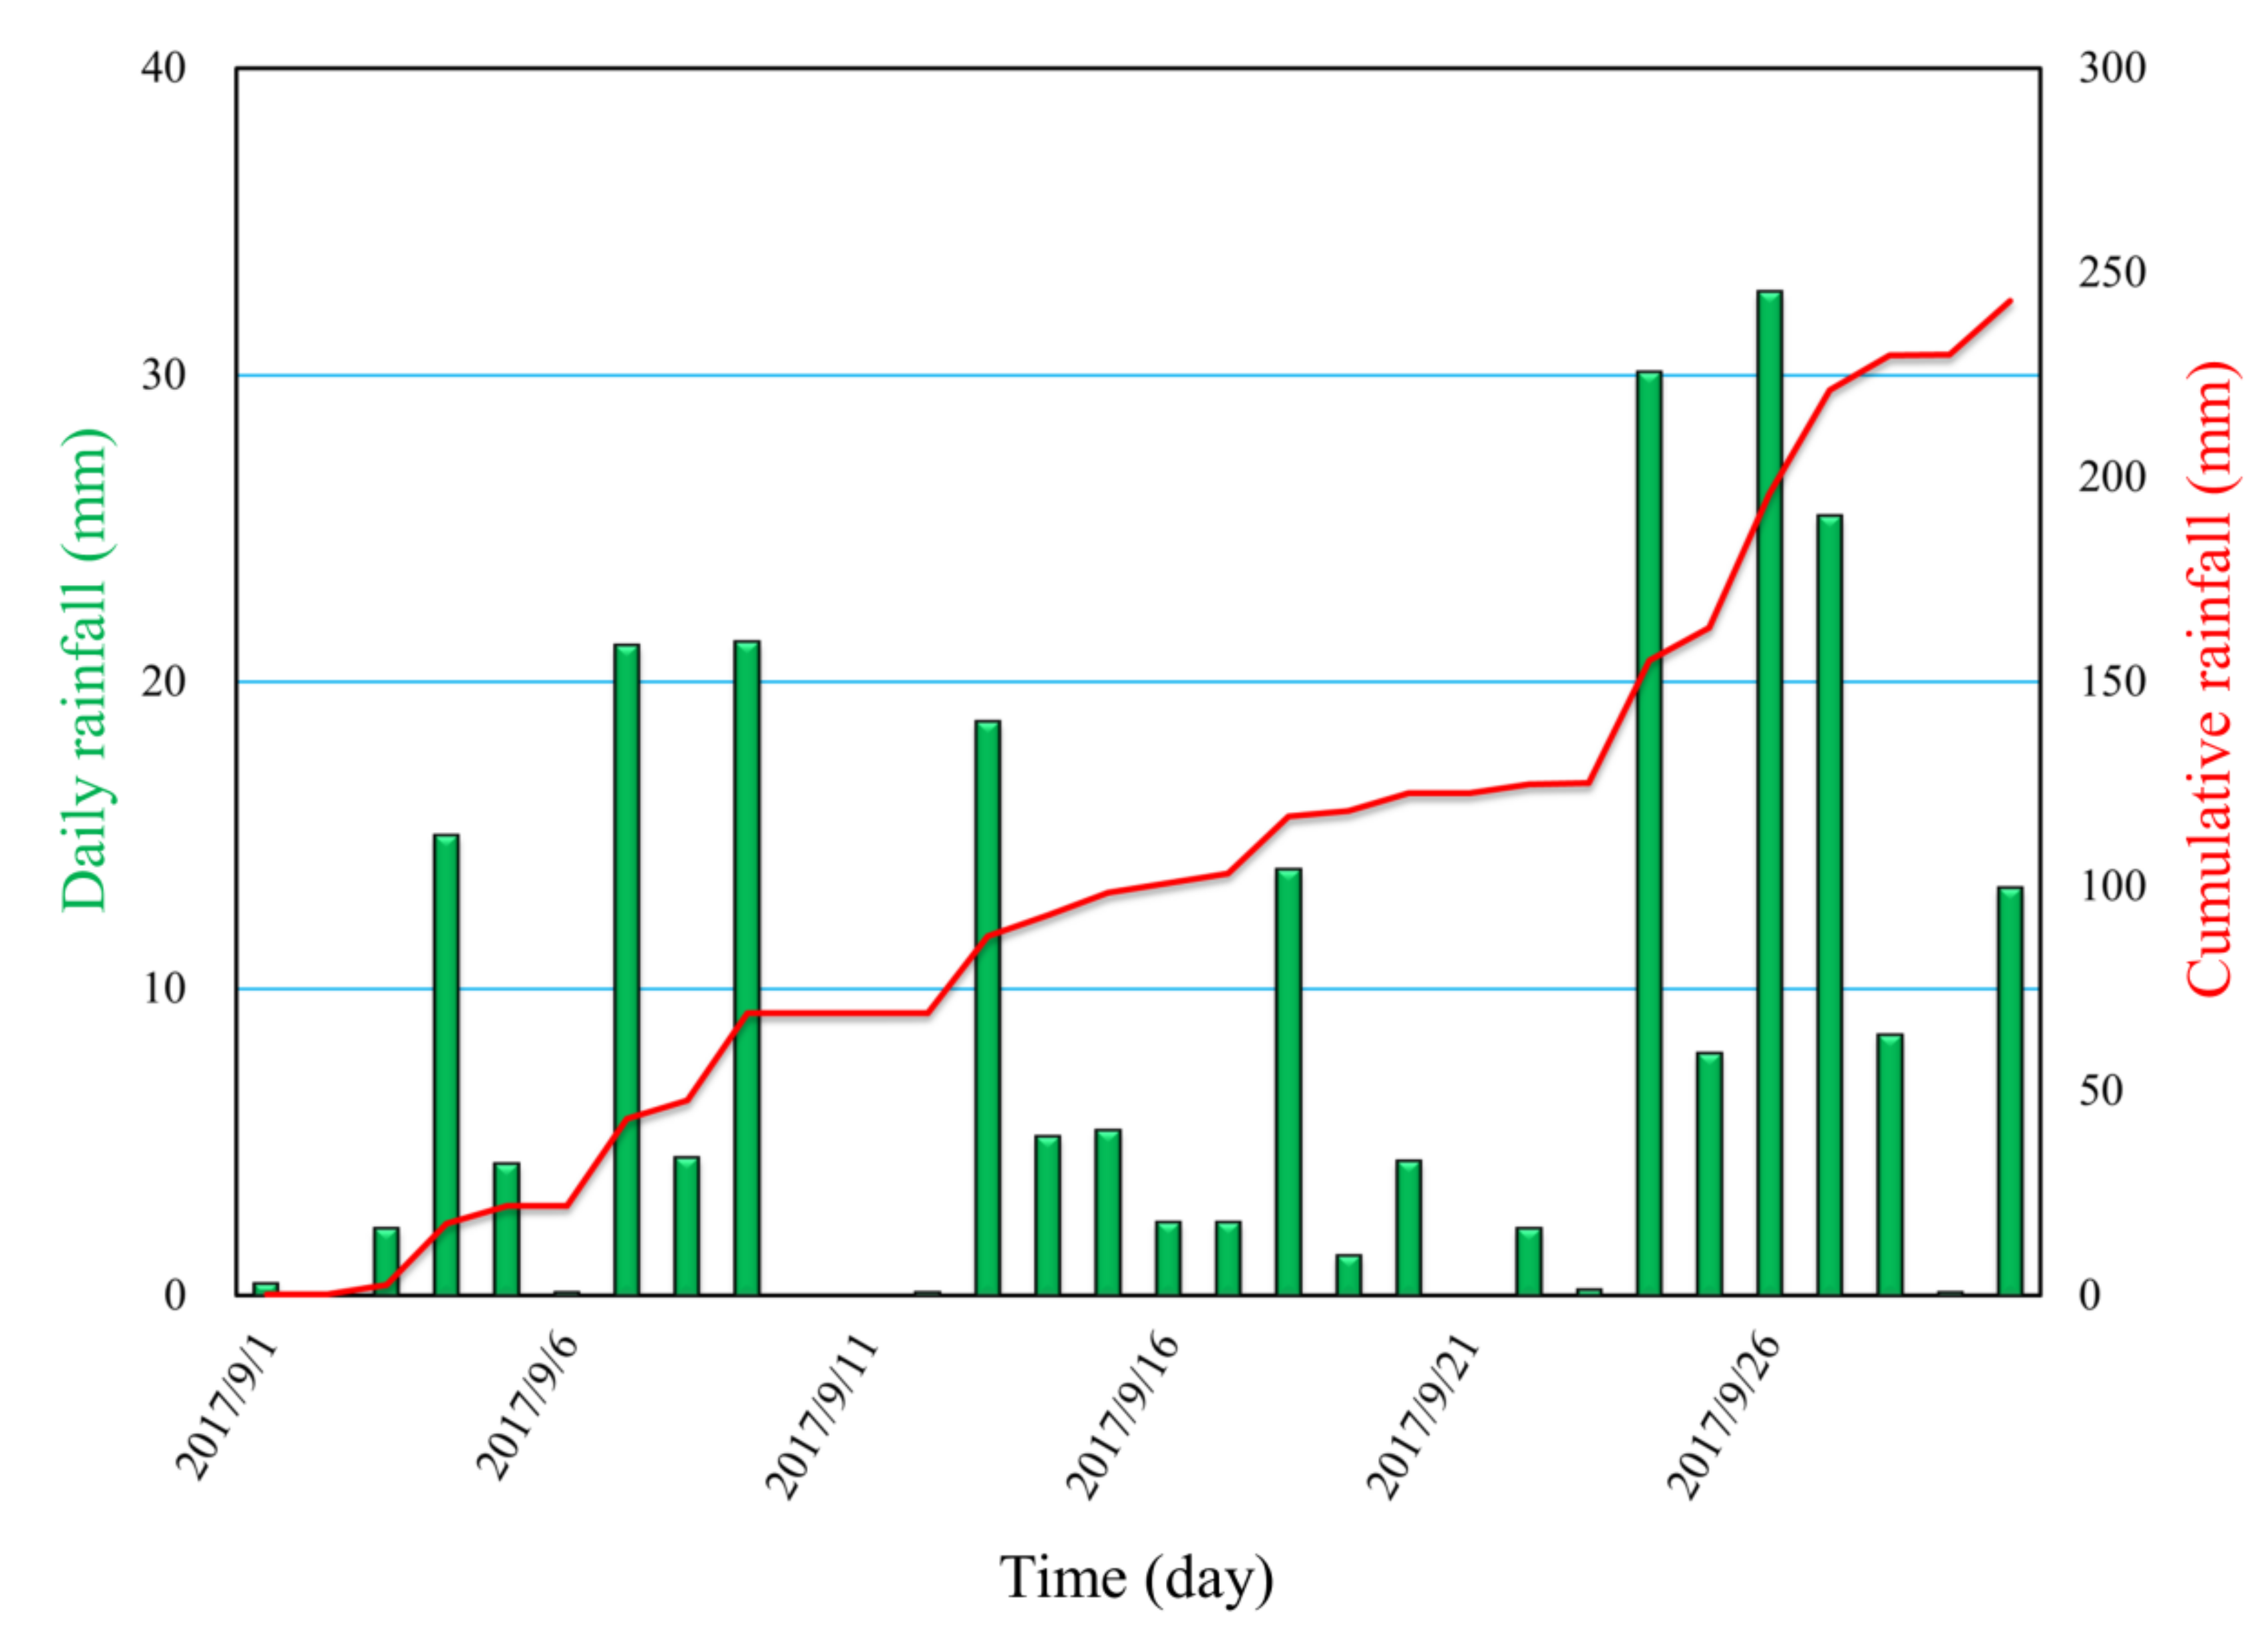
On 8 August 2017, the Ms 7.0 Jiuzhaigou earthquake struck the study area, and abundant landslides were triggered (Figure 3d), providing a vast source of material for debris flows. However, this earthquake had little influence on the breach shape of the check dam (Figure 3e) or the downstream topography of the check dam (Figure 3f). Subsequently, heavy rainfall occurred in the study area in September 2017. The rainfall data from Zechawa precipitation station showed that the total rainfall in September 2017 was 243.2 mm, accounting for approximately 32% of the total annual rainfall (Figure 4). Affected by the heavy rainfall in September 2017, a debris flow occurred, and the topography changed significantly. At the upstream check dam, the erosion caused by the debris flow was intense. An erosional trench approximately 1.0 m in depth was formed upstream of the dam (Figure 3g), and the breach in the dam was detectably deepened due to the erosion induced by the debris flow (Figure 3h). Due to the very high transport capacity of the debris flow, a large boulder with a long-axis length of 1.3 m, an intermediate-axis length of 1.1 m and a short-axis length of 0.7 m was transported to a point 20 m downstream of the check dam, and this boulder was composed of masonry (Figure 3j). Downstream of the check dam, the debris flow material was deposited in the channel. Additionally, trees on both sides of the channel were broken due to the very large destructive power of the debris flow, and new mud marks were left on the trees (Figure 3i). Fortunately, pedestrian walkways and scenic roads were not destroyed again. To reduce the disaster risk of the post-earthquake debris flow in Zechawa Gully, one concrete check dam, one concrete auxiliary dam and one concrete retaining wall were constructed in May 2019.
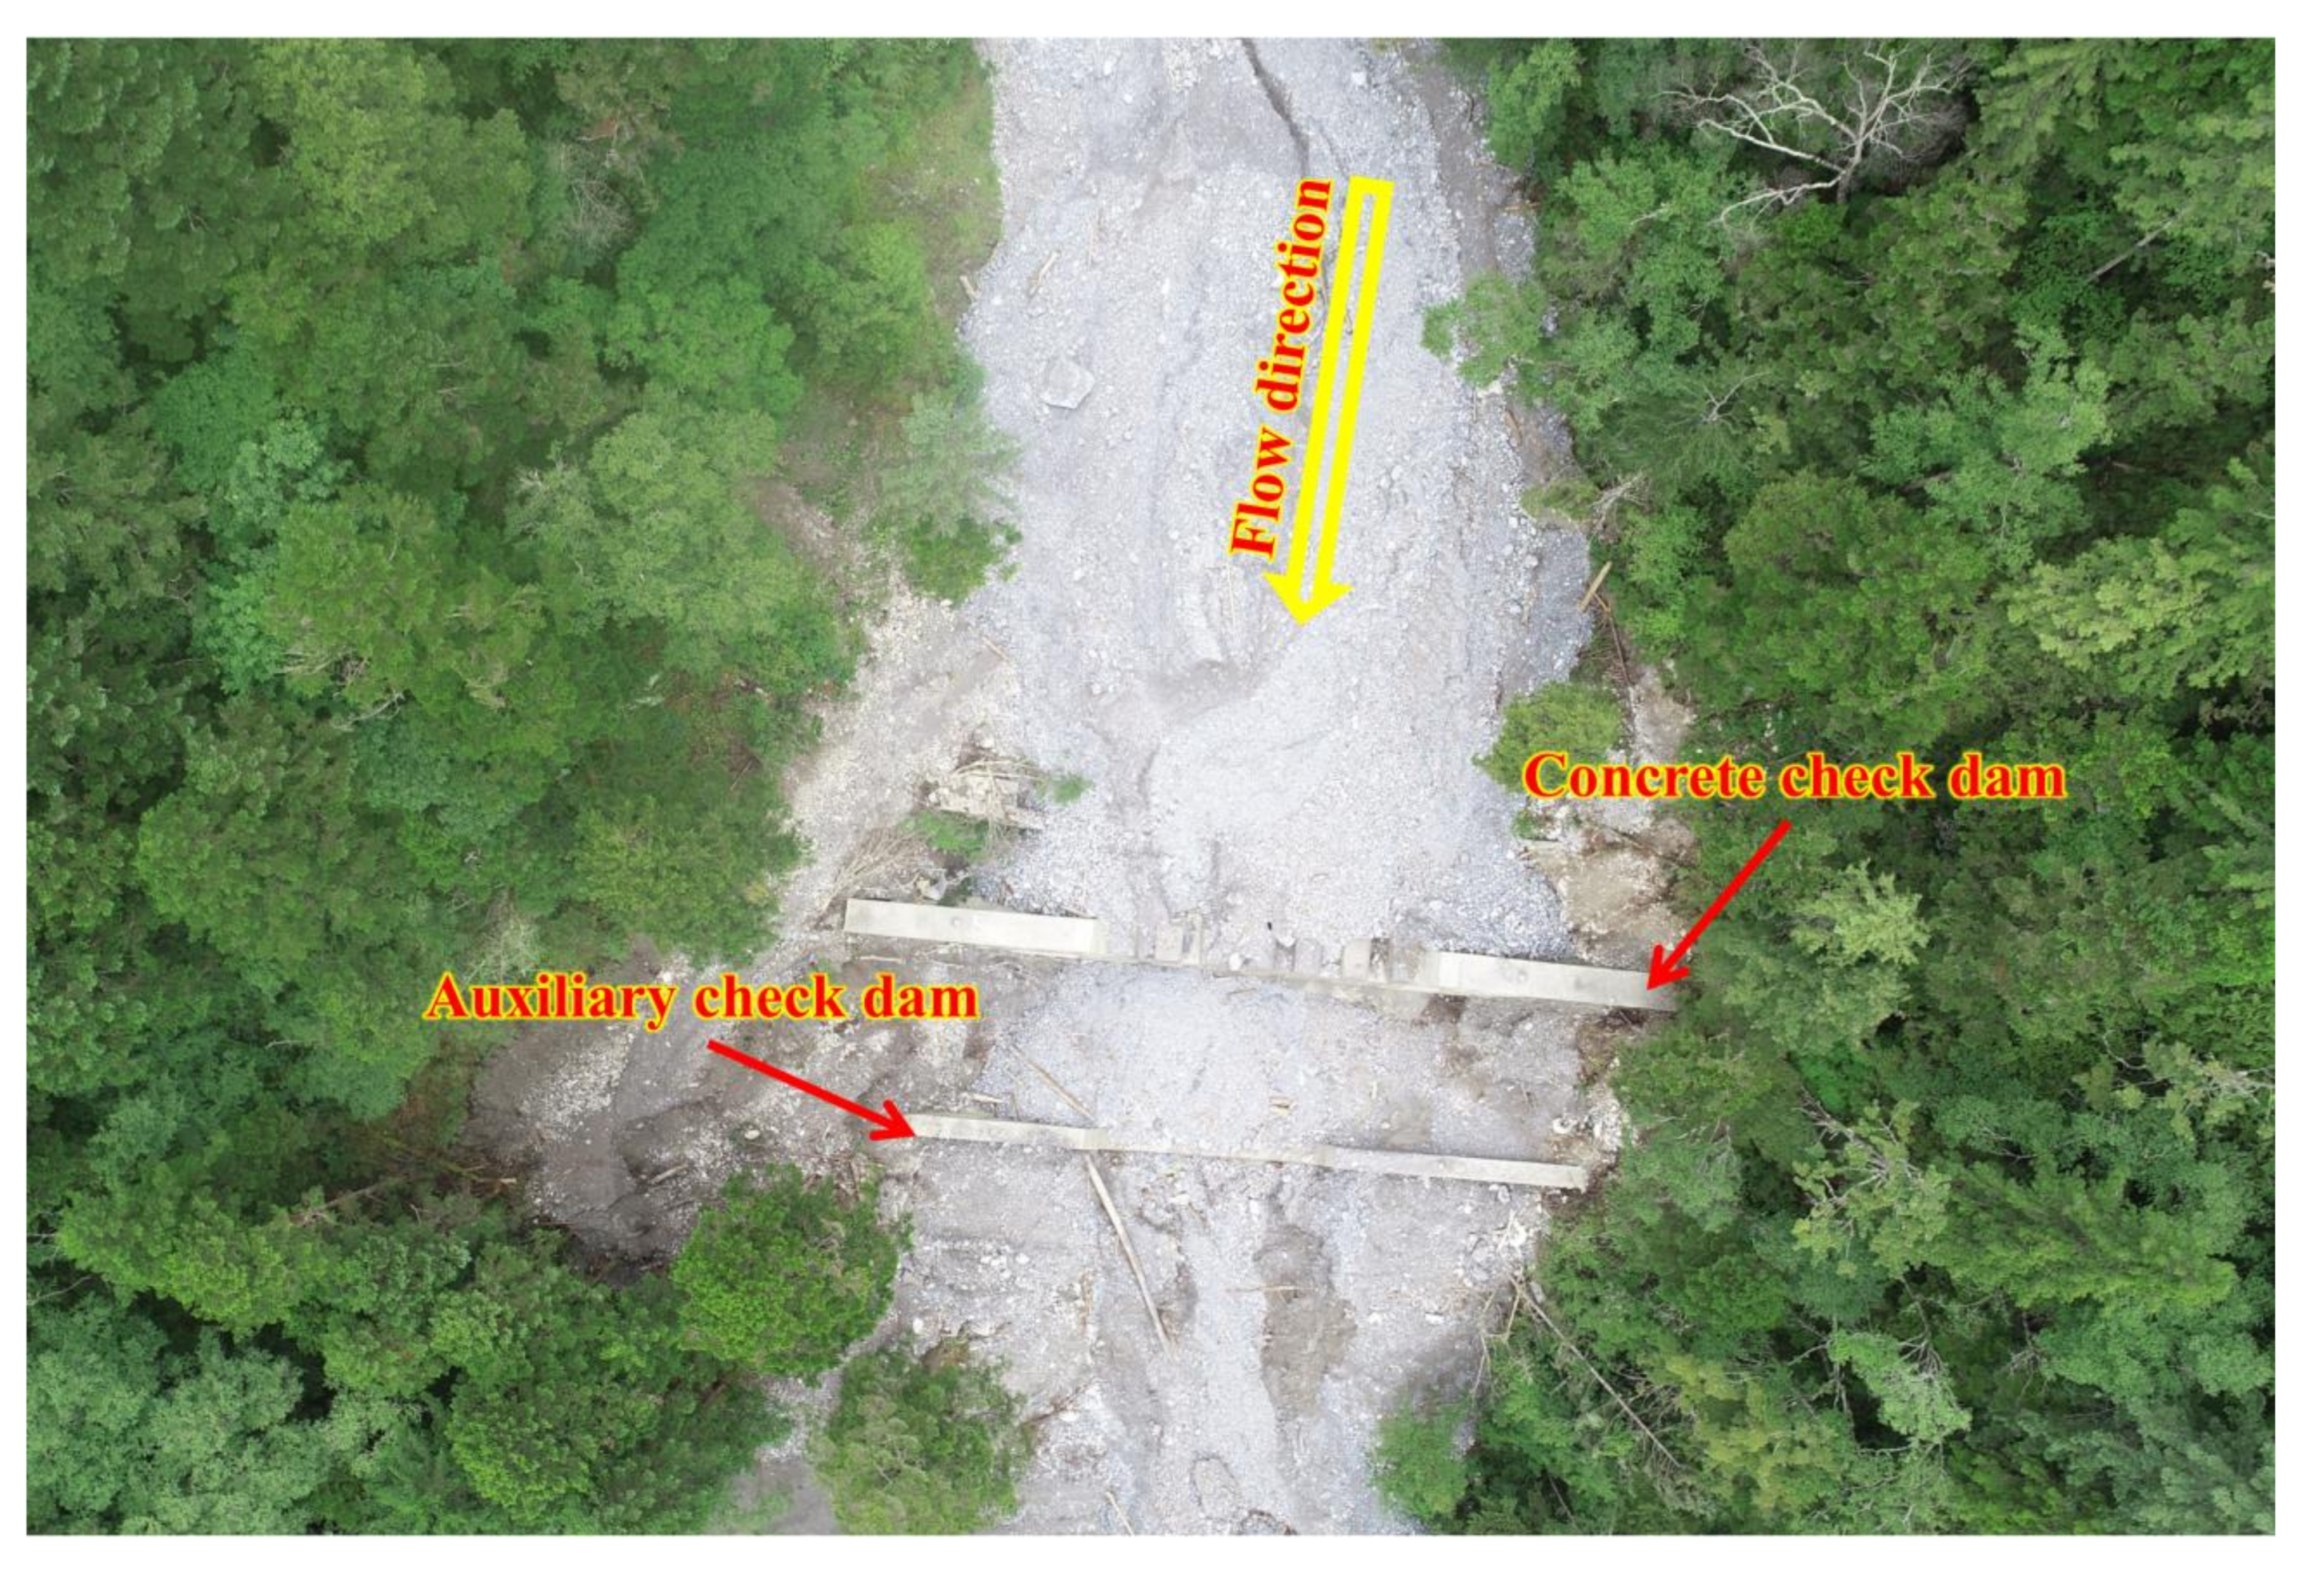
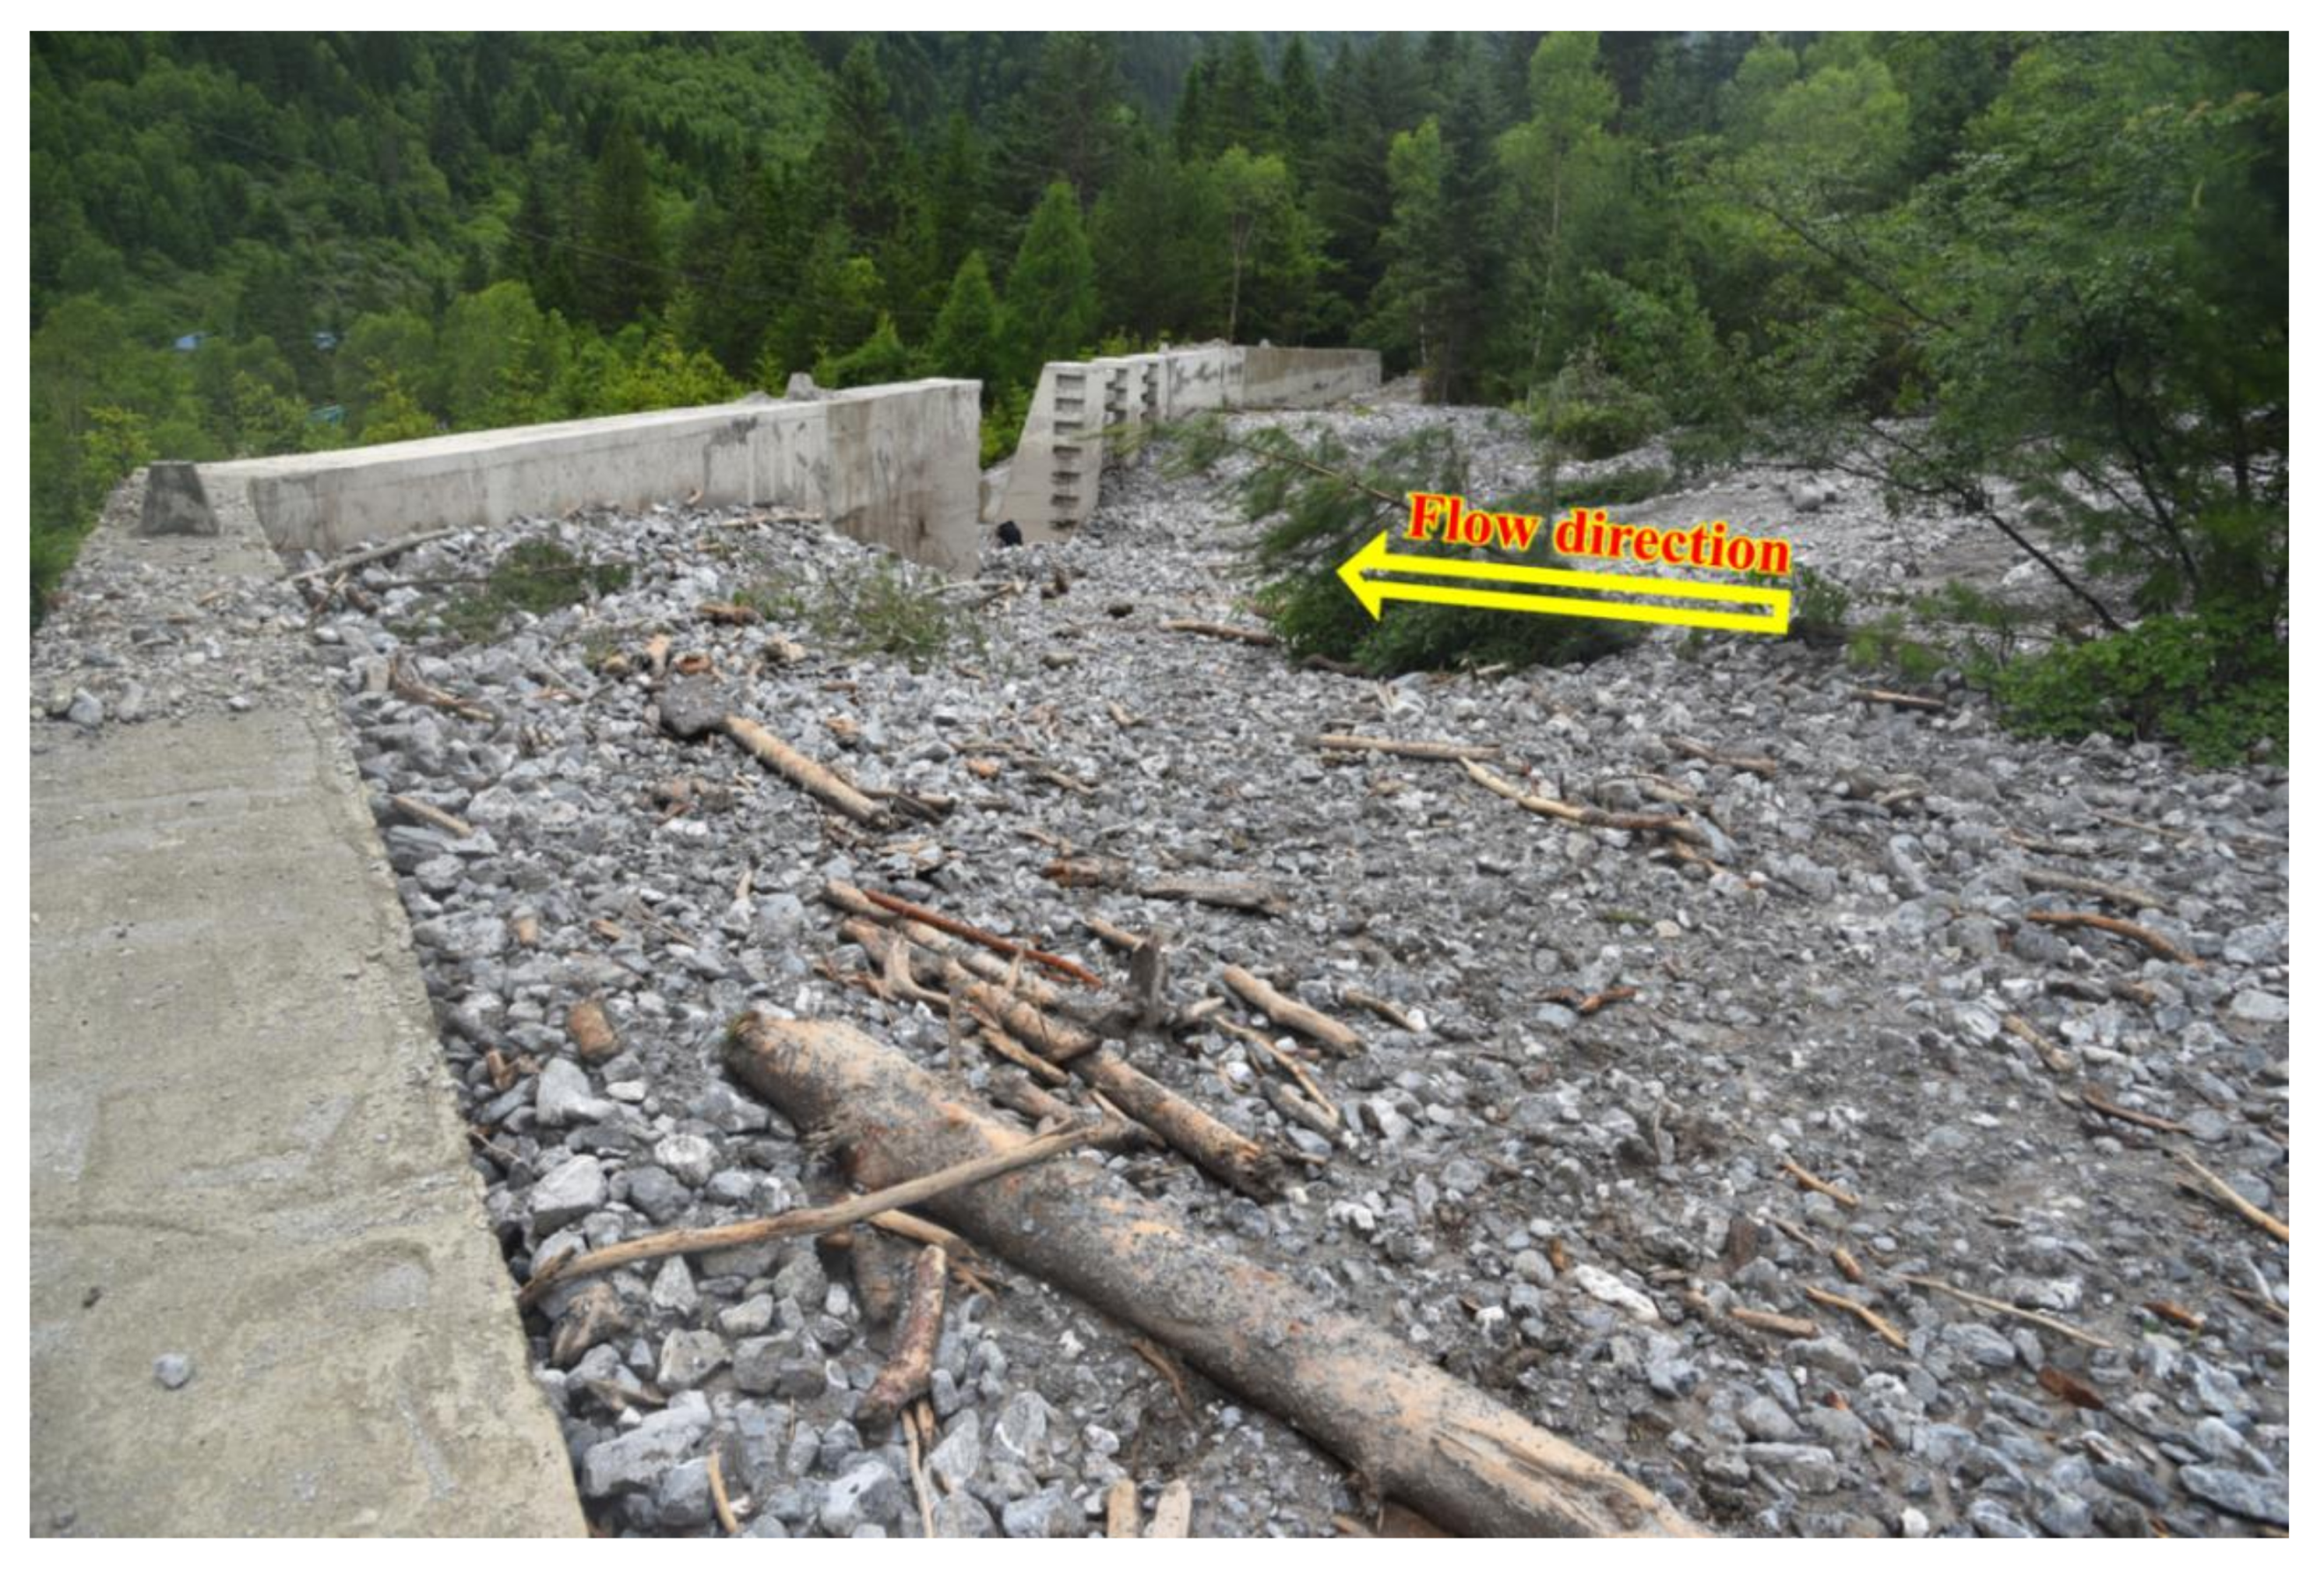
A rainfall event started at 20:00 on 20 June 2019 and ended at approximately 08:00 on 21 June 2019 in Jiuzhaigou Valley. According to reports from patrol personnel, a post-earthquake debris flow was triggered by this storm at approximately 03:00 on 21 June 2019, and the rainfall data from the Zechawa precipitation station showed that the accumulated rainfall from 21:00 on 20 June 2019 to 02:00 on 21 June 2019 was 18.1 mm. According to the field investigation, the total volume of debris flow material was approximately 2.3 × 10⁴ m3. The debris flow material volume trapped by the concrete check dam was approximately 0.48 × 10⁴ m3 (Figure 5). Some of the other debris flow material was trapped behind the retaining wall with a deposit area of 0.3 × 10⁴ m2, a maximum deposit thickness of 4 m at the middle of the retaining wall and a deposit volume of 0.66 × 10⁴ m3 (Figure 6). The middle of the retaining wall was partially damaged, resulting in a breach with a width of 8.5 m, due to the high impact force of the debris flow. This breach allowed a portion of the debris flow material with a volume of 1.16 × 10⁴ m3 to be transported to the debris flow fan and scenic road (Figure 7). The material volume deposited on the fan was approximately 0.93 × 10⁴ m3 with a deposit area of 0.62 × 10⁴ m2 and an average deposit thickness of 1.5 m. The volume of the material blocking the scenic road was approximately 0.23 × 10⁴ m3, with a deposit length of 180 m and an average deposit thickness of 1.8 m.

3. Calculation of the Debris Flow Peak Discharge

In the mountainous areas of China, due to the lack of observation data, the rain-flood method and cross-section survey method have been widely used to calculate the debris flow peak discharge [52]. Under the assumption that the occurrence frequencies of rainstorms, floods and debris flows are the same, the rain-flood method is widely employed to calculate the debris flow peak discharge under different occurrence frequencies [53,54]. The cross-section survey method calculates the peak discharge of a debris flow that has occurred based on the mud mark and cross-sectional morphology of the channel [7,55].
For the debris flow event that occurred on 4 August 2016, two obvious typical cross-sections downstream of the stone masonry check dam are available for the calculation of the debris flow discharge through the cross-section survey method. Moreover, the pedestrian walkways were buried, and the scenic roads were blocked, and the stone masonry check dam in the channel was broken during this debris flow event. According to previous research, the amplification effect caused by dam breakage can contribute to debris flow damage in downstream towns [9,56]. Therefore, to characterize the relationship between dam failure and the occurrence of the debris flow on 4 August 2016, the dam-breaking peak discharges were estimated through the dam-breaking calculation method.
During the debris flow event that occurred in September 2017, the cross-section survey method was unavailable due to the lack of an available cross-section. A coarse boulder with dimensions of 1.3 m, 1.1 m and 0.7 m was transported 20 m downstream of the check dam by the debris flow in September 2017. According to previous studies, the largest transported particle reflects the maximum kinetic energy of flooding in mountain streams, and the maximum particle size parameters are widely used to reconstruct the velocity, depth and peak discharge of floods [57]. Thus, in this study, based on the assumption that the rainstorm, flood and debris flow frequencies were the same, the maximum particle size parameters were used to calculate the flood peak discharge, and the peak discharge of the debris flow in September 2017 was then estimated by using the methodology proposed by Lanzoni [58] according to the calculated flood peak discharge.

3.1. Rain-Flood Method

The debris flow peak discharges under different occurrence frequencies are computed by Ref. [54]:
Q d f = D d f ( 1 + ψ d f ) Q f
ψ d f = ( γ d f γ w ) / ( γ s γ d f )
where Ddf is the blockage coefficient, whose value varies with the degree of blockage, namely, very serious blockage (Ddf = 3.0–2.6), serious blockage (Ddf = 2.5–2.0), normal blockage (Ddf = 1.9–1.5) and minor blockage (Ddf = 1.4–1.1); ψdf is the amplification coefficient of the debris flow peak discharge; γdf is the density of the debris flow (t/m3); γw is the density of water (t/m3), usually taken as 1.00 t/m3; γs is the density of the solid material (t/m3), usually taken as 2.65 t/m3; and Qf is the flood peak discharge under different return periods (m3/s), which is calculated by:
Q f = 0.278 φ S t n F
where φ is the runoff coefficient of the flood peak, which is related to the convergence of runoff; S is the rainfall intensity (mm); t is the runoff confluence time of the rainstorm (h); n is the attenuation index of the rainstorm; and F is the watershed area (m2). Here, φ, S, t and n are calculated by the following empirical equations:
φ = 1 1.1 η S t 0 n
S = H 1 K 1
t = t 0 φ 1 4 n
n = 1 + 1.285 ( l g H 1 K 1 H 6 K 6 )
where H1 and H6 are the 1-hour average rainfall and 6-hour average rainfall, respectively (mm), which are obtained from “The Rainstorm and Flood Calculation Manual of Medium and Small Basins in Sichuan Province” (published in 2010, with rainfall data from 1978 to 2004); K1 and K6 are the modulus coefficients corresponding to H1 and H6 under different return periods, respectively, which can be obtained from a Pearson type III distribution table; η is the runoff yield parameter, which reflects the average infiltration intensity (mm/h); t0 is the runoff confluence time of the rainstorm when φ equals 1, which can be calculated by:
η = 3.6 K P F 0.19
t 0 = [ 0.383 m S 1 / 4 / θ ] 4 4 n
where Kp is the modulus coefficient when the variation coefficient is equal to 0.23, which is obtained from the Pearson type III distribution table; m is the runoff confluence parameter; and θ is the watershed characteristic parameter, which is obtained from:
m = 0.221 θ 0.204
θ = L J 1 / 3 F 1 / 4
where L is the main channel length and J is the longitudinal slope of the channel.

3.2. Cross-Section Survey Method

Because natural channels have irregular channel bottoms, information on the channel roughness is not easy to obtain and measure. Therefore, an empirical formulation (Manning formula) was developed for turbulent flows in rough channels. It can be applied to calculate the discharge for fully rough turbulent flows and water flows. Although it is an empirical relationship, it has been found to be reasonably reliable [59,60]. Thus, the Manning formula was employed to obtain debris flow peak discharge when computing by the cross-section survey method. Based on the mud marks and cross-section morphology of the channel, the debris flow peak discharge Qdf (m3/s) can be obtained by Ref. [54]:
Q d f = A d f V d f
where Adf is the area of the cross-section (m2), and Vdf is the average velocity of the debris flow (m/s), which can be calculated by:
V d f = 1 n d f R d f 2 / 3 I d f 1 / 2
where ndf is the roughness coefficient of the debris flow gully, Rdf is the hydraulic radius of the debris flow (m), and Idf is the longitudinal slope gradient of the channel bed (m/m).

3.3. Dam-Breaking Calculation Method

Considering the scarcity of observational data in this study, three commonly used semi-empirical methods are employed to obtain the dam-breaking peak discharge during the debris flow event on 4 August 2016. The semi-empirical method of the Ministry of Water Resources of the People’s Republic of China (MWR) [61] estimates the debris flow peak discharge Qdf through:
Q d f = 8 27 g B 0 h 0 / B m 0.28 B m ( h 0 h d ) 1.22
Q d f = 8 27 g ( B 0 B m ) 0.4 ( h 0 + 10 h d h 0 ) 0.3 B m ( h 0 h d ) 1.5
where g is acceleration due to gravity (9.8 m2/s); B0 is the debris flow width before breakage (m); h0 is the debris flow depth before breakage (m); Bm is the breach width (m), and hd is the residual height of the dam.
The semi-empirical method of Dai and Wang [62] calculates the debris flow peak discharge Qdf by:
Q d f = 0.27 g ( L b / B 0 ) 1 / 10 ( B 0 / B m ) 1 / 3 B m ( h 0 κ h d ) 3 / 2
where Lb is the deposit length of the debris flow material behind the check dam (m); κ is the influence factor that accounts for residual height, which is obtained by:
κ = 1.4 ( B m h d / B 0 h 0 ) 1 / 3 , B m h d / B 0 h 0 < 0.3 0.92 , B m h d / B 0 h 0 > 0.3

3.4. Maximum Boulder Size Method

Based on the particle size parameters of the maximum-sized boulder, the debris flow peak discharge can be obtained through Ref. [58]:
Q d f = 1 1 C Q f
C = ρ f tan β ( ρ s ρ f ) ( t a n ϕ d f tan β )
where C is the transported sediment concentration; ρf is the fluid density (kg/m3); ρs is the sediment density; β is the bed slope angle (degrees), and the value of β is usually between 15° to 25° when using Equation (19) [63]; φdf is the quasi-static friction angle (degrees); and Qf is the flood peak discharge (m3/s), which was estimated by the methods of Schoklitsch, Helley, Williams and Clarke.

3.4.1. Method of Schoklitsch

This method estimates the flood peak discharge Qf (m3/s) by computing the unit width flux by Ref. [64,65]:
q f = 0.0194 d I ( tan β ) 4 / 3
Q f = q f B f
where qf is the unit width flux; dI is the diameter of the boulder intermediate axis (m), and Bf is the channel width (m).

3.4.2. Method of Helley

This method computes the “bed velocity” for incipient motion (overturning) by equating the turning moments for fluid, drag, and lift with the resisting moment of the submerged particle weight. The critical velocity Vf (bed velocity) can be calculated by Ref. [66]:
V f = 3.276 [ ( ρ b / 1000 1 ) d L ( d s + d I ) 2 M R L ( C D d S d L M R D + 0.178 d I d L M R L ) ] 0.5
M R L = d I c o s α / 4 + 3 16 d S 2 sin α
M R D = 0.1 d S cos α + 3 16 S 2 d cos α d I sin α / 4
where ρb is the maximum boulder density (kg/m3); dL is the diameter of the boulder long axis (m); dS is the diameter of the boulder short axis (m); CD is the drag coefficient; MRD and MRL are the drag turning arm and lift turning arm, respectively; and α is the original imbrication angle of the deposited boulder. During the calculation process, Equation (22) uses English units of feet, and the units of critical velocity calculated by Equation (22) need to be converted into metres per second.
The critical velocity Vf calculated by Equation (22) needs to be converted to the average velocity Vavg [57]:
V avg = 1.2 V f
The flood peak discharge Qf can then be calculated as the product of the average velocity, mean depth and channel width by:
Q f = V a v g h f B f
where hf is the mean flood depth (m). Given that the channel width was much larger than the mean depth of flooding, the hydraulic radius obtained by the Manning formula can estimate the average depth; thus, hf was obtained by the Manning formula:
h f = ( V a v g n f tan β ) 1.5
where nf is the roughness coefficient of a mountain stream.

3.4.3. Method of Williams

This approach calculates either the bed shear stress or the stream power needed to entrain the boulder. First, the intermediate axis diameter of the largest boulder dI is obtained through field investigation, and then the empirical relationship between the unit stream power w, bed shear stress τ, average velocity Vavg and dI is established by Ref. [67]:
w = 0.079 d I 1.3
τ = 0.17 d I
V a v g = 0.065 d I 0.5
Vavg, hf and Qf based on the shear stress can be determined by Equations (30)–(32), respectively:
h f = τ ρ b g tan β
Q f = w B f ρ b g tan β
Vavg and hf based on the stream power can be obtained by:
V a v g = Q f ρ b g tan β B f τ
h f = w ρ b g tan β 0.065 d I
The value of Qf in Equation (33) is obtained by Equation (32); then, Qf based on the stream power can be obtained by inserting the calculated values of Vavg and hf from Equations (33) and (34), respectively, into Equation (26).

3.4.4. Method of Clarke

This method assumes that the critical force (i.e., the minimum force needed to move the boulder) is equal to the resisting force and that the critical force is equal to the sum of the lift force and drag force. The critical velocity Vf (bed velocity) required to carry the maximum-sized boulder is solved by the following formula [68]:
V f = { 2 [ ( F D / C D ) / ρ f ] / A B } 0.5
where CD is the lift coefficient of the boulder, which is dependent on the shape of the largest boulder, with CD = 1.18 for a cubic boulder and 0.20 for a spherical boulder; AB is the cross-sectional area of the largest boulder; and FD is the drag force, which is obtained by:
F D = C D F C / ( C L + C D )
where CL is the lift drag coefficient, which is dependent on the shape of the largest boulder, with CL = 0.178 for a cubic boulder and 0.20 for a spherical boulder; and FC is the critical force, which is calculated by:
F C = F R
F R = M B [ ( ρ b ρ f ) / ρ b ] g ( μ c o s β s i n β )
where μ is the shape coefficient, which is dependent on the shape of the largest boulder, with μ = 0.675 for a cubic boulder and 0.225 for a spherical boulder; and MB is the boulder mass (kg). MB can be obtained for a cubic boulder and a spherical boulder by Equations (39) and (40), respectively:
M B = ρ b D 3
M B = ρ b [ ( π / 6 ) D 3 ]
where D is the nominal diameter of the boulder (m), which is solved by:
D = ( d L d I d S ) 0.33
The flood peak discharge Qf can be obtained by inserting the calculated value of Vf into Equations (25)–(27).

4. Results

4.1. The Calculated Debris Flow Peak Discharge in 2016

With the data collected during the field investigation, the peak discharge of the debris flow that occurred on 4 August 2016 was estimated by the cross-section survey method and dam-breaking calculation method. Table 2 shows the calculation results for the debris flow peak discharge. The permissible debris flow peak discharges at the two typical mud mark cross-sections estimated by the cross-section survey method were 33.29 m3/s and 36.69 m3/s. The values of Adf, Rdf and Idf were obtained through field investigation. The roughness coefficient of the debris flow gully (ndf) is related to the properties of the debris flow fluid and channel characteristics, and the value in this case is 0.1 according to a field survey [54].
According to the calculation results in Table 2, the permissible maximum debris flow peak discharges resulting from the breach in the check dam varied from 36.5 m3/s to 43.6 m3/s. The calculation result by Equation (14) was the lowest (36.5 m3/s), and the calculation result by Equation (15) was the highest (43.6 m3/s). The values of B0, h0, Bm, hd, and Lb were obtained by field investigation. Since the data inputs used in Equations (14)–(16) were the same, the differences among the results arose from the different combinations of data used for a given technique. The calculated values are reasonable and are similar to the debris flow peak discharge estimated by the cross-section survey method.

4.2. The Calculated Debris Flow Peak Discharge in 2017

With data collected during the field investigation, the peak discharge of the debris flow that occurred in September 2017 was calculated by the maximum boulder size method. Table 3 shows the calculation results. The calculated values of Qf vary from 0.58 m3/s to 6.05 m3/s, and the calculated values of Qdf range from 1.76 m3/s and 18.33 m3/s. The minimum permissible debris flow peak discharge of 1.76 m3/s is estimated through the method of Schoklitsch, and the maximum discharge of 18.33 m3/s is estimated through the method of Helley. ρf is usually taken as 1150 kg/m3 considering the turbidity of the flood waters [68]. ρs is usually taken as 2650 kg/m3. Owing to the absence of information, a value of 36.5° was given for φdf based on previous studies [58]. The values of dL, dI, dS, ρb, Bf, β, and α were obtained through field investigation. The transported sediment concentration (C) is 0.67 by inserting the values of ρf, ρs, β and φdf into Equation (19). The roughness coefficient of a mountain stream (nf) is related to the channel characteristics, and a value of 0.05 was used here according to a field survey [69].

4.3. The Calculated Debris Flow Peak Discharge under Different Occurrence Frequencies

According to the magnitude of the debris flow, hazard degree and importance of the protection object, mitigation countermeasures in Zechawa Gully were required to resist a debris flow with a return period of 20–50 years [70]. Thus, the debris flow peak discharges under 10-, 20- and 50-year return periods were computed, and the calculated results of related parameters are listed in Table 4. The possible debris flow peak discharges under 10-year, 20-year and 50-year return periods are 22.27 m3/s, 32.73 m3/s and 48.27 m3/s respectively. In the calculation sections, the values of F, L and J are different, resulting in different debris flow peak discharges estimated by the rain-flood method.
To better compare with the debris flow peak discharges calculated by the cross-section survey method, dam-breaking calculation method and maximum boulder size method, the calculation section located at the check dam site was selected to compute the debris flow peak discharges through the rain-flood method. The values of F, L and J were obtained from a topographic map with a scale of 1:5000. According to the results of the querying specification table and spot investigation, the average density of the debris flow was 1.8 t/m3. Under given conditions, the debris flow density is positively related to the debris flow peak discharge [54,71], thus the densities of the debris flows γdf under the three return periods (10-year, 20-year and 50-year) were 1.8 t/m3, 1.85 t/m3 and 1.9 t/m3, respectively. According to the site investigation, the blockage degree of the channel was normal, and the values of Ddf were considered to be 1.8–1.9.

5. Discussion

5.1. The Applicability and Limitations of the Calculated Debris Flow Peak Discharge

The debris flow peak discharge is an important parameter for debris flow disaster prevention and risk assessment. As debris flows occur in remote mountain areas, it is difficult to measure the peak discharge and other parameters of debris flow under the conditions of severe weather and traffic delays. At present, the debris flow peak discharge is usually calculated by the rain-flood method and cross-section survey method based on certain assumptions, resulting in calculation results with low credibility. In this study, under certain assumptions, the peak discharge of debris flow was estimated by the rain-flood method, the cross-section survey method, the dam-breaking calculation method and the maximum boulder size method, and comparative analysis of the calculation results was conducted to obtain an accurate peak discharge. The limitations of the calculation results are explained as follows:
(1)
Due to the complexity of debris flows and the measurement limitation, the values of relevant parameters are usually obtained by field surveys and querying the specifications. In this study, the roughness coefficient of the debris flow gully (ndf), the roughness coefficient of a mountain stream (nf), the density of debris flow (γdf) and the blockage coefficient (Ddf) were obtained through field investigations and querying specifications.
(2)
Considering the complexity of the debris flow and the operability of the calculation method, it is necessary to make certain assumptions and simplifications to obtain the peak discharge of the debris flow in the calculation process. The rain-flood method assumes that the occurrence frequencies of rainstorms, floods and debris flows are the same and that the calculated flood peak discharge is completely converted into the peak discharge of the debris flow [54]. Under such assumptions, important parameters such as debris flow peak discharge and total volume of debris flow material under different occurrence frequencies can be obtained, which provide important references for the design of engineering countermeasures. In addition, the breach in the check dam was idealized as a trapezoidal shape, and the average width of the breach was taken as the calculated value of Bm in the dam-breaking calculation.
(3)
Four methods were used to estimate the peak discharge of the debris flow based on the maximum particle size parameters (Table 3), and the related issues in the calculation are as follows: Both Clarke and Helley solved for the critical velocity required to move the largest boulder, obtained the flow depth through the Manning formula, and finally calculated the peak discharge. Differences in the critical velocity result in differences in the flow depth and peak discharge. The method of Clarke idealizes the largest boulder as either cubic or spherical for the shape-dependent parameters, and the calculated velocities are averaged to provide the critical velocity. By setting the critical force FC = 0, the downward gravitational component is balanced by the gravity-induced friction, and the extreme use condition of this method can be obtained. The limit bed slope angle (β) is equal to 34.1° for a cubic boulder and 12.7° for a spherical boulder when using the Clarke method; therefore, a spherical boulder is easier to move than the cubic boulder under the same conditions. According to the field investigation, β is equal to 19°, which exceeds the limit bed slope angle for a spherical boulder. Therefore, the selected boulder in this study was considered a cubic boulder, resulting in a calculated critical velocity that is higher than the actual value. Compared with the method of Clarke, the method of Helley neglects the bed slope, ignoring the downstream gravitational component. Generally, the bed slope of a stream is small; even for a stream with a channel longitudinal slope of 10%, the downstream gravitational component is negligibly small compared to the fluid drag and lift, so this component can be ignored [57]. However, the bed slope is 19° in this study, and neglecting the gravitational component results in a calculated critical velocity that is much higher than the actual value, ultimately resulting in a higher calculated peak discharge. The methods of Schoklitsch and Williams estimate the peak discharge by establishing an empirical correlation based on boulder size parameters without considering the influence of the boulder shape on the calculation results. In addition, the values of w, τ and Vavg in the method of Williams represent the lowest values, and the actual values are higher than the calculated value.
(4)
In summary, certain assumptions and simplifications were made in the calculation process, causing the peak discharge of the debris flow calculated by a single method to exhibit low accuracy. Thus, multiple methods should be used to comprehensively obtain the peak discharge, further quantifying the scale of debris flow disasters. It is worth noting that the method for calculating the debris flow peak discharge proposed in this study is mainly based on the specifications in China, especially the selection of some parameters. When calculating the debris flow peak discharge in other countries, local specifications should be considered.

5.2. The Scales of the Debris Flow Disasters in 2016 and 2017

To identify the disaster characteristics and the occurrences of debris flow events, the peak discharges of the debris flows occurring on 4 August 2016 and in September 2017 were estimated based on field investigations, and the calculation results were compared with the debris flow peak discharges under different occurrence frequencies to quantify the scale of the debris flow disasters. The related explanations are as follows:
(1)
The debris flow peak flow obtained by the cross-section survey method and dam-breaking calculation method are essentially the same and are generally equivalent to the peak discharge of the debris flow with a 20-year return period (Table 2 and Table 4). In addition, the total volume of the debris flow material Wdf is estimated by Ref. [54]:
W d f = 0.264 Q d f T d f
where Tdf is the duration time of the debris flow (s), and its value is approximately 1500 s based on the reports of patrol personnel. The value of Qdf is the average calculation result through the cross-section survey method and dam-breaking calculation method, and its value is 37.38 m3/s. The total volume of debris flow material from Equation (42) is 1.48 × 10⁴ m3, which is consistent with the value of 1.39 × 10⁴ m3 based on the field investigation. Thus, it is reasonable that the scale of the debris flow on 4 August 2016 is equivalent to that of a debris flow with a 20-year return period. Moreover, based on the study above, the debris flow peak discharges calculated by Equations (14)–(16) were similar to the values obtained by the cross-section survey method. Thus, we conclude that the debris flow peak discharge on 4 August 2016 was amplified by the failure of the check dam, causing widespread damage, and this aspect also explains why the magnitude of the debris flow on 4 August 2016 was large even though the accumulated rainfall and rainfall intensity were extremely low. Similarly, check dam failures have led to catastrophic disasters in other regions, such as the “8.13” Wenjiagou debris flow event [72] and the “8.8” Zhouqu debris flow event [73,74].
(2)
Based on the above analysis, the flood peak discharge estimated by the method of Helley is the largest, and is equivalent to that of a debris flow with a 10-year return period. Both of the peak discharges calculated by the methods of Clarke and Helley are larger than the actual value, while the value calculated by the method of Williams is smaller than the actual value. In addition, compared with the extensive destruction of the 2016 debris flow event with a 20-year return period, the destruction of the 2017 debris flow event was smaller, according to the field investigation. Therefore, it is reasonable that the magnitude of the debris flow in September 2017 was less than that of a debris flow with a 10-year return period.
(3)
In the remote mountain areas of China, rainfall data are difficult to obtain, and the rainfall throughout a whole catchment usually cannot be recorded by precipitation stations due to the influence of terrain, resulting in inconsistencies between the triggering rainfall and the scale of debris flow disasters. Thus, the relationships between the occurrence of debris flow disasters and the triggering rainfall are not researched in this paper.

5.3. Mitigation Countermeasures in Zechawa Gully

More than 23 × 104 m3 of loose solid material was generated by the Ms 7.0 Jiuzhaigou earthquake and remains available as material for debris flows in Zechawa Gully in the near future [37,75]. Therefore, appropriate engineering countermeasures must be taken in a timely manner to mitigate post-earthquake debris flow disasters. According to the field investigation and calculation results above, the stone masonry check dam built in 2009 were broken, and the failure of the check dam amplified the debris flow peak discharge, resulting in a very large amount of damage during the debris flow event on 4 August 2016. Thus, the potential failure of a check dam should be fully taken into account during engineering design processes, and an integrated strategy including blocking measures and deposit stopping measures should be adopted for debris flow mitigation. On the one hand, the construction of deposit stopping structures (e.g., retaining walls) can increase the retention capacity of engineering structures; on the other hand, the debris flow material can be trapped by the deposit stopping structures even if the blocking structures (e.g., check dams) in the channel are damaged, thereby reducing the disaster risk downstream.
The engineering countermeasure taken in 2009 were designed to resist a debris flow with a 20-year return period but were damaged during the debris flow event in 2016. Considering the high-frequency and large-scale characteristics of post-earthquake debris flows, engineering countermeasures were designed to resist a debris flow with a 50-year return period after the Ms 7.0 Jiuzhaigou earthquake based on the scale, damage degree and threatened objects threatened by the subsequent debris flows. The total volume of debris flow material with a 50-year return period can be obtained by inserting the calculated value of Qdf into Equation (42), and the resulting value is 1.91 × 10⁴ m3 (Table 4). Thus, the designed engineering structures are required to trap at least 1.91 × 10⁴ m3 of debris flow material. In addition, the control principles of prevention projects should not only control the debris flow itself but also operate in harmony with the landscape and reduce the harm to landscape resources, as required in Jiuzhaigou Valley [76]. Under the guidance of these principles, in conjunction with the specific characteristics of the Zechawa debris flows, a concrete check dam and a concrete auxiliary dam were constructed in the channel, and a concrete retaining wall was constructed on the debris flow fan. The concrete check dam, 42.6 m long and 6 m high, was built close to but downstream of the broken stone masonry check dam in order to reduce the peak discharge, stabilize the gully bed, minimize scouring along the bottom and sides of the gully, and stabilize the debris flow material trapped behind the broken check dam. The downstream concrete auxiliary dam, 38.1 m long and 3 m high, was constructed close to the concrete check dam to protect the latter’s foundation (Figure 5). Moreover, the reconstructed check dams were located somewhat upstream in the gully and were satisfactorily concealed. The retaining wall with a total length of 95.6 m was built 93 m away from the scenic road and is out of sight of tourists, and it can trap a volume of 2.27 × 10⁴ m3 of debris flow materials (Figure 6). In May 2019, new control works (the reconstructed check dam and the retaining wall) were finished.

5.4. Effectiveness of Mitigation Countermeasures and Evaluation of Debris Flow Impact Force

On 21 June 2019, one post-earthquake debris flow was triggered by heavy rainfall, and a volume of 2.3 × 10⁴ m3 of debris flow material was transported; this value was greater than the calculated total volume of debris flow material with a 50-year return period in Table 4. A volume of 0.48 × 10⁴ m3 of debris flow sediment was trapped by the concrete check dam (Figure 5), which contributed to stabilizing the gully bed and preventing entrainment of additional material. Moreover, a volume of approximately 0.66 × 10⁴ m3 debris flow sediment was trapped by the retaining wall (Figure 6), and a portion of material with a volume of 1.16 × 10⁴ m3 emerged from the breach in the middle of the retaining wall and was transported downstream. During the debris flow event on 21 June 2019, the prevention projects played a satisfactory role in controlling the debris flow disaster even though the flow magnitude exceeded the design standard.
In addition, studying the damage mechanism of mitigation structures is significant for effective debris flow mitigation. According to previous studies, the huge impact force of a debris flow can contribute significantly to the destruction of mitigation structures [34,77], and numerous impact models have been established [77,78,79,80]. Through comprehensive analysis of the existing debris flow impact models, a modified hydro-static model with a good prediction capability was proposed by Vagnon [77]. Therefore, the impact force of debris flow on the retaining wall was evaluated to study the damage mechanism by Ref. [77]:
P p e a k = 2.07 F r 1.64 γ d f g h d f
F r = V d f / g h d f
where Ppeak is the peak impact pressure (kN/m2); Fr is the Froude number; and hdf is the mean debris flow depth (m). Considering the large scale of the debris flow disaster on 21 June 2019, γdf is taken as 1.9 t/m3 according to Table 4. Based on field investigation, the average velocity of the debris flow (Vdf) near the retaining wall was calculated through Equation (13), and related parameters are shown in Table 5.
Based on the related report, the designed resistance of the retaining wall is 51.34 KN/m2 [75], which is far below the calculated value of the peak impact pressure (80.39 kN/m2) in Table 5. The debris flow impact force was greater than the resistance of the retaining wall, causing partial failure of the retaining wall on 21 June 2019. Thus, the resistance of the retaining wall should be increased during the design processes. In general, considerable attention should be given to the post-earthquake debris flow disaster in Zechawa Gully in the future, and it is necessary to repair the broken retaining wall with a greater design resistance and remove the debris flow material deposited behind the retaining wall to prepare for the next post-earthquake debris flow in the near future.

6. Conclusions

This study is intended to describe the debris flow events in Zechawa Gully, characterize the debris flow disaster, propose appropriate mitigation countermeasures and analyse the effectiveness of mitigation countermeasures that were already implemented in May 2019. Field investigations were conducted in a timely manner to determine the debris flow peak discharge, and the disaster characteristics and occurrence of debris flows in 2016 were analysed. The following conclusions can be drawn:
(1)
In this study, the debris flow peak discharge was calculated using the rain-flood method, cross-section survey method, dam-breaking calculation method and maximum boulder size method. Based on our research, compared with previous results based on a single method, an accurate debris flow peak discharge can be obtained by comparing the results of each calculation method with each other, which increases the parameter accuracy for debris flow disaster prevention and risk assessment.
(2)
According to the classification criterion of the debris flow scale, the debris flows in Zechawa Gully can be classified as small-scale events (with a total volume of debris flow material less than 1.0 × 10⁴ m3) and medium-scale events (with a total volume of debris flow material between 1.0 × 10⁴ m3 and 10 × 104 m3) [81]. The scale of the debris flow event on 4 August 2016 was equivalent to that of a debris flow with a 20-year return period. After the Ms 7.0 Jiuzhaigou earthquake, at least one debris flow with a scale less than that of a debris flow with a 10-year return period was triggered in September 2017, and a destructive debris flow with a scale greater than that of a debris flow with a 50-year return period was triggered in June 2019.
(3)
The debris flow peak discharge on 4 August 2016 was amplified by the failure of the stone masonry check dam, causing widespread damage. Due to the disaster risk caused by dam breach incidents, an integrated strategy including blocking measures and deposit stopping measures should be adopted for debris flow mitigation.
(4)
Based on the debris flow hazard characteristics of Zechawa Gully, optimized engineering countermeasures (including blocking measures and deposit stopping measures) with a design standard of a 50-year return period were proposed. Combined with the debris flow control principles for national parks, one satisfactorily concealed concrete check dam and one retaining wall out of view of tourists were constructed in Zechawa Gully in May 2019.
(5)
On 21 June 2019, a post-earthquake debris flow was triggered by heavy rainfall, and the engineering countermeasure, including blocking and deposit stopping measures, were effective in mitigating the debris flow disaster even though the debris flow magnitude was greater than the design standard of the reconstructed engineering projects. More attention should be paid to the post-earthquake debris flow disaster in Zechawa Gully, and it is necessary to repair the broken retaining wall with greater design resistance and to remove the debris flow material deposited behind the retaining wall in a timely manner to prepare for upcoming post-earthquake debris flows in the near future.

Notation

ABCross-sectional area of the largest boulder
AdfArea of the cross-section
BfChannel width
BmBreach width
B0Debris flow width before breakage
CTransported sediment concentration
CDLift coefficient of the boulder, which is dependent on the shape of largest boulder
C’DDrag coefficient
CLLift drag coefficient, which is dependent on the shape of the largest boulder
DNominal diameter of the boulder
DdfBlockage coefficient
dIDiameter of the boulder intermediate axis
dLDiameter of the boulder large axis
dSDiameter of the boulder short axis
FWatershed area
FCCritical force
FDDrag force
FrFroude number
gAcceleration due to gravity
H11-hour average rainfall
H66-hour average rainfall
hdResidual height of check dam
hdfMean debris flow depth
hfMean flood depth
h0Debris flow depth before breakage
IdfLongitudinal slope gradient of the channel bed
JLongitudinal slope of the channel
K1Modulus coefficients corresponding to H1 under different return periods
K6Modulus coefficients corresponding to H6 under different return periods.
KpModulus coefficient when the variation coefficient is equal to 0.23
LMain channel length
LbDeposit length of the debris flow material behind the check dam
MBBoulder mass
MRDDrag turning arm
MRLLift turning arm
mRunoff confluence parameter
nAttenuation index of the rainstorm
ndfRoughness coefficient of the debris flow gully
nfRoughness coefficient of a mountain stream
PpeakPeak impact pressure
QdfDebris flow peak discharge
QfFlood peak discharge
qfUnit width flux
RdfHydraulic radius of the debris flow
SRainfall intensity
TdfDuration time of the debris flow
tRunoff confluence time of the rainstorm
t0Runoff confluence time of the rainstorm when ϕ equals 1.
VavgAverage velocity
VdfAverage velocity of the debris flow
VfCritical velocity (bed velocity)
WdfTotal volume of the debris flow material
wUnit stream power
αOriginal imbrication angle of the deposited boulder
βBed slope angle
γdfDensity of the debris flow
γsDensity of the solid material
γwDensity of the water
θWatershed characteristic parameter
μShape coefficient, which is dependent on the shape of the largest boulder
ρbMaximum boulder density
ρfFluid density
ρsSediment density
τBed shear stress
ηRunoff yield parameter, which reflects the average infiltration intensity
ϕRunoff coefficient of the flood peak, which is related to the convergence of runoff
φdfQuasi-static friction angle
ψdfAmplification coefficient of the debris flow peak discharge
κInfluence factor that accounts for residual height

Author Contributions

X.-L.G. and K.-T.C. contributed to the conceptualization, methodology, analysis and manuscript writing of the study. X.-Q.C. proposed the main structure of this study and approved the final version. Y.Y. and J.-G.C. helped perform the analysis with constructive discussions. W.-Y.Z. and J.L. provided resources and participated in the field investigations. All authors have read and agreed to the published version of the manuscript.

Funding

This research was supported by the “8.8” Jiuzhaigou earthquake stricken area ecological disaster prevention and control of key scientific and technological support project of Land and Resources Department of Sichuan Province (Research on Prevention and Control Technology of Ecological Debris Flow Disasters, Grant No. KJ-2018-24), the National Natural Science Foundation of China (Grant No. 51709259), the Foundation for Young Scientists of the Institute of Mountain Hazards and Environment, CAS (Grant No. SDS-QN-1912), CAS “Light of West China” Program, the Youth Innovation Promotion Association CAS (2017426) and the Open Foundation of Key Laboratory of Mountain Hazards and Earth Surface Processes, CAS.

Conflicts of Interest

The authors declare no conflict of interest.

References

  1. Huggett, R. Fundamentals of Geomorphology; Routledge: London, UK, 2007. [Google Scholar] [CrossRef]
  2. Jakob, M.; Hungr, O. Debris-Flow Hazards and Related Phenomena; Springer: Berlin, Germany, 2005. [Google Scholar]
  3. Hungr, O.; Leroueil, S.; Picarelli, L. The Varnes classification of landslide types, an update. Landslides 2014, 11, 167–194. [Google Scholar] [CrossRef]
  4. Chen, K.-T.; Chen, X.-Q.; Hu, G.-S.; Kuo, Y.-S.; Huang, Y.-R.; Shieh, C.-L. Dimensionless assessment method of landslide dam formation caused by tributary debris flow events. Geofluids 2019. [Google Scholar] [CrossRef] [Green Version]
  5. Chen, K.-T.; Chen, X.-Q.; Niu, Z.-P.; Guo, X.-J. Early identification of river blocking induced by tributary debris flow based on dimensionless volume index. Landslides 2019. [Google Scholar] [CrossRef]
  6. Chen, K.-T.; Lin, C.-H.; Chen, X.-Q.; Hu, G.-S.; Guo, X.-J.; Shieh, C.-L. An assessment method for debris flow dam formation in Taiwan. Earth Sci. Res. J. 2018, 22, 37–43. [Google Scholar] [CrossRef]
  7. Ni, H.; Zheng, W.; Song, Z.; Xu, W. Catastrophic debris flows triggered by a 4 July 2013 rainfall in Shimian, SW China: Formation mechanism, disaster characteristics and the lessons learned. Landslides 2014, 11, 909–921. [Google Scholar] [CrossRef]
  8. Tang, C.; Zhu, J.; Ding, J.; Cui, X.F.; Chen, L.; Zhang, J.S. Catastrophic debris flows triggered by a 14 August 2010 rainfall at the epicenter of the Wenchuan earthquake. Landslides 2011, 8, 485–497. [Google Scholar] [CrossRef]
  9. Yu, B.; Ma, Y.; Wu, Y. Case study of a giant debris flow in the Wenjia Gully, Sichuan Province, China. Nat. Hazards 2012, 65, 835–849. [Google Scholar] [CrossRef]
  10. Chen, M.-L.; Liu, X.-N.; Wang, X.-K.; Zhao, T.; Zhou, J.-W. Contribution of Excessive Supply of Solid Material to a Runoff-Generated Debris Flow during Its Routing Along a Gully and Its Impact on the Downstream Village with Blockage Effects. Water 2019, 11, 169. [Google Scholar] [CrossRef] [Green Version]
  11. Chen, X.; Cui, P.; You, Y.; Chen, J.; Li, D. Engineering measures for debris flow hazard mitigation in the Wenchuan earthquake area. Eng. Geol. 2015, 194, 73–85. [Google Scholar] [CrossRef]
  12. Ni, H.; Tang, C.; Zheng, W.; Xu, R.; Tian, K.; Xu, W. An overview of formation mechanism and disaster characteristics of post-seismic debris flows triggered by subsequent rainstorms in Wenchuan earthquake extremely stricken areas. Acta Geol. Sin. 2014, 88, 1310–1328. [Google Scholar] [CrossRef]
  13. Ni, H.Y.; Zheng, W.M.; Tie, Y.B.; Su, P.C.; Tang, Y.Q.; Xu, R.G.; Wang, D.W.; Chen, X.Y. Formation and characteristics of post-earthquake debris flow: A case study from Wenjia gully in Mianzhu, Sichuan, SW China. Nat. Hazards 2011, 61, 317–335. [Google Scholar] [CrossRef]
  14. Yu, B.; Wu, Y.; Chu, S. Preliminary study of the effect of earthquakes on the rainfall threshold of debris flows. Eng. Geol. 2014, 182, 130–135. [Google Scholar] [CrossRef]
  15. Guo, X.; Cui, P.; Li, Y.; Zhang, J.; Ma, L.; Mahoney, W.B. Spatial features of debris flows and their rainfall thresholds in the Wenchuan earthquake-affected area. Landslides 2016, 13, 1215–1229. [Google Scholar] [CrossRef]
  16. Guo, X.; Cui, P.; Marchi, L.; Ge, Y. Characteristics of rainfall responsible for debris flows in Wenchuan earthquake area. Environ. Earth Sci. 2017, 76, 596. [Google Scholar] [CrossRef]
  17. Li, T.-T.; Huang, R.-Q.; Pei, X.-J. Variability in rainfall threshold for debris flow after Wenchuan earthquake in Gaochuan River watershed, Southwest China. Nat. Hazards 2016, 82, 1967–1980. [Google Scholar] [CrossRef]
  18. Ma, C.; Wang, Y.; Hu, K.; Du, C.; Yang, W. Rainfall intensity-duration threshold and erosion competence of debris flows in four areas affected by the 2008 Wenchuan earthquake. Geomorphology 2017, 282, 85–95. [Google Scholar] [CrossRef]
  19. Shieh, C.L.; Chen, Y.S.; Tsai, Y.J.; Wu, J.H. Variability in rainfall threshold for debris flow after the Chi-Chi earthquake in central Taiwan, China. Int. J. Sediment Res. 2009, 24, 177–188. [Google Scholar] [CrossRef]
  20. Zhou, W.; Tang, C. Rainfall thresholds for debris flow initiation in the Wenchuan earthquake-stricken area, Southwestern China. Landslides 2014, 11, 877–887. [Google Scholar] [CrossRef]
  21. Tang, C.; van Asch, T.W.J.; Chang, M.; Chen, G.Q.; Zhao, X.H.; Huang, X.C. Catastrophic debris flows on 13 August 2010 in the Qingping area, Southwestern China: The combined effects of a strong earthquake and subsequent rainstorms. Geomorphology 2012, 139–140, 559–576. [Google Scholar] [CrossRef]
  22. Zeng, Q.L.; Yue, Z.Q.; Yang, Z.F.; Zhang, X.J. A case study of long-term field performance of check-dams in mitigation of soil erosion in Jiangjia stream, China. Environ. Geol. 2008, 58, 897–911. [Google Scholar] [CrossRef]
  23. Peng, C.; Yongming, L. Debris-Flow Treatment: The Integration of Botanical and Geotechnical Methods. J. Resour. Ecol. 2013, 4, 097–104. [Google Scholar] [CrossRef]
  24. DeWolfe, V.G.; Santi, P.M.; Ey, J.; Gartner, J.E. Effective mitigation of debris flows at Lemon Dam, La Plata County, Colorado. Geomorphology 2008, 96, 366–377. [Google Scholar] [CrossRef]
  25. Piton, G.; Carladous, S.; Recking, A.; Tacnet, J.M.; Liébault, F.; Kuss, D.; Quefféléan, Y.; Marco, O. Why do we build check dams in Alpine streams? An historical perspective from the French experience. Earth Surf. Process. Landf. 2016, 42, 91–108. [Google Scholar] [CrossRef]
  26. Cucchiaro, S.; Cavalli, M.; Vericat, D.; Crema, S.; Llena, M.; Beinat, A.; Marchi, L.; Cazorzi, F. Geomorphic effectiveness of check dams in a debris-flow catchment using multi-temporal topographic surveys. CATENA 2019, 174, 73–83. [Google Scholar] [CrossRef]
  27. Cucchiaro, S.; Cazorzi, F.; Marchi, L.; Crema, S.; Beinat, A.; Cavalli, M. Multi-temporal analysis of the role of check dams in a debris-flow channel: Linking structural and functional connectivity. Geomorphology 2019. [Google Scholar] [CrossRef]
  28. Piton, G.; Recking, A. Design of Sediment Traps with Open Check Dams. I: Hydraulic and Deposition Processes. J. Hydraul. Eng. 2016, 142. [Google Scholar] [CrossRef]
  29. Bernard, M.; Boreggio, M.; Degetto, M.; Gregoretti, C. Model-based approach for design and performance evaluation of works controlling stony debris flow with an application to a case study at Rovina di Cancia (Venetian Dolomites, Northeast Italy). Sci. Total Environ. 2019. [Google Scholar] [CrossRef]
  30. Albaba, A.; Lambert, S.; Kneib, F.; Chareyre, B.; Nicot, F. DEM Modeling of a Flexible Barrier Impacted by a Dry Granular Flow. Rock Mech. Rock Eng. 2017, 50, 3029–3048. [Google Scholar] [CrossRef]
  31. Leonardi, A.; Wittel, F.K.; Mendoza, M.; Vetter, R.; Herrmann, H.J. Particle-Fluid-Structure Interaction for Debris Flow Impact on Flexible Barriers. Comput.-Aided Civ. Infrastruct. Eng. 2015, 31, 323–333. [Google Scholar] [CrossRef] [Green Version]
  32. Zhu, Z.-H.; Yin, J.-H.; Qin, J.-Q.; Tan, D.-Y. A new discrete element model for simulating a flexible ring net barrier under rockfall impact comparing with large-scale physical model test data. Comput. Geotech. 2019, 116, 103208. [Google Scholar] [CrossRef]
  33. Albaba, A.; Lambert, S.; Nicot, F.; Chareyre, B. Relation between microstructure and loading applied by a granular flow to a rigid wall using DEM modeling. Granul. Matter 2015, 17, 603–616. [Google Scholar] [CrossRef]
  34. Wang, G.L. Lessons learned from protective measures associated with the 2010 Zhouqu debris flow disaster in China. Nat. Hazards 2013, 69, 1835–1847. [Google Scholar] [CrossRef]
  35. Liu, F.Z.; Xu, Q.; Dong, X.J.; Yu, B.; Frost, J.D.; Li, H.J. Design and performance of a novel multi-function debris flow mitigation system in Wenjia Gully, Sichuan. Landslides 2017, 14, 2089–2104. [Google Scholar] [CrossRef]
  36. Chen, X.-Q.; Chen, J.-G.; Cui, P.; You, Y.; Hu, K.-H.; Yang, Z.-J.; Zhang, W.-F.; Li, X.-P.; Wu, Y. Assessment of prospective hazards resulting from the 2017 earthquake at the world heritage site Jiuzhaigou Valley, Sichuan, China. J. Mt. Sci. 2018, 15, 779–792. [Google Scholar] [CrossRef]
  37. Hu, X.; Hu, K.; Tang, J.; You, Y.; Wu, C. Assessment of debris-flow potential dangers in the Jiuzhaigou Valley following the August 8, 2017, Jiuzhaigou earthquake, Western China. Eng. Geol. 2019, 256, 57–66. [Google Scholar] [CrossRef]
  38. Zhao, B.; Wang, Y.S.; Luo, Y.H.; Li, J.; Zhang, X.; Shen, T. Landslides and dam damage resulting from the Jiuzhaigou earthquake (8 August 2017), Sichuan, China. R. Soc. Open Sci. 2018, 5, 171418. [Google Scholar] [CrossRef] [Green Version]
  39. Chen, S.F.; Wilson, C.; Deng, Q.D.; Zhao, X.L.; Zhi, L.L. Active faulting and block movement associated with large earthquakes in the Min Shan and Longmen Mountains, Northeastern Tibetan Plateau. J. Geophys. Res. Solid Earth 1994, 99, 24025–24038. [Google Scholar] [CrossRef]
  40. Yin, A.; Harrison, T.M. Geologic evolution of the Himalayan-Tibetan orogen. Ann. Rev. Earth Planet. Sci. 2000, 28, 211–280. [Google Scholar] [CrossRef] [Green Version]
  41. Zhao, D.; Qu, C.; Shan, X.; Gong, W.; Zhang, Y.; Zhang, G. InSAR and GPS derived coseismic deformation and fault model of the 2017 Ms7.0 Jiuzhaigou earthquake in the Northeast Bayanhar block. Tectonophysics 2018, 726, 86–99. [Google Scholar] [CrossRef]
  42. Liu, Z.; Tian, X.; Gao, R.; Wang, G.; Wu, Z.; Zhou, B.; Tan, P.; Nie, S.; Yu, G.; Zhu, G.; et al. New images of the crustal structure beneath eastern Tibet from a high-density seismic array. Earth Planet. Sci. Lett. 2017, 480, 33–41. [Google Scholar] [CrossRef]
  43. Ren, J.; Xu, X.; Yeats, R.S.; Zhang, S. Millennial slip rates of the Tazang fault, the Eastern termination of Kunlun fault: Implications for strain partitioning in eastern Tibet. Tectonophysics 2013, 608, 1180–1200. [Google Scholar] [CrossRef]
  44. Zhao, X.L.; Deng, Q.D.; Chen, S.F. Tectonic geomorphology of the Minshan uplift in Western Sichuan, Southwestern China. Seismol. Geol. 1994, 16, 429–439. (In Chinese) [Google Scholar]
  45. Zhou, R.; Li, Y.; Densmore, A.L.; Ellis, M.A.; He, Y.; Wang, F.; Li, X. Active tectonics of the eastern margin of the Tibet Plateau. J. Mineral. Petrol. 2006, 26, 40–51. (In Chinese) [Google Scholar] [CrossRef] [Green Version]
  46. Fan, X.; Scaringi, G.; Xu, Q.; Zhan, W.; Dai, L.; Li, Y.; Pei, X.; Yang, Q.; Huang, R. Coseismic landslides triggered by the 8th August 2017 M s 7.0 Jiuzhaigou earthquake (Sichuan, China): Factors controlling their spatial distribution and implications for the seismogenic blind fault identification. Landslides 2018, 15, 967–983. [Google Scholar] [CrossRef]
  47. Nie, Z.; Wang, D.-J.; Jia, Z.; Yu, P.; Li, L. Fault model of the 2017 Jiuzhaigou Mw 6.5 earthquake estimated from coseismic deformation observed using global positioning system and interferometric synthetic aperture radar data. Earth Planets Space 2018, 70, 55. [Google Scholar] [CrossRef] [Green Version]
  48. Xie, Z.; Zheng, Y.; Yao, H.; Fang, L.; Zhang, Y.; Liu, C.; Wang, M.; Shan, B.; Zhang, H.; Ren, J.; et al. Preliminary analysis on the source properties and seismogenic structure of the 2017 Ms7.0 Jiuzhaigou earthquake. Sci. China Earth Sci. 2018, 61, 339–352. [Google Scholar] [CrossRef]
  49. Cui, P.; Liu, S.Q.; Tang, B.X.; Chen, X.; Zhang, X. Debris Flow Study and Prevention in National Park; Science Press: Beijing, China, 2005; pp. 90–92. (In Chinese) [Google Scholar]
  50. Jiang, T.; Yang, J.C.; Peng, S.E.; Wang, S.F.; Zhou, Y.; Qi, Y.L.; Wei, J.G. Construction Drawing Design Report for the Control Projects of Zechawa and Xiajijie Debris Flow Disasters in Jiuzhaigou Valley; Nuclear Industry Southwest Survey and Design Institute Co., Ltd.: Chengdu, China, 2009. [Google Scholar]
  51. Sun, H.; You, Y.; Liu, J.-F. Experimental study on characteristics of trapping and regulating sediment with an open-type check dam in debris flow hazard mitigation. J. Mt. Sci. 2018, 15, 2001–2012. [Google Scholar] [CrossRef]
  52. You, Y.; Liu, J.F.; Chen, X.C. Debris flow and its characteristics of Subao River in Beichuan county after 5.12 Wenchuan earthquake. J. Mt. Sci. 2010, 28, 358–366. (In Chinese) [Google Scholar]
  53. Liu, J.; You, Y.; Chen, X.; Liu, J.; Chen, X. Characteristics and hazard prediction of large-scale debris flow of Xiaojia Gully in Yingxiu Town, Sichuan Province, China. Eng. Geol. 2014, 180, 55–67. [Google Scholar] [CrossRef]
  54. Zhou, B.F.; Li, D.J.; Luo, D.F.; Lv, R.R.; Yang, Q.X. Guide to Prevention of Debris Flow; Science Press: Beijing, China, 1991; pp. 80–95. (In Chinese) [Google Scholar]
  55. Tang, C.; Rengers, N.V.; van Asch, T.W.; Yang, Y.; Wang, G. Triggering conditions and depositional characteristics of a disastrous debris flow event in Zhouqu city, Gansu Province, Northwestern China. Nat. Hazards Earth Syst. Sci. 2011, 11, 2903–2912. [Google Scholar] [CrossRef] [Green Version]
  56. Xiong, M.Q.; Meng, X.M.; Wang, S.Y.; Guo, P.; Li, Y.J.; Chen, G.; Qing, F.; Cui, Z.J.; Zhao, Y. Effectiveness of debris flow mitigation strategies in mountainous regions. Prog. Phys. Geogr. 2016, 40, 768–793. [Google Scholar] [CrossRef]
  57. Costa, J.E. Paleohydraulic reconstruction of flash-flood peaks from boulder deposits in the Colorado front range. Geol. Soc. Am. Bull. 1983, 94, 986–1004. [Google Scholar] [CrossRef]
  58. Lanzoni, S.; Gregoretti, C.; Stancanelli, L.M. Coarse-grained debris flow dynamics on erodible beds. J. Geophys. Res. Earth Surf. 2017, 122, 592–614. [Google Scholar] [CrossRef]
  59. Chanson, H. The Hydraulics of Open Channel Flow: An Introduction, 2rd ed.; Elsevier Butterworth-Heinemann: Oxford, UK, 2004. [Google Scholar]
  60. Subramanya, K. Flow in Open Channels, 3rd ed.; Elsevier Butterworth-Heinemann: Oxford, UK, 2009. [Google Scholar]
  61. Ministry of Water Resources of the People’s Republic of China (MWR). Technique Guideline for Emergency Disposal of Landslide Lake; SL451-2009; Standards Press of China: Beijing, China, 2009; pp. 22–25. (In Chinese) [Google Scholar]
  62. Dai, R.Y.; Wang, Q. Research on the maximum discharge of dam-breaking. J. Hydraul. Eng. 1983, 2, 15–23. (In Chinese) [Google Scholar]
  63. Takahashi, T. Debris Flow Mechanics, Prediction and Countermeasures; Taylor & Francis Group: London, UK, 2007; pp. 45–47. [Google Scholar] [CrossRef]
  64. Schoklitsch, A. Der geschiebetrieb und die geschiebefracht. Wasserkraft Wasserwirtschaft 1934, 29, 37–43. [Google Scholar]
  65. Du, C.; Yao, L.-K.; Shakya, S.; Li, L.-G.; Sun, X.-D. Damming of large river by debris flow: Dynamic process and particle composition. J. Mt. Sci. 2014, 11, 634–643. [Google Scholar] [CrossRef]
  66. Helley, E.J. Field Measurement of the Initiation of Large Bed Particle Motion in Blue Creek Near Kalmath, California; US Geological Survey Professional Paper; United States Government Printing Office: Washington, DC, USA, 1969. [Google Scholar]
  67. Williams, G.P. Paleohydrological methods and some examples from Swedish fluvial environments: I cobble and boulder deposits. Geogr. Ann. Ser. A Phys. Geogr. 1983, 65, 227–243. [Google Scholar] [CrossRef]
  68. Clarke, A.O. Estimating probable maximum floods in the Upper Santa Ana Basin, Southern California, from stream boulder size. Environ. Eng. Geosci. 1996, 2, 165–182. [Google Scholar] [CrossRef]
  69. Zhao, Z.X.; He, J.J. Hydraulics; Tsinghua University Press: Beijing, China, 2010; pp. 176–177. (In Chinese) [Google Scholar]
  70. China Association of Geological Hazard Prevention (CAGHP). Specification of Design for Debris Flow Prevention; T/CAGHP 021-2018; China University of Geosciences Press: Wuhan, China, 2018; pp. 3–6. (In Chinese) [Google Scholar]
  71. Rickenmann, D. Hyperconcentrated Flow and Sediment Transport at Steep Slopes. J. Hydraul. Eng. 1991, 117, 1419–1439. [Google Scholar] [CrossRef]
  72. You, Y.; Chen, X.; Liu, J. 8.13″ extra large debris flow disaster in Wenjia gully of Qingping Township, Mianzhu, Sichuan Province. J. Catastrophol. 2011, 26, 68–72. (In Chinese) [Google Scholar]
  73. Cui, P.; Zhou, G.G.D.; Zhu, X.H.; Zhang, J.Q. Scale amplification of natural debris flows caused by cascading landslide dam failures. Geomorphology 2013, 182, 173–189. [Google Scholar] [CrossRef]
  74. Zhou, G.G.D.; Cui, P.; Chen, H.Y.; Zhu, X.H.; Tang, J.B.; Sun, Q.C. Experimental study on cascading landslide dam failures by upstream flows. Landslides 2012, 10, 633–643. [Google Scholar] [CrossRef]
  75. Chen, X.Q.; Chen, X.Z.; Zhang, W.F.; Chen, K.T.; Yang, D.X.; Hu, K.; Gong, X.L.; Si, G.W.; Xiong, Z. Investigation Report for the Control of Zechawa Debris Flow Disaster in Jiuzhaigou Valley, Jiuzhaigou County; Institute of Mountain Hazards and Environment, Chinese Academy of Sciences: Chengdu, China, 2017. (In Chinese) [Google Scholar]
  76. Cui, P.; Liu, S.; Tang, B.; Chen, X. Debris flow prevention pattern in national parks-taking the world natural heritage Jiuzhaigou as an example. Sci. China 2003, 46, 1–11. [Google Scholar] [CrossRef]
  77. Vagnon, F. Design of active debris flow mitigation measures: A comprehensive analysis of existing impact models. Landslides 2019. [Google Scholar] [CrossRef]
  78. Zhang, S.A. Comprehensive Approach to the Observation and Prevention of Debris Flows in China. Nat. Hazards 1993, 7, 1–23. [Google Scholar] [CrossRef]
  79. Cui, P.; Zeng, C.; Lei, Y. Experimental analysis on the impact force of viscous debris flow. Earth Surf. Process. Landf. 2015, 40, 1644–1655. [Google Scholar] [CrossRef] [Green Version]
  80. Vagnon, F.; Segalini, A. Debris flow impact estimation on a rigid barrier. Nat. Hazards Earth Syst. Sci. 2016, 16, 1691–1697. [Google Scholar] [CrossRef] [Green Version]
  81. Ministry of Land and Resources of the People’s Republic of China (MLR). Specification of Geological Investigation for Debris Flow Stabilization; DZ/T0220-2006; Standards Press of China: Beijing, China, 2006; pp. 2–3. (In Chinese) [Google Scholar]
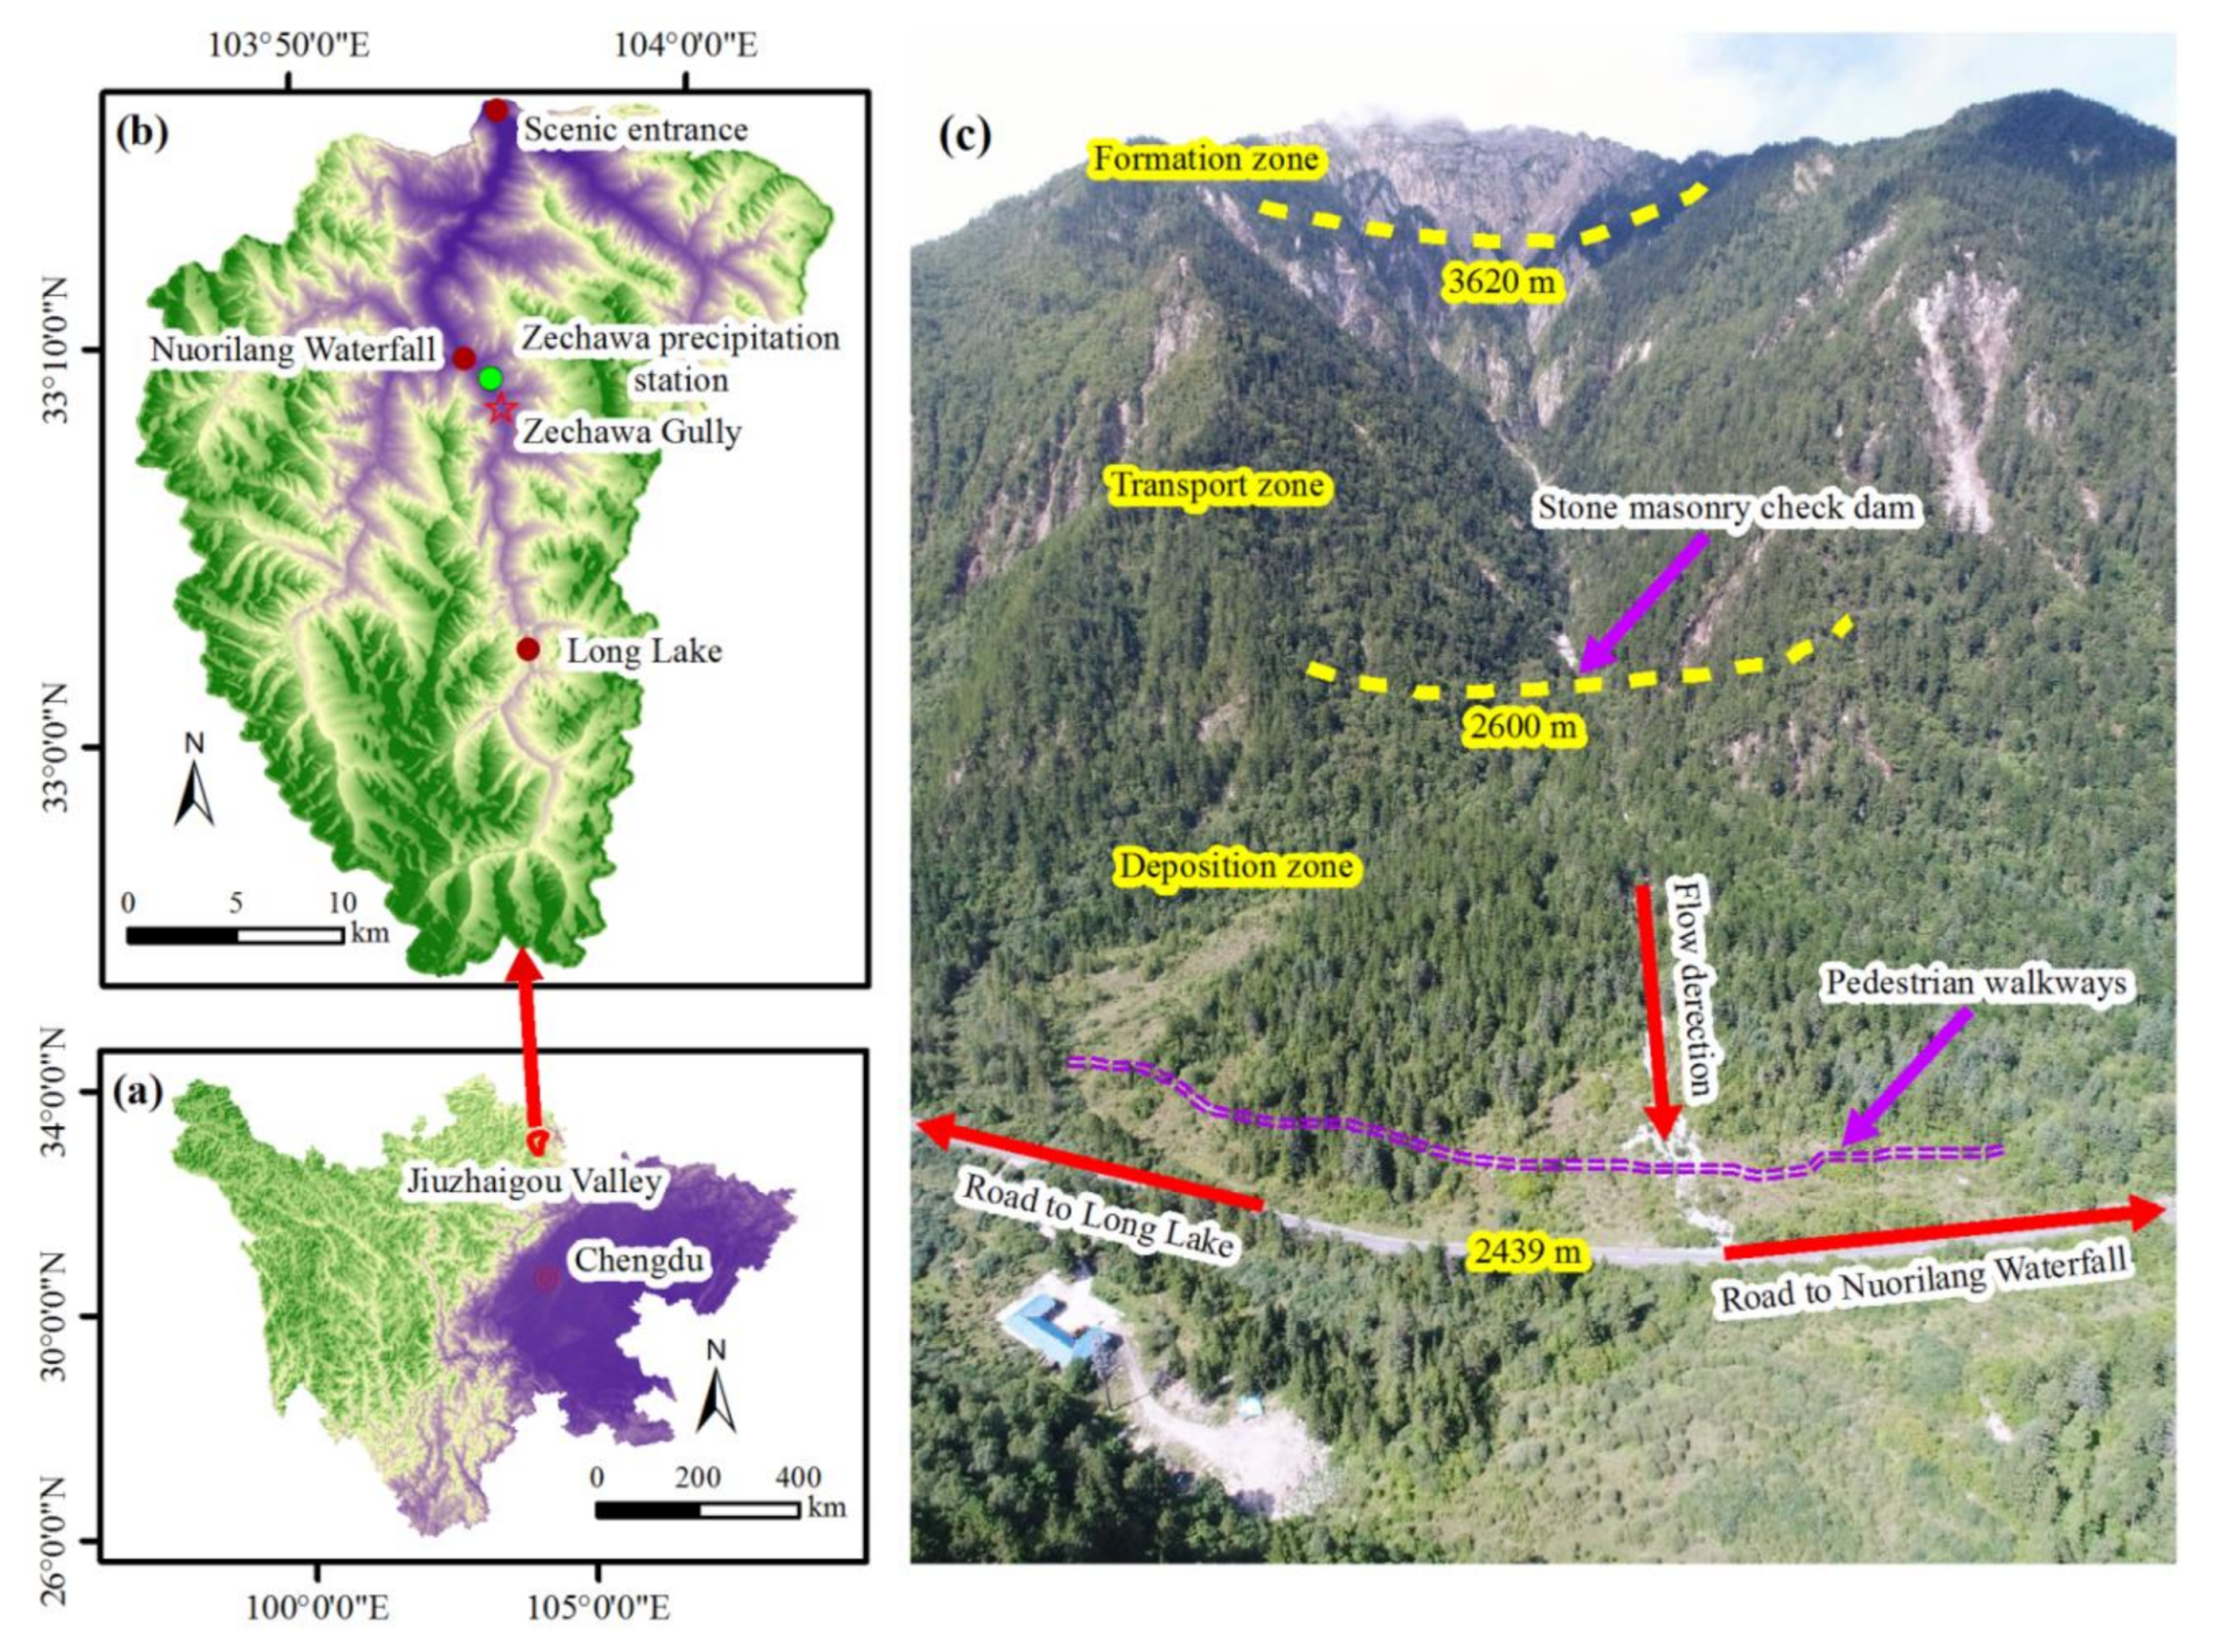
Figure 1. Location of Zechawa Gully and its full view. (a) Location of Jiuzhaigou Valley in Sichuan Province; (b) Location of Zechawa Gully in Jiuzhaigou Valley; (c) The full view of Zechawa Gully. The flow direction of the debris flow is perpendicular to the pedestrian walkways and the scenic road (from Nuorilang Waterfall to Long Lake).
Water 12 01256 g001
Figure 2. Study area maps. (a) Geologic map of the study area; (b) Topographic map of the Tazang fault (TZF), the Minjiang fault (MJF), the Huya fault (HYF) and the blind extension of the HYF (modified from Zhao et al. [41]).
Water 12 01256 g002
Figure 3. Images of Zechawa Gully debris flow in different periods: (a)–(c) 6 August 2016, (d)–(f) 16 August 2017, (g)–(i) 23 October 2017; (j) large boulder transported by the debris flow that occurred in September 2017.
Water 12 01256 g003
Figure 4. Rainfall distribution in September 2017 recorded by the Zechawa precipitation station.
Water 12 01256 g004
Figure 5. Overview of the reconstructed check dams in Zechawa Gully (taken on 25 June 2019).
Water 12 01256 g005
Figure 6. Overview of the reconstructed retaining wall in Zechawa Gully (taken on 23 June 2019).
Water 12 01256 g006
Figure 7. The debris flow that occurred on 21 June 2019 buried pedestrian walkways and blocked the scenic road (taken on 22 June 2019).
Water 12 01256 g007
Table 1. Zone division of Zechawa Gully.
Zone DivisionFormation ZoneTransport ZoneDeposition Zone
Elevation (m)4040–36203620–26002600–2439
Average gully gradient (‰)708415244
Gully length (m)4701530570
Gully characteristicsSteep slope (>50°), bare bedrock with severe frost weathering, low vegetation coverage and abundant collapsed regionsSteep slopes, a large number of landslides and high abundance of
debris flow sediments on the gully bed
Gentle topography
with no collapses or landslides
Table 2. Calculation results of the debris flow peak discharge by using the cross-section survey method and dam-breaking calculation method.
MethodsParameters
cross-section survey methodAdf (m2)Rdf (m)IdfVdf (m/s)ndfQdf (m3/s)
6.450.750.3915.160.133.29
9.580.850.1823.830.136.69
B0 (m)h0 (m)Bm (m)hd (m)Lb (m)Qdf (m3/s)
dam-breaking calculation methodEquation (14)30.07.020.56.0/36.5
Equation (15)30.07.020.56.0/43.6
Equation (16)30.07.020.56.044.036.8
Table 3. Summary of the calculation results based on the maximum boulder size methods.
Basic parametersdL (m)1.3Bf (m)6.5ρs (kg/m3)2650
dI (m)1.1β (degrees)19φdf (degrees)36.5
dS (m)0.7α (degrees)6C0.67
ρb (kg/m3)2250nf0.05
Parameters
Method Vavg(m/s)hf(m)Qf(m3/s)Qdf(m3/s)
Schoklitsch [64] //0.581.76
Helley [66] 4.260.226.0518.33
Williams [67]Shear stress2.160.030.611.85
Stream power3.800.041.073.24
Clarke [68] 2.490.101.594.82
Table 4. Calculation results of the debris flow peak discharge by using the rain-flood method.
Calculation ContentParametersUnitReturn Periods
10-Year20-Year50-Year
The flood peak dischargeθ// 2.142.142.14
m/0.260.260.26
H1mm151515
H6mm252525
K1/1.722.102.58
K6/1.661.992.42
KP/1.311.421.56
Smm25.831.538.7
n/0.730.740.8
ηmm/h4.264.625.07
t0h1.521.431.34
φ/0.750.790.82
th1.661.541.43
Qfm3/s6.378.5811.55
The debris flow peak dischargeγdft/m31.81.851.9
Ddf/1.81.851.9
Qdfm3/s22.2732.7348.27
Wdfm30.88 × 1041.30 × 1041.91 × 104
Table 5. Calculation results of the debris flow impact force on the retaining wall on 21 June 2019.
γdf (t/m3)hf (m)Rdf (m)IdfndfFrPpeak (kN/m2)
1.91.551.110.190.11.2080.39