Article

Modeling Soil Water–Heat Dynamic Changes in Seed-Maize Fields under Film Mulching and Deficit Irrigation Conditions

1
Center for Agricultural Water Research in China, China Agricultural University, Beijing 100083, China
2
Wuwei Experimental Station for Efficient Water Use in Agriculture, Ministry of Agriculture and Rural Affairs, Wuwei 733000, China
3
Plant and Environmental Sciences, New Mexico State University, Las Cruces, NM 88003, USA
*
Author to whom correspondence should be addressed.
Water 2020, 12(5), 1330; https://doi.org/10.3390/w12051330
Submission received: 16 April 2020 / Revised: 2 May 2020 / Accepted: 5 May 2020 / Published: 8 May 2020
(This article belongs to the Special Issue Agriculture Water Management and Water Saving Strategies)

Abstract

:
The Soil–Water–Atmosphere–Plant (SWAP) model does not have a mulching module to simulate the effect of film mulching on soil water, heat dynamics and crop growth. In this study, SWAP model parameters were selected to simulate the soil water–heat process and crop growth, taking into account the effect of film mulching on soil evaporation, temperature, and crop growth, in order to predict the influence of future climate change on crop growth and evapotranspiration (ET). A most suitable scheme for high yield and water use efficiency (WUE) was studied by an experiment conducted in the Shiyang River Basin of Northwest China during 2017 and 2018. The experiment included mulching (M1) and non-mulching (M0) under three drip irrigation treatments, including full (WF), medium (WM), low (WL) water irrigation. Results demonstrated that SWAP simulated soil water storage (SWS) well, soil temperature at various depths, leaf area index (LAI) and aboveground dry biomass (ADB) with the normalized root mean square error (NRMSE) of 16.2%, 7.5%, 16.1% and 16.4%, respectively; and yield, ET, and WUE with the mean relative error (MRE) of 10.5%, 12.4% and 14.8%, respectively, under different treatments on average. The measured and simulated results showed film mulching could increase soil temperature, promote LAI during the early growth period, and ultimately improve ADB, yield and WUE. Among the treatments, M1WM treatment with moderate water deficit and film mulching could achieve the target of more WUE, higher yield, less irrigation water. Changes in atmospheric temperature, precipitation, and CO2 concentration are of worldwide concern. Three Representative Concentration Pathway (RCP) scenarios (RCP2.6, RCP4.5, RCP8.5) showed a negative effect on LAI, ADB and yield of seed-maize. The yield of seed-maize on an average decreased by 33.2%, 13.9% under the three RCPs scenarios for film mulching and non-mulching, respectively. Predicted yields under film mulching were lower than that under non-mulching for the next 30 years demonstrating that current film mulching management might not be suitable for this area to improve crop production under the future climate scenarios.

1. Introduction

Seed-maize (Zea mays L.) is one of the main food crops and its development is of great significance to food security. Seed-maize has been extensively planted in arid and semi-arid regions all over the world [1,2,3,4,5], where generally with water shortage that limited the crop production [6]. The Hexi Corridor in Gansu Province is the largest producer of high-quality seed-maize in China, where the seed-maize planted area is about 60,000 hm2 and annual maize seed production accounts for over 50% of the national maize seed consumption. The Shiyang River Basin, located in the Hexi Corridor region, is characterized by water scarcity with annual average precipitation of less than 200 mm, and farmland irrigation water use accounting for over 80% of the total water use [7]. Shortage of water resources has limited the crop production in this basin. Efficient agricultural water use has become the key to sustaining agriculture while utilizing limited water resources in the Shiyang River Basin and even in the arid and semi-arid regions all over the world.
Plastic film mulching techniques have been widely used to grow vegetables, fruit trees, grain crops, cash crops, and flowers in arid and semi-arid areas of China to increase the agricultural yield in dryland farming [8,9,10]. Film mulching could increase soil temperature [11], while as a barrier it could reduce soil evaporation [12]. Generally, film mulching provided favorable water and temperature conditions for crop growth, promoted rapid seeding development, and improved crop yield and water use efficiency (WUE) [13,14]. Several studies have also shown that the combination of plastic film mulching and deficit irrigation under the traditional ditch/border irrigation could achieve the twin goals of saving water and increasing yield [6,15]. Yu and Chai [15] indicated that moderate deficit irrigation under full film mulching could increase the yield of seed-maize by 3.6%–35.9% and WUE by 0.5%–27.1%. With a growing application of drip irrigation under plastic film, it is important to evaluate the effect of drip irrigation under film mulching on soil water and heat dynamics and the growth of seed-maize in the practices of planting pattern and water management.
There are a large number of crop models widely used to simulate soil water, heat transfer, and crop growth, including CERES [16], SWAP [17], WOFOST [18,19], and CropSyst [18], among others. Soil–Water–Atmosphere–Plant (SWAP) is an agro-hydrological model designed to simulate water, solute and heat transport, and crop growth processes in saturated and unsaturated soils. The model employs Richards equation, including root water extraction (Feddes function) [20], to simulate soil moisture movement in variably saturated soils with known initial and boundary conditions. Solute transport includes basic processes of convection, dispersion, adsorption, and decomposition. Soil heat flow is numerically simulated using the heat conduction equation with known initial and boundary conditions. The SWAP model takes into account the influence of soil moisture on soil heat capacity and soil thermal conductivity. The generic crop growth module simulates photosynthesis and crop development, taking into account growth reductions due to water, oxygen and salt stresses. Soil moisture, heat, and solute modules interact at each time step, and actual conditions of weather, soil moisture, and salinity influence crop growth on a daily basis.
In recent years, applications of SWAP have focused on modeling crop water consumption [21], soil water and salt dynamics [21,22], changes in groundwater level [23], upscaling [24], and coupling with other models [25,26]. Smets et al. [21] used SWAP to simulate water consumption as well as soil water and salt movement under a cotton–wheat–cotton rotation scheme in Pakistan. Ben-Asher et al. [27] simulated the effects of brackish water irrigation on grape growth and yield and compared the results of simple and detailed crop models. Jiang et al. [22] calibrated and validated SWAP at field scale to simulate soil water and salt transport and predicted salt concentrations under long-term deficit irrigation with saline water. To the best of our knowledge, SWAP has never been applied for a film mulching condition. Film mulching could reduce soil evaporation, increase soil temperature, and change the upper boundary conditions of soil moisture and temperature. The crop development stage in SWAP is controlled by accumulated air temperature, and film mulching could advance crop development stages. Therefore, in this paper, the impact of film mulching was considered by properly selecting parameters in the soil evaporation, soil temperature, crop evapotranspiration and crop growth modules of SWAP.
Climate change poses a threat to global agriculture. Changes in temperature, precipitation and CO2 concentration can influence crop growth and productivity negatively [28]. Increasing temperature could shorten the life cycle and duration of the reproductive phase, causing a reduction in grain yield [29]. Petersen [30] concluded rising temperatures significantly decreased maize yield, and Lobell and Field [31] found an 8.3% maize yield reduction per 1.0℃ rise in temperature. Zhang et al. [32] showed that maize yield reductions were less than 5% by 2069. In contrast, a few studies where climate change was reported to promote maize growth. Zhang et al. [33] reported increased maize biomass by 5%–20% up to 2100. Currently, no consistent conclusion can be drawn regarding the impact of climate change on the maize growth. To the best of our knowledge, few studies have compared climate change effect on the maize growth under film mulching and non-mulching.
Therefore, the first objective of our study was to investigate the influence of film mulching and irrigation on soil water–heat transfer and seed-maize growth, and to validate SWAP for simulating soil water and heat dynamics and seed-maize growth under different mulching and irrigation conditions. The second objective was to predict the impact of future climate change on seed-maize growth under film mulching and non-mulching through scenario simulations by SWAP.

2. Materials and Methods

2.1. Field Experiment

2.1.1. Experimental Site Description

The experiment was carried out at Wuwei Experimental Station for Efficient Water Use in Agriculture and Rural Affairs, Ministry of Agricultural, Gansu Province of China (37°52′ N, 102°52′ E, elevation 1581 m) from April to September in 2017 and 2018. The site is located at the edge of the Tengger Desert in a typical continental temperate climate zone. There is abundant sunlight, with an average temperature of 8 °C, a frost-free period of 150 days, and a sunshine duration of more than 3000 h. The experimental area receives average annual precipitation of 164 mm, and average annual pan evaporation is 2000 mm. The groundwater table is 40 to 50 m below the ground surface.

2.1.2. Experimental Design

In this experiment, seed-maize, a kind of cross-pollinated crop, was planted in the farmland. In order to comply with the local planting structure and ensure the purity of pollination (i.e., to prevent the influence of the pollens from the other maize varieties) in the study area, two seed-maize cultivars, Ganxin 630 and TRF2018, were planted in 2017 and 2018, respectively. The ratio of male parents to female parents of maize was 1:6. Female parents were sown on 24 April 2017, and 20 April 2018. Male parents were sown on 4 May 2017, and 2 May 2018. The seed-maize was sown by bunch planting with a row spacing of 40 cm and a plant spacing of 25 cm.
The experiments involved transparent polyethylene plastic film mulching (M1) with a thickness of 0.04 mm and non-mulching (M0) under three drip irrigation levels, including 100% (WF), 70% (WM), and 40% (WL) of the full irrigation amount. The full irrigation amount was obtained by subtracting effective rainfall from crop water requirement (ETc) that was calculated as the product of reference crop evapotranspiration (ETref) and crop coefficient (Kc). Daily ETref was calculated with Penman–Monteith equation [34] and Kc was obtained from a previous study from the same test area [2]. As listed in Table 1, irrigation intervals were about 10 days; hence, in the calculation of the full irrigation amount per irrigation, the total ETc was the sum of the ETc in the first 10 days before the irrigation. No irrigation was applied when rainfall could meet the total ETc (e.g., no irrigation on 29 July 2017, or 11 August 2018). Due to high temperatures, an additional irrigation was applied on 15 July 2017. Six plots were set up in the experiment, each with an area of 137.2 m2 (24.5 m in length and 5.6 m in width) and a 100 cm buffer area was kept between them to avoid the interactions between adjacent plots.
In the experiment, drip irrigation was applied and the drip irrigation belt was placed between two rows of seed-maize with a spacing of 80 cm. The distance between emitters was 30 cm and the flow rate was 2.5 L h−1.

2.1.3. Sampling and Measurement

Before seed-maize planting, three 100-cm deep pits were dug randomly in our experimental plot. In each pit, soils were sampled at three locations every 20-cm depth for soil particle size analysis. The soil particle size was analyzed using the Malvern Mastersizer 2000 laser analyzer (Malvern Instruments Ltd., Malvern, UK) [35] after air-drying the soil samples and sieving with a 2-mm mesh sieve. The bulk density was measured gravimetrically using a ring sampler (Table 2). Precipitation, solar radiation, air temperature, relative humidity, and wind speed were measured by a standard automated weather station installed at the experimental site at a height of 2.0 m above the soil surface. The distribution of precipitation is shown in Figure 1. Time Domain Reflectometry (TRIME-PICO/PICO-BT, Imko GmbH, Ettlingen, Germany) was used to measure volumetric soil water content every seven days and before and after irrigation and after precipitation at 20-cm intervals from the surface to a 100-cm depth, which was calibrated using the gravimetric method. The soil temperature at 0, 10, 20, 40, 80 and 120 cm soil depths for each plot was monitored automatically every 30 min by the temperature sensors connected with soil temperature recorders (HZTJ1, Hezhong Bopu Technology Development Co., Ltd., Beijing, China). To obtain the leaf area index (LAI), three representative seed-maize plants (female parents) were selected randomly in each plot to measure the length and maximum width of fully unfolded leaves every seven days starting from 27 May in 2017 and 22 May in 2018. The aboveground dry biomass (ADB) was obtained by oven drying method every 15–20 day after emergence in each plot. The yield of seed-maize was determined by selecting a row and manually harvesting 10 consecutive plants three times at maturity from each plot. Each treatment had three samples for soil water content, LAI, ADB, and yield measurements.
Crop evapotranspiration (ET, mm) was calculated by soil water balance in the root zone (Equation (1)),
ET = P − ΔP + I + ΔWRD + G
where P is the precipitation (mm), ΔP is the precipitation interception (mm), including interceptions by canopy and film mulch. In this study, the canopy interception coefficient varied with the growth period, set as 6.59%, 10.94%, 11.24%, 11.24% and 5.31% at seedling, jointing, heading, filling and mature stages, respectively [36]. The film interception was considered to be 20% [37]. I is the amount of irrigation during the entire growth period (mm), and ΔW is the change of soil water storage (SWS, mm) in the 0–100 cm root zone [3,38]. R is the surface runoff (mm), D is the deep drainage (mm), G is the groundwater upflux into the root zone (mm). R and D were neglected because the experimental site was flat and the precipitation/irrigation intensity was relatively low in this region [6,39]. G was neglected because the water table was 40 to 50 m below the ground surface. Therefore, ET was obtained by Equation (2),
ET = P − ΔP + I + ΔW
The water use efficiency (WUE, kg m−3) was calculated by Equation (3),
WUE = Yield/ET

2.2. The SWAP Model

2.2.1. Introduction of SWAP

The SWAP model, developed by the Water Resources Group of Wageningen University, is a comprehensive model for simulating water, solute and heat transport, and crop growth in the soil–atmosphere–plant environment at the field scale. It consists of six sub-modules, i.e., soil water movement, solute transport, heat transfer, soil evaporation, crop evapotranspiration and crop growth. In our study, SWAP version 4.0 was used, where the simulation of soil water flow was based on an implicit finite difference solution of the nonlinear partial differential Richards equation. The initial condition of the soil water pressure head was obtained from the initial soil water content and soil water characteristic curve. The bottom boundary condition was assumed to be free drainage. Soil temperature was numerically calculated by the heat conduction equation with the initial and boundary conditions, considering the influence of soil moisture on soil heat capacity and soil thermal conductivity. A detailed crop model was selected for simulating crop growth and yield. A detailed description of the model can be found in the user manual of SWAP version 4.0 [17].

2.2.2. SWAP for Adaption of Film Mulching

SWAP does not directly compute the influence of plastic film. However, it does consider the impact of soil water and heat conditions on crop growth. To reflect the influence of film mulching on crop growth, we properly adjusted the parameters of the crop evapotranspiration, soil evaporation, soil temperature, and crop growth modules.
  • Crop Evapotranspiration and Soil Evaporation Modules
In SWAP, the potential evapotranspiration was calculated by Equation (4),
E T p 0 = K c E T ref
where ETp0 is the potential evapotranspiration (cm day−1), Kc is the crop coefficient, and ETref is the reference evapotranspiration (cm day−1).
Under a wet and bare soil, the evaporation rate can be derived with a soil factor ksoil [17],
E p 0 = k soil E T ref
where Ep0 is the potential soil evaporation (cm day−1) and ksoil is the soil factor.
Under the condition of crop cover, the potential soil evaporation rate can be derived from Ep0 by considering the reductions due to shadow by crops and periods without soil evaporation when the crop was wet due to rainfall interception.
E p = E p 0 ( 1 W frac ) e k g r LAI
where Ep is the potential soil evaporation under the condition of crop cover (cm day−1), Wfrac is the fraction of the day that the crop is wet (equal to the ratio of the daily amount of intercepted precipitation and the potential evapotranspiration rate for the wet canopy ETp0), and kgr is the extinction coefficient for solar radiation.
When soil was wet, soil evaporation was controlled by atmospheric conditions and actual soil evaporation equaled to the potential rate Ep. When the soil became drier, soil evaporation decreased. The maximum evaporation rate that the topsoil could sustain, Emax (cm day−1), was calculated according to Darcy’s law,
E max = k 1 / 2 ( h atm h 1 z 1 z 1 )
where k1/2 is the average hydraulic conductivity between the soil surface and the first node (cm day−1), hatm is the soil water pressure head in equilibrium with the air relative humidity (cm), h1 is the soil water pressure head of the first node (cm), and z1 is the soil depth at the first node (cm).
In SWAP, soil evaporation (∑Ea, cm) was also calculated by the empirical function,
E a = β t dry 1 / 2
where β is a soil-specific parameter (cm day−1/2) characterizing the evaporation process, and tdry is the time after a significant amount of rainfall (day).
In SWAP, soil evaporation was determined by taking the minimum value of Ep, Emax, and ∑Ea.
According to Allen et al. [34], film mulching could increase crop transpiration, reduce soil evaporation, and reduce Kc. For SWAP to simulate film mulching conditions, parameters Kc, ksoil, and β were adjusted to reflect the differences in crop evapotranspiration and soil evaporation between film mulching and non-mulching conditions.
  • Soil Temperature Module
In the simulation of soil temperature, the initial and boundary conditions were required in the model. Because the Dirichlet boundary was applied on both the top and bottom boundary of the soil, i.e., the measured soil temperature at 0 and 120 cm depths as the top and bottom boundary, respectively, the model could simulate the evolution of soil temperature at different soil depths under the conditions of different mulching and water treatments.
  • Crop Module
In SWAP, the simulation of crop growth and development was based on the accumulated air temperature, which played a leading role in crop growth and development. The crop development rate was not always related to the accumulated air temperature, but was controlled by the temperature of the meristem [16]. Stone et al. [40] concluded maize meristem was underground at the early stage and the crop development rate was affected by soil temperature at a 5-cm depth. The soil temperature under film mulching was higher than that of non-mulching and had compensation effects on accumulated air temperature [41]. Therefore, the accumulated air temperature required for completing certain physiological processes was lower under film mulching than that under non-mulching. To reflect the mulching effect, we set different air-accumulated temperatures from emergence to anthesis to reflect the difference in seed-maize growth between film mulching and non-mulching in the model.
In this study, different seed-maize cultivars were used in 2017 and 2018. In SWAP, the crop parameters related to maize cultivars included maximum CO2 assimilation rate, specific leaf area, partitioning coefficient for dry matter, accumulated temperature, light use efficiency (LUE) and lifespan [19,42]. Zhang et al. [43] suggested that the errors between simulated and measured yields of different maize cultivars ranged between 7.9% and 12.0% and the simulation accuracy was high. Morales-Ruiz et al. [44] reported that the LUE of different maize cultivars could cause errors up to 23.5%, which would lead to a yield difference of 27.2%. Therefore, in our study, in order to improve the universal applicability of model crop parameters, the difference of LUE for different seed-maize cultivars was considered, while the difference in the other parameters was neglected.

2.2.3. Parameter Sensitivity Analysis and Calibration of SWAP

The input parameters required by SWAP include soil data, meteorological data, irrigation schedule, initial and boundary conditions of soil moisture, temperature, crop information, etc. In this study, the measured parameters of soil, meteorological data, and irrigation schedule were used. The initial soil hydraulic parameters were obtained by available soil textural information (i.e., the measured soil particle composition and dry bulk density) through the neural network-based pedotransfer function approach [45]. The initial crop evapotranspiration and soil evaporation parameters (Kc, ksoil, and β) were the model default values. The initial estimates of some crop parameters were the measured values, and the initial values of other parameters were the model default values. A large number of soil water-, heat-, and crop-related parameters were required for running the model. Sophocleous et al. [46] suggested that the most important parameters affecting model output should be identified and calibrated.
Sensitivity analysis is a technique for evaluating the comparative change in the model response corresponding to the change of model input parameters [47]. The model was run by changing the value of one input parameter at a time by +10% and then by −10% increments of its original value while keeping other parameters fixed [48]. The response variables were SWS, LAI, ADB, yield and soil temperature. The relative sensitivity (RS) [49] was used to express the sensitivity as follows,
R S = | ( y ( x + Δ x ) y ( x ) ) / y ( x ) Δ x / x |
where x is a parameter value in the model parameter; Δx is the change of the parameter; y(x) and y(x + Δx), respectively, represent the output value before and after the parameter change, including SWS, LAI, ADB, yield and soil temperature. The higher RS value indicates the parameter is more sensitive.
Highly sensitivity parameters were then calibrated by all the treatments in 2017 and validated by all the treatments in 2018 to achieve the highest efficiency of the SWAP model for predicting SWS, soil temperature, LAI, ADB, yield.

2.3. Statistical Analyses

The SPSS 20 software was used to conduct one-way analysis of variance (ANOVA). Mean values were compared using least significant differences (LSD) at a probability level of p = 0.05. In the model evaluation, MRE (mean relative error), RMSE (root mean square error), NRMSE (normalized root mean square error) and R2 (coefficient of determination) were used to evaluate the coincidence between the simulated and measured values in the process of model calibration and validation.
MRE = | M i S i | M i × 100 %
RMSE = i = 1 i = N ( M i S i ) 2 N
NRMSE = i = 1 i = N ( M i S i ) 2 N M ¯
R 2 = [ i = 1 i = N ( M i M ¯ ) ( S i S ¯ ) ] 2 i = 1 i = N ( M i M ¯ ) 2 i = 1 i = N ( S i S ¯ ) 2
where M, S, M ¯ , S ¯ , and N are the measured values, the simulated values, the mean of measured values, the mean of simulated values, and the number of measured values, respectively. The smaller the RMSE, the higher the simulation accuracy. When MRE or NRMSE is less than 10%, the simulation effect is considered very good; when MRE or NRMSE is between 10% and 20%, the simulation effect is good; when MRE or NRMSE is between 20% and 30%, the simulation effect is reasonable; and when MRE or N RMSE is greater than 30%, the simulation effect is poor [50]. The agreement between the simulated and measured values is high when R2 close to one.

3. Results and Discussion

3.1. Sensitivity Analysis and Model Calibration

Model parameters with RS greater than 0.1 were arranged in the order of RS reduction in Table 3. It showed crop parameters had a higher sensitivity than soil hydraulic parameters, and RS for the soil temperature parameter was the lowest. Therefore, the order of the parameter calibration was set up as crop parameters, followed by soil hydraulic parameters, and soil temperature parameter. Based on the sensitivity analysis, the model parameters were accurately calibrated are shown in Table 4, Table 5 and Table 6. The LUE value of 0.42 kg CO2 J−1 during the validation differed from that of 0.50 kg CO2 J−1 during the calibration due to different cultivars.

3.2. Soil Moisture

The SWS was mainly influenced by initial soil water content, precipitation, irrigation, soil evaporation, and crop transpiration. The simulated and measured SWS of 0–60 cm soil depths during the whole growth period of seed-maize under different mulching and irrigation treatments increased sharply with precipitation and irrigation, and decreased gradually with soil evaporation and crop transpiration (Figure 2).
The simulated and measured SWS of 0–60 cm soil depths showed that the SWS under M1WF treatment was higher than that under M0WF treatment, while the SWS under M1WM and M1WL treatments tended to be lower than those under M0WM and M0WL, which was similar to the result of Yang et al. [6]. This was because when water supply was sufficient, the crop growth and the transpiration were similar between film mulching and no-mulching; however, film mulching reduced surface soil evaporation. While under the lower irrigation treatments, film mulching reduced soil evaporation and provided a favorable soil water condition for plant growth at the early growing stage, which could result in more vigorous crop growth under M1WM and M1WL treatments in the middle and later stage. As a result, there was more water consumption from the root zone and resulted in lower SWS compared with those of the non-mulched treatments.
It can also be seen from Figure 2 that the simulated values of the SWS for the 0–60 cm soil depths were in good agreement with the measured values. In 2017 and 2018, R2, RMSE, and NRMSE for simulated and measured SWS for 0–60 cm soil depth were 0.61–0.91 and 0.43–0.73, 12.7–25.7 and 11.0–34.2 mm, and 9.6%–23.1% and 10.2%–32.7%, respectively. Jiang et al. [22] showed that NRMSE values between the measured and simulated soil water content in the root zone were 5.2%–32.4% and Yuan et al. [51] believed the mean NRMSE values were less than 20.0%, which demonstrated the simulation effect of SWAP model in simulating soil water status was consistent with our results. The differences between simulated and measured values could be caused by irrigation nonuniformity [52], spatial heterogeneity of soil properties [53], and soil hydraulic parameters estimation [54]. Overall, the simulation effects of SWAP considering the effects of film mulching and water stress on soil moisture status were within a reasonable error range (20% < NRMSE < 30%).

3.3. Soil Temperature

The simulated average daily soil temperatures at different soil depths were in good agreement with the measured values (Figure 3). The measured and simulated average daily soil temperature at different soil depths first increased and then decreased during the growing period. SWAP performed well for simulating daily soil temperature under different film mulching and irrigation amount treatments, with the maximum RMSE and NRMSE of 2.5 °C and 11.7%, 2.1 °C and 10.2%, 1.8 °C and 9.8%, and 2.6 °C and 15.1% at 10, 20, 40, and 80 cm soil depths, respectively (Table 7). The R2 ranged from 0.96 to 0.99 at 80 cm soil depth and from 0.59 to 0.98 at 10, 20, 40 cm soil depths under different treatments. Balashov et al. [55] concluded the mean RMSE between the measured and simulated soil temperatures by SWAP model was equal to 2.5 °C for the three growing seasons.

3.4. Leaf Area Index (LAI)

The LAI could be used to demonstrate the status of crop growth. As shown in Figure 4, the LAI of seed-maize increased rapidly up to its peak value about 80 days after emergence, and the LAI under film mulching reached its peak 7–10 days earlier than under non-mulching, demonstrating that higher soil temperature creates faster growth under film mulching. The LAI began to decline about 80 d after emergence with the withering and falling of basal leaves.
The average leaf senescence rate of measured LAI was 0.060 cm2 cm−2 day−1 in 2017 and 0.015 cm2 cm−2 day−1 in 2018, which was likely due to the natural differences in the two maize cultivars. This was in accord with Valentinuz and Tollenaar [56], who reported that different maize cultivars had obvious differences in leaf senescence. Comparing the simulated and measured leaf senescence rate, we found that the simulated leaf senescence rate was faster than the measured rate in 2018, while the simulated leaf senescence rate was slower than the measured rate in 2017, which may be because lifespan, a crop parameter affecting leaf senescence rate, was kept the same for the two cultivars in SWAP. Overall, SWAP simulated LAI with an R2 of 0.96–0.99 and 0.95–0.98, RMSE of 0.19–0.61 and 0.29–0.51 cm2 cm−2, and NRMSE of 6.7%–26.9% and 15.2%–22.9% for 2017 and 2018, respectively. Cheng et al. [57] suggested that the model had a high prediction accuracy in the LAI variation with relative error of 20.5%, which was similar to our study. However, Huang et al. [19] demonstrated that the simulation effect in the LAI was poorer than our study, with RMSE and NRMSE of 1.18 cm2 cm−2 and 56.8%, respectively. It was because Huang et al. [19] studied 174 agricultural meteorological stations in China, where the lack of input parameters of some stations could result in large simulation errors. Therefore, the SWAP simulated results of LAI of seed-maize under different mulching and irrigation conditions were within a reasonable error range.

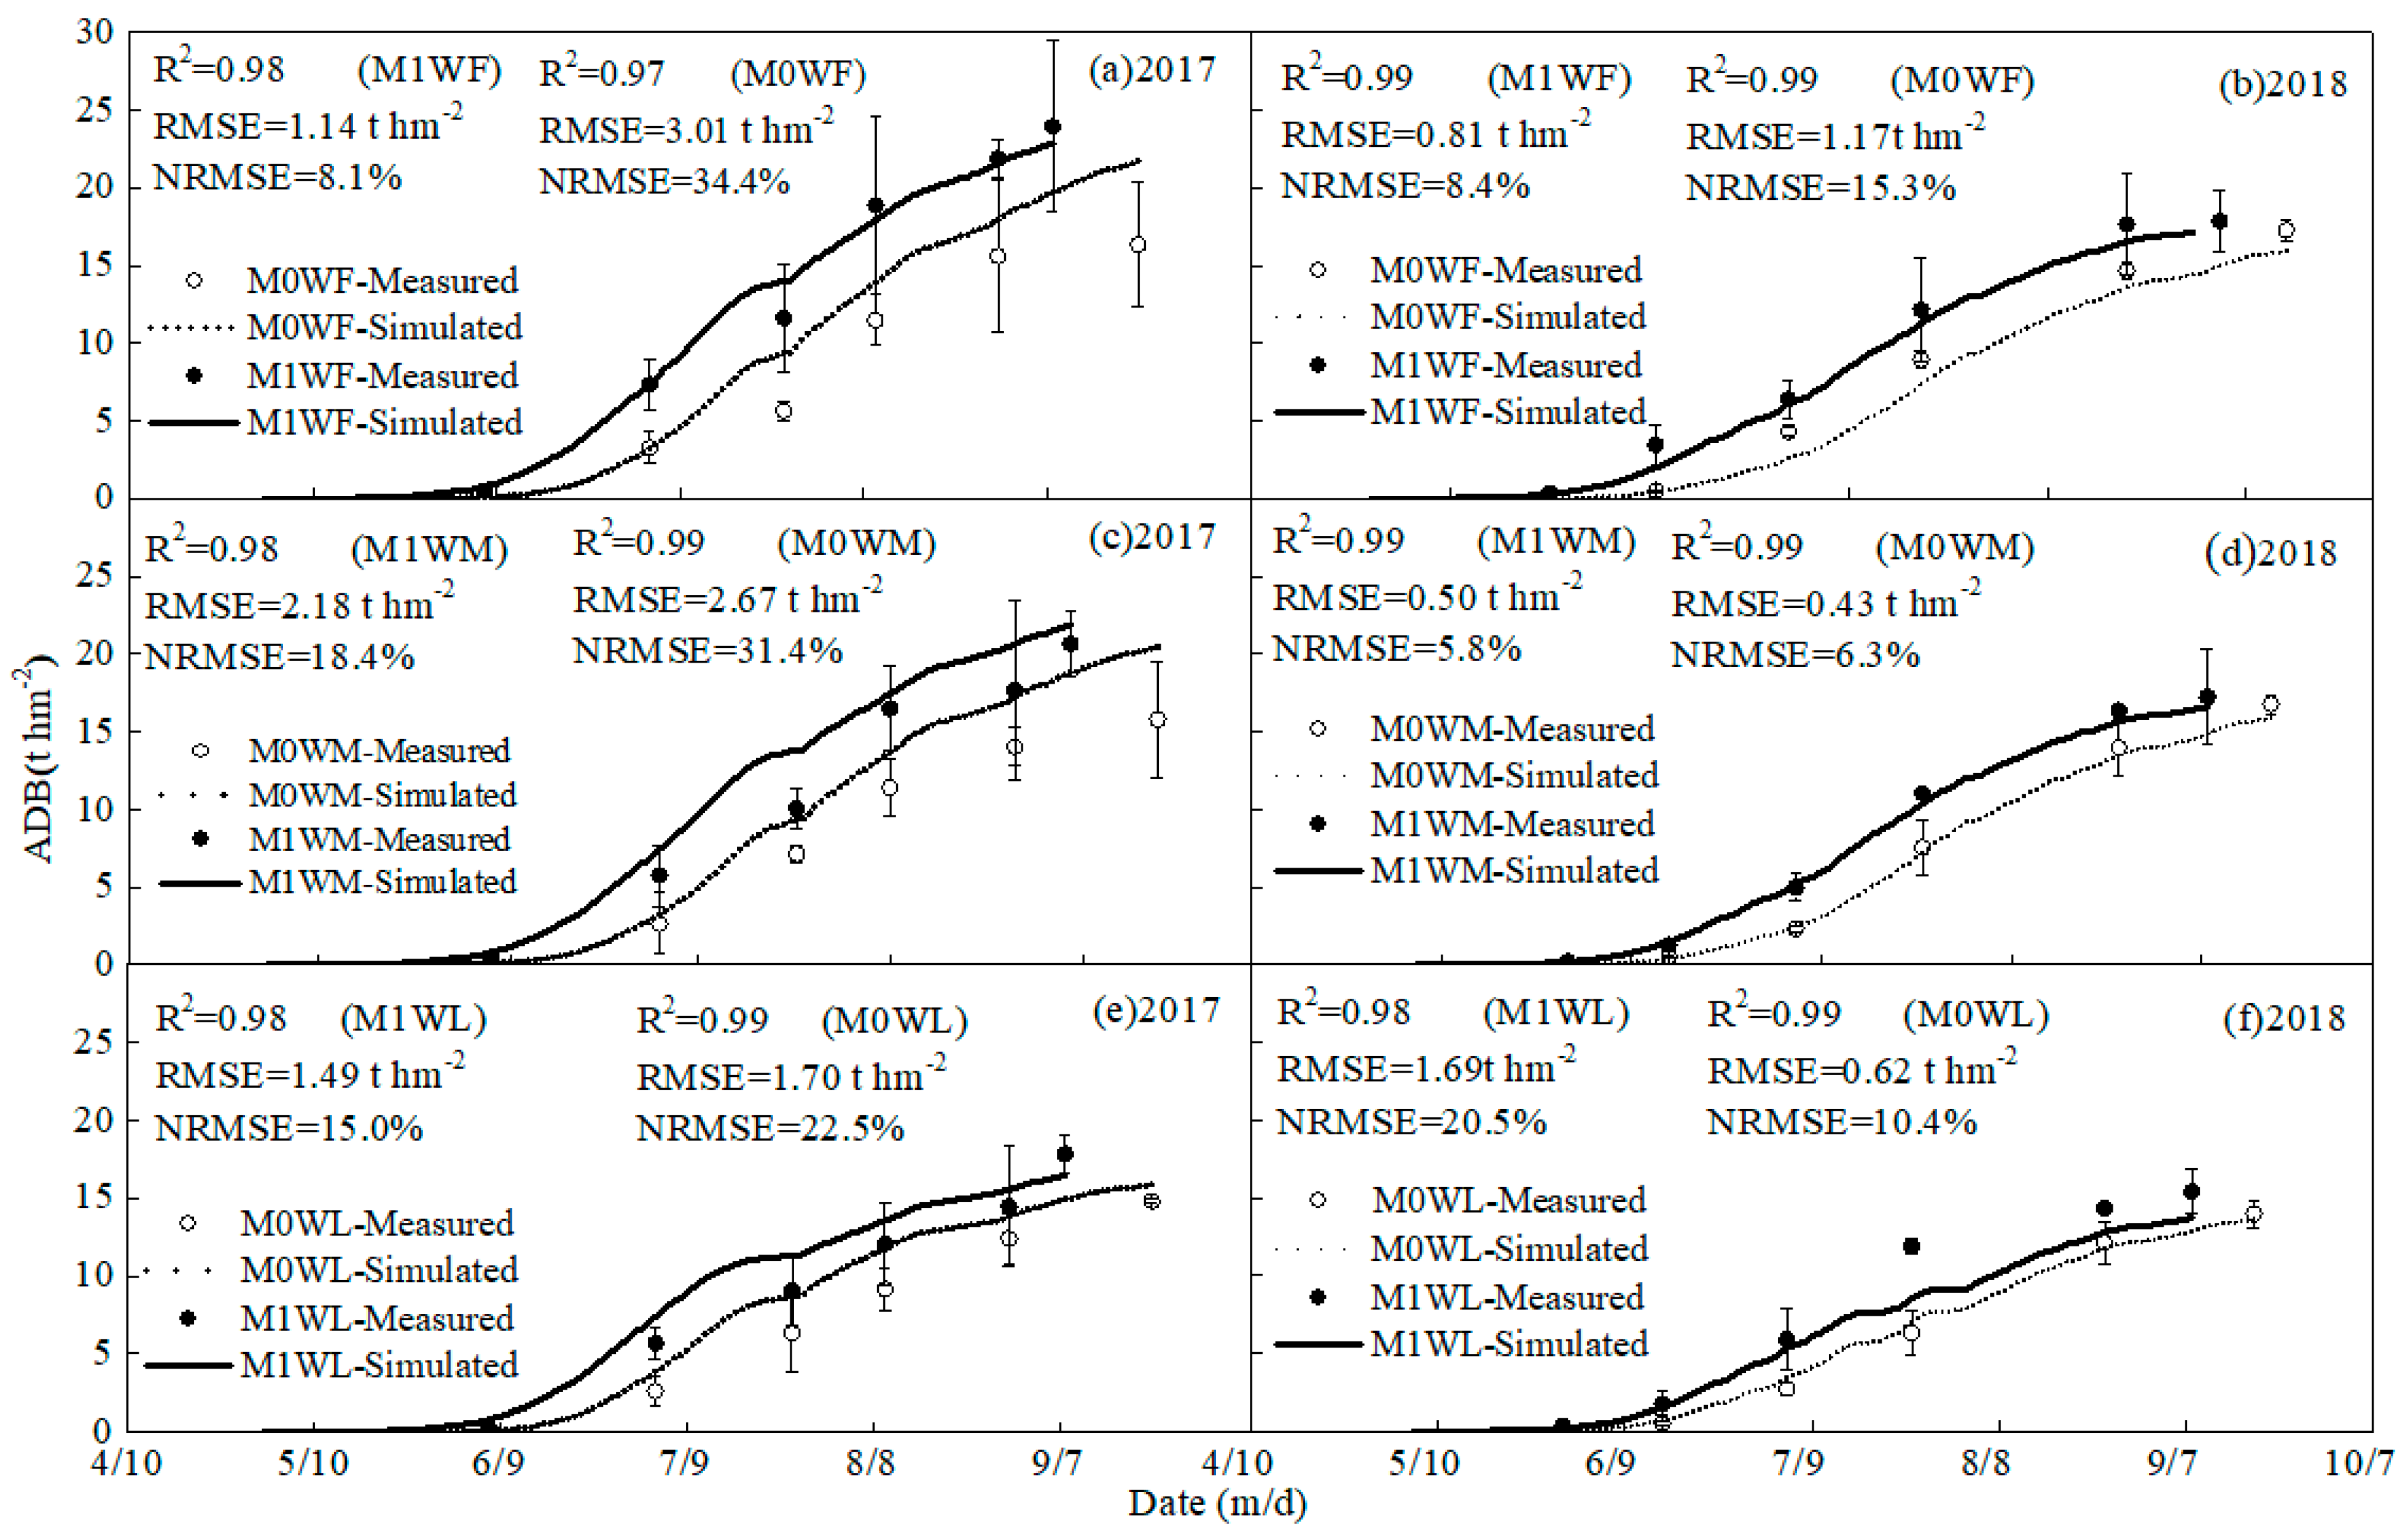
3.5. Aboveground Dry Biomass (ADB)

The ADB of seed-maize increased with the crop growth (Figure 5). The ADB under film mulching was higher than that under non-mulching. For both mulching conditions, more irrigation resulted in higher ADB. The simulated seed-maize ADB was higher than the measured in 2017, while the simulated seed-maize ADB was lower than the measured in 2018. The possible explanation could be that differences of seed-maize cultivars in 2017 and 2018 were too simply considered by the model. For example, the ADB of different cultivars may perform differently with the accumulated temperature [19]. It can also be seen from Figure 5 that, except for the M0WF and M0WM treatments in 2017, the simulated and measured total ADB were in good agreement. The R2 for simulated ADB was > 0.96 under different treatments. Except for the RMSE and NRMSE values of 2.67–3.01t hm−2 and 31.4%–34.4% under M0WF and M0WM treatments in 2017, the RMSE and NRMSE values of the other treatments ranged from 0.43 to 2.18 t hm−2 and 5.8% to 22.5%, respectively. Sun et al. [58] concluded NRMSE between the measured and the simulated ADB of maize was 18.0%. Therefore, SWAP did not simulate ADB as well for M0WF and M0WM treatments in 2017, while the simulation effects under the other treatments were good.

3.6. Yield, ET, and WUE

Under the same mulching conditions, the simulated and measured yield of seed-maize increased with increasing irrigation amounts (Table 8). For the measured yields, the yields from WF treatment were significantly higher than those from WL treatment. In general, the yield of seed-maize decreased with increasing irrigation amounts under non-mulching in 2017, which was mainly because the yield was greatly reduced under M0WF and M0WM treatments in 2017 due to freeze damage. However, spike grain under M0WL treatment did not suffer the freeze damage because its growth period was shortened due to its water deficiency. In 2018, the spike grain all the treatments did not suffer the freeze damage due to earlier sowing date.
Plastic film mulching enhanced soil temperature, accelerated the growth process of seed-maize, and increased LAI during the early growth period, thus improving the ADB and yield, which was in accord with previous studies [39,59,60]. The results of these two years showed that film mulching could not increase the yield of seed-maize significantly under most treatments (Table 8). While under WF and WM treatments in 2017, film mulching had significant impact on the yield of seed-maize (Table 8), which was because the spike grain suffered the freeze damage under M0WF and M0WM treatments, resulting in a lower yield.
The measured accumulated ET using the water balance method for all the treatments during the entire growing period is presented in Figure 6. The accumulated ET was higher for the larger irrigation treatments. The accumulated ET under film mulching was lower than that of non-mulching at the early and late stages, while higher at the middle stage. At the early stage, film mulching reduced soil evaporation and the accumulated ET was lower than that of non-mulching. With the growth of maize plant, the LAI became significantly higher under film mulching, with higher transpiration, which caused the higher accumulated ET. At the later stage, the accumulated ET decreased under film mulching because of the earlier maturity of maize under film mulching. For the measured total ET, film mulching significantly reduced the total ET (Table 8), mainly because film mulching greatly reduced evaporation, which was similar to many other studies [61,62].
Comparing the simulated and measured seed-maize yield and ET under different treatments, it could be concluded that the deviations between the simulated and measured values of seed-maize yield and ET by SWAP were within a reasonable range (Table 8). SWAP could simulate the yield of seed-maize well under film mulching conditions with an MRE of 1.1%–2.4%. Except for M1WM and M0WL in 2017, the simulated seed-maize yields were higher than the measured values and the simulation effects were within a reasonable range with an MRE of 1.1%–34.6%. The SWAP model has been widely used for evaluating crop yield and the model had a good simulation effect for maize yield in the main producing areas of Southwest China [43] and the yield of various crops [19,47,48,63,64,65]. The simulated ET values under different treatments were good with an MRE of 4.3%–25.7% (Table 8). The simulated ET was lower than the measured value under the treatments of M1WF in 2017 and M1WF and M0WF in 2018. However, the simulated ET was higher than the measured value under the other treatments (Table 8). This was mainly related to the LAI (Figure 4). Under the treatments of M1WF in 2017 and M1WF and M0WF in 2018, the model underestimated LAI and reduced transpiration, which led to the underestimation of ET and vice versa. The WUE was calculated from yield and ET. The MREs of WUE were within the reasonable range of 2.8%–32.1% (Table 8).
According to the measured results, the amount of irrigation for M1WM treatment was reduced by 30.0%, the yield was only averagely reduced 4.3%, while the WUE was averagely improved by 16.6%. Results demonstrated that the M1WM treatment could achieve the target of more WUE, higher yield, less irrigation water.

4. Scenario Analysis under the Future Climate Change

4.1. Future Climate Scenarios

As mentioned above, the SWAP model could reasonably simulate the dynamic changes of soil water and heat and seed-maize growth, yield and ET under both film mulching and no mulching through proper selection of model parameters. Future climate change has brought both opportunities and challenges to food production. Representative Concentration Paths (RCPs) scenarios are the most widely used method to study climate change and its impact on crop productivity [66,67]. Liu et al. [66] obtained the daily precipitation, maximum air temperature and minimum air temperature under three RCPs (RCP2.6, RCP4.5, RCP8.5) during 2021–2050 in the Heihe River basin of Northwest China. They used a statistical downscaling model (SDSM) based on the observed meteorological data from 17 meteorological stations (1961–2000), 40-year reanalysis data (ERA-40), and five preferred general circulation model (GCM) outputs selected from 23 GCMs of CMIP5 (Phase 5 of the Coupled Model Intercomparison Project). Compared with the baseline period of 1976–2005, the mean annual precipitation showed a decreasing trend and air temperature showed an increasing trend during 2021–2050 under the three RCPs scenarios. The changes in the mean annual precipitation, maximum air temperature (Tmax) and minimum air temperature (Tmin) are shown in Table 9. The typical agricultural area (Shandan station), similar to our experimental area in geographical location and climate, was selected for predicting the impact of the three RCPs scenarios on crop growth and ET in 2050 and the trend of seed-maize yield in the future 30 years under both film mulching and non-mulching conditions. The CO2 concentrations of various scenarios were adopted from the data of Meinshausen et al. [68]. The initial conditions and planting management was based on the M1WF and M0WF treatments in 2017, respectively.

4.2. Seed-Maize Growth and ET under Future Climate Scenarios

The LAI and ADB of seed-maize under the three RCPs scenarios in 2050 are shown in Figure 7. The future climate change scenario did not change the peak time of LAI, it reduced the maximum LAI and shortened the growth period. Compared with the LAI and ADB in 2017, the LAI and ADB under the three RCPs scenarios decreased in the order RCP8.5 > RCP2.6 > RCP4.5. The average LAI reduced by 23.0%, 21.2%, 37.0% for the M1WF treatment, 32.5%, 25.7%, 40.9% for the M0WF treatment, under the RCP2.6, RCP4.5, RCP8.5, respectively. For the ADB, the final ADB reduced by 22.6%, 19.5%, 32.4% for the M1WF treatment, 21.3%, 16.3%, 33.9% for the M0WF treatment, under the RCP2.6, RCP4.5, RCP8.5, respectively.
Table 10 shows that the climate change could reduce the seed-maize yield and ET. Compared with the yield in 2017, the seed-maize yield decreased by 29.2%, 30.2%, 40.1% for the M1WF treatment and 9.4%, 2.5%, 29.9% for the M0WF treatment under the RCP2.6, RCP4.5, RCP8.5, respectively. It indicated that the future climate change had a more significant impact on yield reduction under the M1WF treatment, compared with the M0WF treatment. The ET decreased by 16.1%, 14.3%, 22.3% for the M1WF treatment and 15.4%, 12.6%, 21.0% for the M0WF treatment under the RCP2.6, RCP4.5, RCP8.5, respectively [30,66,69].
The interannual variation trend of seed-maize yield under the RCP2.6 and RCP8.5 scenarios for the future 30 years were shown in Figure 8. Under the future climate scenarios, the seed-maize yield featured a wavelike decrease. In most years, the yield of M1WF treatment was 9.5% lower than that of M0WF treatment, which indicated that film mulching no longer increased the seed-maize yield and current film mulching management might not be suitable for this area to improve crop production under the future climate scenarios.
The LAI, ADB and yield of seed-maize decreased under the climate change scenarios, indicating a negative impact on the growth of seed-maize in the future. High temperature caused the decrease in photosynthesis and increase in respiration, which led to a significant decrease in ADB [70]. High temperature accelerated the growth process, shortened the growing period, caused premature senescence and death of seed-maize in the late growth stage, and shortened the filling stage [29]. Due to the heat preservation effect of the plastic film, M1W1 treatment tended to accelerate the growth process and shorten the filling stage more prominently than that of M0W1 treatment, which resulted in more obvious yield reduction in M1W1 treatment due to climate change (Table 10).
In this study, most social factors remained unchanged (maize cultivar, planting date and irrigation schedule). Therefore, our study reflected the variation of seed-maize growth under film mulching and non-mulching under the three RCPs scenarios, with same planting managements. Future research should aim to develop new cultivars requiring more growing-degree-days to reach maturity, adjust planting date and irrigation schedule to fit the climate change.

5. Conclusions

Film mulching could increase soil temperature and promote LAI increase during the early growth period, thus improving the ADB, yield, and WUE of seed-maize. Frequent irrigation increased seed-maize yield, although WUE was low. Among the treatments, moderate water deficit with plastic film mulching (M1WM treatment) could achieve the target of more WUE, higher yield, less irrigation water.
We extended the application of SWAP from non-mulching conditions to film mulching conditions. By selecting appropriate parameters, SWAP simulated well the soil water content and temperature in each soil layer and the crop growth indexes and yield under different mulching and irrigation treatments.
Scenario simulations demonstrated that future climate change in Northwest China could negatively affect LAI, ADB and yield of seed-maize. The yield of seed-maize on an average decreased by 33.2%, 13.9% under the three RCPs scenarios for film mulching and non-mulching, respectively, and the yields of film mulching was lower than that of non-mulching for the future 30 years, both indicating that current film mulching management might not be suitable for this area to improve crop production under the future climate scenarios.
In this study, the parameters of SWAP model were properly selected to predict soil water and heat transfer and seed-maize growth under film mulching, as well as to predict the impact of future climate change. Models predictions were generally good, but further effort is required to make it more general, reliable, and convenient to be used under mulched conditions. For example, by studying the mulch-participated land–atmosphere energy partitions and water–heat transfer, it is possible to replace the surface temperature driven boundary into atmospheric data driven boundary, thus saving the energy of monitoring the land surface temperature. The effects of film thickness and film thermal conductivity on soil temperature below the film, and considering the effect of soil temperature on crop growth and development stage could further improve the performance of SWAP under various film mulching conditions.
In this study, due to the limitations of the test area, the samples were collected at different locations inside each plot to consider the influence of spatial heterogeneity while there are no plot repetitions. Therefore, in future studies, replica experimental plots should be considered to improve the model reliability.

Author Contributions

Conceptualization: X.M.; Formal analysis: Y.Z., X.M.; Investigation: Y.Z., S.L.; Methodology: Y.Z.; Supervision: X.M., M.K.S.; Writing—original draft: Y.Z.; Writing—review and editing: X.M., M.K.S. All authors have read and agreed to the published version of the manuscript.

Funding

This work was supported by the National Natural Science Foundation of China (51679234, 51790535).

Acknowledgments

We greatly appreciate Liu Liu for providing us the data of future meteorological projections and Frank Sholedice NMSU Agricultural Experiment Station’s editorial assistance. We also appreciate the careful and precise reviews by the anonymous reviewers.

Conflicts of Interest

The authors declare no conflict of interest.

References

  1. Liu, W.T.H.; Botner, D.M.; Sakamoto, C.M. Application of CERES-Maize model to yield prediction of a Brazilian mazie hybrid. Agric. For. Meteorol. 1989, 45, 299–312. [Google Scholar] [CrossRef]
  2. Jiang, X.L.; Kang, S.Z.; Tong, L.; Li, F.S.; Li, D.H.; Ding, R.S.; Qiu, R.J. Crop coefficient and evapotranspiration of grain maize modified by planting density in an arid region of northwest China. Agric. Water Manag. 2014, 142, 135–143. [Google Scholar] [CrossRef]
  3. Ran, H.; Kang, S.Z.; Li, F.S.; Du, T.S.; Ding, R.S.; Li, S.E. Responses of water productivity to irrigation and N supply for hybrid maize seed production in an arid region of Northwest China. J. Arid Land 2017, 9, 504–514. [Google Scholar] [CrossRef]
  4. Musundire, L.; Dari, S.; MacRoberts, J.; Yang, H.S.; Derera, J.; Tongoona, P. Effect of Male Planting Date and Female Plant Population on Hybrid Maize Yield and Evaluation of Use of Hybrid-Maize Simulation Model for Grain Yield Estimation in Hybrid Maize Seed Production. J. Agric. Sci. 2018, 10, 3. [Google Scholar] [CrossRef] [Green Version]
  5. Ali, A.; Issa, A.R.B.; Rahut, D.B. Adoption and Impact of the Maize Hybrid on the Livelihood of the Maize Growers: Some Policy Insights from Pakistan. Scientifica 2020, 8. [Google Scholar] [CrossRef]
  6. Yang, J.; Mao, X.M.; Wang, K.; Yang, W.C. The coupled impact of plastic film mulching and deficit irrigation on soil water/heat transfer and water use efficiency of spring wheat in Northwest China. Agric. Water Manag. 2018, 201, 232–245. [Google Scholar] [CrossRef]
  7. Shi, X.R.; Xu, Q.; Hu, K.L.; Li, S.E. Effect of irrigation times on nitrogen loss, water and nitrogen use efficiencies in oasis spring maize farmland. Trans. Chin. Soc. Agric. Eng. 2018, 34, 118–126. [Google Scholar] [CrossRef]
  8. Burrows, W.C.; Larson, W.E. Effect of amount of mulch on soil temperature and early growth of corn1. Agron. J. 1962, 54, 19–23. [Google Scholar] [CrossRef]
  9. Goldberger, J.R.; Jones, R.E.; Miles, C.A.; Wallace, R.W.; Inglis, D.A. Barriers and Bridges to the Adoption of Biodegradable Plastic Mulches for US Specialty Crop Production. Renew. Agric. Food Syst. 2015, 30, 143–153. [Google Scholar] [CrossRef] [Green Version]
  10. Yang, Q.D.; Zuo, H.C.; Xiao, X.; Wang, S.J.; Chen, B.L.; Chen, J.W. Modelling the effects of plastic mulch on water, heat and CO2 fluxes over cropland in an arid region. J. Hydrol. 2012, 452, 102–118. [Google Scholar] [CrossRef]
  11. Wu, Y.; Huang, F.Y.; Jia, Z.K.; Ren, X.L.; Cai, T. Response of soil water, temperature, and maize (Zea may L.) production to different plastic film mulching patterns in semi-arid areas of northwest China. Soil Tillage Res. 2017, 166, 113–121. [Google Scholar] [CrossRef]
  12. Dong, B.D.; Liu, M.Y.; Jiang, J.W.; Shi, C.H.; Wang, X.M.; Qiao, Y.Z.; Liu, Y.Y.; Zhao, Z.H.; Li, D.X.; Si, F.Y. Growth, grain yield, and water use efficiency of rain-fed spring hybrid millet (Setaria italica) in plastic-mulched and un mulched fields. Agric. Water Manag. 2014, 143, 93–101. [Google Scholar] [CrossRef]
  13. Deng, X.P.; Shan, L.; Zhang, H.; Turner, N.C. Improving agricultural water use efficiency in arid and semiarid areas of China. Agric. Water Manag. 2006, 80, 23–40. [Google Scholar] [CrossRef]
  14. Zhao, H.; Xiong, Y.C.; Li, F.M.; Wang, R.Y.; Qiang, S.C.; Yao, T.F.; Mo, F. Plastic film mulch for half growing-season maximized WUE and yield of potato via moisture-temperature improvement in a semi-arid agroecosystem. Agric. Water Manag. 2012, 104, 68–78. [Google Scholar] [CrossRef]
  15. Yu, A.Z.; Chai, Q. Effects of plastic film mulching and irrigation quota on yield of corn in arid oasis irrigation area. Acta Agron. Sin. 2015, 41, 778–786. [Google Scholar] [CrossRef]
  16. Ma, W.W.; Shi, J.C.; Jin, X.X.; Ning, S.R.; Li, S.; Tao, Y.Y.; Zhang, Y.N.; Liu, Y.; Lin, S.; Hu, P.C.; et al. Rice growth simulation under film mulching in dryland through improving CERES-Rice model. Trans. Chin. Soc. Agric. Mach. 2017, 33, 115–123. [Google Scholar] [CrossRef]
  17. Kroes, J.G.; van Dam, J.C.; Barthoiomeus, R.P.; Groenendijk, P.; Heinen, M.; Hendriks, R.F.A.; Mulder, H.M.; Supit, I.; van Walsum, P.E.V. SWAP Version 4: Theory Description and User Manual; Wageningen Environmental Research: Wageningen, The Netherlands, 2017. [Google Scholar]
  18. Todorovic, M.; Albrizio, R.; Zivotic, L.; Saab, M.T.A.; Stöckle, C.; Steduto, P. Assessment of AquaCrop, CropSyst, and WOFOST models in the simulation of sunflower growth under different water regimes. Agron. J. 2009, 101, 509–521. [Google Scholar] [CrossRef]
  19. Huang, J.X.; Jia, S.L.; Ma, H.Y.; Hou, Y.Y.; He, L. Dynamic simulation of growth process of 33winter wheat in main production areas of China based on WOFOST model. Trans. Chin. Soc. Agric. Eng. 2017, 33, 222–228. [Google Scholar]
  20. Feddes, R.A.; Kowalik, P.J.; Zaradny, H. Simulation of Field Water Use and Crop Yield; Pudoc: Wageningen, The Netherlands, 1978. [Google Scholar]
  21. Smets, S.M.P.; Kuper, M.; Dam, J.C.V.; Feddes, R.A. Salinization and crop transpiration of irrigated fields in Pakistan’s Punjab. Agric. Water Manag. 1997, 35, 43–60. [Google Scholar] [CrossRef]
  22. Jiang, J.; Feng, S.Y.; Huo, Z.L.; Zhao, Z.C.; Jia, B. Application of the SWAP model to simulate water–salt transport under deficit irrigation with saline water. Math. Comput. Model. 2011, 54, 902–911. [Google Scholar] [CrossRef]
  23. Xu, X.; Huang, G.H.; Zhan, H.B.; Qu, Z.Y.; Huang, Q.Z. Integration of SWAP and MODFLOW-2000 for modeling groundwater dynamics in shallow water table areas. J. Hydrol. 2012, 412, 170–181. [Google Scholar] [CrossRef]
  24. Xu, X.; Huang, G.H.; Qu, Z.Y.; Huang, Q.Z. Regional scale model for simulating soil water flow and solute transport processes-GSWAP. Trans. Chin. Soc. Agric. Eng. 2011, 27, 58–63. [Google Scholar] [CrossRef]
  25. Droogers, P. Adaptation to climate change to enhance food security and preserve environmental quality: Example for southern Sri Lanka. Agric. Water Manag. 2004, 66, 15–33. [Google Scholar] [CrossRef]
  26. Xu, X.; Huang, G.H.; Huang, Q.Z. Coupled simulation of soil water flow, solute transport and crop growth processes at field scale and its validation. Trans. Chin. Soc. Agric. Eng. 2013, 29, 110–117. [Google Scholar] [CrossRef]
  27. Ben-Asher, J.; Dam, J.V.; Feddes, R.A.; Jhorar, R.K. Irrigation of grapevines with saline water: II. Mathematical simulation of vine growth and yield. Agric. Water Manag. 2006, 83, 22–29. [Google Scholar] [CrossRef]
  28. Pratiksha, S.; Ram, K.R.; Prakash, S.A. Climate change and maize agriculture among Chepang communities of Nepal: A review. J. Maize Res. Dev. 2018, 3, 53–66. [Google Scholar] [CrossRef] [Green Version]
  29. Muchow, R.C. Effect of high temperature on grain-growth in field-grown maize. Field Crops Res. 1990, 23, 145–158. [Google Scholar] [CrossRef]
  30. Petersen, L.K. Impact of Climate Change on Twenty-First Century Crop Yields in the US. Climate 2019, 7, 40. [Google Scholar] [CrossRef] [Green Version]
  31. Lobell, D.B.; Field, C.B. Global scale climate-crop yield relationships and the impact of recent warming. Environ. Res. 2007, 2, 1–7. [Google Scholar] [CrossRef]
  32. Zhang, Y.; Zhao, Y.; Wang, C.; Chen, S.N. Using statistical model to simulate the impact of climate change on maize yield with climate and crop uncertainties. Theor. Appl. Clim. 2017, 130, 1065–1071. [Google Scholar] [CrossRef]
  33. Zhang, F.; Zhang, W.; Li, M.; Zhang, Y.; Li, F.M.; Li, C.B. Is crop biomass and soil carbon storage sustainable with long-term application of full plastic film mulching under future climate change. Agric. Syst. 2017, 150, 67–77. [Google Scholar] [CrossRef]
  34. Allen, R.G.; Pereira, L.S.; Raes, D.; Smith, M. Crop evapotranspiration. guide-lines for computing crop water requirements. In FAO Irrigation and Drainage Paper 56; Food and Agriculture Organization of United Nations: Rome, Italy, 1998. [Google Scholar]
  35. Ryżak, M.; Bieganowski, A. Methodological aspects of determining soil particle size distribution using the laser diffraction method. J. Plant Nutr. Soil Sci. 2011, 174, 624–633. [Google Scholar] [CrossRef]
  36. Lin, D.J.; Zheng, Z.C.; Zhang, X.Z.; Li, T.X.; Wang, Y.D. Study on the effect of maize plants on rainfall redistribution processes. Sci. Agric. Sin. 2011, 244, 2608–2615. [Google Scholar] [CrossRef]
  37. Haraguchi, T.; Marui, A.; Mori, K.; Nakano, Y. Movement of water collected by vegetables in plastic-mulching field. J. Fac. Agric. Kyushu. Univ. 2003, 48, 237–245. [Google Scholar]
  38. Qin, S.J.; Li, S.E.; Kang, S.Z.; Du, T.S.; Tong, L.; Ding, R.S. Can the drip irrigation under film mulch reduce crop evapotranspiration and save water under the sufficient irrigation condition? Agric. Water Manag. 2016, 177, 128–137. [Google Scholar] [CrossRef]
  39. Fan, Y.Q.; Ding, R.S.; Kang, S.Z.; Hao, X.M.; Du, T.S.; Tong, L.; Li, S.E. Plastic mulch decreases available energy and evapotranspiration and improves yield and water use efficiency in an irrigated maize cropland. Agric. Water Manag. 2016, 179, 122–131. [Google Scholar] [CrossRef]
  40. Stone, P.J.; Sorensen, I.B.; Jamieson, P.D. Effect of soil temperature on phenology, canopy development, biomass and yield of maize in a cool-temperate climate. Field Crop Res. 1999, 63, 169–178. [Google Scholar] [CrossRef]
  41. Yang, N.; Sun, Z.X.; Zhang, L.Z.; Zheng, J.M.; Feng, L.S.; Li, K.Y.; Zhang, Z.; Feng, C. Simulation of water use process by film mulched cultivated maize based on improved AquaCrop model and its verification. Trans. CSAE 2015, 31, 122–132. [Google Scholar] [CrossRef]
  42. Mi, N.; Zhang, Y.S.; Cai, F.; Ji, R.P.; Zhang, S.J.; Yu, H.B.; Yu, X.J. Modelling the impacts of future climate change on maize productivity in north-east China. J. Arid Land Resour. Environ. 2012, 26, 117–123. [Google Scholar] [CrossRef]
  43. Zhang, J.P.; Wang, J.; He, Y.K.; Chen, Y.Y. Evaluation of regional drought disaster to maize using WOFOST crop growth model. Chin. J. Eco Agric. 2017, 25, 451–459. [Google Scholar] [CrossRef]
  44. Morales-Ruiz, A.; Loeza-Corte, J.M.; Díaz-López, E.; Franco-Mora, O.; Mariezurrena-Berasain, M.D.; Estrada-Campuzano, G. Efficiency on the use of radiation and corn yield under three densities of sowing. Inter. J. Agron. 2016, 5. [Google Scholar] [CrossRef] [Green Version]
  45. Šimůnek, J.; Šejna, M.; van Genuchten, M. The Hydrus-2D Software Package for Simulating Two-Dimensional Movement of Water, Heat and Multiple Solutes in Variably Saturated Media. Version 2.0, IGWMC-TPS-53; International Groundwater Modeling Center, Colorado School of Mines: Golden, CO, USA, 1999. [Google Scholar]
  46. Sophocleous, M.; Townsend, M.A.; Vocasek, F.; Ma, L.W.; KC, A. Soil nitrogen balance under wastewater management: Field measurements and simulation results. J. Environ. Qual. 2009, 38, 1286–1301. [Google Scholar] [CrossRef] [PubMed] [Green Version]
  47. Kumar, P.; Sarangi, A.; Singh, D.K.; Parihar, S.S.; Sahoo, R.N. Simulation of salt dynamics in the root zone and yield of wheat crop under irrigated saline regimes using SWAP model. Agric. Water Manag. 2015, 148, 72–83. [Google Scholar] [CrossRef]
  48. Ma, G.N.; Huang, J.X.; Wu, W.B.; Fan, J.L.; Zou, J.Q.; Wu, S.J. Assimilation of MODIS-LAI into the WOFOST model for forecasting regional winter wheat yield. Math. Comput. Model 2013, 58, 634–643. [Google Scholar] [CrossRef]
  49. Wilkerson, G.G.; Jones, J.W.; Boote, K.J.; Ingram, K.T.; Mishoe, J.W. Modeling soybean growth for crop management. Trans. ASAE 1983, 26, 63–73. [Google Scholar] [CrossRef]
  50. Jamieson, P.D.; Porter, J.R.; Wilson, D.R. A test of the computer simulation model ARCWHEAT1 on wheat crops grown in New Zealand. Field Crop Res. 1991, 27, 337–350. [Google Scholar] [CrossRef]
  51. Yuan, C.F.; Feng, S.Y.; Huo, Z.L.; Ji, Q.Y. Simulation of saline water irrigation for seed maize in arid northwest China based on SWAP model. Sustainability 2019, 11, 4264. [Google Scholar] [CrossRef] [Green Version]
  52. Vosselen, A.V.; Verplancke, H.; Ranst, E.V. Assessing water consumption of banana: Traditional versus modelling approach. Agric. Water Manag. 2005, 74, 201–218. [Google Scholar] [CrossRef]
  53. He, Q.S.; Li, S.E.; Kang, S.Z.; Yang, H.B.; Qin, S.J. Simulation of water balance in a maize field under film-mulching drip irrigation. Agric. Water Manag. 2018, 210, 252–260. [Google Scholar] [CrossRef]
  54. Zhang, Y.L.; Feng, S.Y.; Wang, F.X.; Binley, A. Simulation of soil water flow and heat transport in drip irrigated potato field with raised beds and full plastic-film mulch in a semiarid area. Agric. Water Manag. 2018, 209, 178–187. [Google Scholar] [CrossRef] [Green Version]
  55. Balashov, E.; Buchkina, N.; Rizhiya, E.; Farkas, C. Field validation of DNDC and SWAP models for temperature and water content of loamy and sandy loam Spodosols. Int. Agrophys. 2014, 28, 133–142. [Google Scholar] [CrossRef]
  56. Valentinuz, O.R.; Tollenaar, M. Vertical profile of leaf senescence during the grain-Filling period in older and newer maize hybrids. Crop Sci. 2004, 44, 827–834. [Google Scholar] [CrossRef]
  57. Cheng, Z.Q.; Meng, J.H.; Wang, Y.M. Improving spring maize yield estimation at field scale by assimilating time-series HJ-1 CCD Data into the WOFOST model using a new method with fast algorithms. Remote Sens. 2016, 8, 303. [Google Scholar] [CrossRef] [Green Version]
  58. Sun, Z.L.; Hou, Q.; Ma, Y.P.; Zhao, H.Y.; Zhao, F.; Zhang, F.C. Adaptability of WOFOST model to simulate the whole growth period of maize in Hetao irrigation region of Inner Mongolia. Chin. J. Ecol. 2016, 35, 800–807. [Google Scholar] [CrossRef]
  59. Li, F.M.; Guo, A.H.; Wei, H. Effects of clear plastic film mulch on yield of spring wheat. Field Crops Res. 1999, 63, 79–86. [Google Scholar] [CrossRef]
  60. Bu, L.D.; Liu, J.L.; Zhu, L.; Luo, S.; Chen, X.P.; Li, S.; Hill, R.; Zhao, Y. The effects of mulching on maize growth, yield and water use in a semi-arid region. Agric. Water Manag. 2013, 123, 71–78. [Google Scholar] [CrossRef]
  61. Liang, H.; Hu, K.L.; Qin, W.; Zuo, Q.; Zhang, Y.N. Modelling the effect of mulching on soil heat transfer, water movement and crop growth for ground cover rice production system. Field Crops Res. 2017, 201, 97–107. [Google Scholar] [CrossRef]
  62. Shen, Q.X.; Ding, R.S.; Du, T.S.; Tong, L.; Li, S.E. Water use effectiveness is enhanced using film mulch through increasing transpiration and decreasing evapotranspiration. Water 2019, 11, 1153. [Google Scholar] [CrossRef] [Green Version]
  63. Verma, A.K.; Gupta, S.K.; Isaac, R.K. Long-term cyclic irrigation in subsurface drained lands: Simulation studies with SWAP. J. Agric. Sci. 2013, 5, 84. [Google Scholar] [CrossRef] [Green Version]
  64. Ceglar, A.; van der Wijngaart, R.; de Wit, A.; Lecerf, R.; Boogaard, H.; Seguini, L.; van den Berg, M.; Toreti, A.; Zampieri, M.; Fumagalli, D.; et al. Improving WOFOST model to simulate winter wheat phenology in Europe: Evaluation and effects on yield. Agric. Syst. 2019, 168, 168–180. [Google Scholar] [CrossRef]
  65. Bai, T.C.; Zhang, N.N.; Chen, Y.Q.; Mercatoris, B. Assessing the performance of the WOFOST model in simulating Jujube fruit tree growth under different irrigation regimes. Sustainability 2019, 11, 1466. [Google Scholar] [CrossRef] [Green Version]
  66. Liu, L.; Guo, Z.Z.; Huang, G.H.; Wang, R.T. Water productivity evaluation under multi-GCM projections of climate change in Oases of the Heihe River Basin, Northwest China. Inter. J. Environ. Res. Public Health 2019, 16, 1706. [Google Scholar] [CrossRef] [PubMed] [Green Version]
  67. Wang, R.T.; Cheng, Q.Y.; Liu, L.; Yan, C.R.; Huang, G. Multi-model projections of climate change in different RCP scenarios in an arid inland region, Northwest China. Water 2019, 11, 347. [Google Scholar] [CrossRef] [Green Version]
  68. Meinshausen, M.; Smith, S.J.; Calvin, K.; Daniel, J.S.; Kainuma, M.L.T.; Lamarque, J.F.; Matsumoto, K.; Montzka, S.A.; Raper, S.C.B.; Riahi, K.; et al. The RCP greenhouse gas concentrations and their extensions from 1765 to 2300. Clim. Chang. 2011, 109, 213–241. [Google Scholar] [CrossRef] [Green Version]
  69. Soddu, A.; Deidda, R.; Marrocu, M.; Meloni, R.; Paniconi, C.; Ludwig, R.; Sodde, M.; Mascaro, G.; Perra, E. Climate variability and durum wheat adaptation using the AquaCrop model in southern Sardinia. Procedia Environ. Sci. 2013, 19, 830–835. [Google Scholar] [CrossRef]
  70. Zhang, X.W.; Wang, J.R.; Ji, M.F.; Milne, R.I.; Wang, M.H.; Liu, J.Q.; Shi, S.; Yang, S.L.; Zhao, C.M. Higher thermal acclimation potential of respiration but not photosynthesis in two alpine picea taxa in contrast to two lowland congeners. PLoS ONE 2015, 10, e0123248. [Google Scholar] [CrossRef]
Figure 1. Precipitation during the growing period in 2017 (a) and 2018 (b).
Water 12 01330 g001
Figure 2. Comparison of the simulated and measured soil water storage (SWS) of 0–60 cm soil depths under different treatments during the growth period in 2017 (af) and 2018 (gl). (1 R2, coefficient of determination; RMSE, root mean square error; NRMSE, normalized root mean square error. 2 M1, mulching; M0, non-mulching; WF, full water irrigation (100%); WM, medium water irrigation (70%); WL, low water irrigation (40%). 3 Error bars were obtained by STDEV.S function of EXCEL with three random samples.).
Water 12 01330 g002
Figure 3. Comparison of the simulated and measured average daily soil temperature at 10, 20, 40, and 80 cm soil depths under M1WF and M0WF treatments during the whole growth period in 2017 (ah) and 2018 (ip).
Water 12 01330 g003
Figure 4. Comparison of the simulated and measured leaf area index (LAI) under different treatments during the entire growing season of 2017 (a,c,e) and 2018 (b,d,f).
Water 12 01330 g004
Figure 5. Comparison of the simulated and measured aboveground dry biomass (ADB) under different treatments during the entire growing season of 2017 (a,c,e) and 2018 (b,d,f).
Water 12 01330 g005
Figure 6. The measured accumulated ET using the water balance method for all the treatments during the entire growing period in 2017 (a) and 2018 (b).
Water 12 01330 g006
Figure 7. The LAI and ADB of seed-maize under the three RCPs scenarios in 2050. (1 Actual means the values in 2017.).
Water 12 01330 g007
Figure 8. Temporal variations of the seed-maize yield under the RCP2.6 and RCP8.5 scenarios.
Water 12 01330 g008
Table 1. Irrigation amounts (mm) under different treatments during 2017 and 2018.
YearsTreatmentsIrrigation Date (Month/Day) and Irrigation Amounts (mm)Total Irrigation Amounts
2017 5/306/116/196/297/97/157/198/88/28
M1WF15.07.639.742.742.125.630.342.061.3306.4
M1WM10.55.327.829.929.417.921.229.442.9214.5
M1WL6.03.115.917.116.810.312.116.824.5122.6
M0WF15.07.624.842.742.125.625.742.065.9291.4
M0WM10.55.317.429.929.417.918.029.444.4204.0
M0WL6.03.19.917.116.810.310.316.825.4116.6
2018 6/16/116/207/27/127/228/18/20
M1WF14.522.240.240.537.940.650.232.8 279.0
M1WM10.215.628.228.426.528.435.223.0 195.3
M1WL5.88.916.116.215.116.220.113.1 111.6
M0WF14.514.340.240.532.342.550.235.4 270.1
M0WM10.210.028.228.422.629.835.224.8 189.1
M0WL5.85.716.116.212.917.020.114.1 108.0
M1, mulching; M0, non-mulching; WF, full water irrigation (100%); WM, medium water irrigation (70%); WL, low water irrigation (40%).
Table 2. Measured soil physical properties along the soil profile in the experiment site.
Soil Layers (cm)Particle Fraction (%)Bulk Density (g cm−3)Soil Texture
Sand (2–0.05 mm)Silt (0.05–0.002 mm)Clay (<0.002 mm)
0–2027.1563.589.271.53Silt loam
20–4030.1760.419.421.48Silt loam
40–6017.9271.1210.961.46Silt loam
60–8016.9773.049.991.58Silt loam
80–10035.1757.077.761.50Silt loam
Table 3. The relative sensitivity (RS) of model parameters for SWS, LAI, ADB, yield and soil temperature.
OutputSWSLAIADMYieldSoil Temperature
Parametersn (0.340)Tsum1 (1.427)LUE (0.952)Tsum2 (1.457)Soil texture (0.101)
Ρ (0.332)LUE (0.892)EC-R (0.665)LUE (0.989)
θs (0.295)SPAN (0.816)EC-L (0.632)SPAN (0.962)
ksoil (0.244)MRILAI (0.766)MRILAI (0.575)Tsum1 (0.931)
Kc (0.223)EC-L (0.709)Amax (0.565)EC-SO (0.695)
β (0.204)FTADM-R (0.589)FTDM-R (0.557)EC-S (0.317)
α (0.104)SLA (0.588)EC-S (0.502)SLA (0.302)
EC-R (0.581)ITCDW (0.475)FTDM-S (0.292)
ITCDW (0.548)SLA (0.416)Kdif (0.232)
EC-S (0.499)FTDM-L (0.309)MRR-L (0.201)
FTDM-L (0.426)Kdif (0.252)MRILAI (0.172)
Amax (0.269)Tsum1 (0.157)Amax (0.156)
Kdif (0.264)MRR-L (0.120)EC-L (0.154)
Amax, max CO2 assimilation rate; EC-L, efficiency of conversion into leaves; EC-R, efficiency of conversion into roots; EC-S, efficiency of conversion into stems; EC-SO, efficiency of conversion into storage organs; FTADM-L, fraction of total aboveground dry biomass to the leaves; FTADM-R, fraction of total aboveground dry biomass to the roots; FTADM-S, fraction of total aboveground dry biomass to the stems; ITCDW, initial total crop dry weight; Kdif, extinction coefficient for diffuse visible light; LUE, light use efficiency; MRILAI, maximum relative increase in LAI; MRR-L, maintenance respiration rate of leaves; SLA, specific leaf area; SPAN, lifespan under leaves under optimum conditions; Tsum1, temperature sum from emergence to anthesis; Tsum 2, temperature sum from anthesis to maturity; n, shape factor for soil water retention curve; α, shape factor for soil water retention curve; ρ, dry soil bulk density; θs, saturated water content; Kc, the crop coefficient ksoil, the soil factor; β, is a soil-specific parameter. The values in parentheses after the parameters are RS.
Table 4. Parameters under the conditions of film mulching (M1) and non-mulching (M0).
ModulesParametersInitial ValuesValues
M1M0
Crop evapotranspiration moduleksoil0.50.651.1
β, cm day−1/20.350.170.50
Crop moduleKc (0–0.5–1–1.4–2)0.5–1.0–1.0–1.0–1.00.5–0.8–1.4–1.2–0.80.6–1.1–1.5–1.2–0.8
Tsum1 (from emergence to anthesis), °C day850770.00850.00
Tsum2 (from anthesis to maturity), °C day800820.00820.00
Table 5. Calibrated soil hydraulic parameters in van GenuchtenMualem (VGM) model.
Soil Depth (cm)Residual Water Content θr
(cm3 cm−3)
Saturated Water Content θs
(cm3 cm−3)
Saturated Hydraulic Conductivity ks
(cm day−1)
Shape Factor for Soil Water Retention Curve α
(cm−1)
Shape Factor for Soil Water Retention Curve nHydraulic Conductivity Shape Factor λ
0–200.040.4120.840.01721.5850.5
20–400.040.4024.650.01691.4970.5
40–600.080.4325.770.01551.4600.5
60–800.080.4216.970.01691.5940.5
80–1000.030.4225.410.01881.5430.5
Table 6. Main crop parameters used in SWAP.
ParametersInitial ValuesValues
Initial total crop dry weight, kg ha−11010
Maximum relative increase in LAI, m2 m−2 day−10.02940.02
Specific leaf area (0–0.5–0.8–1-2), ha kg−10.0026–0.0017–0.0012–0.0012–0.00120.0035–0.0012–0.0007–0.0005–0.0005
SPAN3333
Extinction coefficient for diffuse visible light0.600.60
Max CO2 assimilation rate (0–1–1.5–2), kg ha−1 h−170–70–70–7050–60–60–40
Efficiency of conversion into leaves, kg kg−10.680.75
Efficiency of conversion into storage organs, kg kg−10.6710.60
Efficiency of conversion into roots, kg kg−10.690.70
Efficiency of conversion into stems, kg kg−10.6580.80
Maintenance respiration rate of leaves, kg CH2O kg day−10.0300.020
Fraction of ADB to the roots (0–0.2–0.4–1–2)0.40–0.34–0.27–0.00–0.000.55–0.44–0.33–0.00–0.00
Fraction of ADB to the leaves (0–0.33–0.88–0.95–1.1–1.2–2)0.62–0.62–0.15–0.15–0.40–0.00–0.000.60–0.60–0.60–0.60–0.00–0.00–0.00
Fraction of ADB to the stems (0–0.33–0.88–0.95–1.1–1.2–2)0.38–0.38–0.85–0.85–0.40–0.00–0.000.40–0.40–0.40–0.40–0.90–0.60–0.00
In the table, the values in parentheses after the first column refer to development stages where 0 is emergence, 1 is anthesis, 2 is maturity, and so on. ADB, aboveground dry biomass.
Table 7. R2, RMSE, and NRMSE values between the simulated and measured average daily soil temperature under different treatments in 2017 and 2018.
YearsTreatment10 cm20 cm40 cm80 cm
R2RMSE
(°C)
NRMSE
(%)
R2RMSE
(°C)
NRMSE
(%)
R2RMSE
(°C)
NRMSE
(%)
R2RMSE
(°C)
NRMSE
(%)
2017M1WF0.982.19.90.801.78.70.881.15.80.980.63.3
M1WM0.791.26.00.851.26.00.911.15.30.980.74.1
M1WL0.592.511.70.652.110.20.791.47.20.960.73.8
M0WF0.801.89.70.871.26.40.911.15.90.980.63.4
M0WM0.752.010.50.861.37.00.881.68.60.962.112.7
M0WL0.752.010.50.781.89.40.831.89.80.962.615.1
2018M1WF0.982.19.60.781.77.90.861.36.10.970.94.8
M1WM0.642.210.10.751.88.30.831.57.10.971.05.2
M1WL0.732.08.90.781.67.20.861.15.30.980.63.4
M0WF0.821.67.90.891.26.20.941.68.00.990.84.6
M0WM0.841.68.10.911.26.00.791.68.40.980.84.3
M0WL0.742.210.50.811.78.50.891.36.70.970.95.1
Table 8. Comparison of the simulated and measured seed-maize yield, total evapotranspiration (ET), and water use efficiency (WUE) under different treatments in 2017 and 2018.
TreatmentsYield (t hm−2)Total ET (mm)WUE (kg m−3)
MeasuredSimulatedMRE (%)MeasuredSimulatedMRE (%)MeasuredSimulatedMRE (%)
2017M1WF7.19 a7.362.4423.0 b402.44.91.70 bc1.837.6
M1WM6.83 ab6.672.4358.6 d390.38.81.90 ab1.7110.3
M1WL5.68 bcd5.741.1258.4 f314.021.52.20 a1.8316.8
M0WF4.97 d6.6934.6448.7 a468.24.41.11 d1.4328.9
M0WM5.13 cd5.8413.8387.2 c453.217.01.32 cd1.292.8
M0WL5.33 cd4.5514.7298.8 e375.725.71.78 bc1.232.1
2018M1WF5.14 a5.221.5411.9 b352.014.512.5 ab14.818.8
M1WM4.94 ab5.031.8327.3 d344.65.315.1 a14.63.4
M1WL3.91 bc3.981.8241.2 f289.119.916.2 a13.815.1
M0WF4.87 ab4.982.3429.2 a389.19.311.4 c12.812.3
M0WM3.89 bc4.6720.0358.1 c373.44.310.9 c12.515.1
M0WL2.95 c3.8429.8270.8 e306.113.010.9 c12.514.8
Different letters after numbers in the same column indicate significant differences between the treatments (p < 0.05).
Table 9. Changes of the mean annual precipitation, maximum air temperature (Tmax) and minimum air temperature (Tmin) during the 2021–2050 period under the three Representative Concentration Path (RPC) scenarios in the Heihe River Basin compared with the baseline period (1976–2005).
ChangePrecipitation (%)Tmax (°C)Tmin (°C)
RCP2.6−4.57+1.23+1.08
RCP4.5−5.22+1.35+1.18
RCP8.5−2.40+1.55+1.68
Table 10. The seed-maize yield and ET under climate change scenarios in 2050.
ScenariosYield (t hm−2)ET (mm)
M1WFM0WFM1WFM0WF
Actual7.366.69402.4468.2
RCP2.65.216.06337.5396.1
RCP4.55.146.52345.0409.2
RCP8.54.414.69312.8369.7
Actual means the values in 2017.

