Article

The Effect of Unsteady Water Discharge through Dams of Hydroelectric Power Plants on Hydrodynamic Regimes of the Upper Pools of Waterworks

1
Institute of Continuous Media Mechanics UB RAS, 1, Koroleva Str., Perm 614013, Russia
2
Theoretical Physics Department, Perm State University, 15, Bukireva Str., Perm 614990, Russia
3
Hydrology and Water Resources Protection Department, Perm State University, 15, Bukireva Str., Perm 614990, Russia
4
Mining Institute UB RAS, 78A, Sibirskaya, Str., Perm 614007, Russia
*
Author to whom correspondence should be addressed.
Water 2020, 12(5), 1336; https://doi.org/10.3390/w12051336
Submission received: 30 March 2020 / Revised: 3 May 2020 / Accepted: 5 May 2020 / Published: 8 May 2020
(This article belongs to the Section Water Resources Management, Policy and Governance)

Abstract

:
The hydrological regimes of surface water bodies, as a rule, are unsteady. However, accounting for the non-stationarity substantially complicates the hydrodynamic calculations. Because of this, the scenario approach is traditionally used in the calculations. Characteristic scenarios are set with constant hydrological characteristics throughout the time covered in the calculations. This approach is fully justified if the characteristic time of the change in water flow rate is much longer than the calculation time. However, nowadays, tasks are becoming more and more urgent when accounting for flow variability during calculation period becomes crucial. First of all, such a problem arises when assessing the effect of non-stationary water discharge through hydroelectric power plant dams on the hydrodynamic regime of both the upper and lower pools of the reservoir. In the present paper, the effect of the intraday variability of the Kamskaya Hydroelectric Power Plant (Kamskaya HEPP) operation on the peculiarities of the hydrodynamic regimes of the near-dam part of the upper pool of the Kama reservoir is described. The importance of the problem is determined by the location of the main drinking water intake of Perm city and one of the largest thermal power plants (TPP) in Europe, Permskaya TPP, in this part of the reservoir. This TPP uses a direct-flow cooling system from the Kama reservoir, which is very sensitive to the peculiarities of the hydrodynamic regime of the reservoir. The computational experiments based on the combined hydrodynamic models in 2D/3D formulations have shown that the intraday oscillations of the discharge flow rate through the dam of the HEPP have a very significant effect on the hydrodynamic regime of the reservoir in the vicinity of the Permskaya TPP; therefore, these effects must be taken into account when minimizing the risks of thermal effluents entering the intake channel of the Permskaya TPP.

1. Introduction

When operating the power units of power plants, a large amount of water is used to cool their components. Cooling is carried out by means of reverse water supply, by using cooling towers, columns for cooling water, a pond-cooler, or by the direct-flow method using water from natural reservoirs. When implementing the second cooling method, the discharge of heated water is carried out into the environment at a lower temperature. The negative environmental impact of heated water has been described in numerous publications (see, for example [1,2,3,4,5]). An analysis of the impact of climate change and socio-economic factors on global water scarcity is presented in [6]. This work extends previous global water use research by analyzing not only the effects on livelihoods and climate change, but also electricity production, water use efficiency and other external factors for water scarcity. The temperature standards contained in the European directive [7] on freshwater fish are presented in [6]. The water temperature downstream of the discharge point should not exceed 21.5 °C and 28 °C (or 1.5 °C and 3 °C higher than the background temperature of the reservoir) for salmon and cyprinid fish species, respectively. The works [8,9,10,11] deal with the investigation of variations in the river water temperature due to the climate change.
When solving the problems of thermal pollution, it is necessary to take into account the location of the source of discharges [12,13,14,15,16,17,18,19]. Based on the location and size of the water intake facilities, it is necessary to ensure the optimum temperature difference between the water of the reservoir and the heated wastewater with minimal damage to the environment [19]. It is also necessary to prevent the entry of heated water into the intake zone, which can significantly reduce the efficiency of the power plant cooling system [20]. These problems must be solved within the framework of the development of mathematical and numerical models.
Initially, numerical modeling was carried out in the framework of two-dimensional models by averaging velocity over depth and considering temperature propagation in open channels [21,22]. At present, the apparatus of the three-dimensional numerical simulation of the distribution of thermal pollution is developed [5,13,14,23,24,25]. This simulation is necessary for an adequate description of processes, since thermal processes in water bodies are essentially three-dimensional.
The account of the hydrological regime of reservoirs in the described works is carried out either for the average values of the flow velocity or for the time interval at which the reservoir velocity regime is unchanged. However, the hydrological regime of surface water bodies is usually unsteady. Accounting for non-stationarity fundamentally complicates the hydrodynamic calculations. That is why the scenario approach is conventionally used in the calculations. Typical scenarios are set with constant hydrological characteristics throughout the calculation time [25,26]. This approach is fully justified if the characteristic time of the change in water flow is much longer than the calculation time. However, nowadays, tasks are becoming more and more urgent when accounting for flow variability during calculations becomes crucial [27,28].
The aim of this work is to solve the problem of assessing the impact of unsteady water discharge through a Hydroelectric Power Plant (HEPP) on the hydrodynamic regimes of near-dam sections of the upper pulls of large reservoirs. The importance of this study is determined, on the one hand, by the significant intra-daily variability of electricity consumption and, accordingly, by the significant variations in water discharge through HEPP dams, and, on the other hand, by the location of large water consumers that are sensitive to changes in the hydrodynamic regime in the upper pools of reservoirs. This task is considered through the example of the Kamskaya HEPP and the Permskaya Thermal Power Plant (Permskaya TPP) located in the zone of its influence, which is the fourth in Russia in terms of electricity generation. The use of a direct-flow cooling system at this TPP determines its sensitivity to the peculiarities of the hydrodynamic regime of the reservoir.

2. Materials and Methods

To simulate heat-affected zones in the influence area of Perm State District Power Station, a combined scheme was used, built on the basis of model conjugation in 2D and 3D settings. The need to use such a calculation scheme is due to the significant heterogeneity of the considered temperature fields both in the water area and the depth. At the same time, the capabilities of even the most powerful of the available clusters do not allow for accurate 3D calculations for large sections of reservoirs because. when performing calculations in 3D setting for the entire reservoir, a very large amount of information is obtained, which is then not used in full in the future. A two-dimensional model of thermal pollution was constructed for an 82-km stretch of reservoir. For the considered problem, the results of 2D modeling play an auxiliary role, they are used to set the boundary conditions when building 3D models. The performed calculations in [25] showed that this model allows for a qualitative assessment of the distribution of current velocity fields for different directions and wind speeds in the Kama reservoir near Perm State District Power Station. A 3D hydrodynamic model was constructed for the Kama Reservoir section with linear dimensions of 11 km adjacent to the Perm State District Power Plant and includes a source of water intake and a source of wastewater discharge.
This calculation scheme was previously used in another paper of ours [25]. In this paper, the issues of modeling temperature fields created in the Kama reservoir as a result of the discharge of thermal effluents from the Permskaya TPP were considered. The morphometry of the considered section of the reservoir was set on the basis of materials from a detailed bathymetric survey performed by us. Additionally, the model used was calibrated by selecting the most effective heat transfer coefficients of the water surface with the atmosphere and setting the optimal bottom roughness coefficients. Based on a comparison of the measured and calculated characteristics of the water temperature field, it was shown that the difference in the calculated and observed values did not exceed 15–20%. Since the models used in the present paper do not include parameters requiring additional calibration for a substantially unsteady hydrological regime, we believe that a model that works correctly and efficiently for stationary hydrological conditions should reflect the main features of the flow in unsteady regime.

2.1. Development of a Hydrodynamic Model in a Two-Dimensional Formulation

A two-dimensional (in the horizontal plane) model of the Kama river, the upper pool of the Kama reservoir was built on the basis of the licensed, specialized, hydrological software package Surface Water Modeling System v.11.1 (SMS) from Aquaveo LLC (Provo, UT, USA), designed for modeling in two-dimensional approximation of hydrodynamics, the distribution of pollution and transport of suspended and entrained sediments in a water body. The model is based on several models (ADH, RMA2, RMA4 (developed by U.S. Army Corp of Engineers), FESWMS (developed by U.S. Federal Highways Administration), TUFLOW (developed by BMT WBM, Teddington, UK), RiverFlow2D (developed by Hydronia LLC, Pembroke Pines, FL, USA), and others) that allow for the solving of various problems.
The choice of the licensed model in two-dimensional approximations is due to the significant successful experience of its use for solving a wide range of applied problems, including for calculating the thermal pollution zones created by the Perm TPP in the Kama reservoir [25]. This software product allows for fast and accurate hydrodynamic non-stationary calculations using GPU (graphics processing unit) parallelization.

2.2. Model of Unsteady Flow in a Two-Dimensional Formulation of RiverFlow2D, Basic Equations

Shallow water flows can be mathematically described by depth-averaged equations of conservation of mass and momentum with all relevant assumptions [29]. The set of “shallow water” equations has the form:
t ( h ) + x ( u h ) + y ( v h ) = 0
t ( u h ) + x ( u 2 h + 1 2 g h 2 h σ x x ρ ) + y ( u v h h σ x y ρ ) + g h Z D x + g h S x = 0
t ( v h ) + x ( u v h h σ y x ρ ) + y ( v 2 h + 1 2 g h 2 h σ y y ρ ) + g h Z D y + g h S y = 0
where ρ is the water density; g is the gravity acceleration; Z D is the bottom level coordinate; h is the depth; u and v are x and y velocity components in Cartesian coordinate system; σ is the Reynolds stress tensor caused by turbulent and molecular stresses:
σ x x = 2 ρ v u x ,       σ x y = σ y x = ρ v ( u y + v x ) ,       σ y y = 2 ρ v v y
S is the slope friction which can be calculated in two forms:
S x = [ u n 2 u 2 + v 2 C D 2 h 3 C f g h u u 2 + v 2 ]         and         S y = [ v n 2 u 2 + v 2 C D 2 h 3 C f g h v u 2 + v 2 ]
where C f is the friction coefficient; n is the Manning roughness coefficient and C D is the dimension conversion coefficient (1 for SI units and 1.486 for US units). The numerical solution is carried out by the finite-volume method [30].

2.3. Construction of a Two-Dimensional Hydrodynamic Model of a Section of the Kama Reservoir and Initial Data Assignment

A hydrodynamic model of the upper pool of the Kama reservoir was built in the SMS v.11.1 software package using the RiverFlow2D GPU model of Hydronia LLC [30], which allows for hydrodynamic calculations of various hydrological conditions. A model is needed to determine changes in the velocity and level regimes of the Kama river, the upper pool of the Kama reservoir, due to the changing discharge flow from the Kamskaya Hydroelectric Power Plant and the assessment of the impact of its work in the area of the water intake channel of the Permskaya TPP.
The hydrodynamic model built for the upper pool of the Kama reservoir is shown in Figure 1. Characteristic dimensions of the model are the following: the length along the Kama river from the Kamskaya Hydroelectric Power Plant is 82 km, the width varies from 500 to 7000 m. The distance from the dam of the Kamskaya Hydroelectric Power Plant to the thermal pollution study area is ~ 55 km.
To correctly set the morphometry of the water body (building a digital model of the relief of the reservoir), we used official maps of the Kama reservoir and materials of detailed bathymetric surveys of individual sections of the reservoir, performed by us. The regime of water discharge through the dam of the Kamskaya HEPP was used as a model and made up of the characteristic discharge flow rates. The discharge flow rate of 3750 m3/s is the maximum allowed through hydraulic units during routine operation of the HEPP and 300 m3/s is the minimum sanitary pass established for the Kamskaya HEPP. Material processing was carried out in the ArcGIS v.10.4 software package. The data obtained in the form of Esri shapefiles (coasts, contours, depth points) were finally processed and converted into a digital elevation model in the form of TIN (Triangulated Irregular Network). Then, in the SMS v.11.1 software package in a special module “Map”, the obtained data were converted into the internal format of the program for further use in creating the model. Hydrological and meteorological data were obtained from official sources of the Federal State Budgetary Institution Perm TsGMS of Roshydromet and the Kama Hydroelectric Power Plant, a branch of PJSC RusHydro. Their processing was carried out using Microsoft Excel.
For the most complete and effective specification of the morphometry of the Kama river area, the upper pool of the Kama reservoir, an unstructured triangular grid was constructed in the computational region using the triangulation method, consisting of 975,157 elements with an average rib length of 30 m. In addition, the initial and boundary conditions were set on the computational region.
An initial water level of 108.5 m BS (Baltic Sea) was used as the initial condition for the entire Kama reservoir.

2.4. Initial Data for 2D Modeling

The following conditions were accepted as the hydrological regime of the Kama river and the operation of the Kamskaya Hydroelectric Power Plant:
-
The flow rate of water entering the Kama reservoir (Kama River—1675 m3/s, Chusovaya—226 m3/s and Sylva—159 m3/s) was considered constant at 2060 m3/s for 5 days. This is taken on the basis of the average annual summer inflow of water entering the Kama reservoir along its main tributaries, the Kama, Chusovaya and Sylva rivers;
-
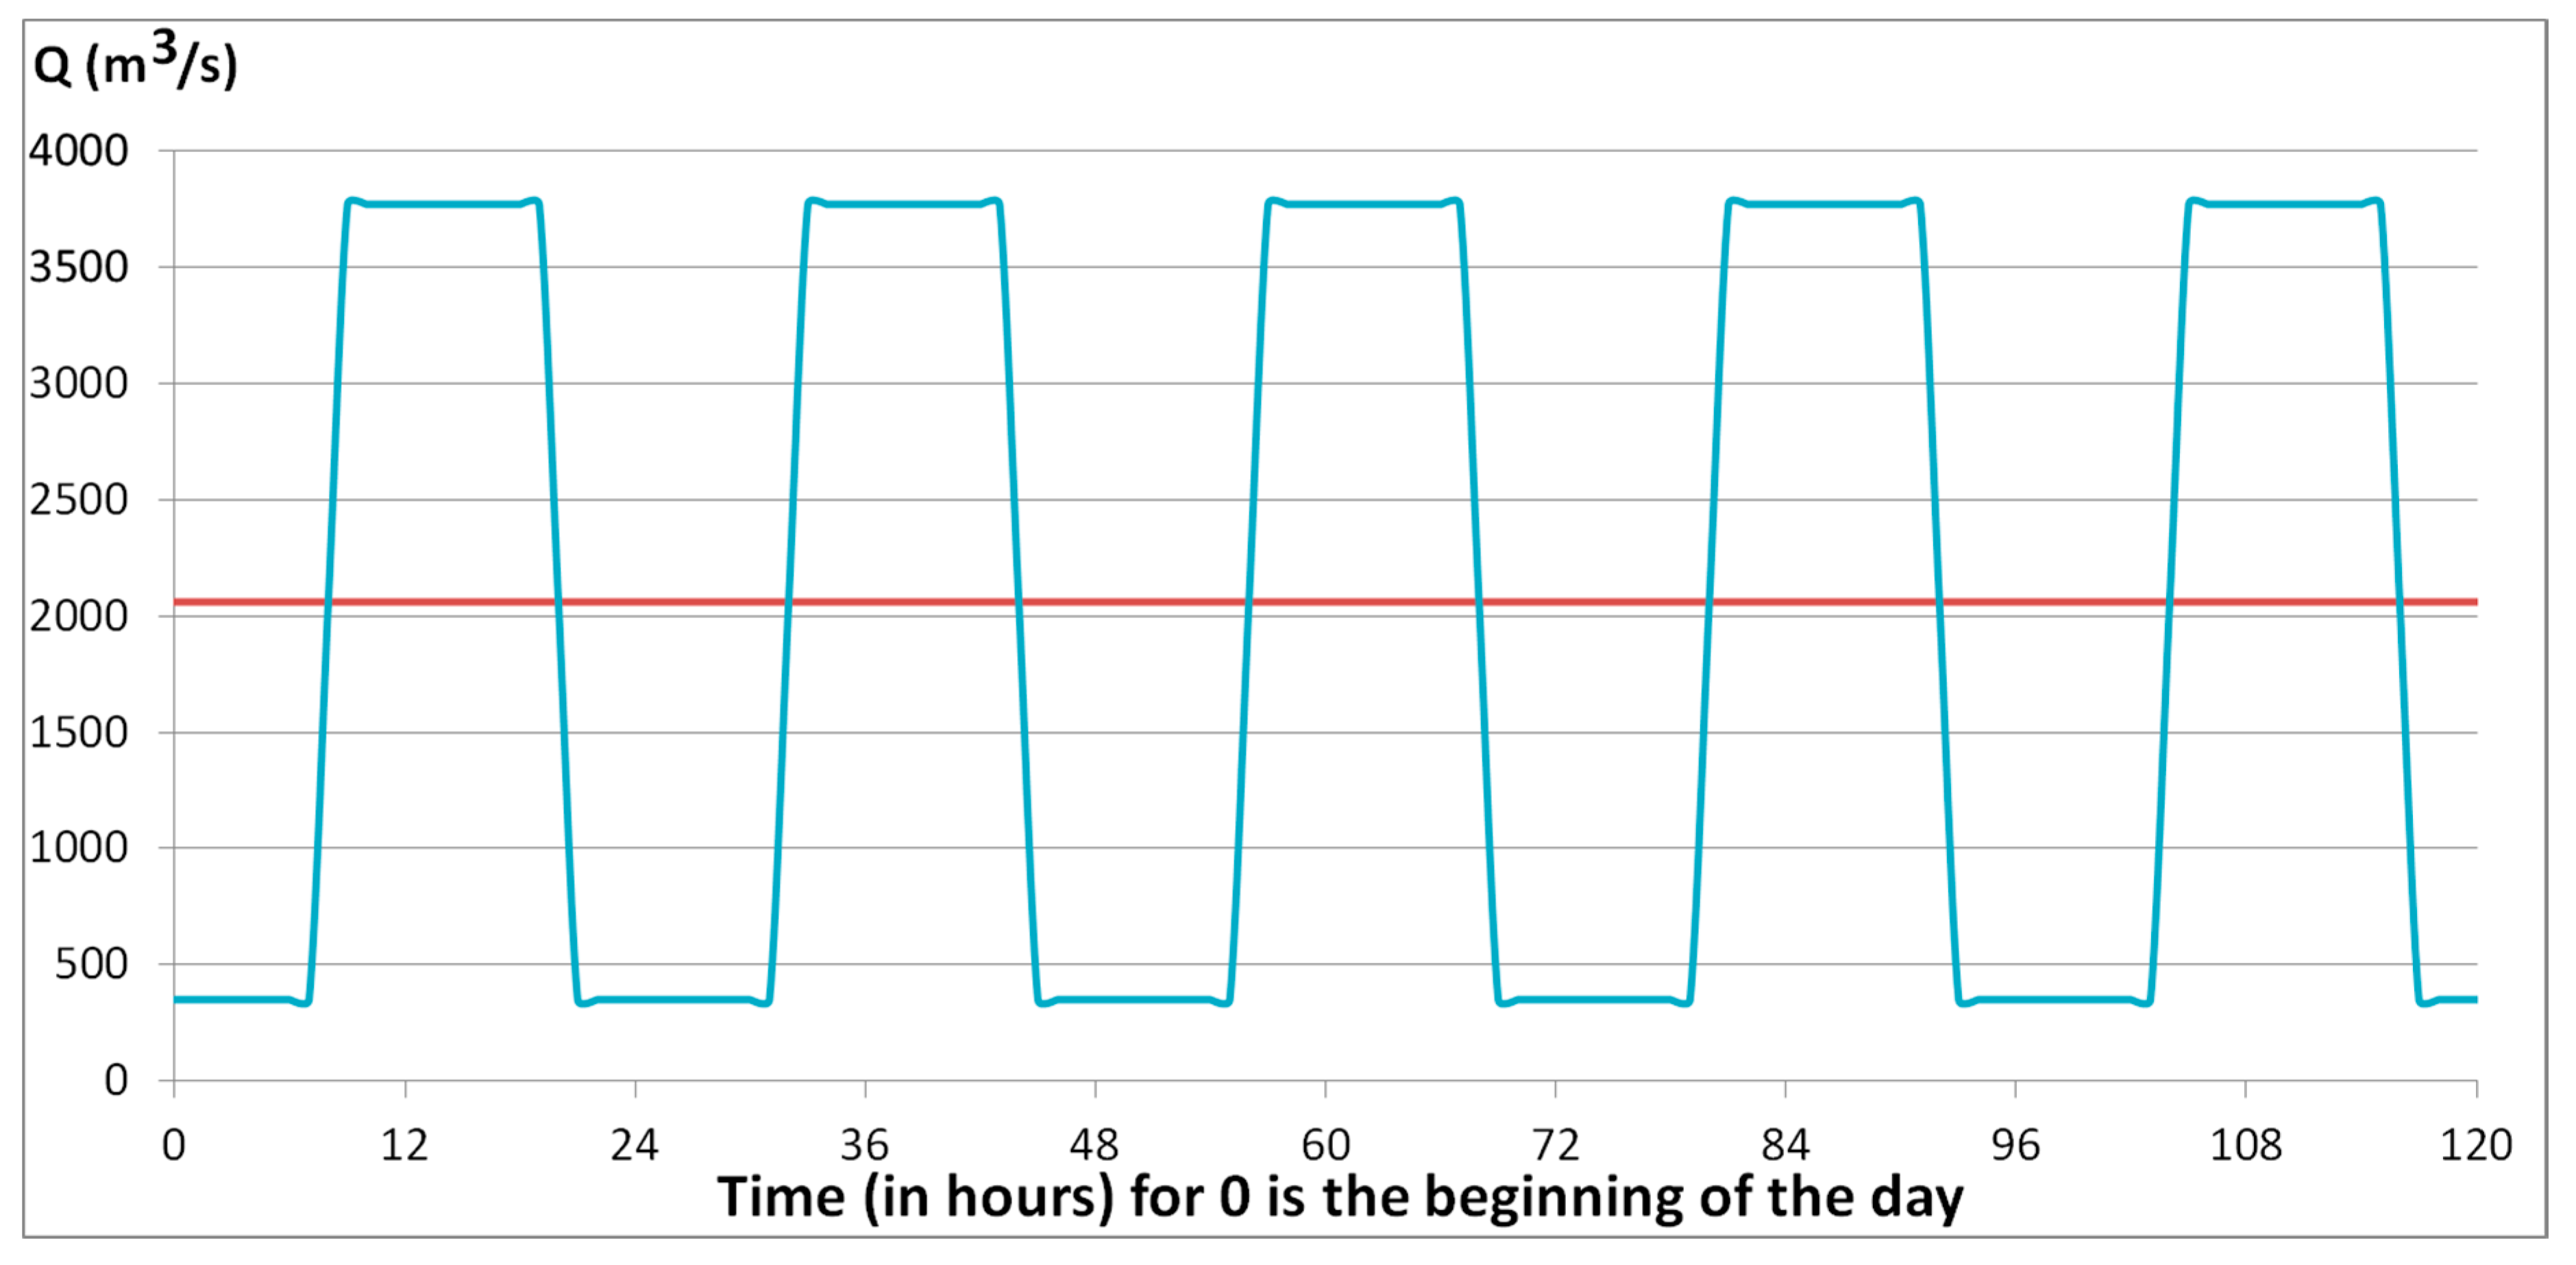
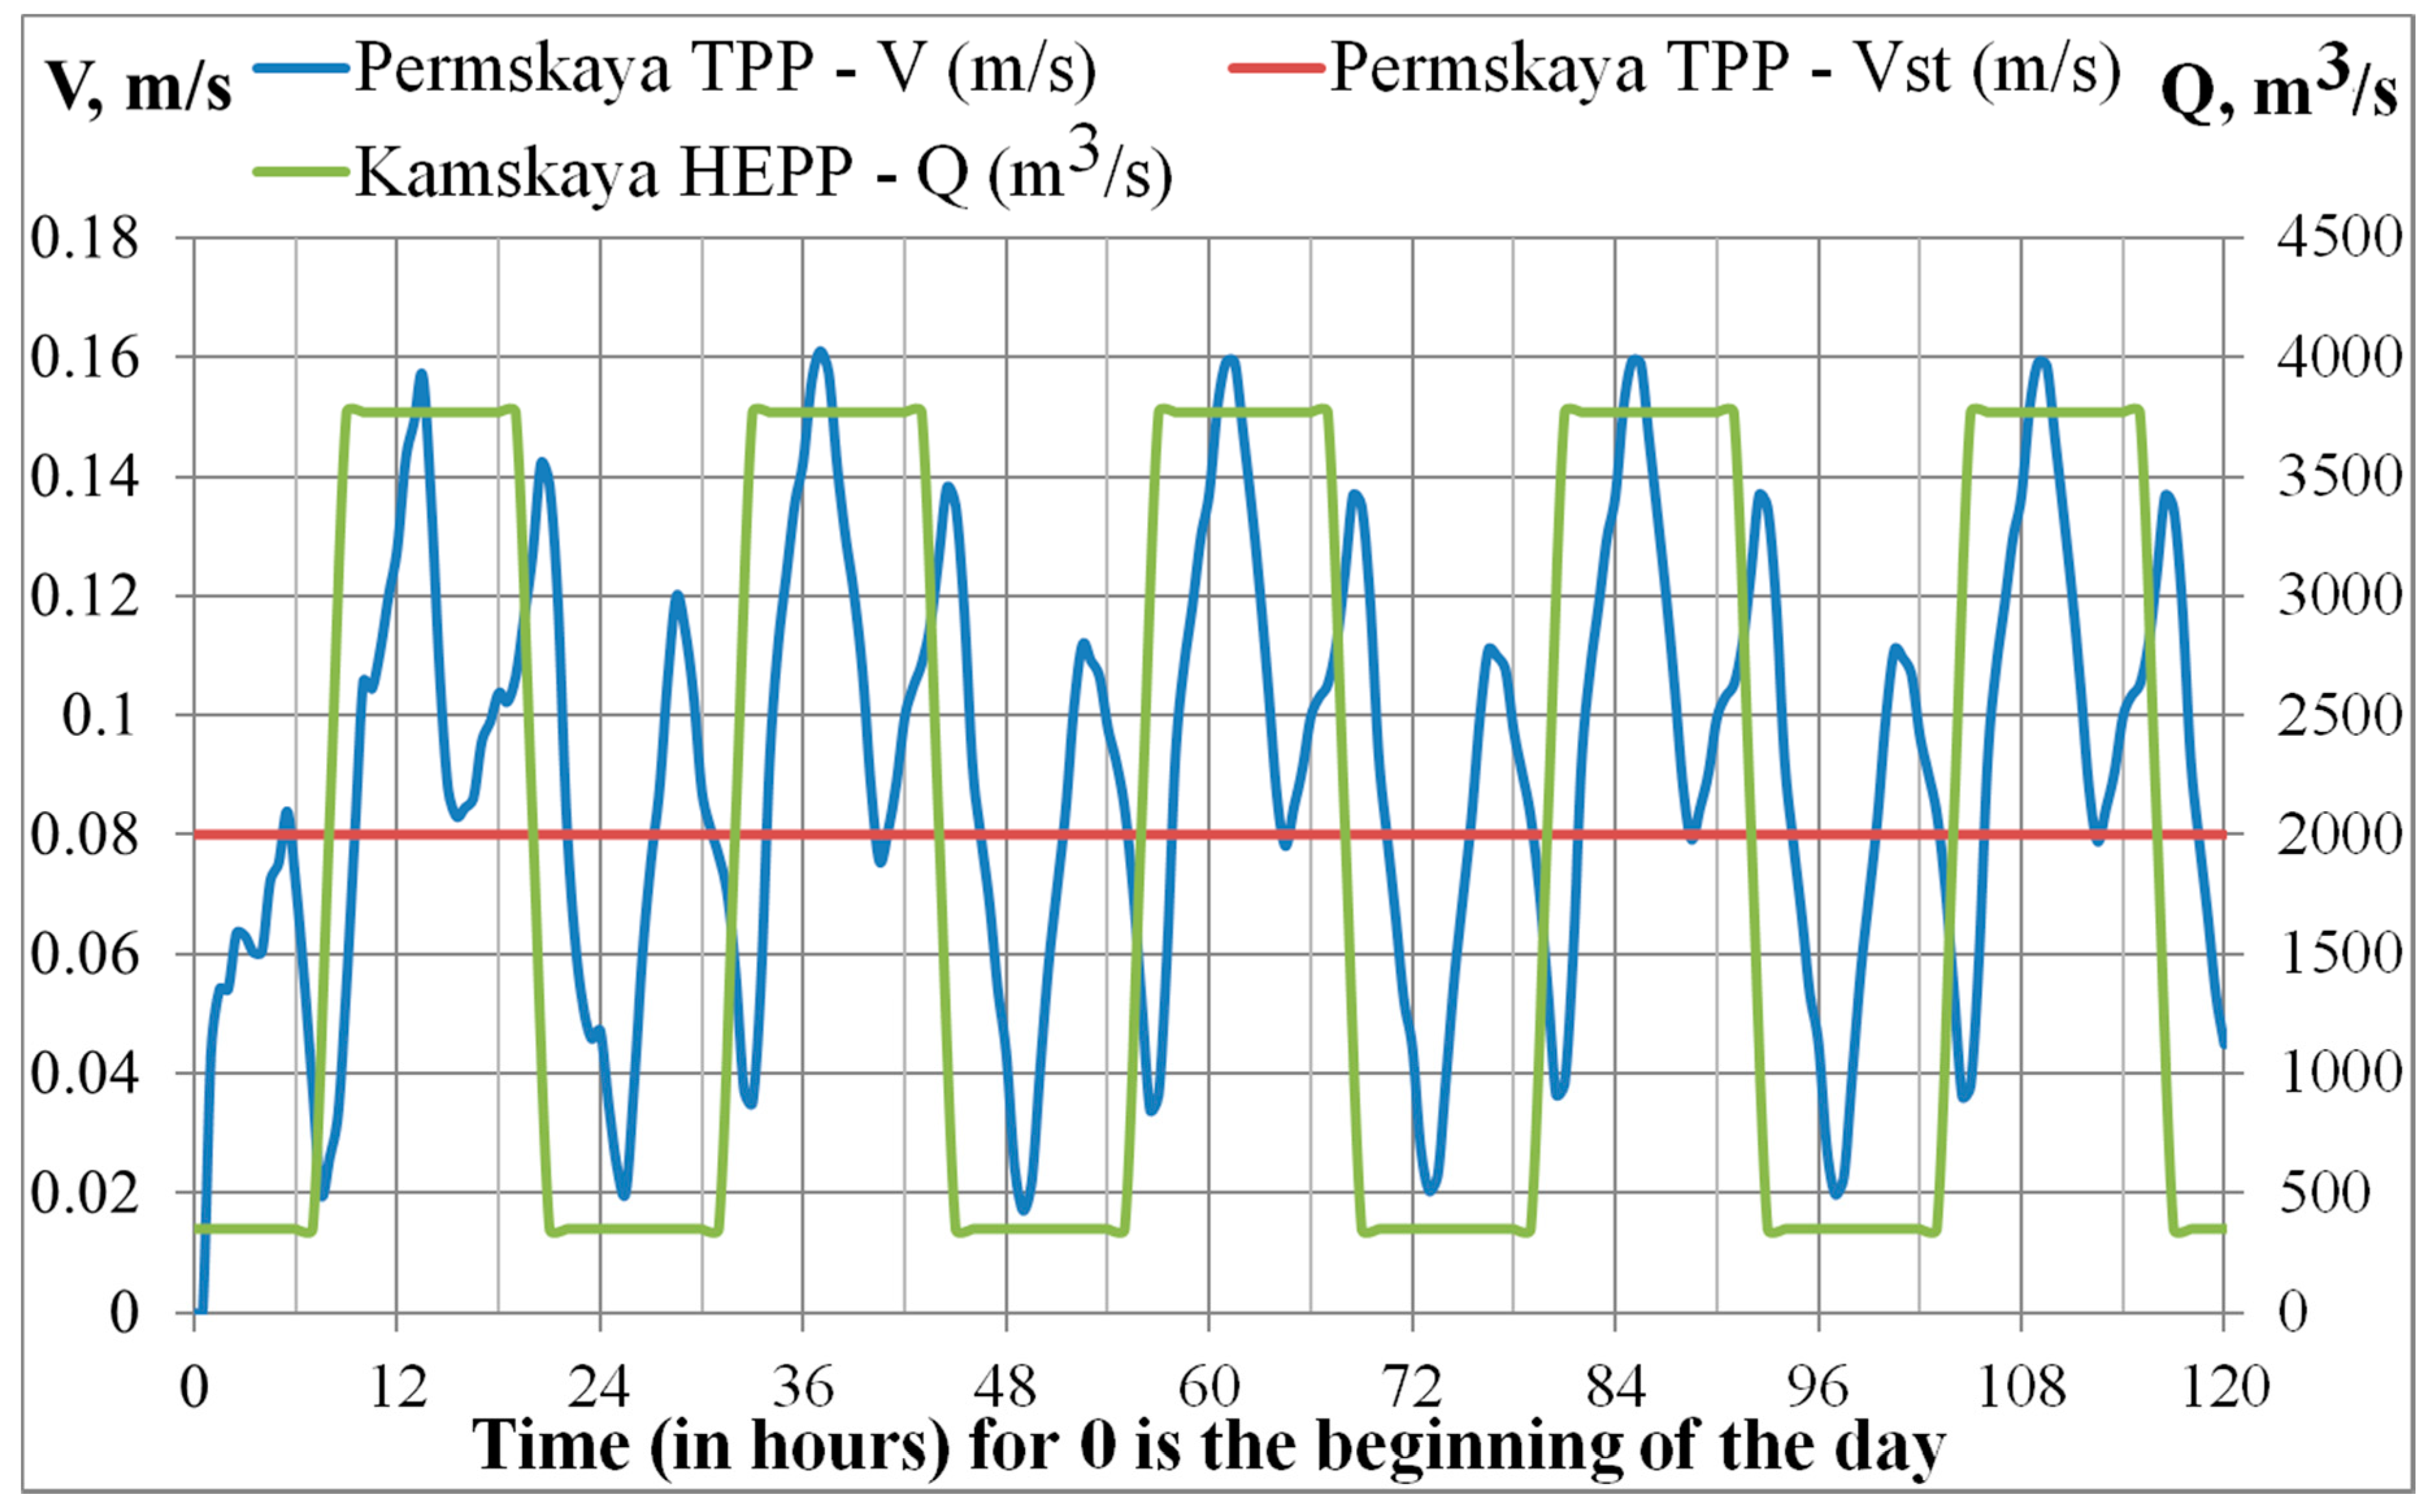
The discharge flow rate of water at the Kamskaya HEPP (Kama river) for 5 days was varied according to the following scheme: the initial discharge flow rate of 350 m3/s for 10 h, then after 2 h the discharge flow rate rose to 3770 m3/s, then within 10 h constant flow rate of 3770 m3/s, then decrease in 2 h of discharge flow rate to 350 m3/s, then again after 10 h rise to 3770 m3/s and so on within 5 days. A two-hour drop in water discharge flow rate occurred in the time interval from 7 to 9 p.m., and a rise in water discharge flow rate occurred in the time interval from 7 to 9 a.m. These flow rates were taken from the conditions of maximum and minimum load on the Kama hydroelectric station in summer conditions. The maximum and minimum peaks were taken as constants. In real conditions, the discharge flow rate of water during the day can vary quite strongly. The schedule of water discharge flow rates by tributaries of the Kama reservoir and water discharge from the Kamskaya HEPP is shown in Figure 2, the beginning of the day (0 a.m.) is taken as “0”;
-
The flow rates of water intake and discharge at the Permskaya TPP (the Kama River, city of Dobryanka) were considered constant and equal to 42.5 m3/s for 5 days. This value was obtained from the average long-term data of the Permskaya TPP in the summer period with the continuous operation of two power units.

2.5. Three-Dimensional Hydrodynamical Model

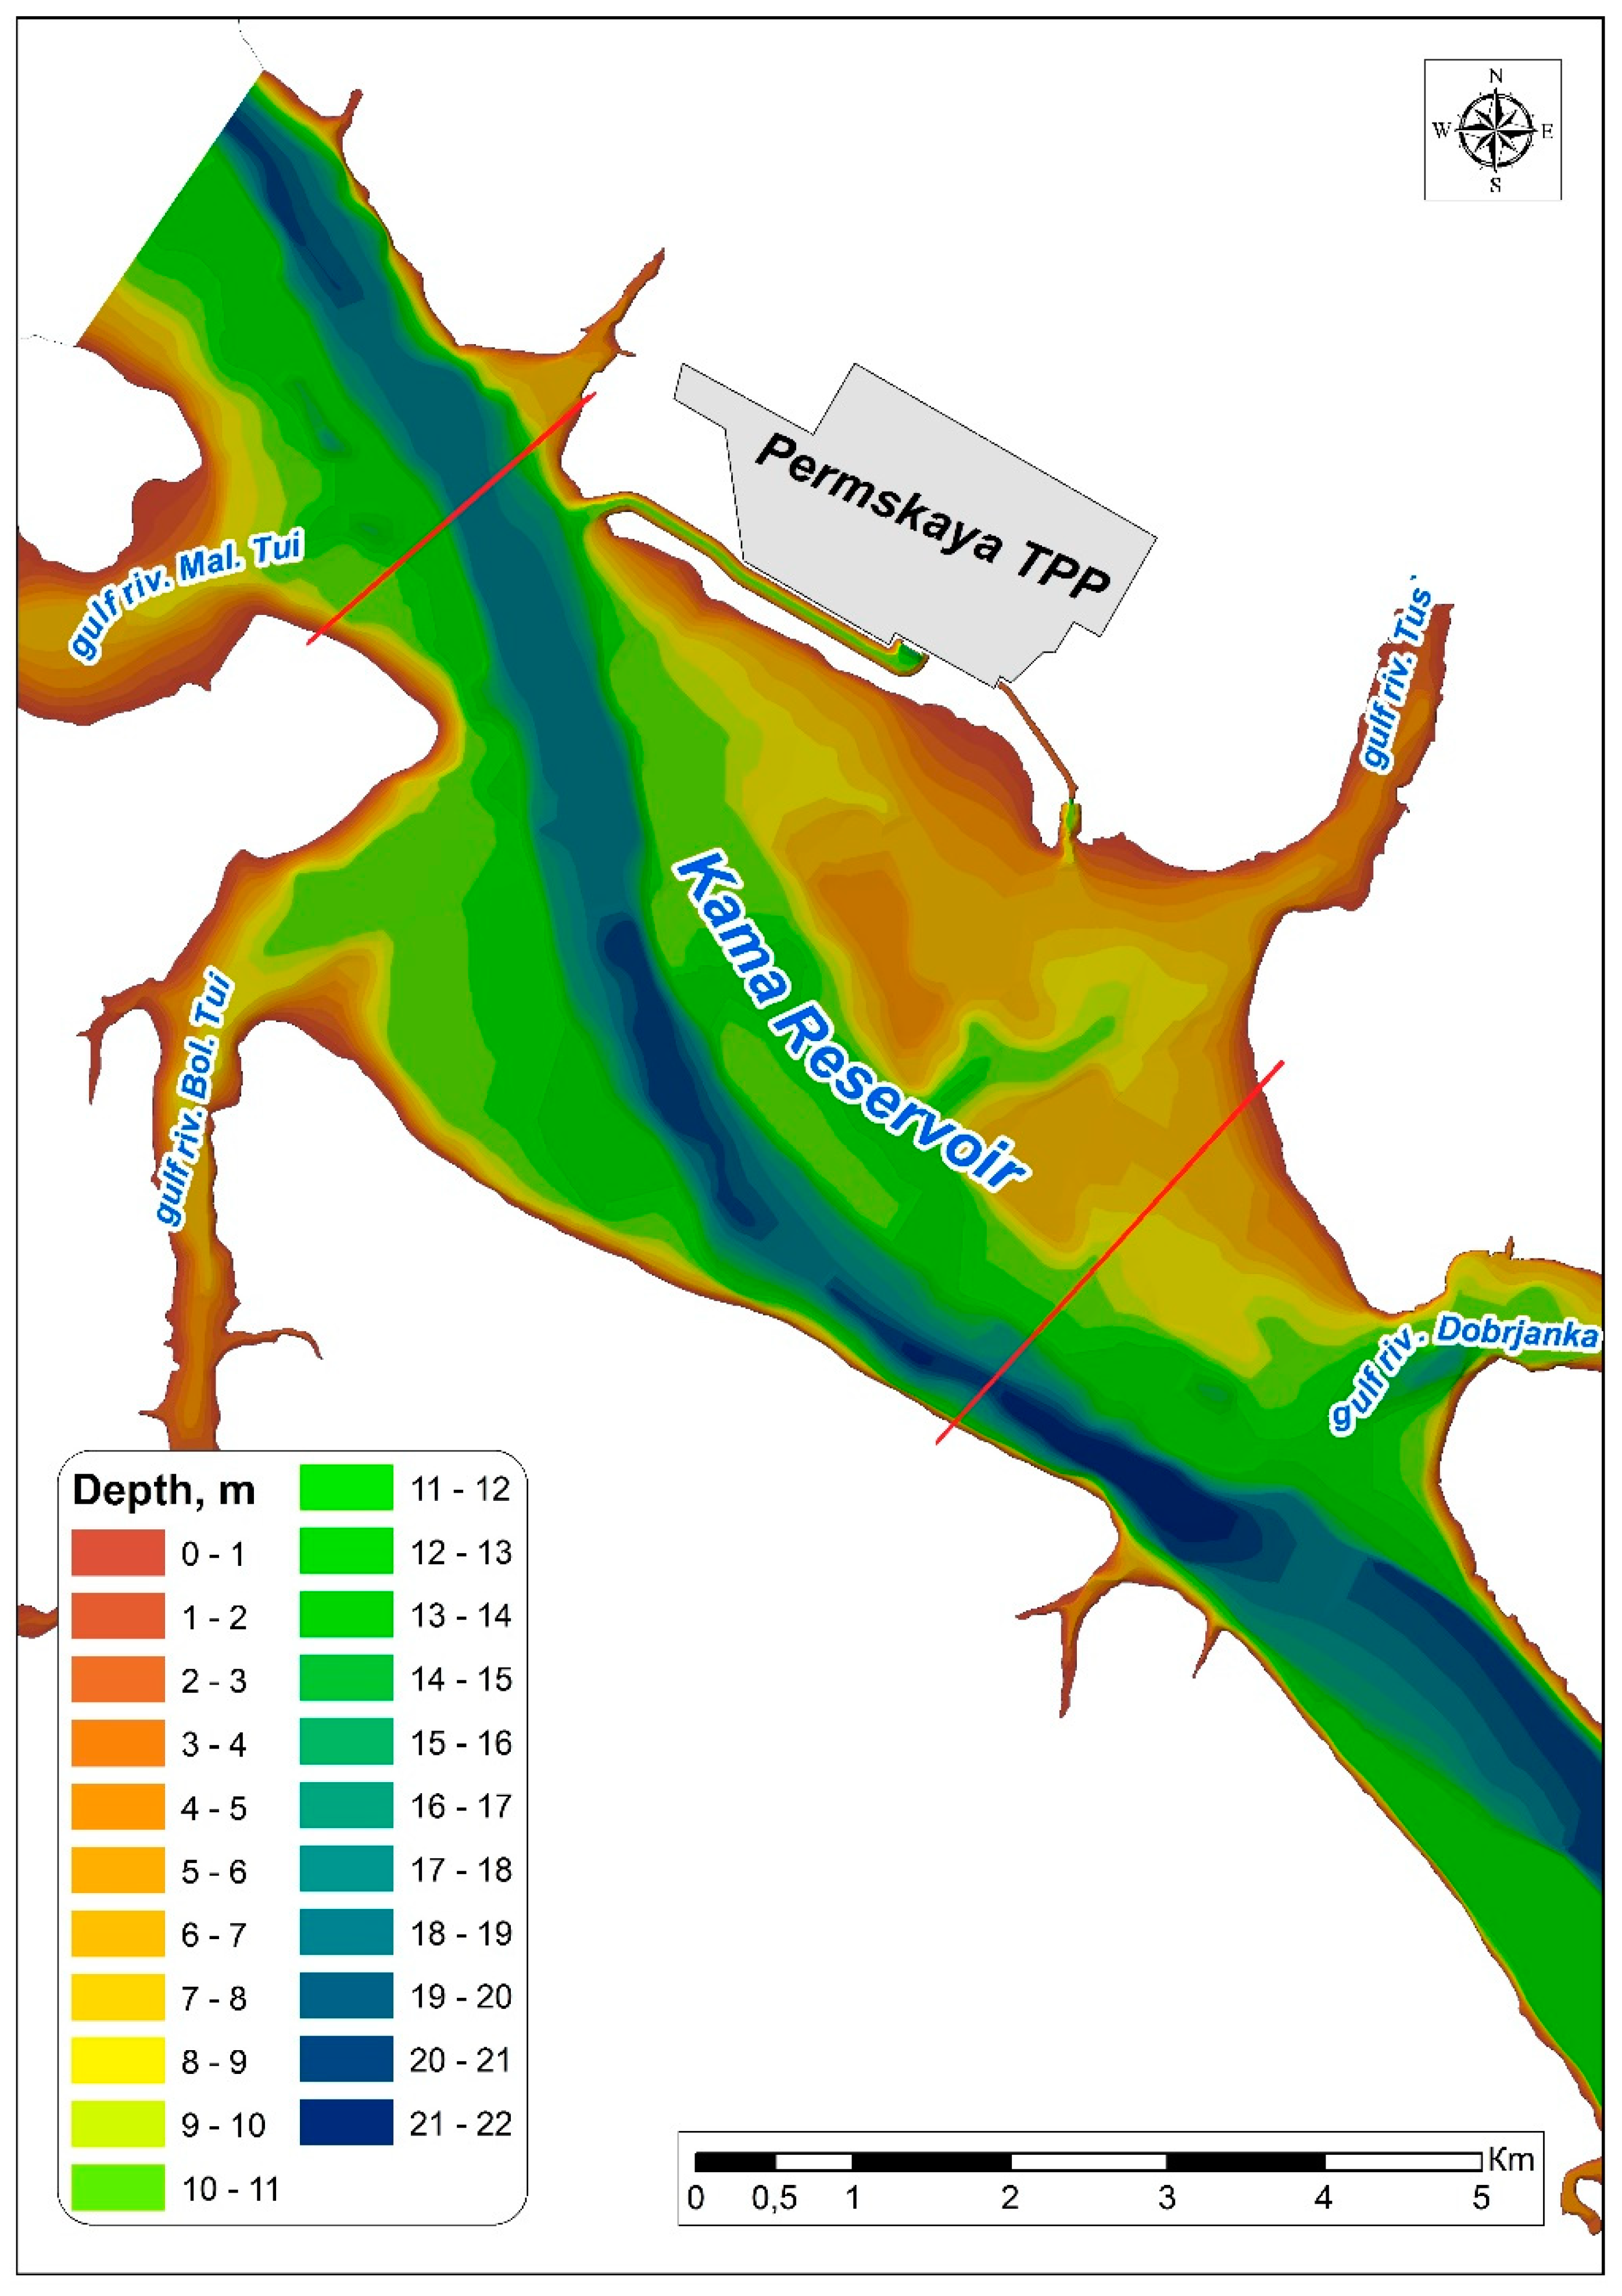
A three-dimensional numerical simulation of the dynamics of thermal pollution in the process of discharge of waste water from the Permskaya TPP, taking into account the variable backwater from the Kamskaya Hydroelectric Power Plant, was carried out for a section 11-km long. The calculation area included the inlet and outlet channels, which are the main components of the Permskaya TPP cooling system. The boundaries of the domain for which three-dimensional modeling was carried out are shown in Figure 3 by red lines.
The problem was solved in the framework of a non-stationary non-isothermal approach using the k-epsilon model to describe turbulent pulsations. As a comparative analysis showed, this turbulence model is optimal. To evaluate the efficiency of its application, test calculations were performed using a higher order model—the Reynolds stress model. It was found that the difference in the results is no more than 5%, and therefore the k-epsilon model was used for further calculations.

2.6. Model of Unsteady Flow in a Three-Dimensional Formulation, Basic Equations

The equations for the Reynolds averaged velocity u in tensor form were written as [31]:
ρ t + x i ( ρ u i ) = 0 , t ( ρ u i ) + x j ( ρ u i u j ) = p x i + x j [ μ ( u i x j + u j x i 2 3 δ i j u l x l ) ] + x j [ μ t ( u i x j + u j x i ) 2 3 ( ρ k + μ t u l x l ) δ i j ] ,
where ρ is the density, u i are the components of the velocity vector ( i = 1 ,   2 ,   3 ), μ is the kinematic viscosity. Turbulent viscosity μ t is a function of kinetic turbulent energy k and its dissipation rate ε : μ t = ρ C μ k 2 / ε , C μ is a constant.
The equations for turbulent kinetic energy and its dissipation rate were written as follows:
t ( ρ k ) + x i ( ρ k v i ) = x j [ ( μ + μ t σ k ) k x j ] + G k + G b ρ ε
t ( ρ ε ) + x i ( ρ ε v i ) = x j [ ( μ + μ t σ ε ) ε x j ] + C 1 ε ε k ( G k + C 3 ε G b ) C 2 ε ρ ε 2 k
where G k —the generation of turbulent kinetic energy due to the average velocity gradient, G b —the generation of turbulent kinetic energy due to buoyancy, C 1 ε ,   C 2 ε are constants, σ k and σ ε are the turbulent Prandtl numbers k and ε , respectively.
Stratification density effects in the field of gravity due to changes in water temperature were taken into account in the term G b , having the form:
G b = g i ( β μ t Pr t T x i )
where μ t is the turbulent viscosity, which is determined as follows: μ t = ρ C μ k 2 / ε where C μ is the constant.
Turbulent heat transfer was modeled using the Reynolds model, in a similar way to turbulent momentum transfer. The equation for energy was as follows:
t ( ρ E ) + x i [ u i ( ρ E + p ) ] = x j ( k e f f T x j + u i ( τ i j ) e f f )
where E = c h + p ρ is the total energy, h = C p T system enthalpy, k e f f is the effective thermal conductivity, and ( τ i j ) e f f is the stress tensor deviator, defined as
( τ i j ) e f f = μ e f f ( u j x i + u i x j ) 2 3 μ e f f u k x k δ i j
where μ e f f = k e f f Pr / C p is the effective viscosity, effective thermal conductivity is defined as κ e f f = κ + C p μ t / Pr t , κ is the thermal conductivity coefficient.
The applicability of the k ε turbulence model was evaluated in [25,26]. It was found that the difference in the obtained data is no more than 5%, and therefore, the k ε model was used for further research.
The dependence of density on temperature was described in the framework of the Boussinesq approximation. As initial conditions, uniform distributions of temperature and velocity in the entire liquid volume were set.
The values of the parameters of the problem Pr t , S c t , G 1 ε , C 2 ε , C μ , σ k , σ ε were taken as follows [31]: Pr t = 0.85 , S c t = 0.7 , C 1 ε = 1.44 , C 2 ε = 1.92 , C μ = 0.09 , σ k = 1.0 , σ ε = 1.3 . The kinematic viscosity was taken as equal to μ = 9.34 × 10 7 m 2 / s , the coefficient of molecular diffusion D = 1.0 × 10 9 m 2 / s .
To discretize the equations in space, a second-order accuracy scheme was used. The description of the dynamics of processes in time was carried out according to an explicit second-order scheme.

2.7. Boundary Conditions for 3D Modeling

At the boundaries of the computational domain, the following boundary conditions were imposed:
-
at the bottom of the river and on its banks, the no-slip conditions and constant temperature were set u 1 = u 2 = u 3 = 0 ,   T = T 0 ;
-
at the input of the computational domain, the time-variable velocity of the main flow, determined in two-dimensional modeling was set the temperature was set as equal to the background temperature of the river u i = V i ( t ) ,     T = T 0 ;
-
in places of water intake and discharge, a constant water velocity and a constant temperature were set: at the inlet of the working channel u i = V 1 ,     T = T 0 and at the outlet of the working channel u i = V 2 ,     T = T 2 ;
-
the upper boundary of the fluid was considered free, the wind effect was taken into account—shear stresses were set in accordance with the formula τ = ρ a i r C W 2 presented in [32], where ρ a i r is the air density, C is the dimensionless coefficient of wind stress and W is the wind velocity at a distance of 10 m from the water surface. According to [32], for wind velocities from the range 1 m/s < W < 15 m/s, the dimensionless parameter has the form C = 0.0005   W 0.5 . The calculations were made for wind velocity W = 8 m/s, so the value C = 1.11 × 10 3 was used. For the temperature on the surface of the water, a linear law of heat transfer was set; taking into account the heating of the surface from the surrounding air, the heat transfer coefficient was selected on the basis of field measurements.

2.8. Construction of a Three-Dimensional Hydrodynamic Model of a Section of the Kama Reservoir

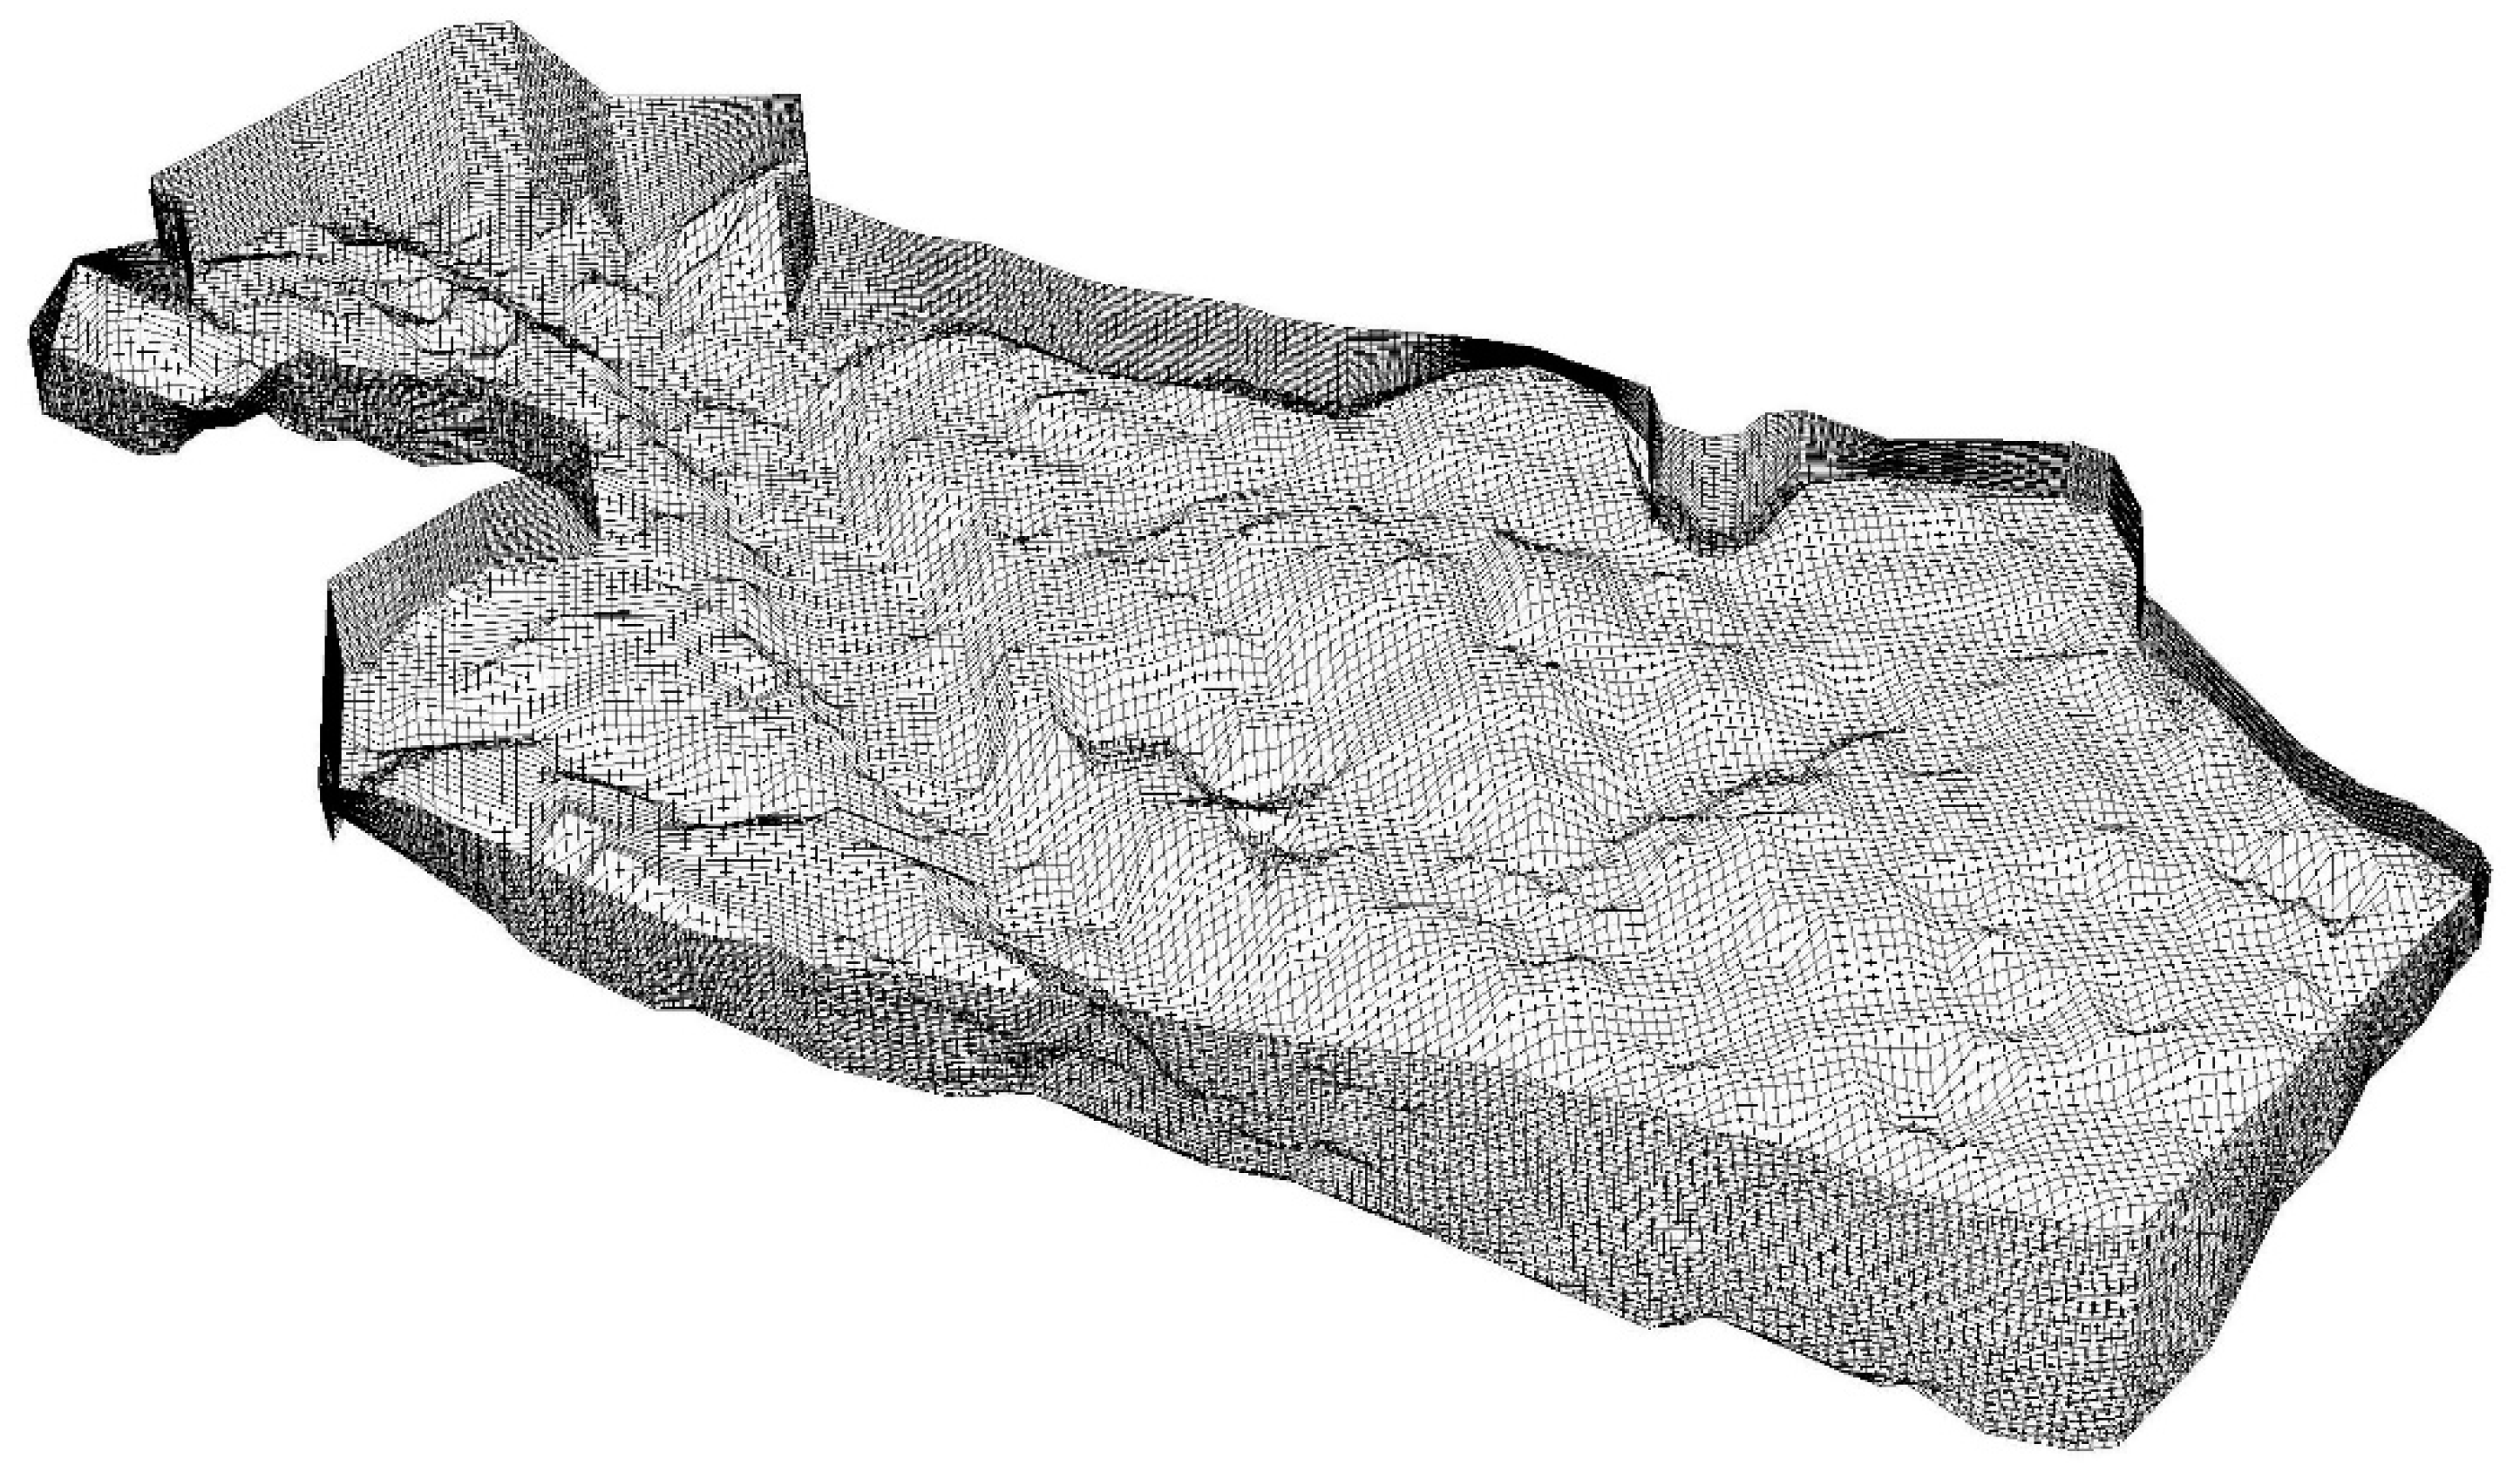
The calculations were performed using the ANSYS Fluent computational fluid dynamics package. The computational grid was built, taking into account the morphology of the bottom of the considered area. The number of grid nodes in the vertical direction was 21, located non-uniformly and taking into account the non-uniformity of the river bottom. In horizontal directions, the grid consisted of quadrangular cells uniformly distributed over the entire domain, with a characteristic linear size of 20 m. The total dimension of the grid was about four hundred thousand nodes. A volumetric image of the constructed mesh is shown in Figure 4, where the vertical size for sufficient visualization is increased forty times.
To solve the problem of the adaptation of existing morphological data in the “coordinate- depth” format to the capabilities of the grid builder, the procedure was used to “divide” the bottom morphology into simple geometric objects with some specified resolution. A code was written that allows us, using an array of data describing the morphology of the bottom of a water body, to output a command file for a task for a mesh generator, which is part of the ANSYS Fluent computational package. The created code has a general character and is applicable to the construction of similar geometries in other problems.
The methodology for obtaining an acceptable numerical solution with a change in the time step was preliminarily worked out, a solution was obtained starting from a step of 0.001 s and, upon reaching the convergence of the solution with an error of 0.001, the time step increased gradually, reaching a value of 10 s. The total calculation time for each variant was five days.

3. Results

3.1. The Results of Two-Dimensional Numerical Simulation

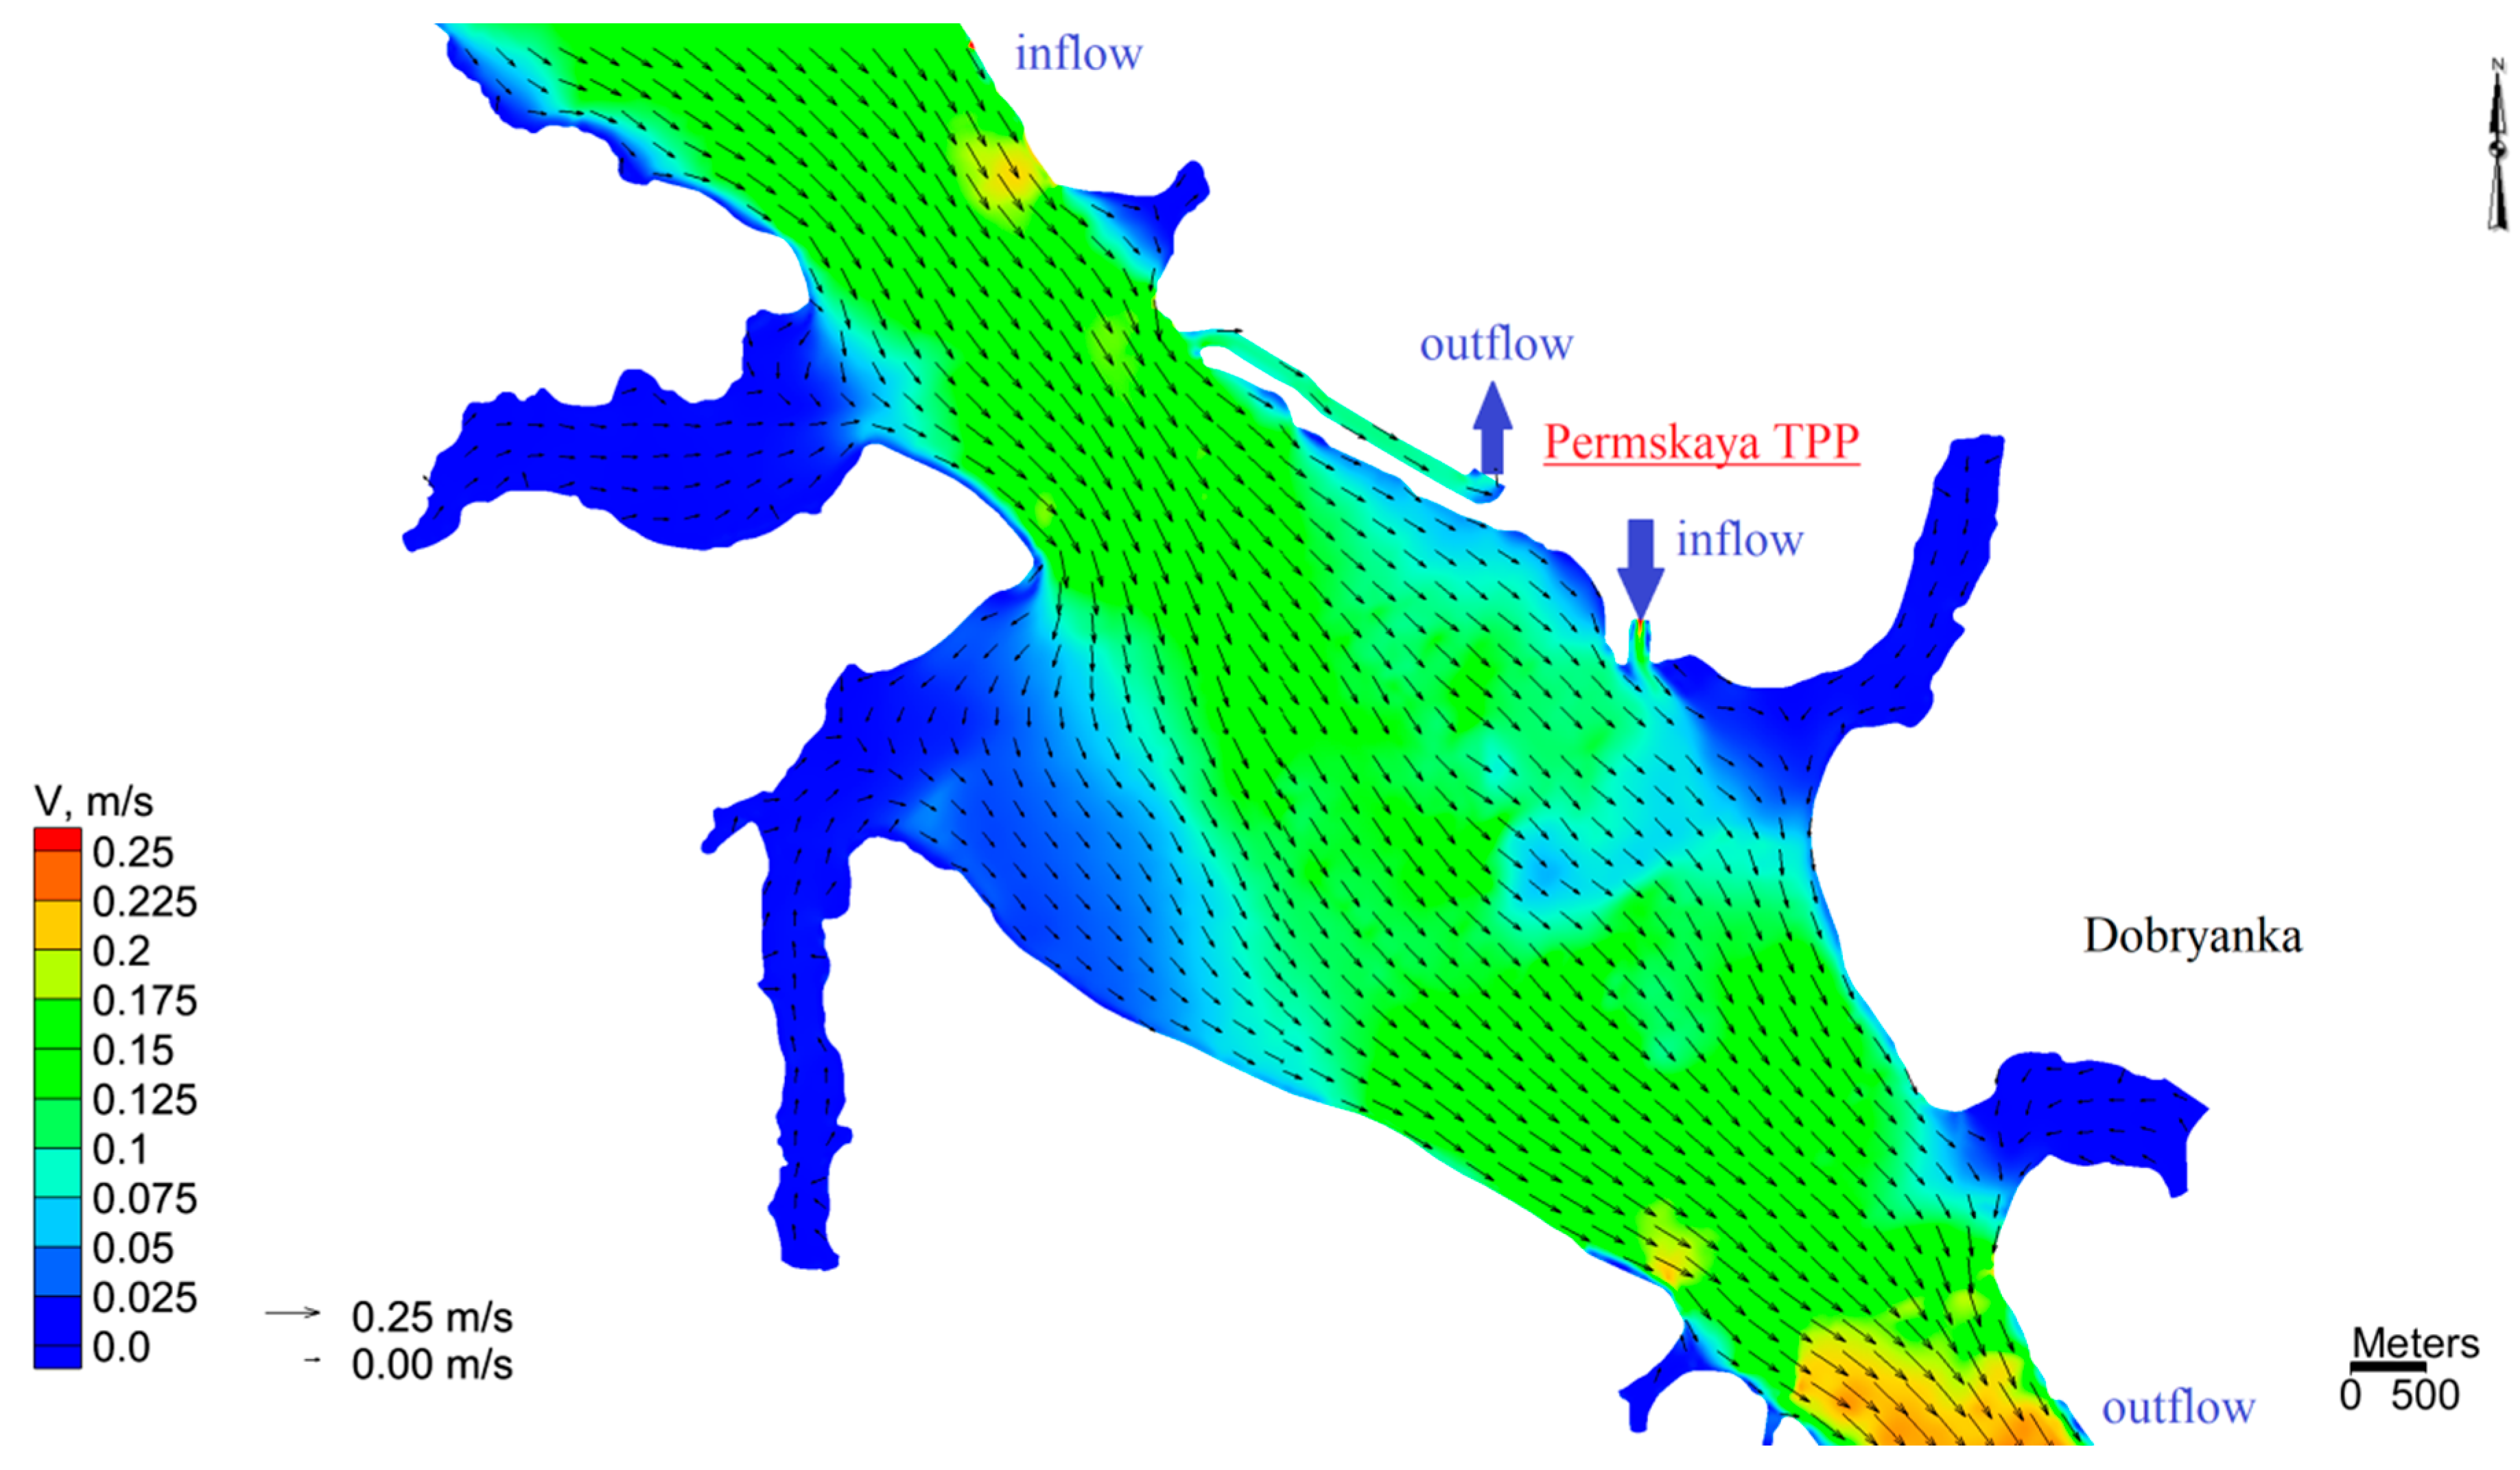
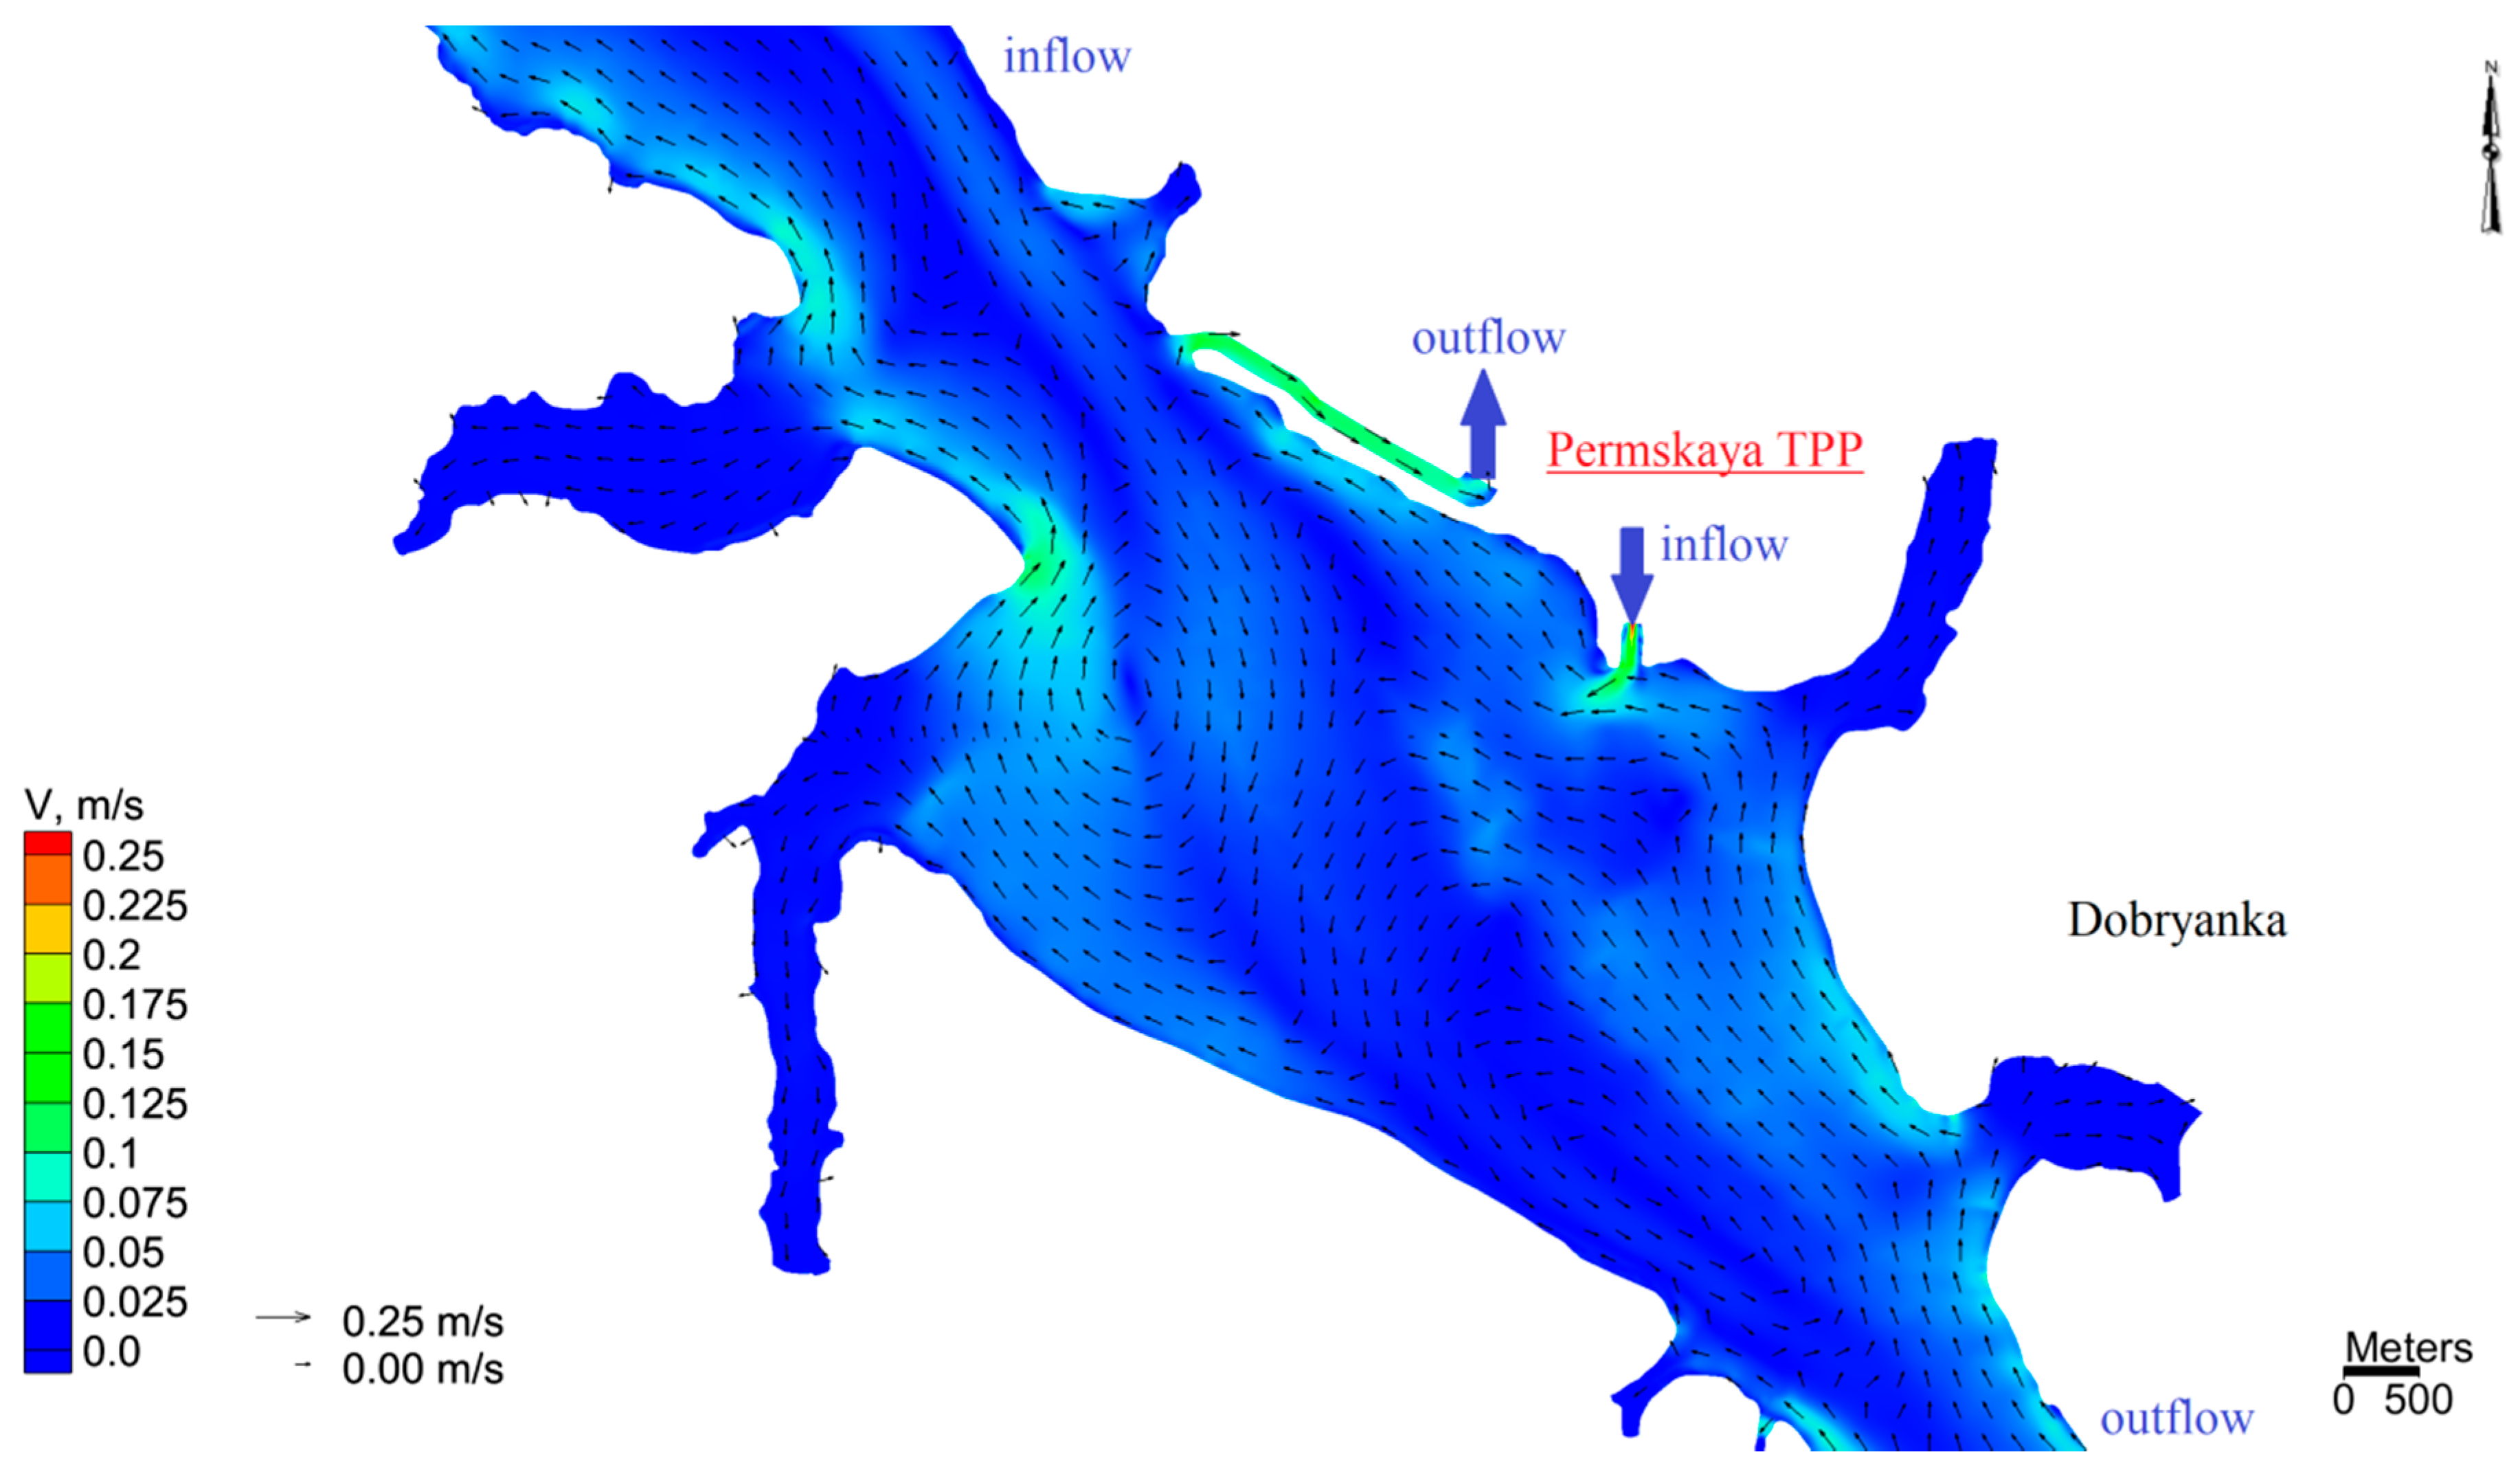
The results of two-dimensional calculations are presented in Figure 5, Figure 6, Figure 7 and Figure 8. Figure 5 and Figure 6 show velocity vector fields in the area of Dobryanka town at time 4 days and 1 h from the start of calculations, which corresponds to 1 h at night, and at 4 days and 13 h from the beginning of calculations, which corresponds to 1 o’clock in the afternoon. As one can see, in the upper pool of the Kamskaya HEPP, changes in the magnitude and direction of the flow velocity are observed, a backward wave is formed, which affects the Kama river even near Dobryanka town (Permskaya TPP).
From a comparison of Figure 5 and Figure 6, due to the nonuniform discharge of water through the dam of the Kamskaya hydroelectric power plant, a drastic change in the velocity field is observed in the region of the Permskaya Thermal Power Plant. The flow fields shown in Figure 5 are typical for continuous discharge through dam, the presence of a steady flow from the upper part of the reservoir to the lower near-dam part. With sharp changes in water discharge at the Kamskaya hydroelectric power plant, back flows are observed (Figure 6), which reach up to Dobryanka town, to the water intake channel of the Permskaya TPP.
It is interesting to analyze the change in the velocity module in the area of the water intake channel of the Permskaya TPP (Figure 7 (blue line)), in comparison with the change in the discharge flow rate of water through the Kamskaya Hydroelectric Power Plant (green line), and especially in comparison with the velocity module at a constant discharge of water through the Kamskaya HEPP (red line). As follows from Figure 7, three maximums and three minimums are observed during the day. This is due to the fact that the velocity modulus shows both the forward and backward flow of water at the measurement site; therefore, over a wave period of 24 h, we see three periods of oscillations of the velocity modulus and observe the forward (Figure 5) and backward (Figure 6) flows.
Sharp changes in discharge flow rate through the dam of the Kamskaya HEPP, as follows from Figure 5, Figure 6 and Figure 7, can generate significant back flows in the area of the Permskaya TPP. It is evident that these back flows can have a significant impact on the distribution of temperature fields associated with the discharge of thermal waters from the Permskaya TPP.

3.2. Results of 3D Numerical Modeling

In our work [25], a three-dimensional numerical simulation of the propagation of the heat spot from the Permskaya TPP was performed for various meteorological conditions and various technological parameters of the TPP at a constant flow rate of water discharge at the Kamskaya Hydroelectric Power Plant over the entire computation time. In the present work, we performed three-dimensional numerical simulation of the propagation of heat spot from the Permskaya TPP at time-periodical discharge flow rate at the Kamskaya HEPP in conditions of summer low water.
Two variants of wind direction similar to those considered in [25] and additional third variant of calm conditions were studied. For the first variant, the wind is directed opposite to the river flow, the second variant corresponds to the wind in the direction of the river flow and the calm conditions correspond to the absence of wind. The value of the wind velocity modulus at a distance of 10 m from the water surface in the first two variants was 8 m/s. The discharge flow rate of heated wastewater was considered equal to 63.0 m3/s, the temperature of the discharge water was 32.4 °C, and the temperature of the water of the reservoir receiver was 21.8 °C. The calculation time was five days. Based on the simulation results, an assessment was made of the zone of influence of heated water masses on the reservoir at a change in the hydrological regime of the river.
The average monthly values of air temperature according to observations at a meteorological station in Dobryanka are presented in Table 1.
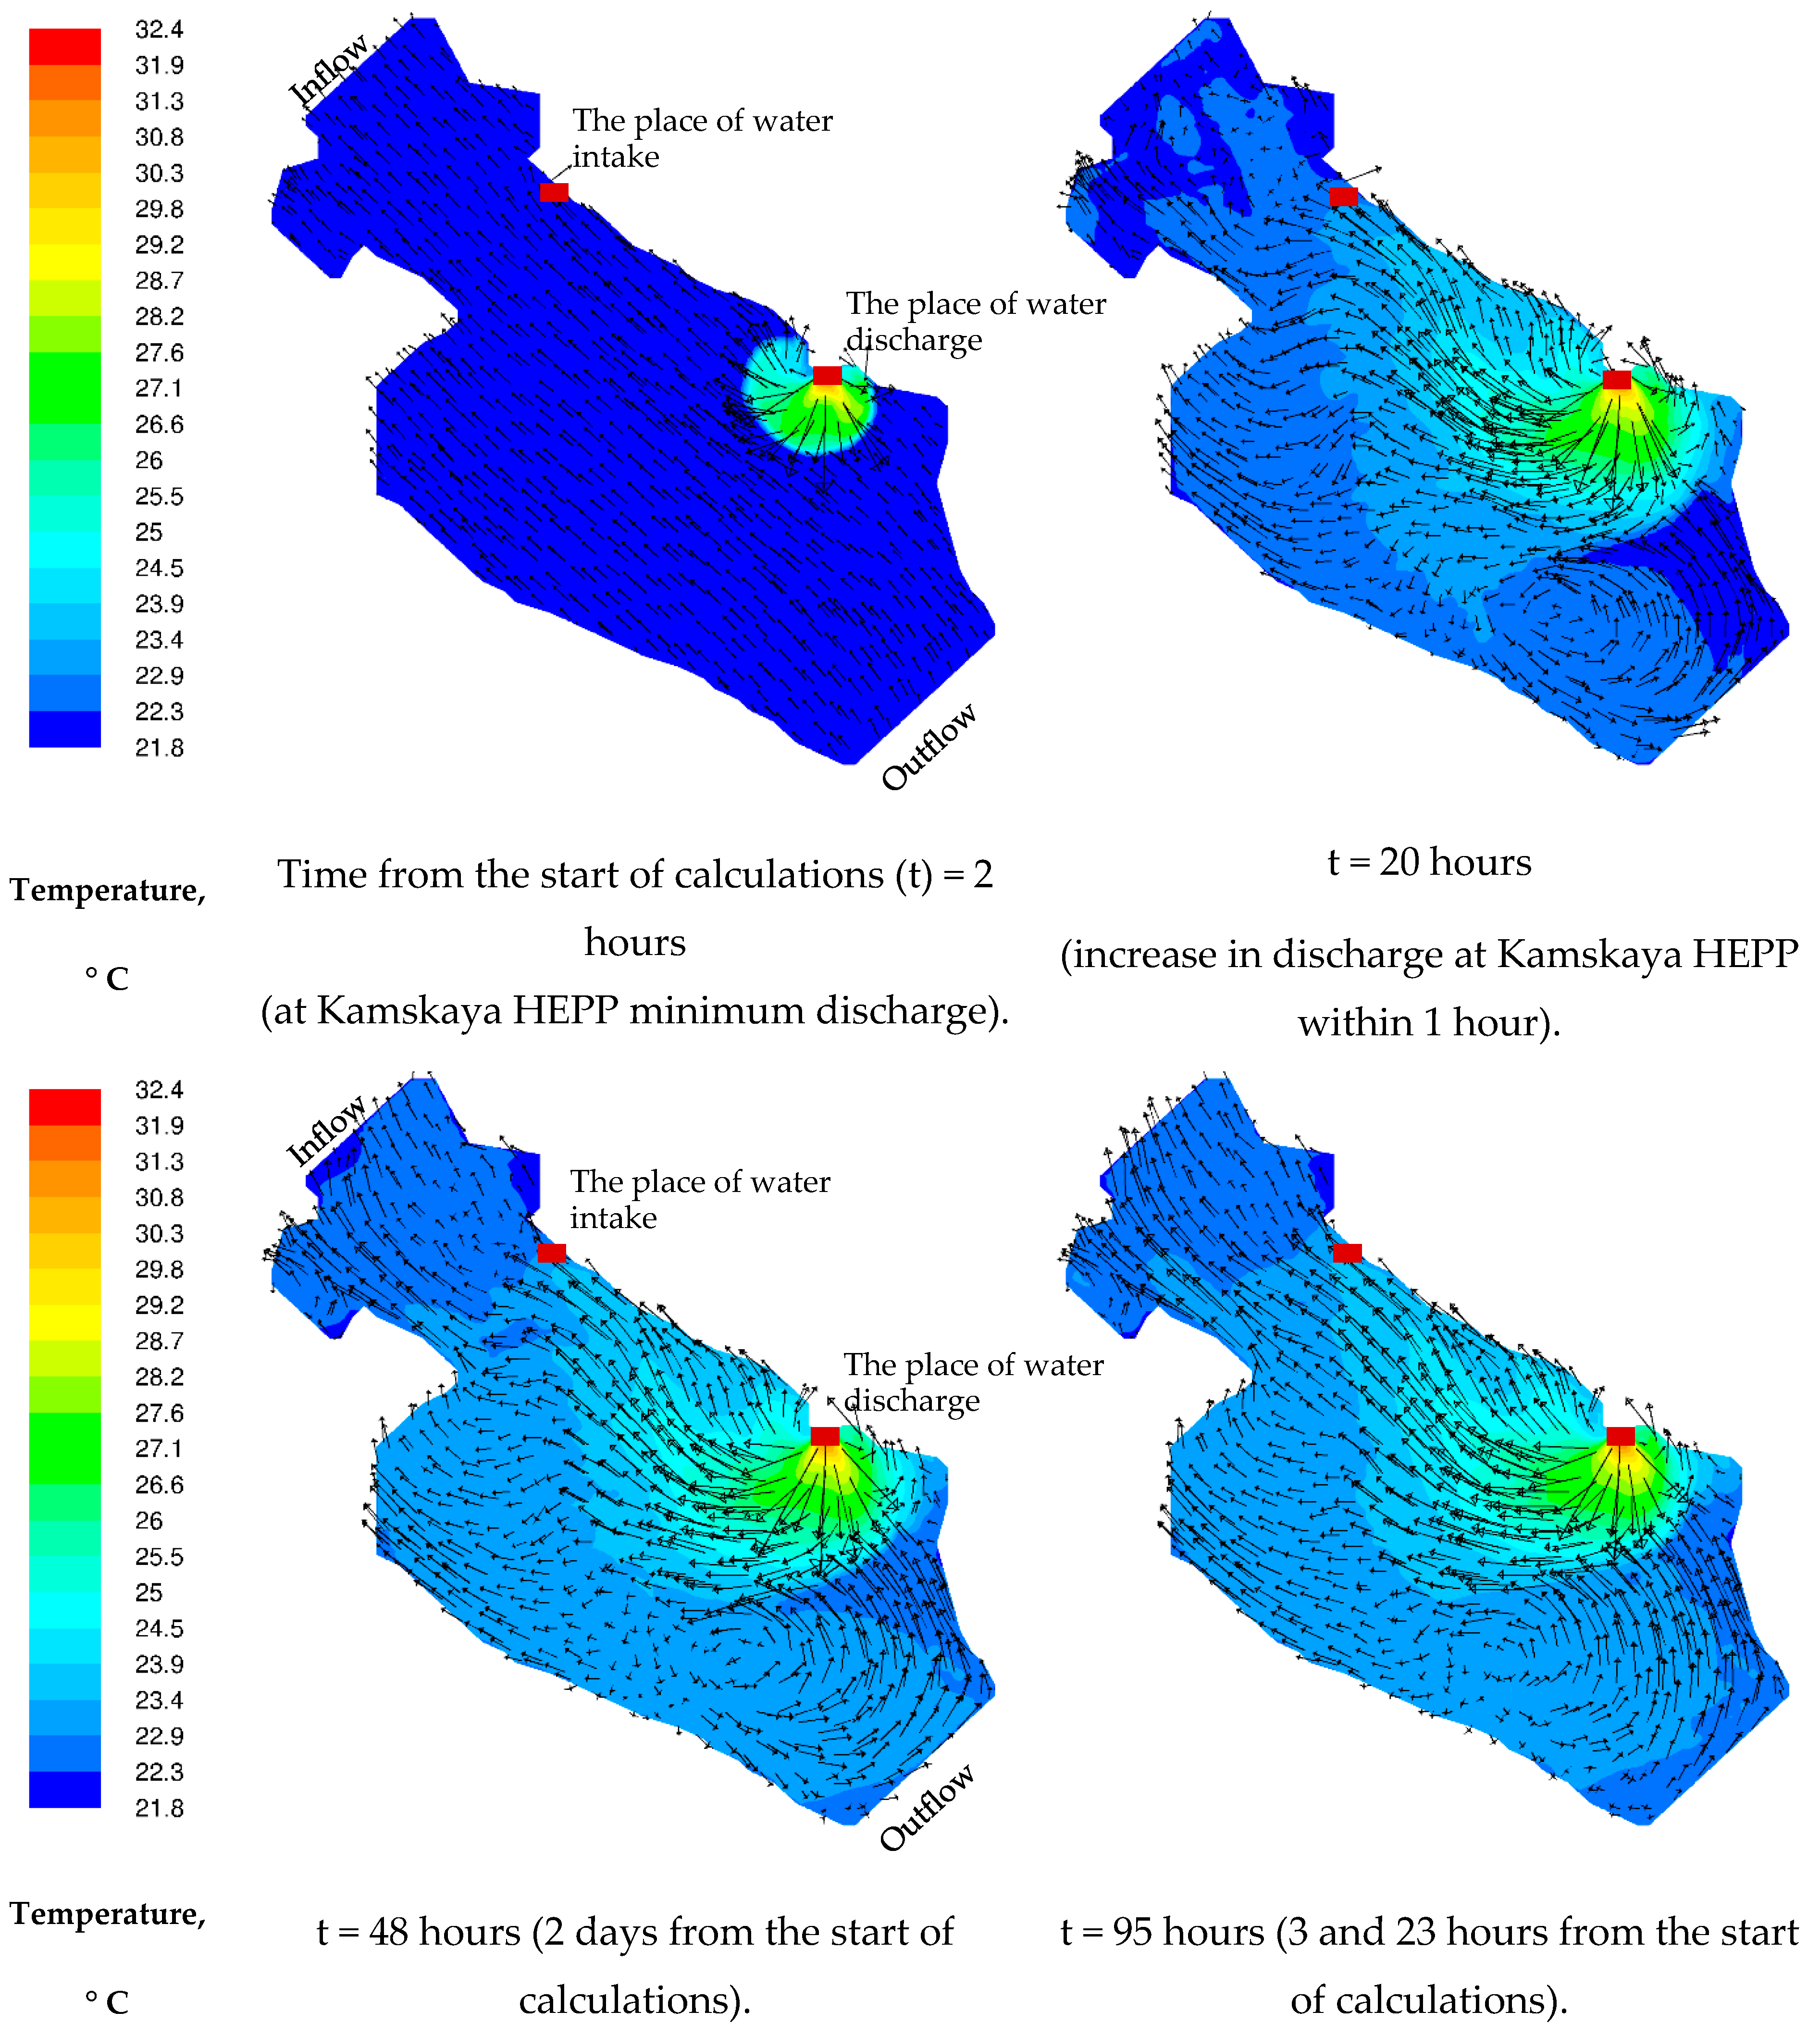
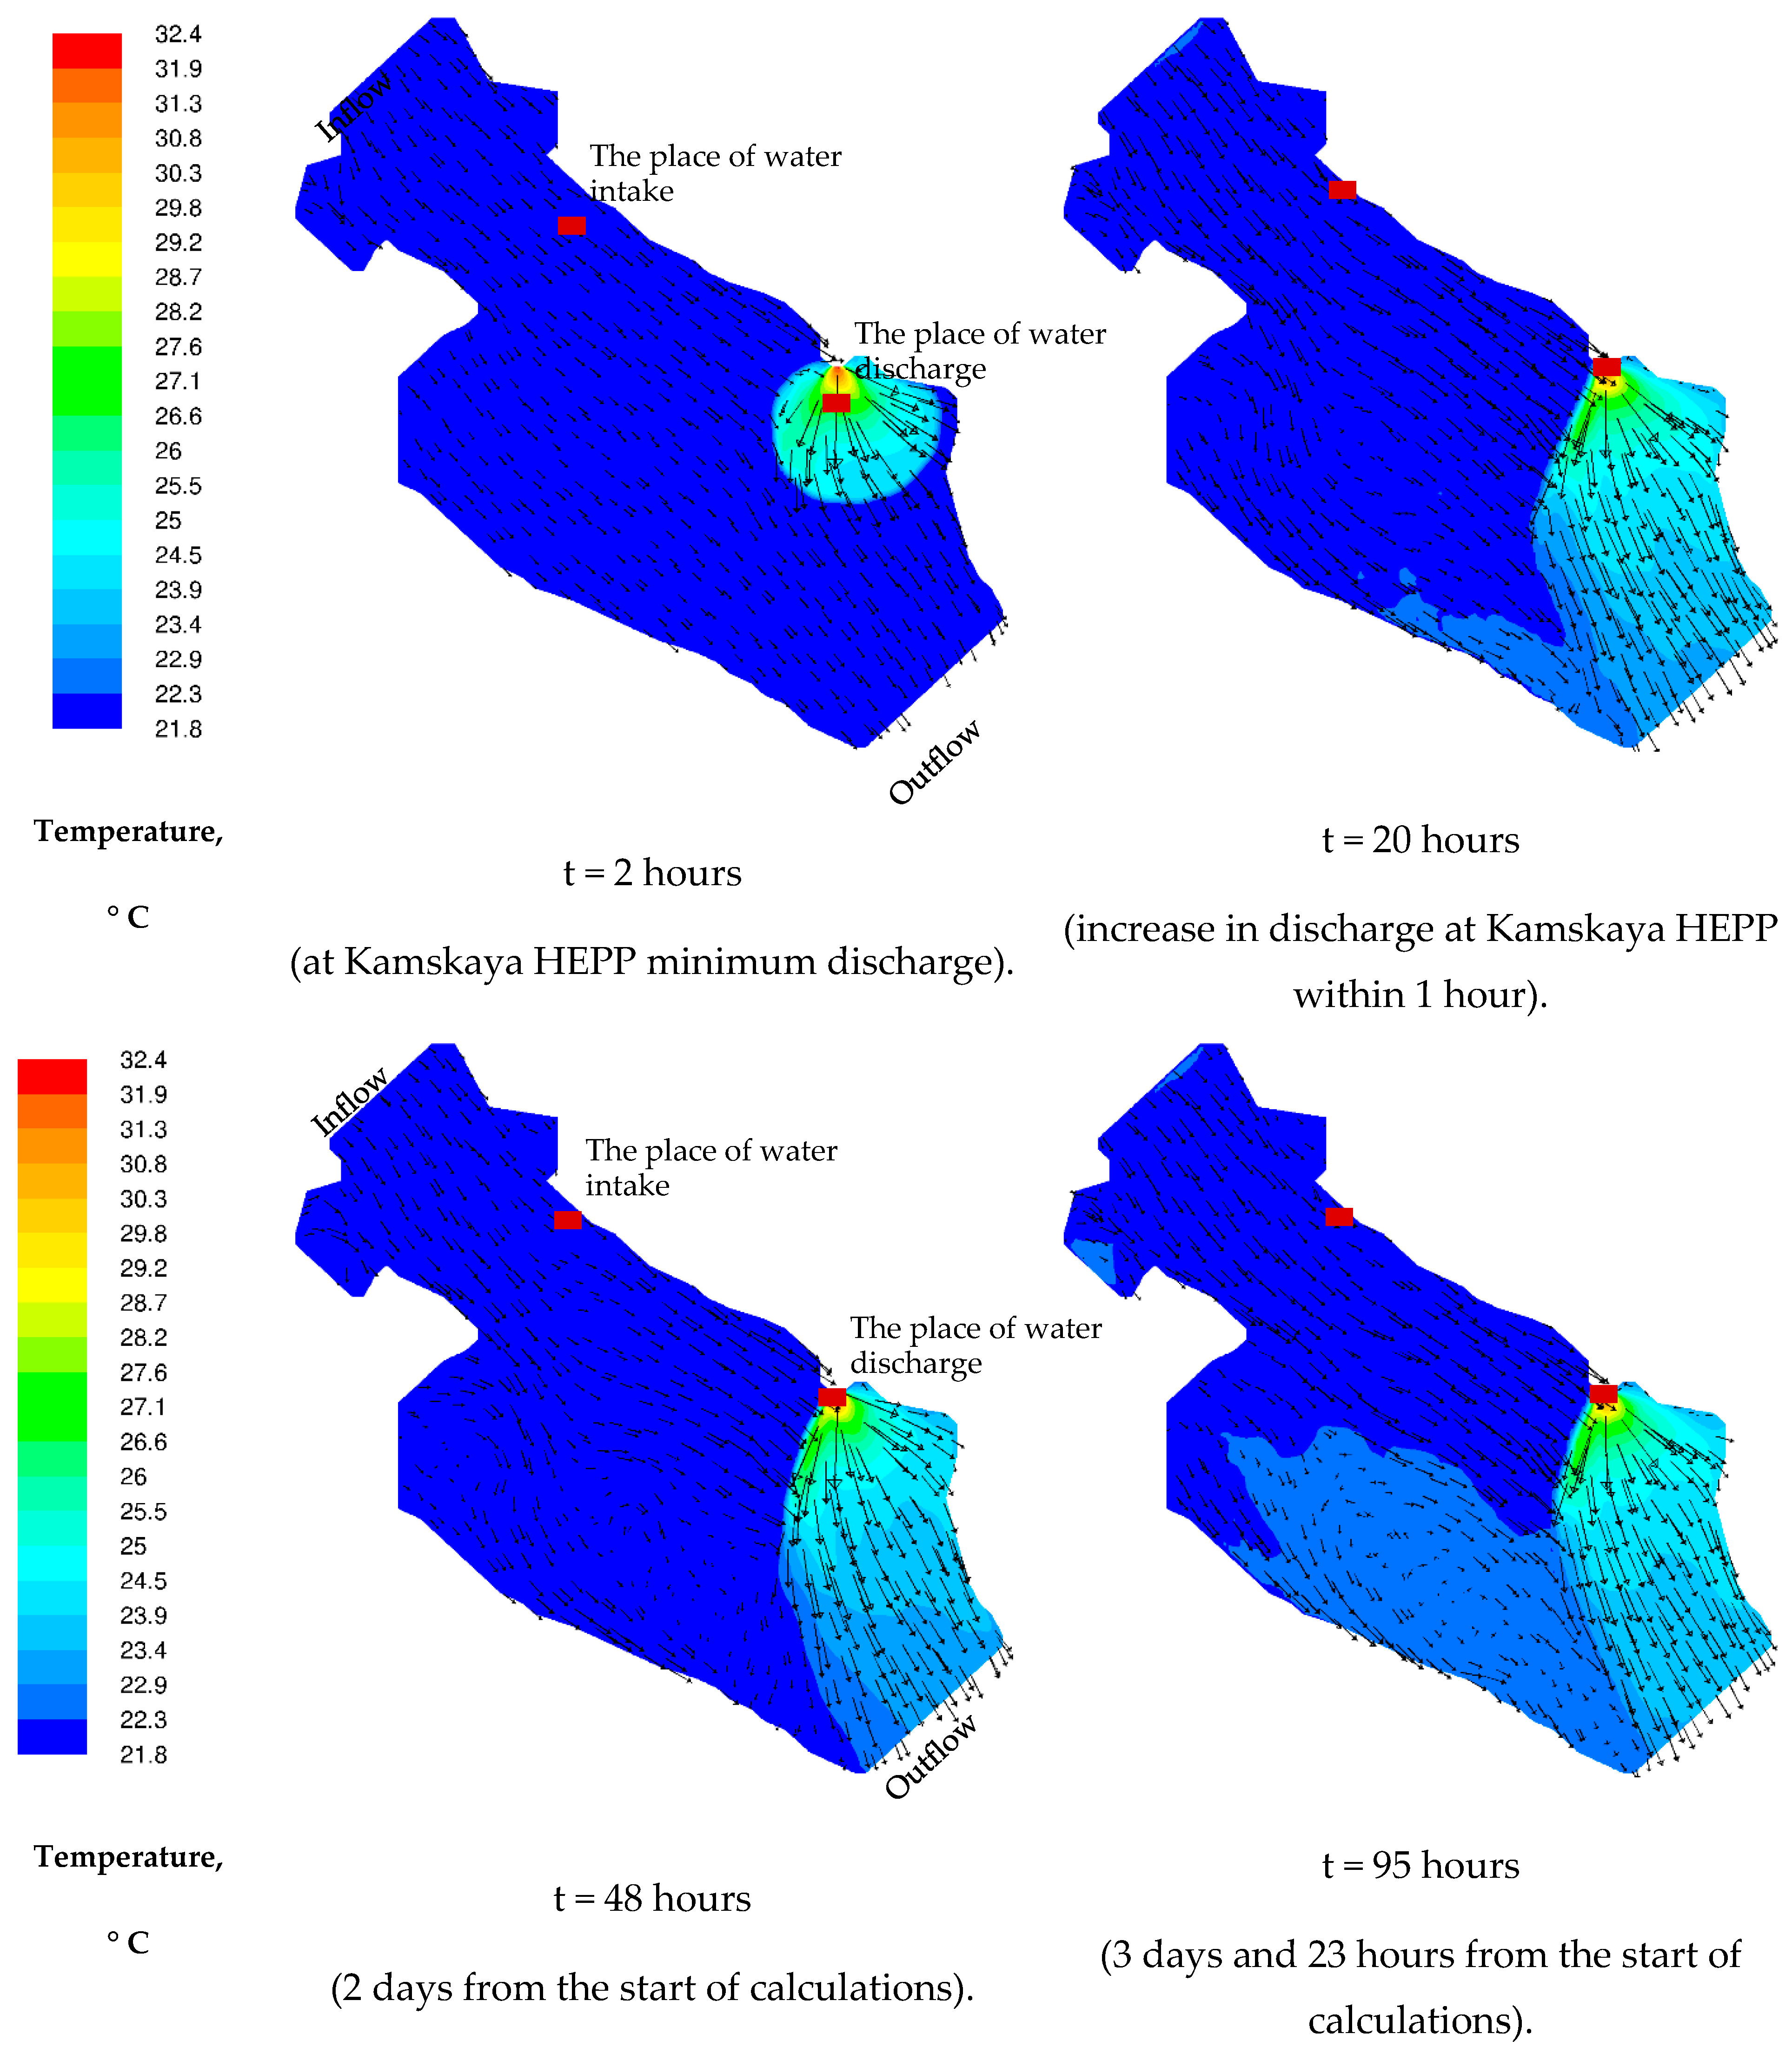
The calculation results for the first variant (southeasterly wind directed against the river flow; the wind velocity is 8 m/s) are presented in Figure 8, which shows the temperature field and the velocity vector field in the surface layer at different time moments. Calculations showed that under the indicated conditions, throughout the entire calculation time (5 days), the warm plume of wastewater moves near the riverbank from the discharge channel to the intake channel and does not change its direction. The wind duration of one direction (over 3 days) was chosen based on the inertia of the hydrodynamic processes under consideration. When the wind lasts for a shorter period, the hydrodynamics of the considered section of the reservoir do not have time to completely rebuild or adapt to a given direction of the wind.
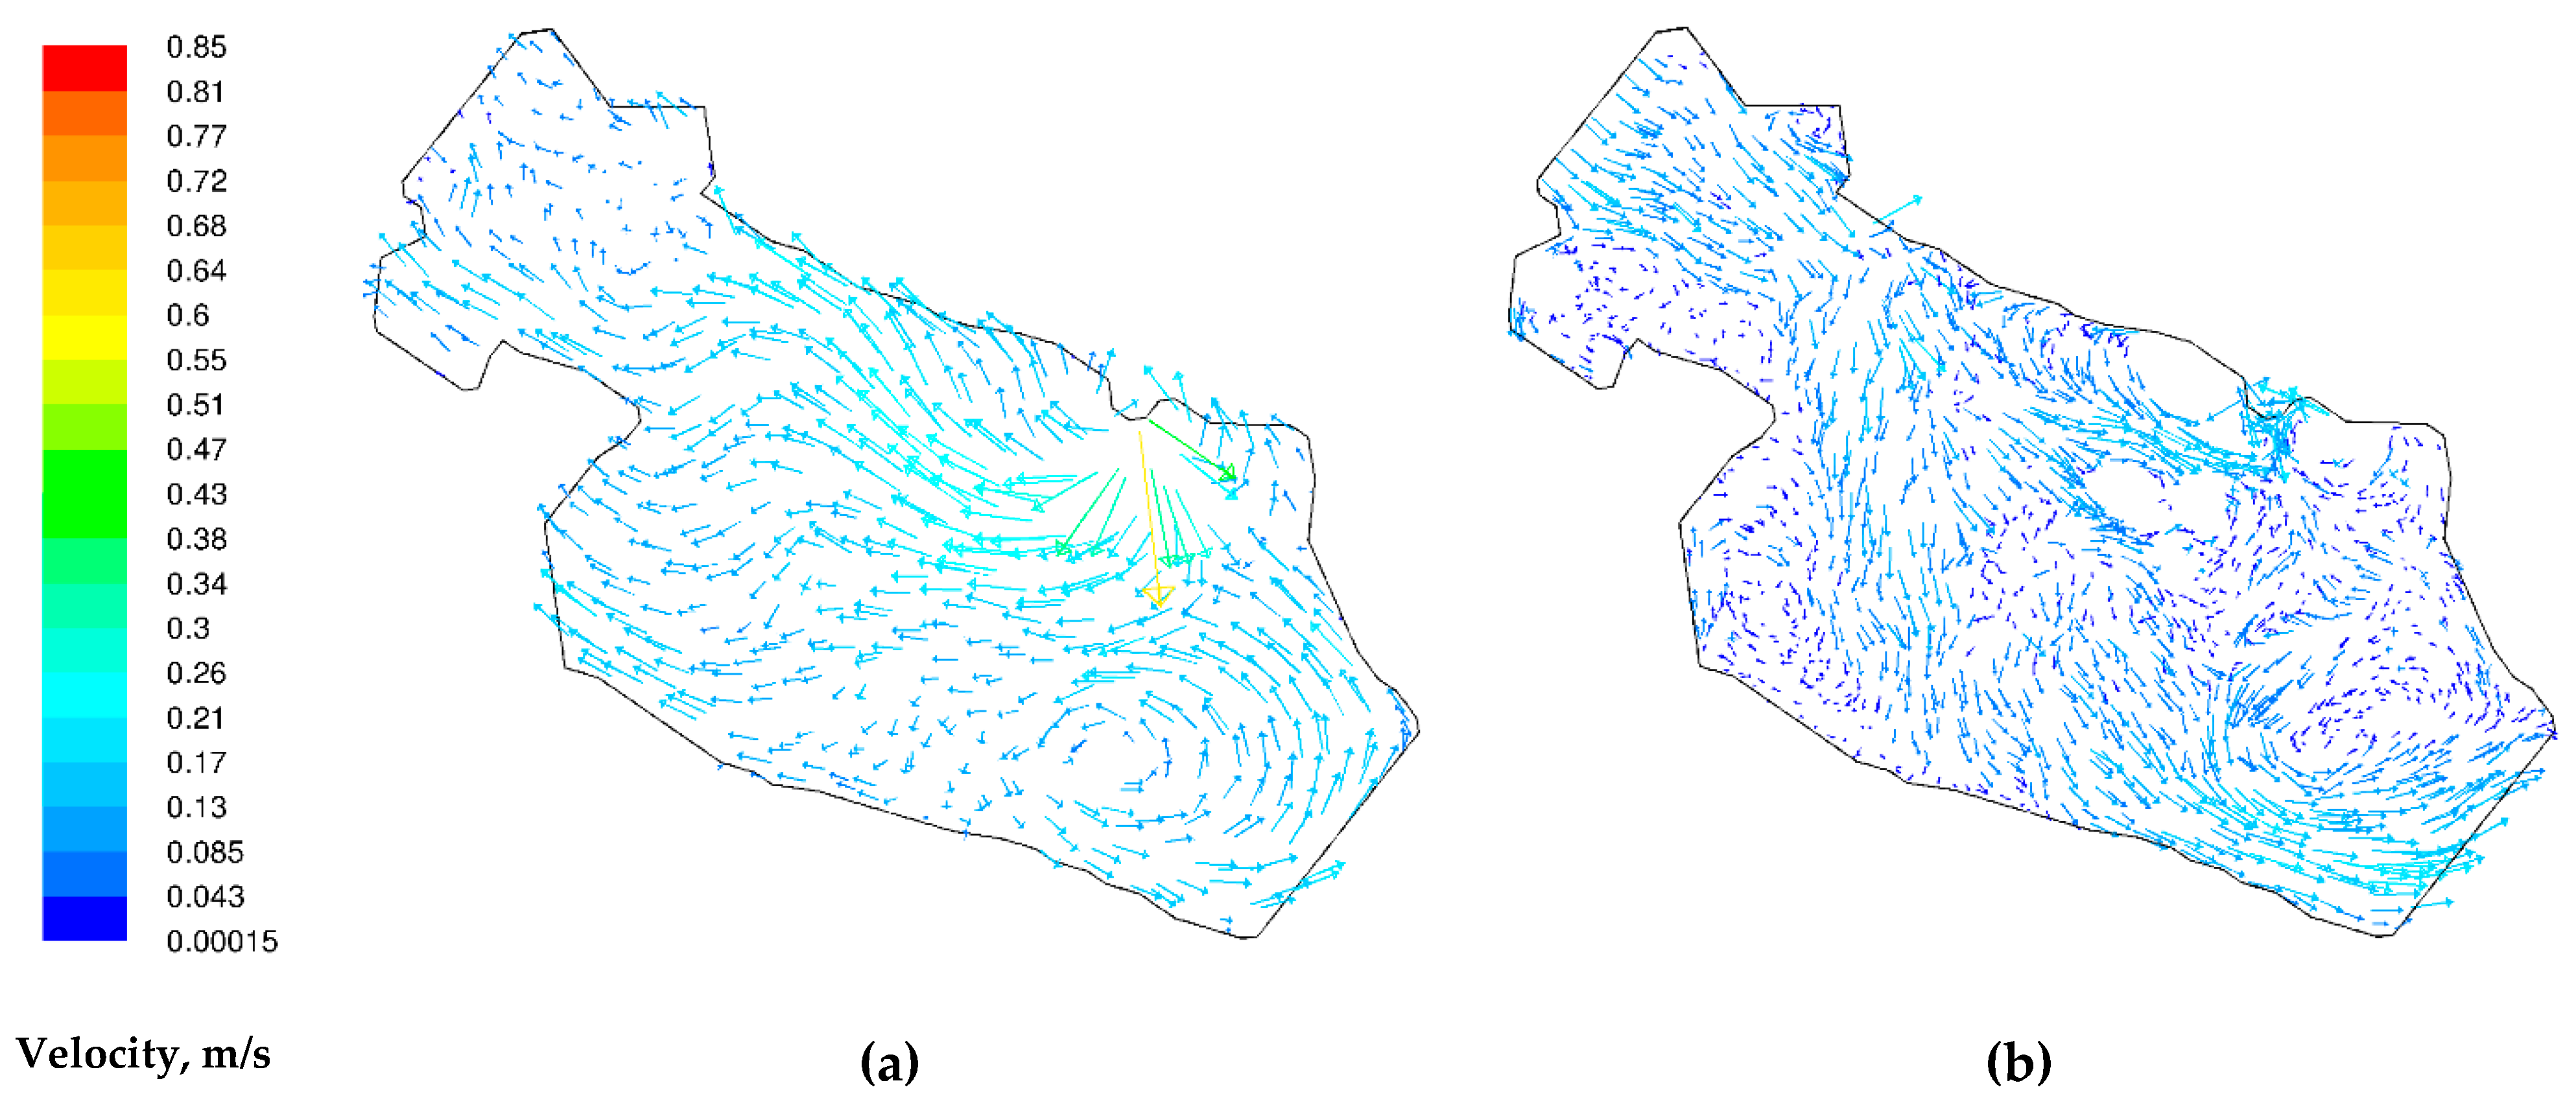
After 10 h from the start of the discharge, the warm wastewater enters the intake channel of the TPP cooling system. The movement of the water against the direction of the river flow is observed approximately in a six-meter layer from the surface; in the deeper layers, the water moves downstream (see, Figure 9). Thus, the movement of water has a three-dimensional vortex structure, which justifies the need for a three-dimensional approach and limits the solution of the problem within the two-dimensional approach.
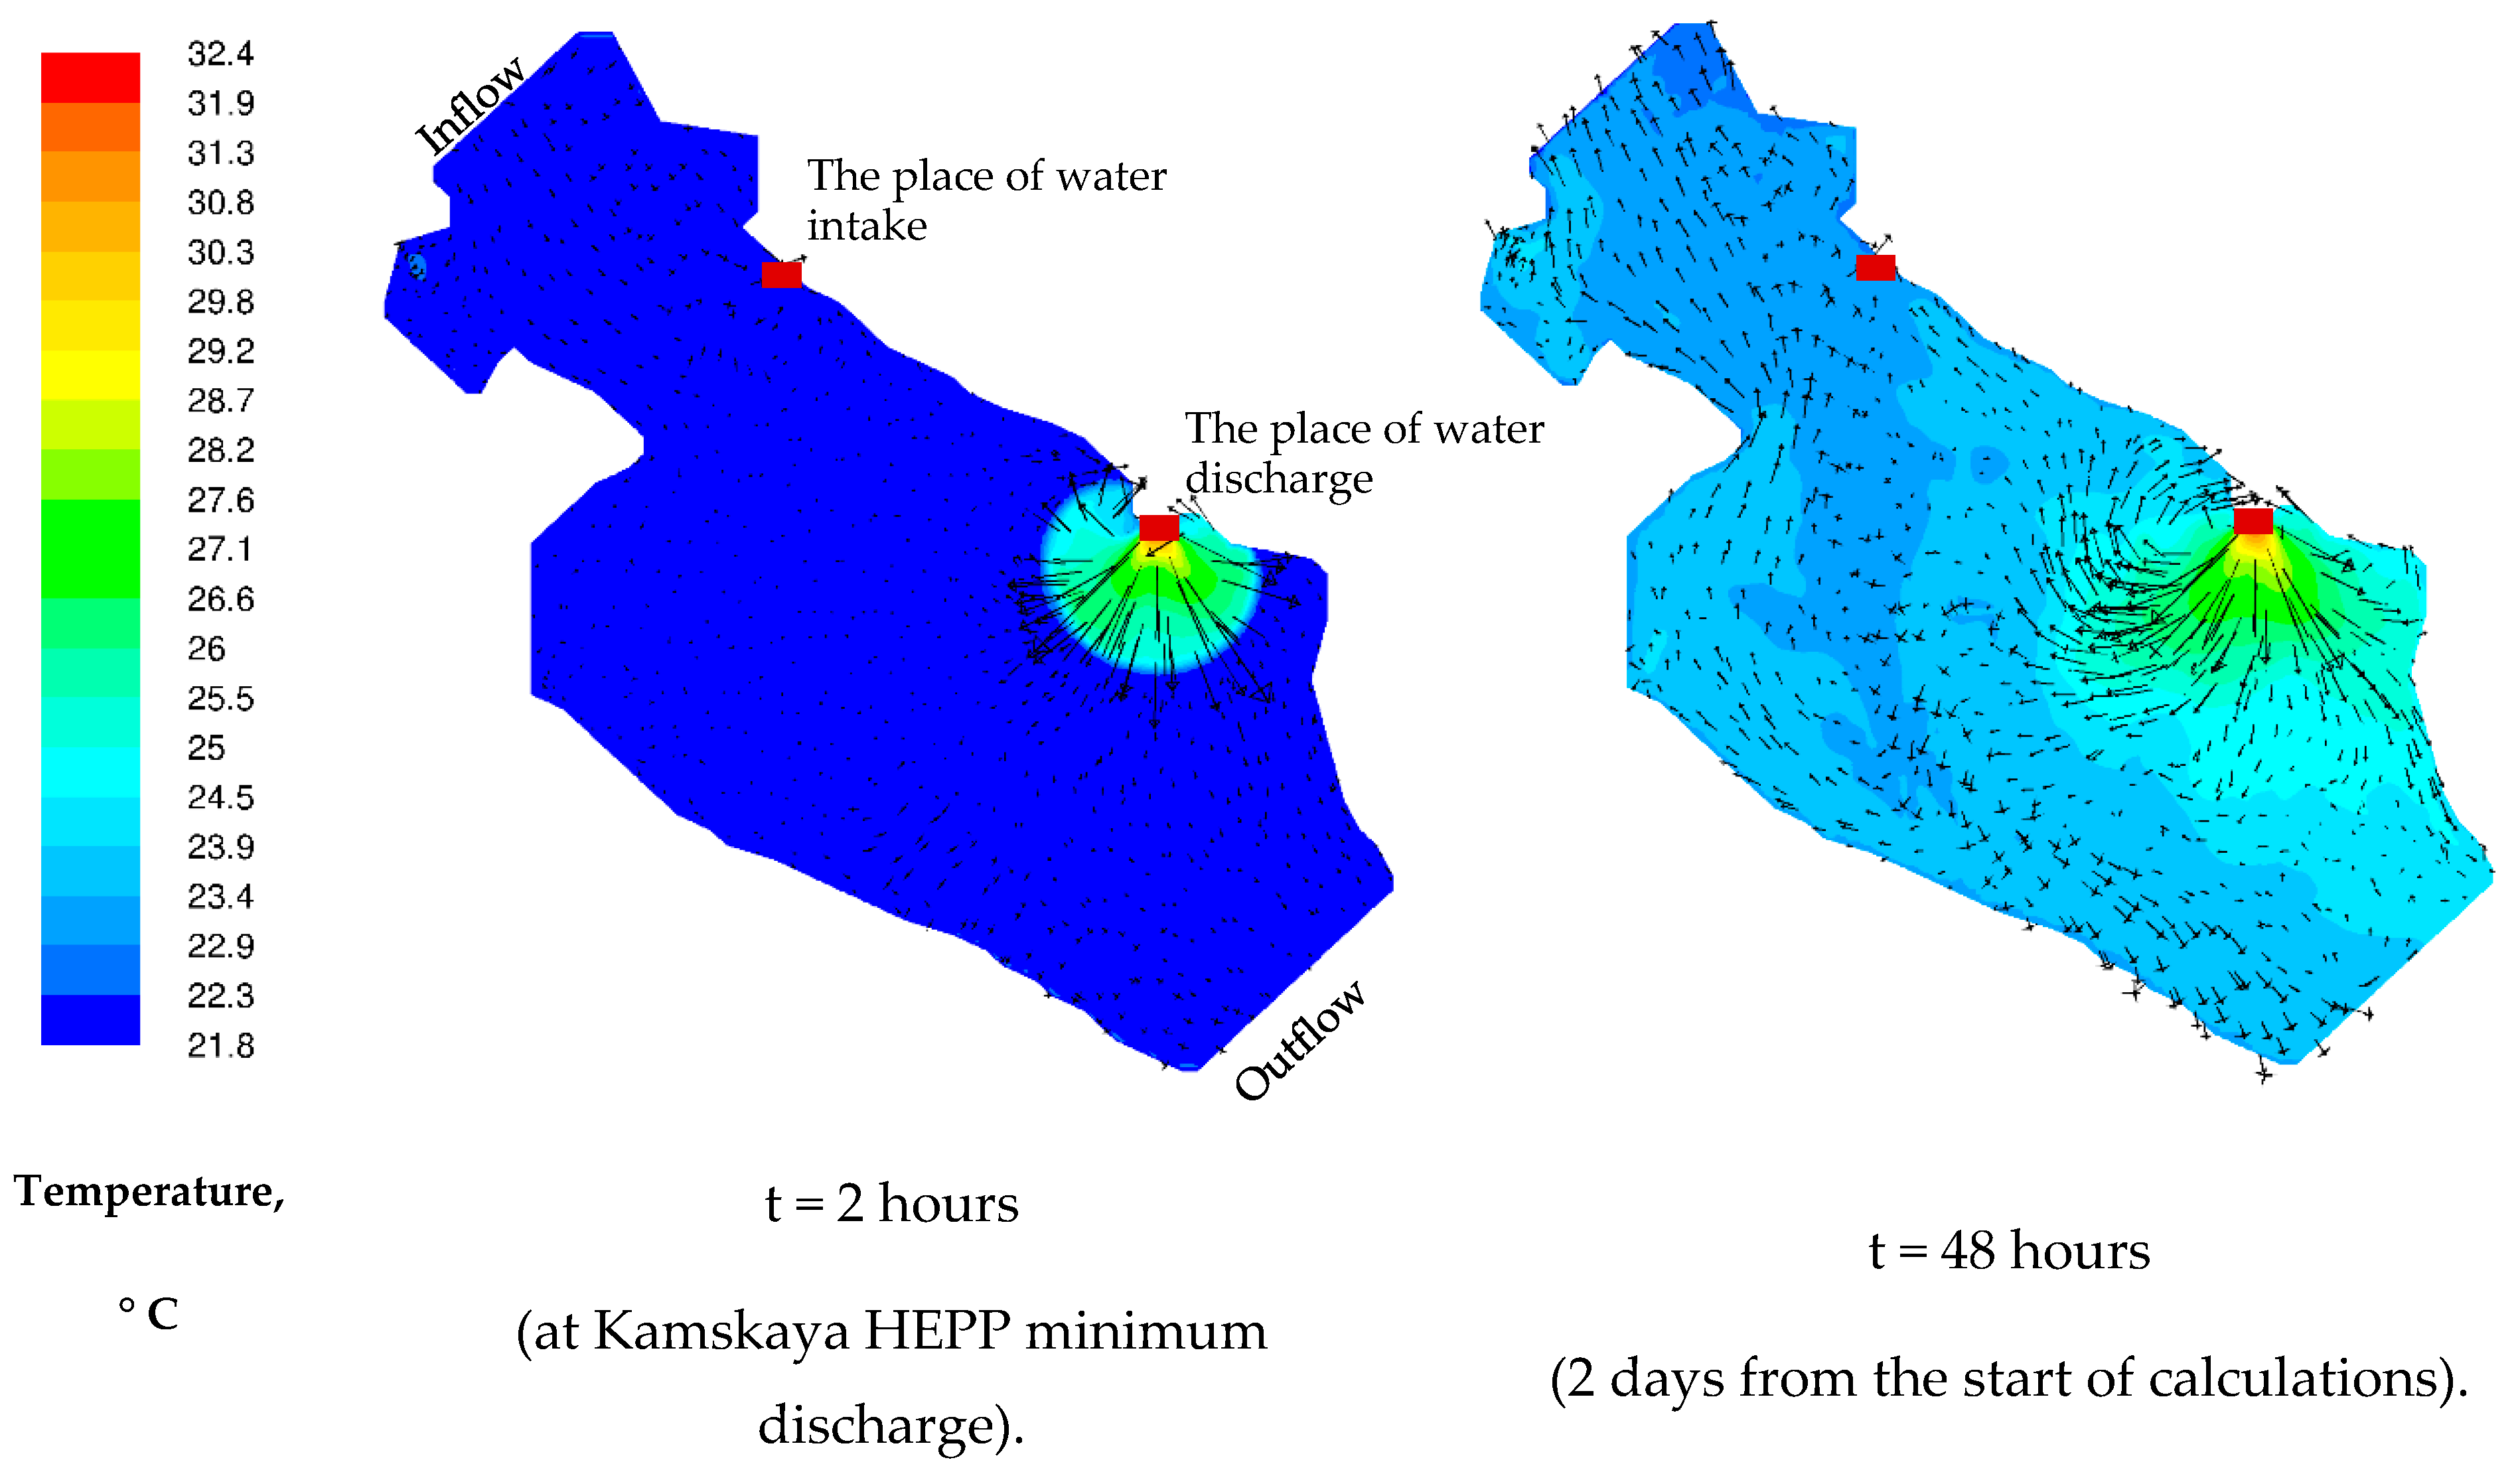
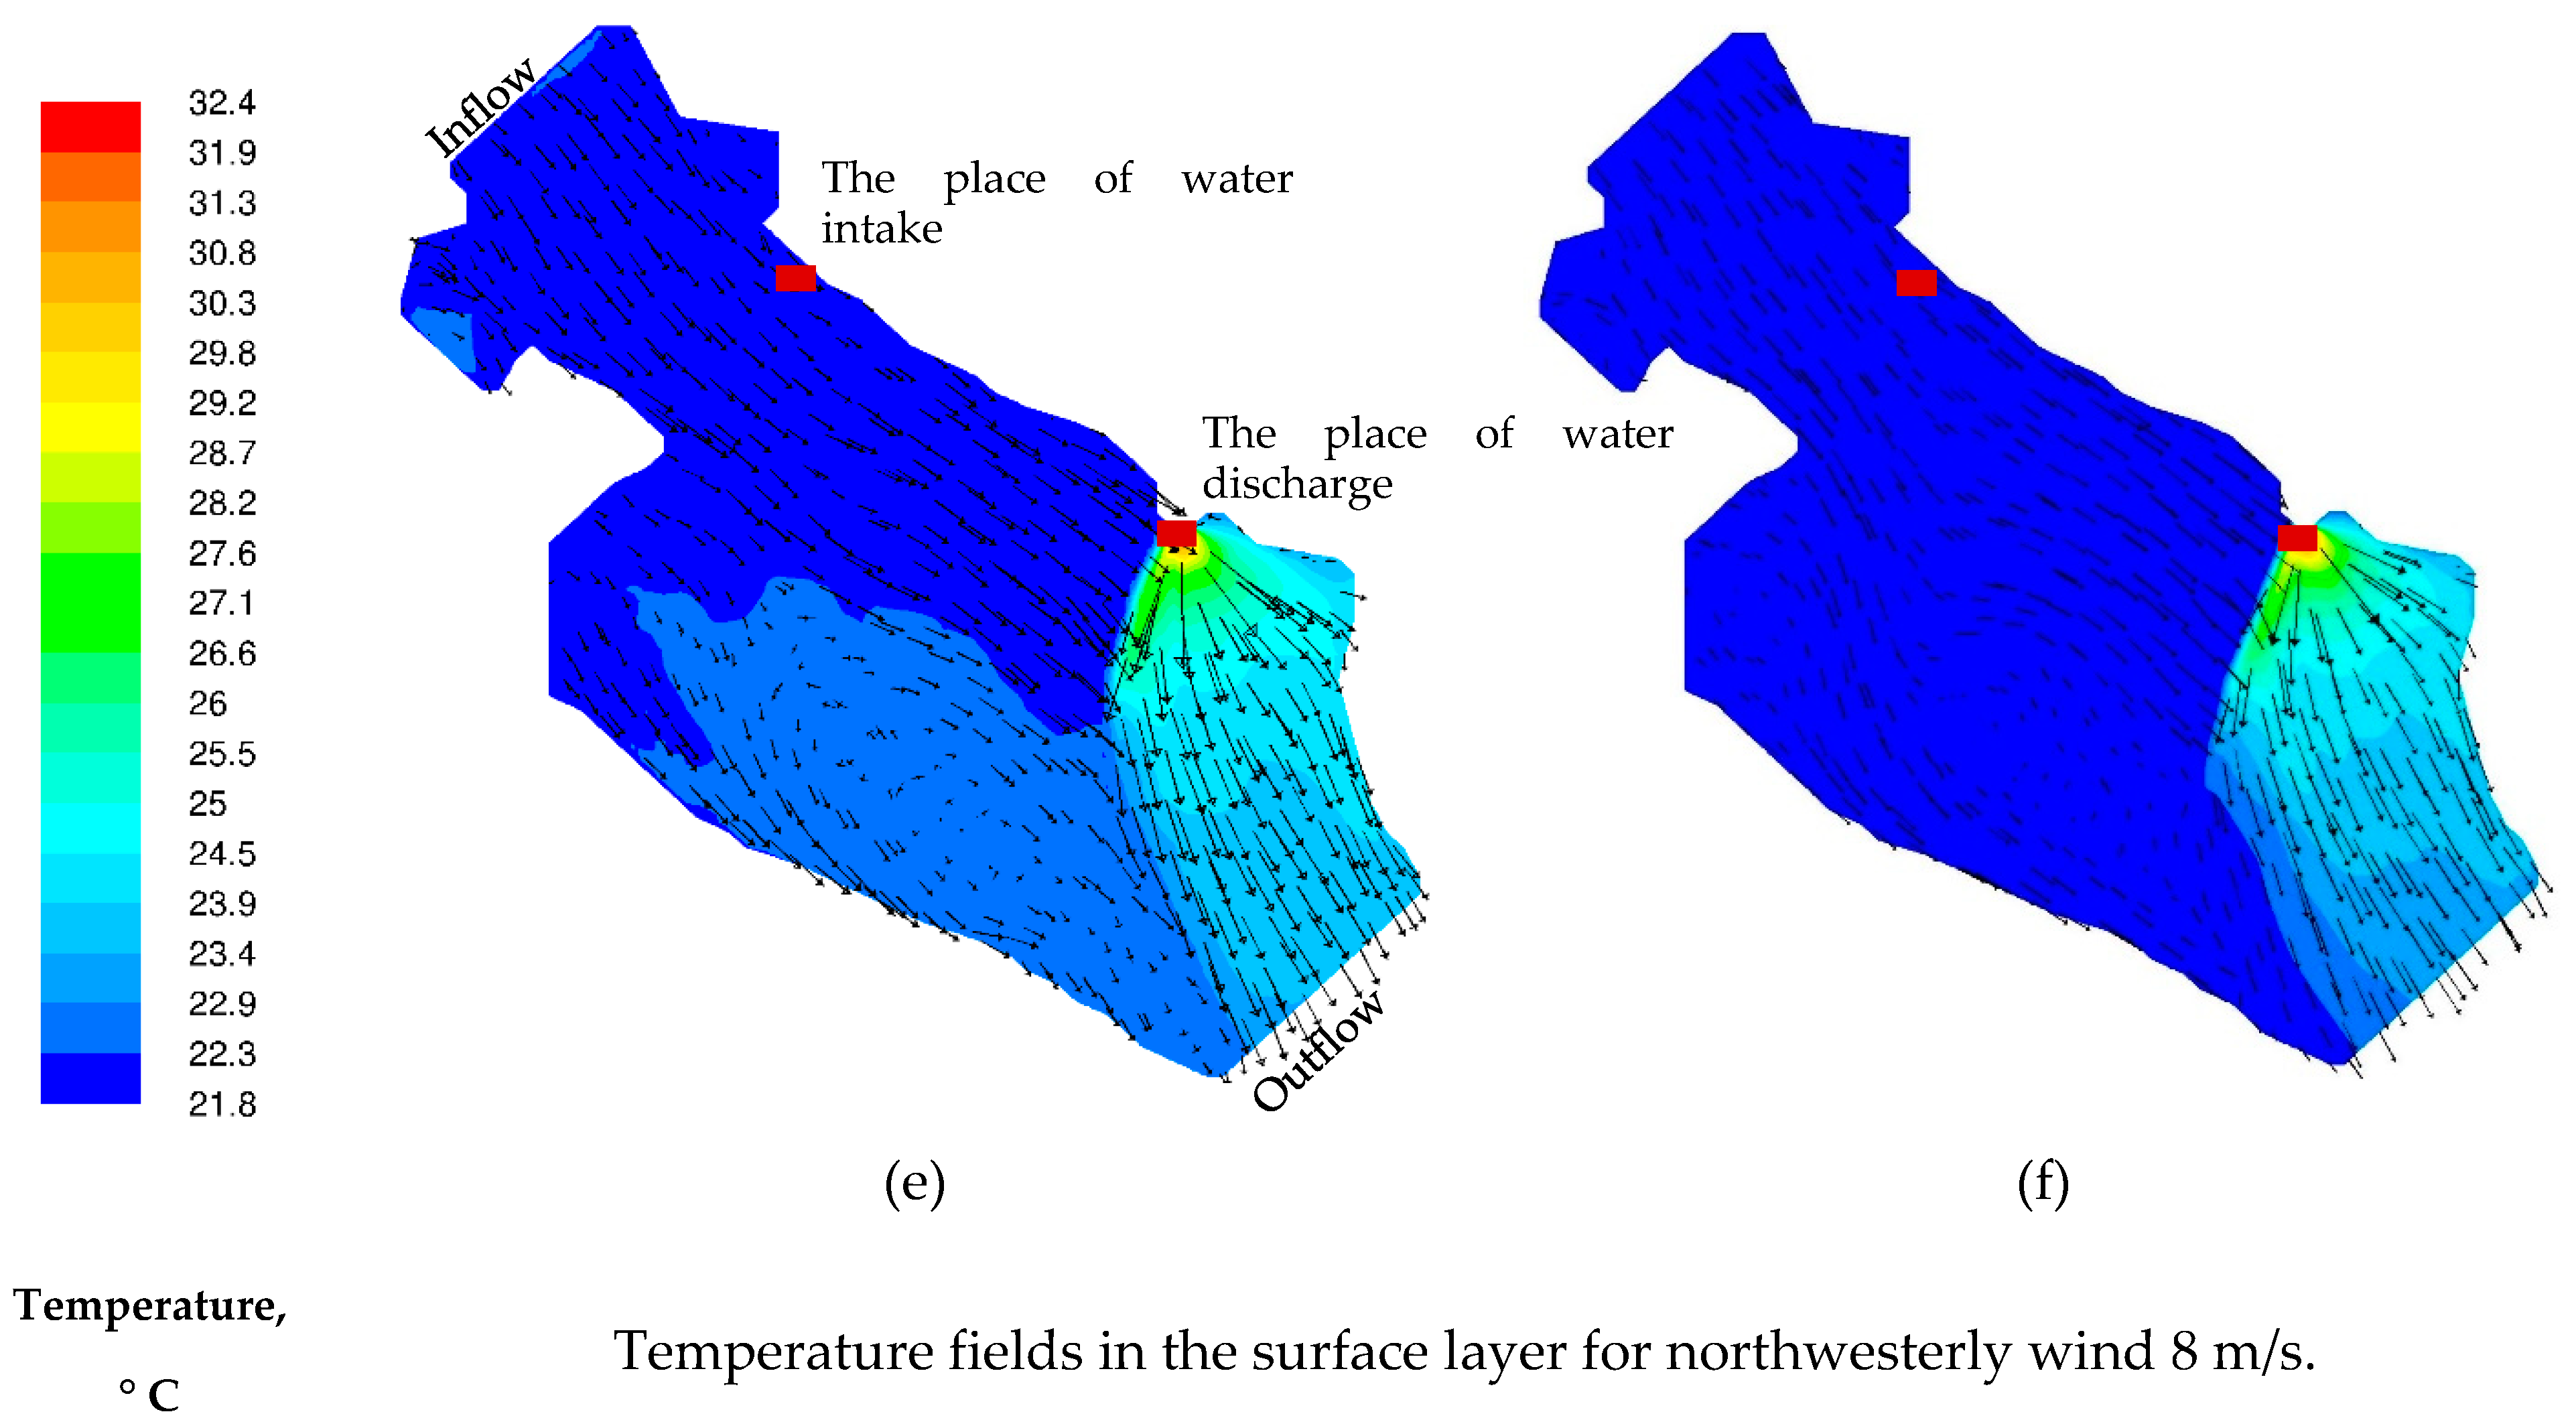
Figure 10 shows the temperature fields for the case of wind at a speed of 8 m/s, directed from the northwest. In this case, with stationary backwater from the Kamskaya HEPP (see, [25]), the heat spot propagates downstream of the river. With unsteady backwater from the Kamskaya HEPP, vortex structures arise, which lead to the movement of warm water masses against the river flow, the area of the heat spot propagation increases, occupying the entire river bed. At some time intervals, as with the southeasterly wind, the movement of warm wastewater against the river flow is observed. The direction of the flow changes in an oscillatory manner.
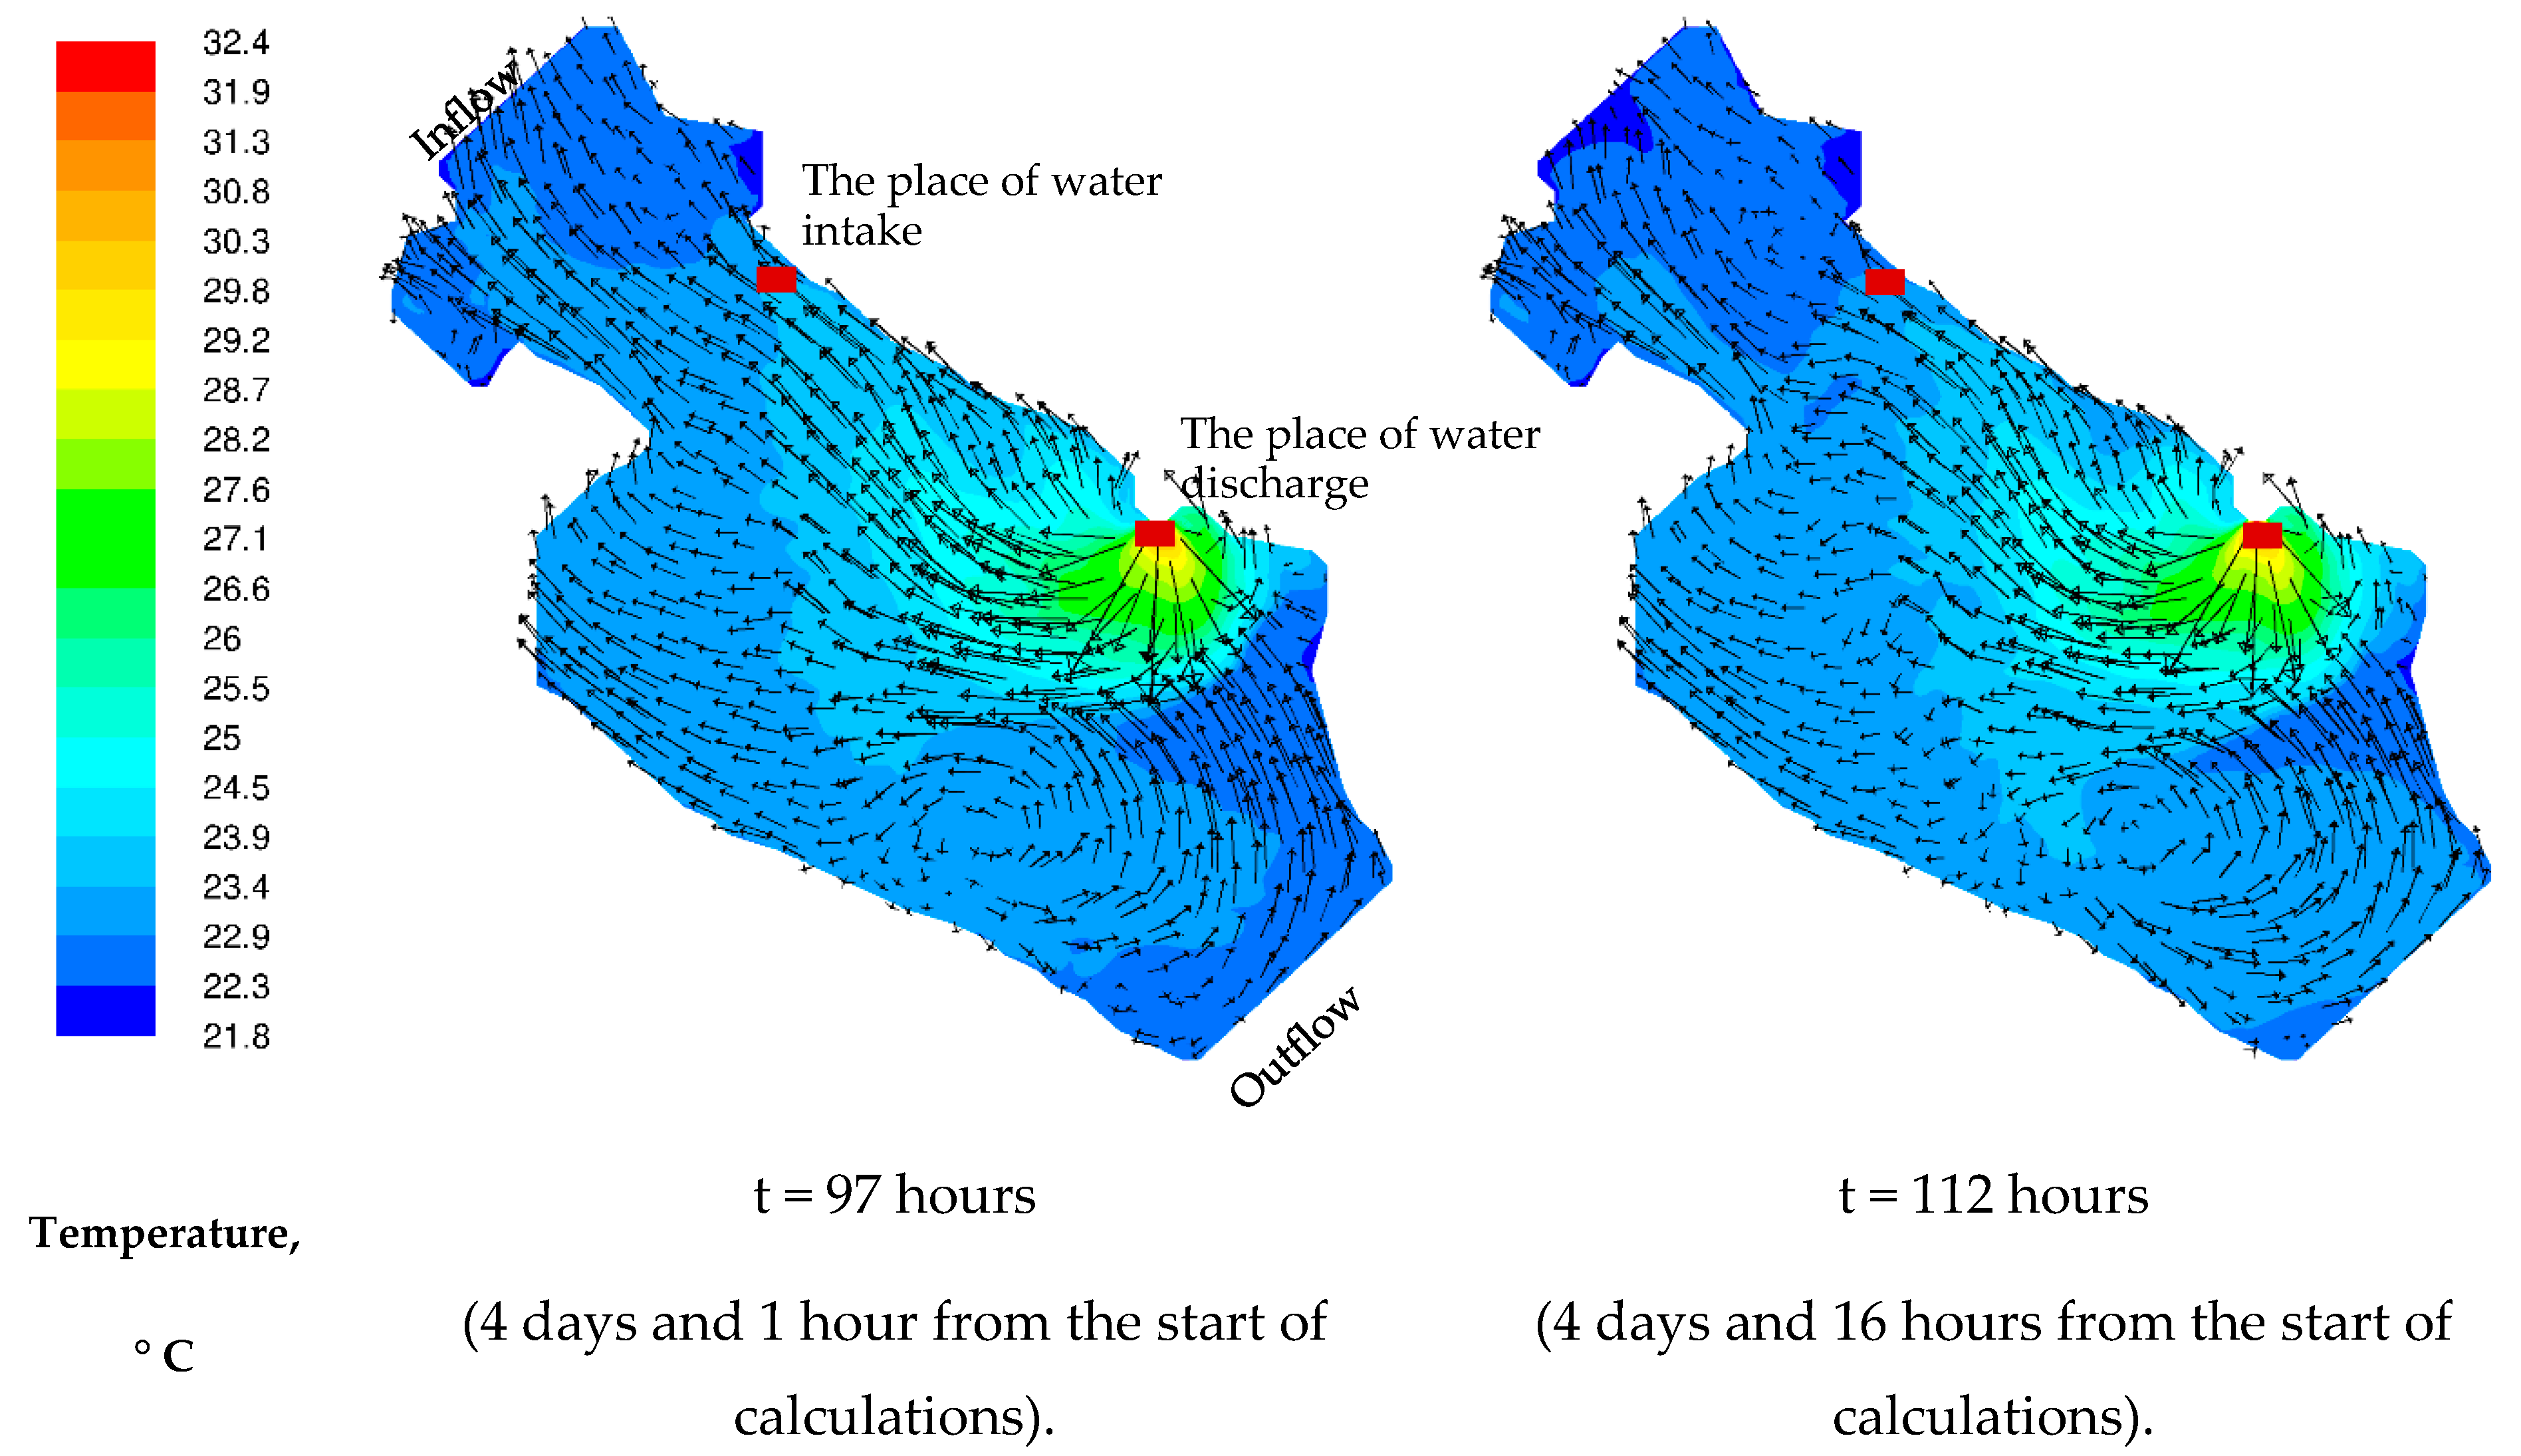
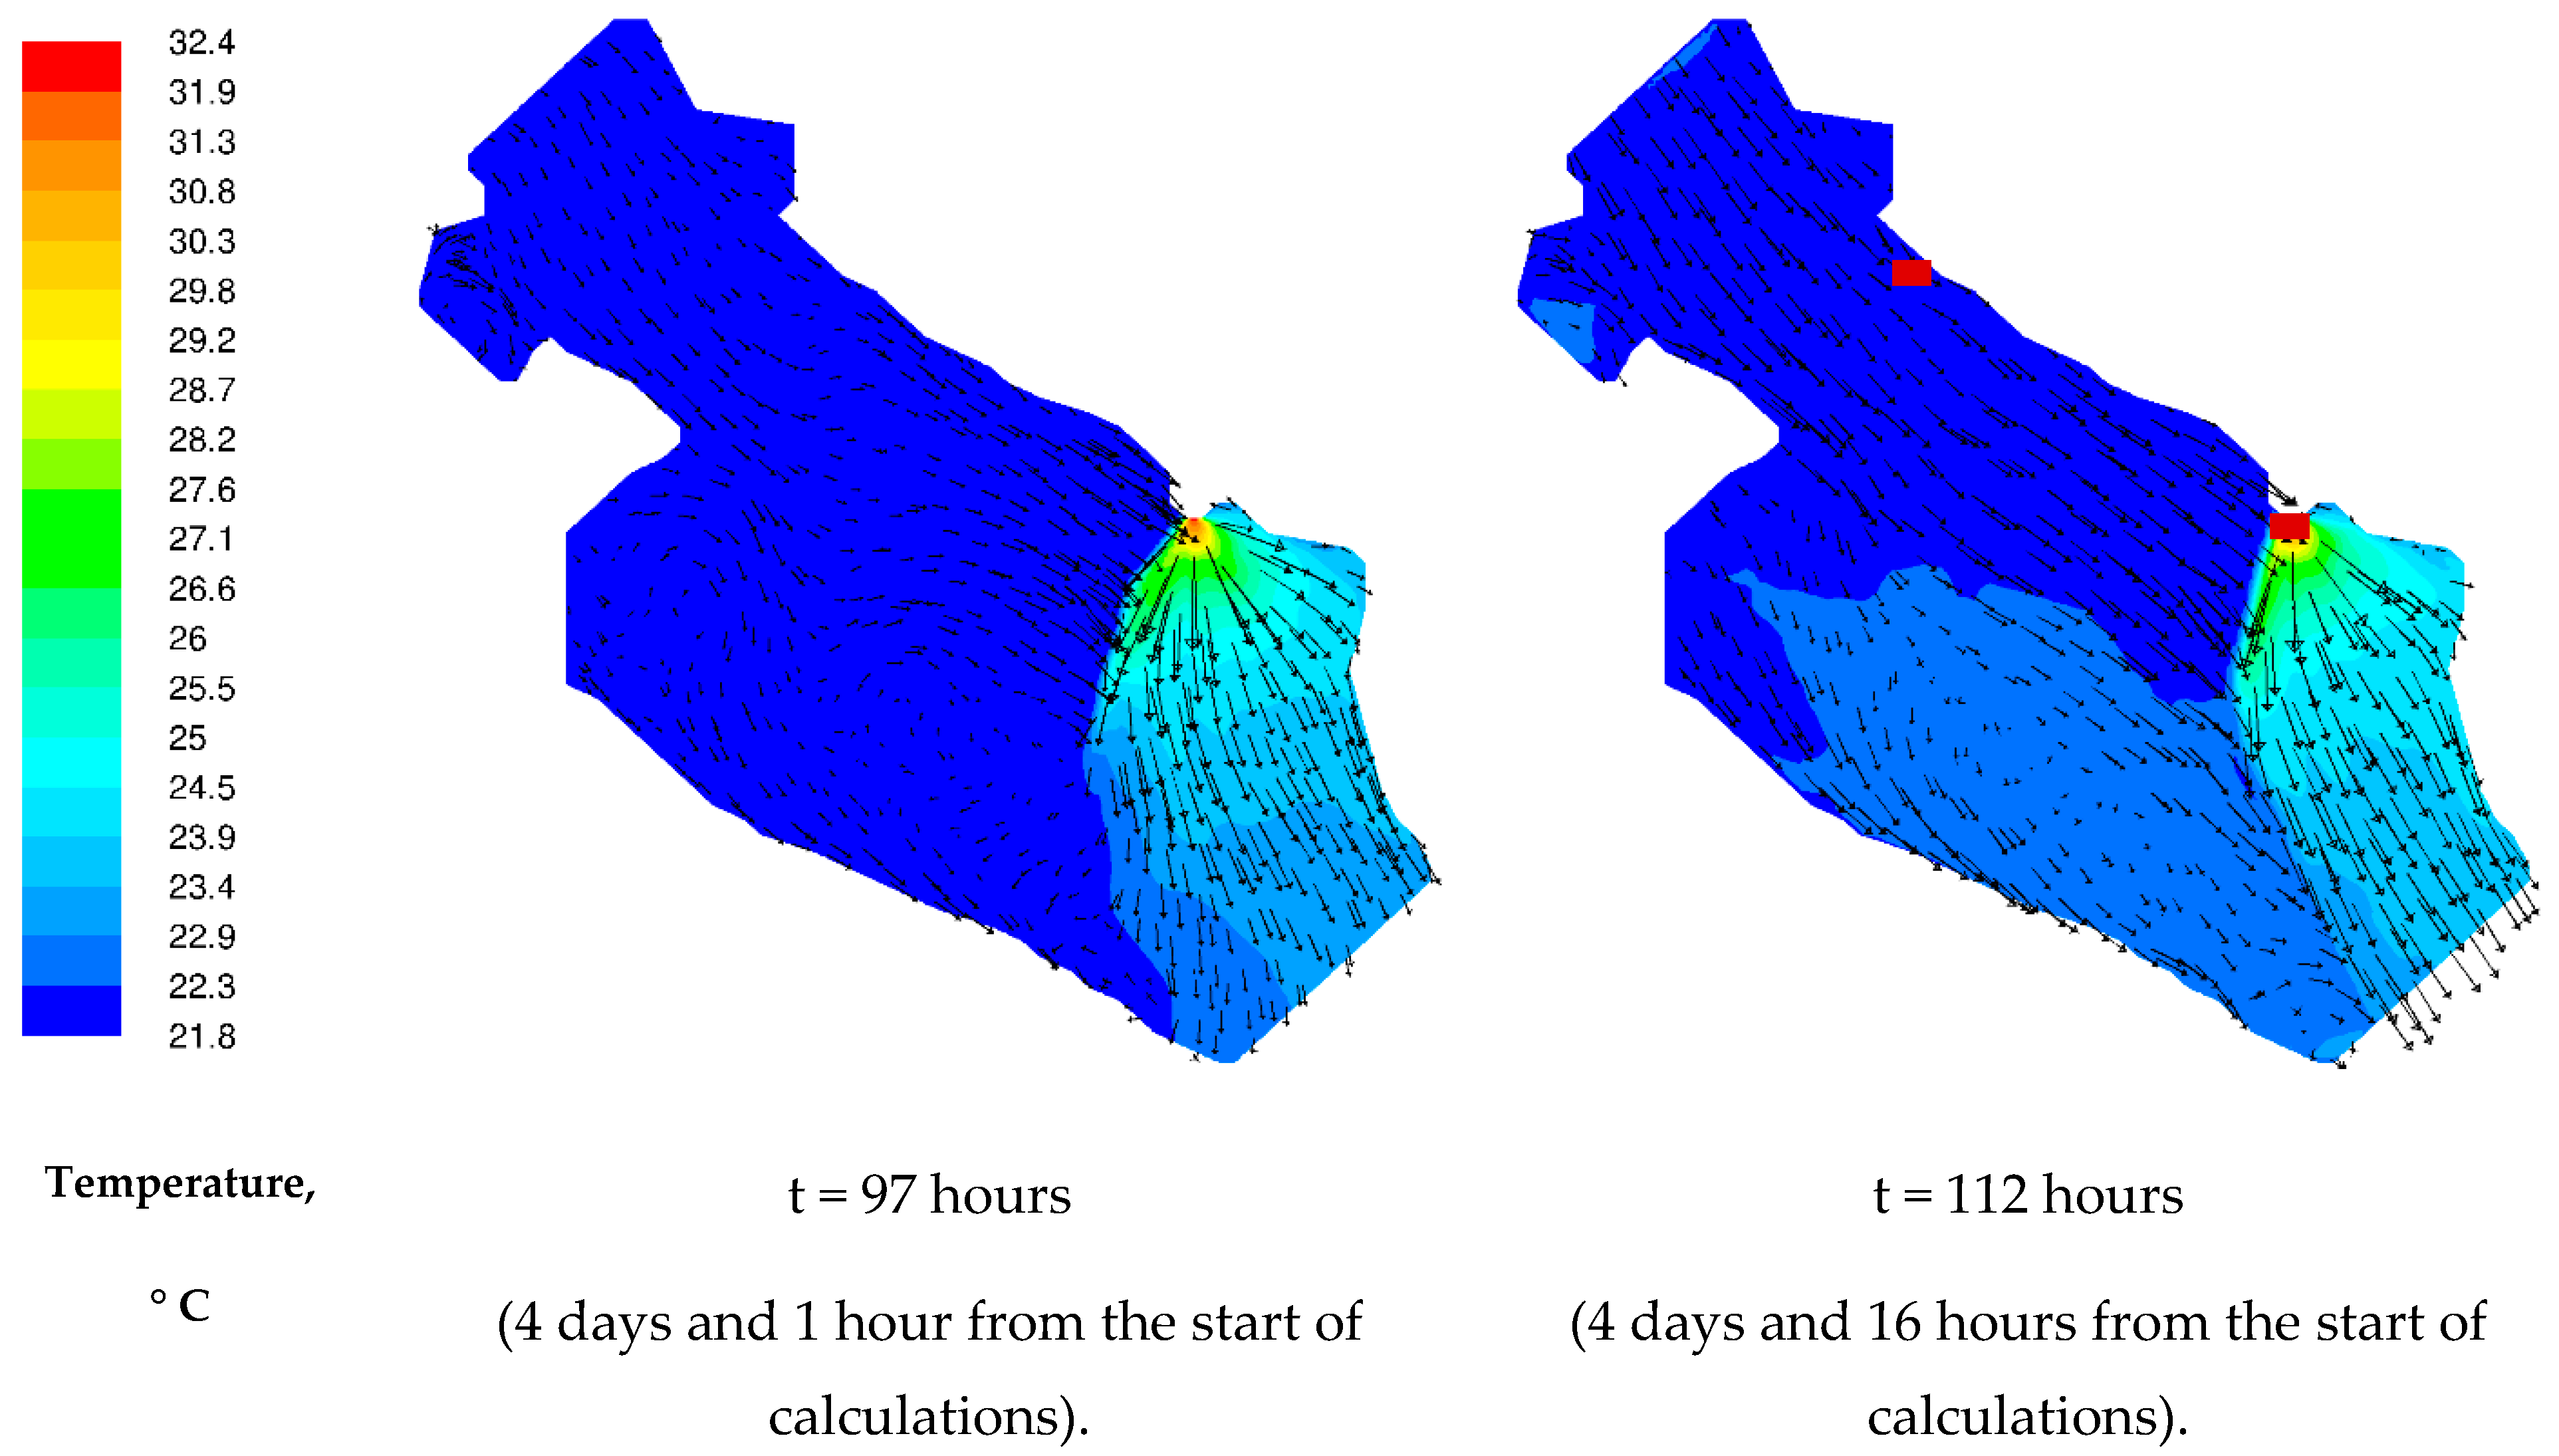
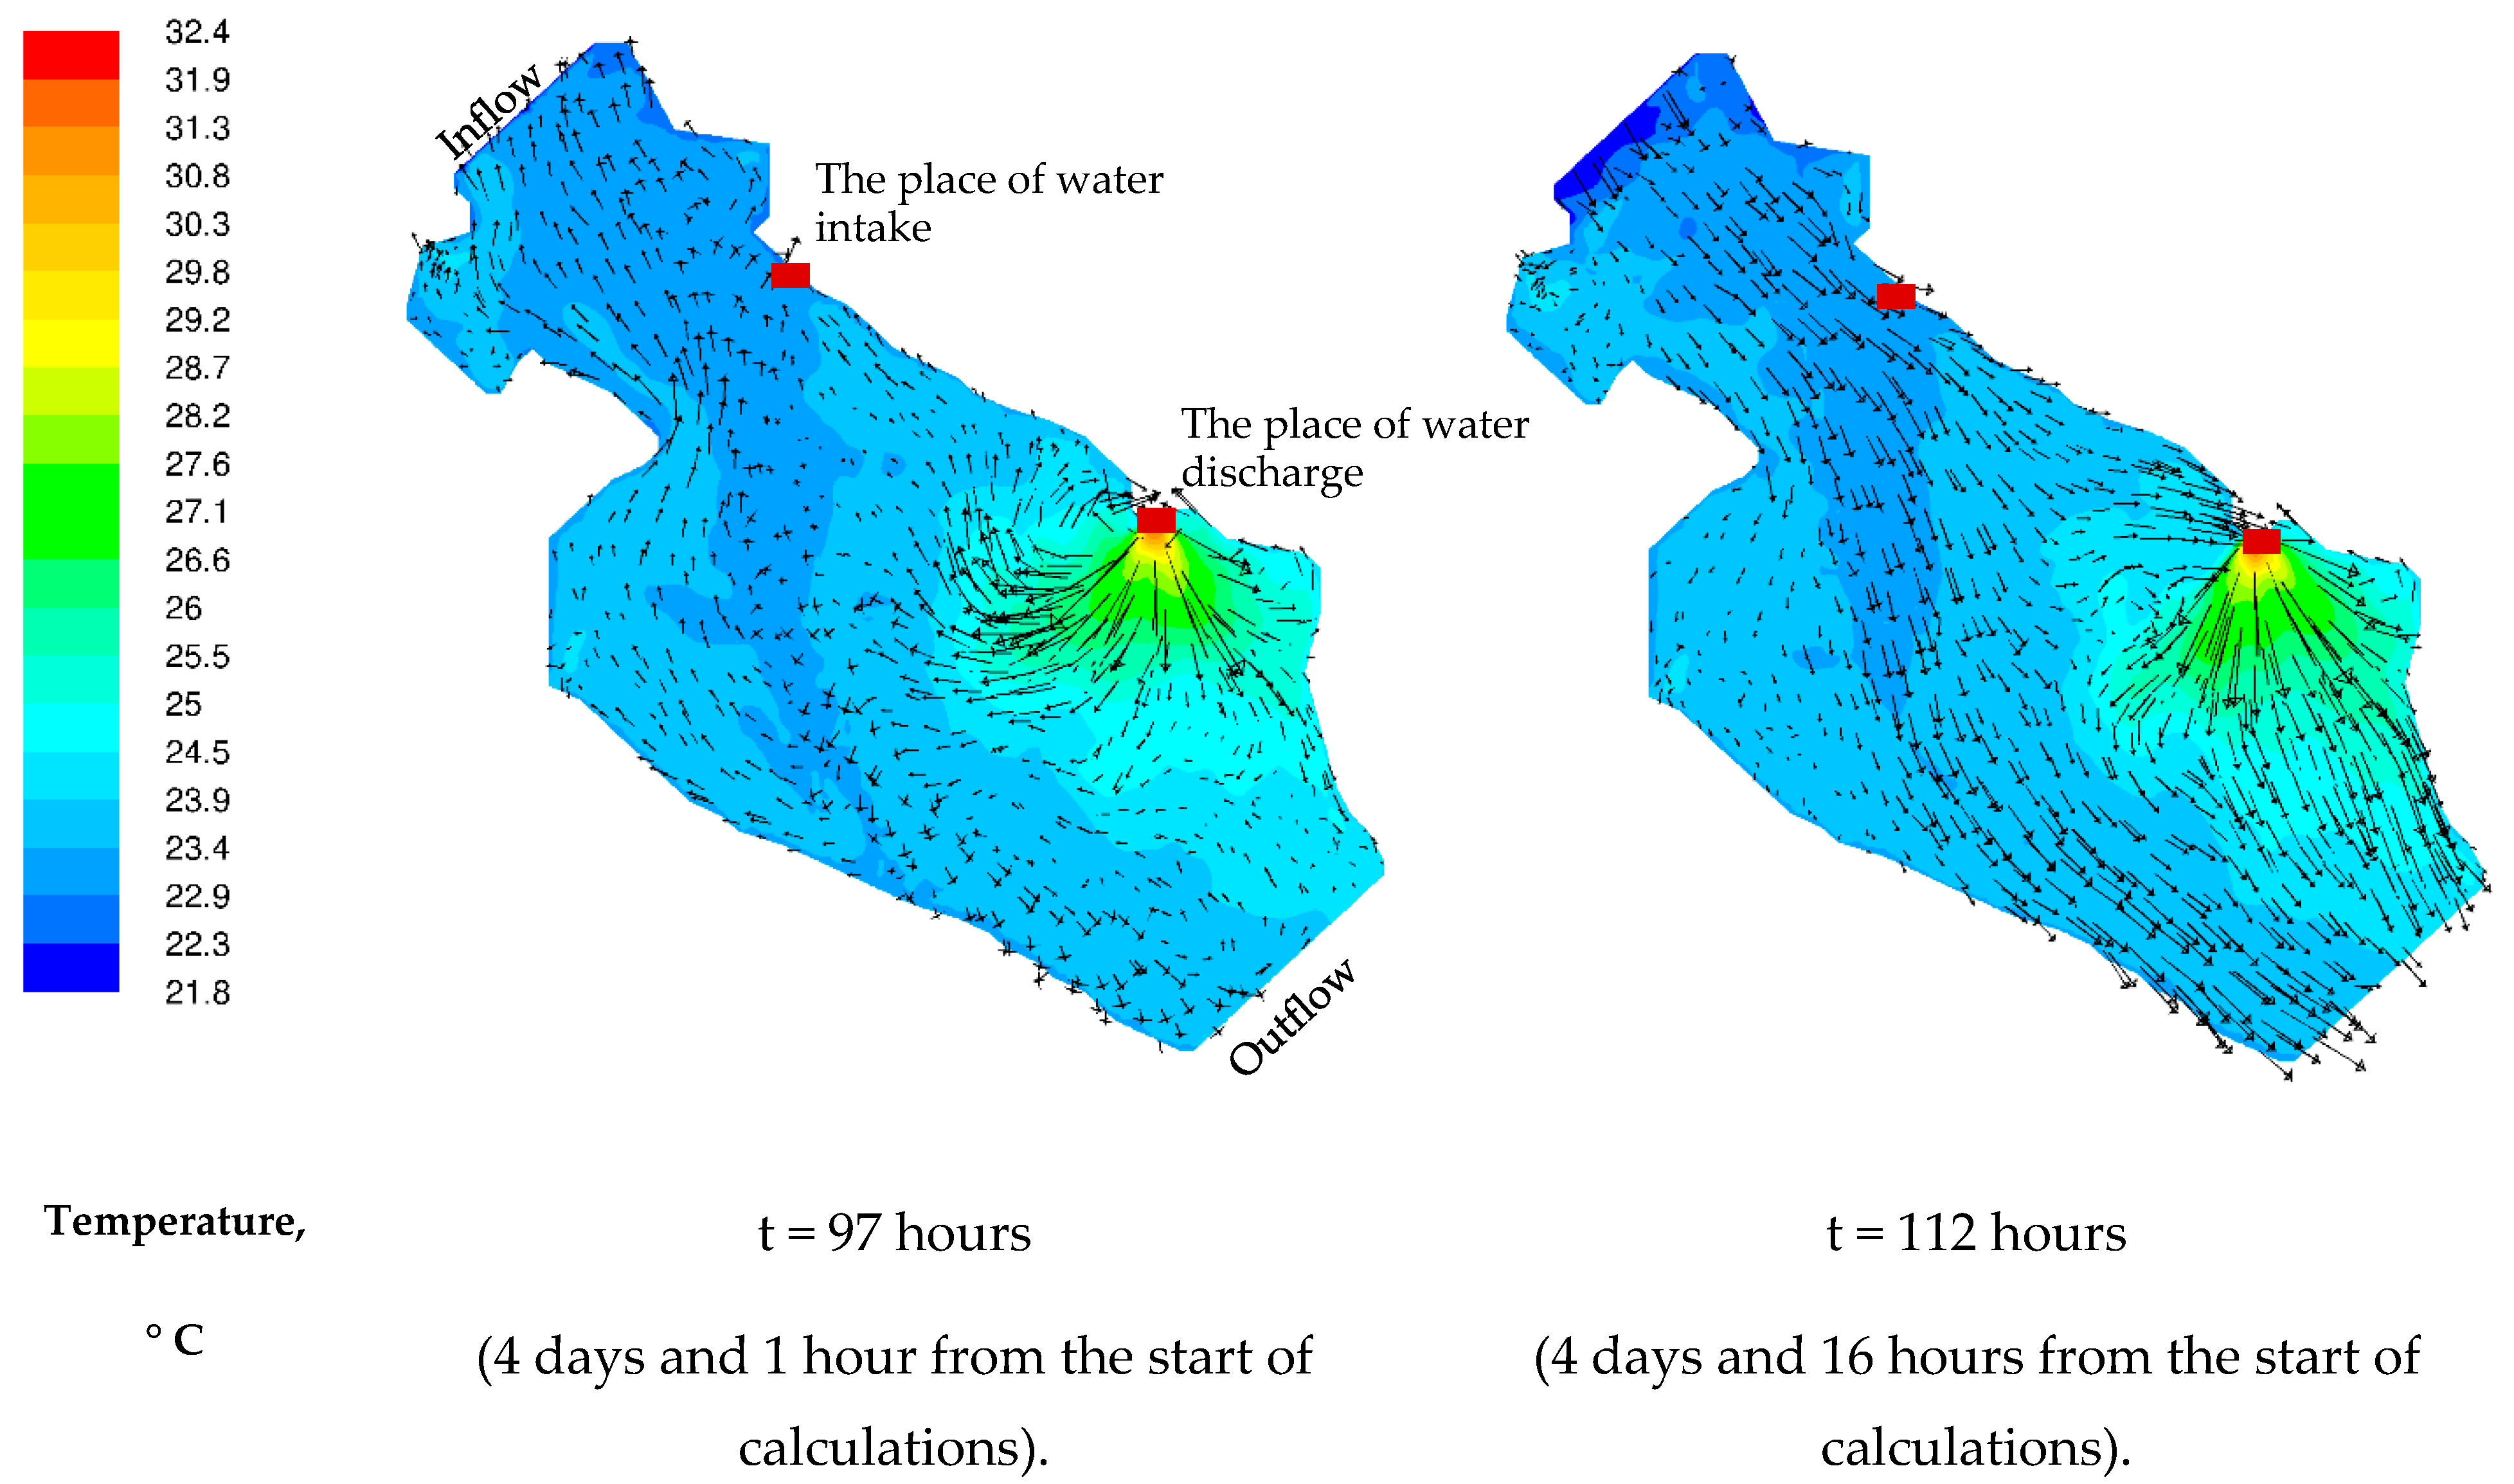
Figure 11 shows the results of three-dimensional calculations for calm conditions. As can be seen, the vortex flows obtained in two-dimensional calculations are also observed in three-dimensional calculations for the same time moments. Moreover, the zone of warm water covers the entire water area corresponding to the computational domain. As for the southeasterly wind, there is an intense movement of warm wastewater in the direction of the Permskaya TPP intake channel.
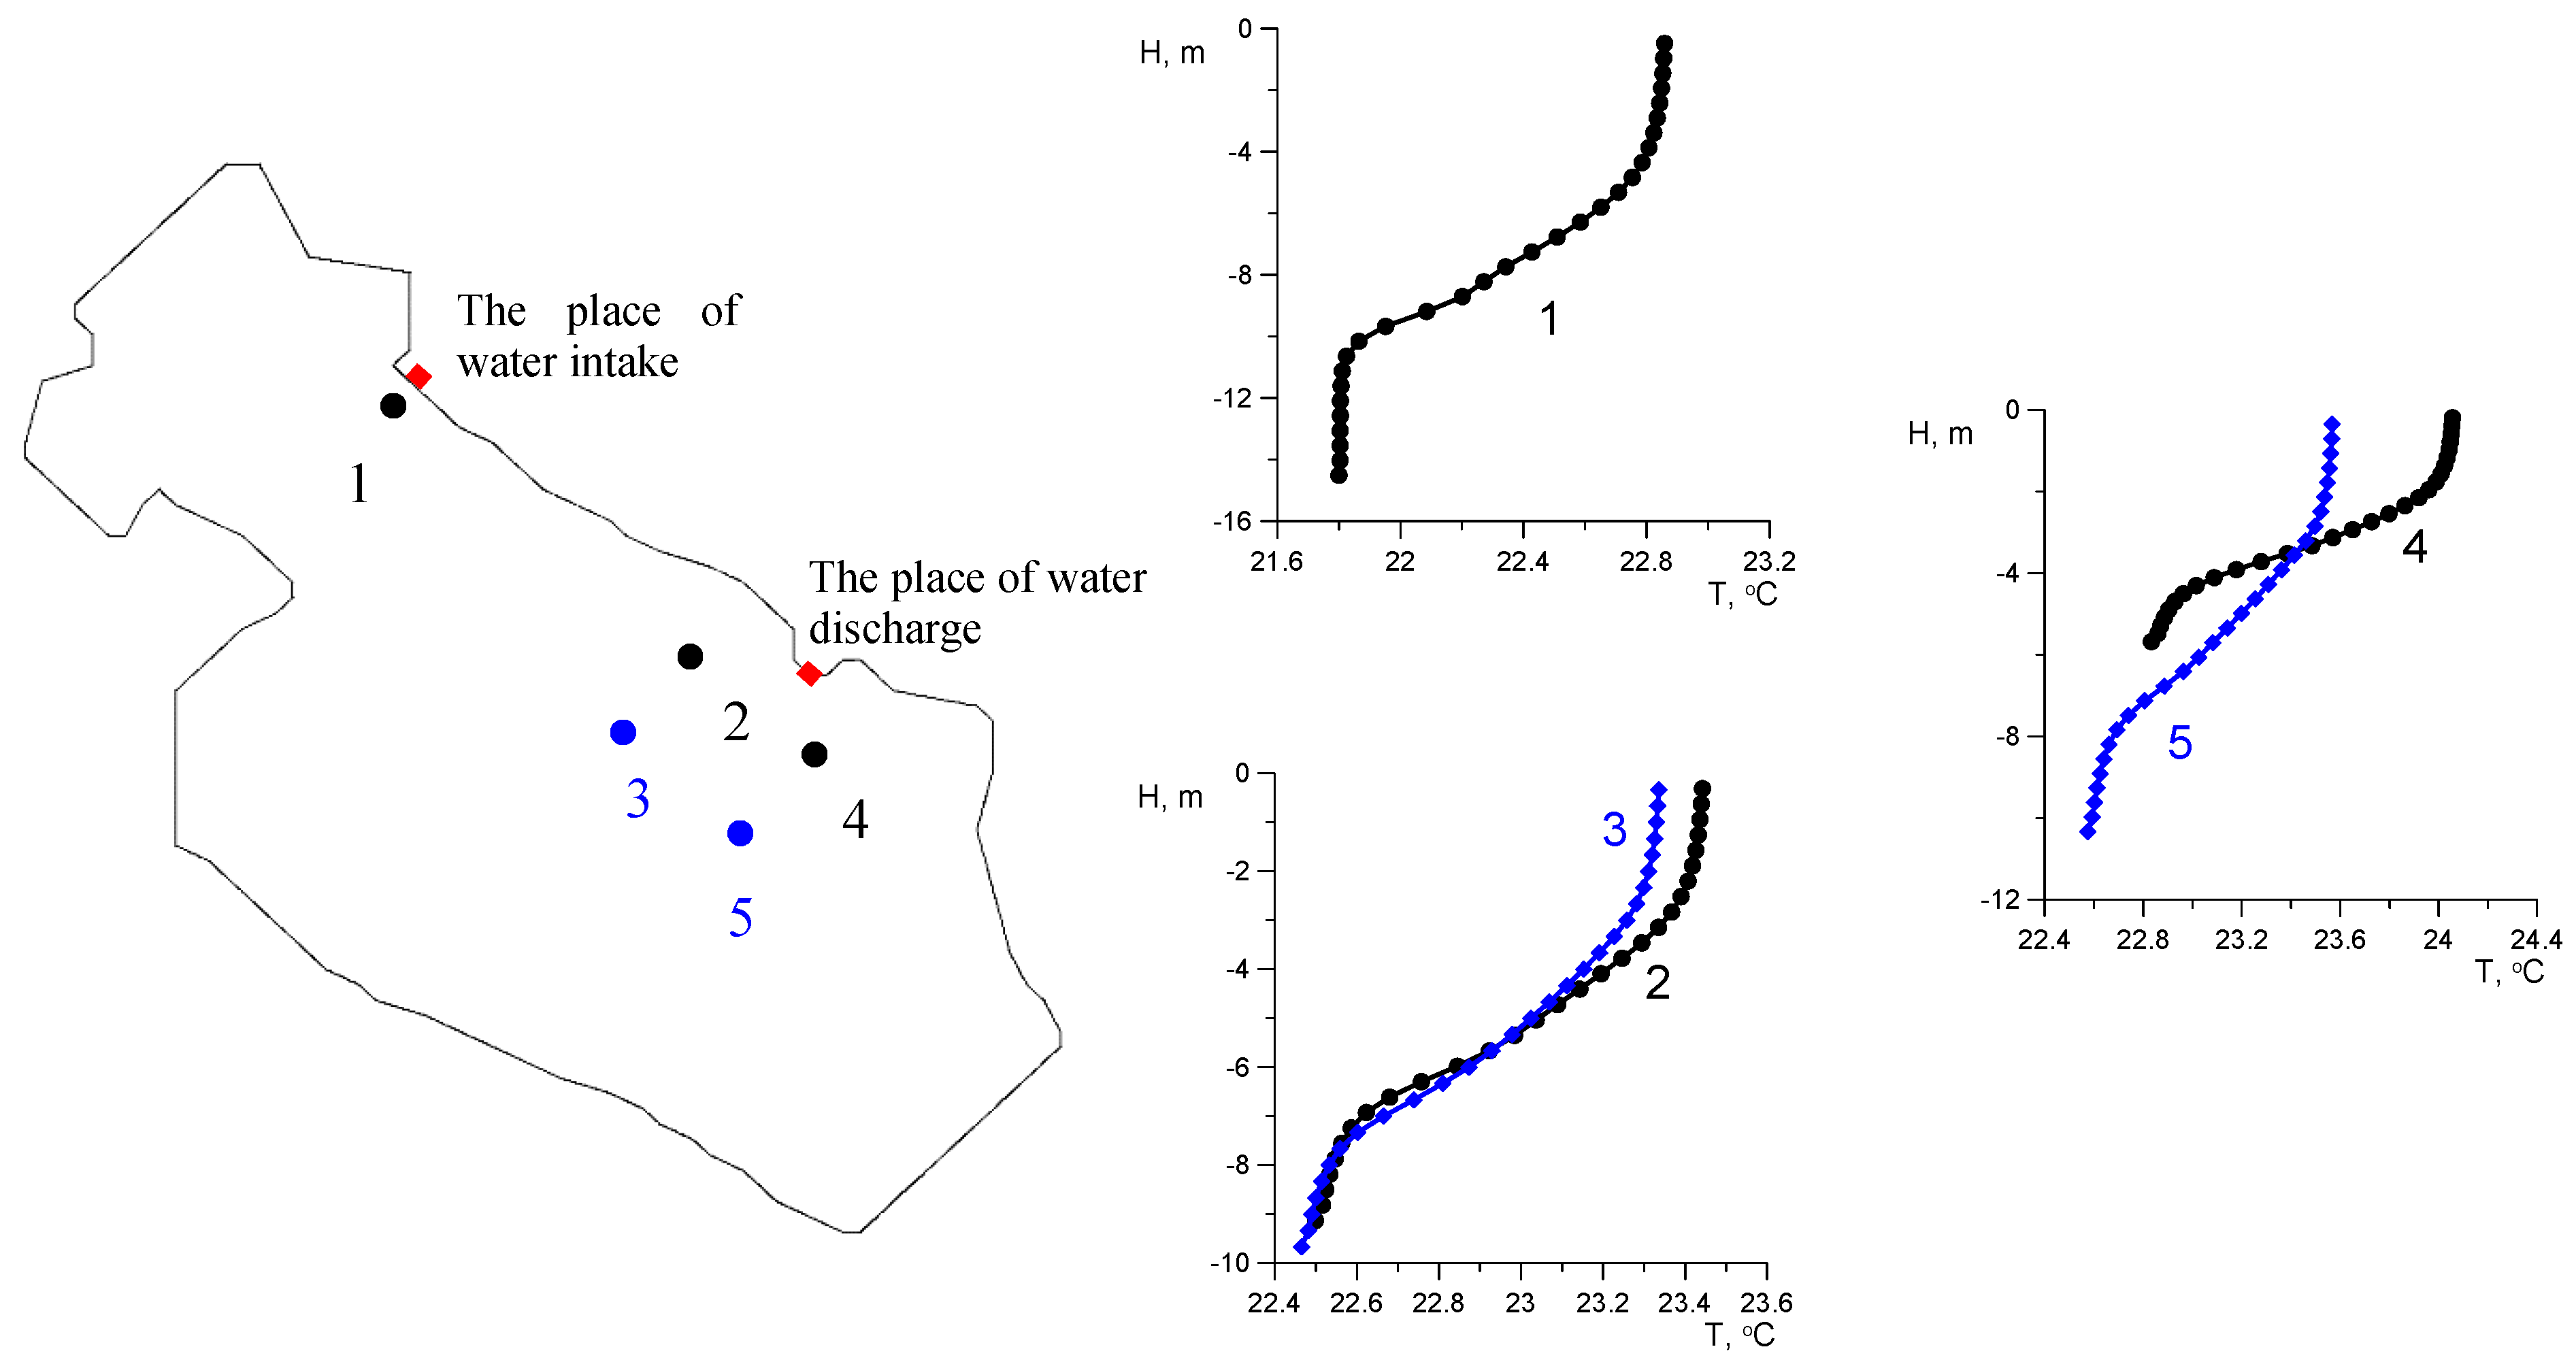
Figure 12 shows the distribution of water temperature over depth at different verticals for calm conditions at time (t) = 97 h. As can be seen, at all verticals, the temperature distributions over the depth are substantially inhomogeneous.
To illustrate the effect of the discharge flow rate variation at the Kama HEPP, we present, in Figure 13, the temperature fields at 95 h from the start of the discharge for the case of a variable discharge change in accordance with Figure 7, and for a constant discharge flow rate equal to the average flow rate in Figure 7, 2000 m3/s. As can be seen from the figures, under all wind conditions, at a variable discharge flow rate, the thermal pollution spot covers a larger area than at a constant discharge flow rate equal to 2000 m3/s.
Figure 13a,b corresponds to calm conditions. It can be seen that in these conditions, under a non-stationary discharge flow rate, a thermal spot propagating against the flow in the reservoir covers the entire computational domain and warm water enters the water intake channel intended for cooling Permskaya TPP blocks. With a constant discharge flow rate of 2000 m3/s, the thermal spot propagates to a smaller distance upstream, but it does not reach the water intake channel.
At a constant wind exposure in the opposite direction to the flow in the reservoir (Figure 13c,d for the southeasterly wind 8 m/s), both at a non-stationary discharge flow rate and a constant discharge flow rate of 2000 m3/s, the thermal spot propagates against the river flow and warm water enters the intake canal. At a non-stationary discharge flow, the area of the thermal spot is larger; it reaches the intake channel earlier.
At a constant wind exposure in the direction of the flow in reservoir (Figure 13e,f for the northwesterly wind 8 m/s), both with an unsteady discharge rate and a constant discharge rate of 2000 m3/s, a thermal spot propagates downstream to the Kamskaya HEPP dam and warm water does not enter the water intake canal.

4. Conclusions

Sharp changes in discharge flow rate through hydroelectric station dams significantly affect the hydrodynamic regime of not only the lower, but also the upper pools of the reservoirs. Using, as an example, the Permskaya Thermal Power Plant located in the backwater zone of the Kamskaya Hydroelectric Power Plant and using a direct-flow cooling system, the effect of unsteady water discharge flow rate through the hydroelectric station dam on the hydrodynamic regime of the upper pool of the reservoir was studied.
To conduct computational experiments, a combined model was used and built on the basis of combination of 2D and 3D models. In the framework of two-dimensional modeling, data were obtained on the evolution of the direction and velocity of flow averaged over the depth at the changing flow-rate of the discharged water at the Kamskaya Hydroelectric Power Plant. Vortex structures of the velocity field near the Permskaya TPP were found. Three-dimensional numerical experiments carried out via a non-isothermal approach, taking into account density stratification effects, showed that a significant amount of warm water can be created in the upper part of the cooling pond, the temperature of which is several degrees higher than the background temperature.
The aim of the present work was not a detailed assessment of the velocity and temperature fields, but the study of the influence of such a factor, which was not previously considered as related to the significant intraday variability of the hydroelectric power plant operation in the hydrodynamic regime of the upper pool of a large reservoir. The field expeditionary estimation of the spatial–temporal structure of the processes under consideration required a correct comparison with the calculated values, which was very difficult due to inertial effects and was characterized by significant errors. At the same time, the performed daily observations of flow rates on separate measuring verticals located in the upper pool of the reservoir under consideration reflect significant oscillations not only in the module, but also in the direction of the flow, determined by the daily variability of the HEPP operation and reproduced by these models. In connection with the former, we believe that the proposed scheme is acceptable for assessing the possibility of the influence of intraday variability of the HEPP operation on the hydrodynamic regime of the upper pool of a large reservoir, and the peculiarities of the water use by large energy complexes located there.
We assessed the role of intraday variability of discharge through the Kamskaya Hydroelectric Power Plant dam on the hydrodynamic regime of the dam section, including the location of the Permskaya Thermal Power Plant, located 55 km from the dam. It was shown that the role of this discharge variability is significant, it even increases the probability of such a limiting phenomenon as the entry of warm wastewater into the freshwater intake channel of Permskaya TPP. In the formation of this phenomenon, neither air temperature nor wind speed are decisive factors, since it can be observed quite clearly even under calm conditions. At the same time, with a constant discharge from Kamskaya HEPP, as shown by calculations in our previous work, this phenomenon can occur only with a certain combination of wind direction, speed and duration. This is the principal conclusion of the paper. Such phenomena can also occur in winter, when neither wind speed nor air temperature play any role. In the present paper, this situation was not considered since, in the winter period, the arrival of warm water into the freshwater intake channel of Permskaya TPP does not play a fundamental limiting role.
The direction of the flow near the water surface is determined by wind exposure. If the wind is directed against the flow of the river and the duration of its impact is more than a day, then three-dimensional vortices arise, leading to a flow in the direction opposite to the main flow of the river in a 6-meter-deep layer from the surface. In this case, warm water may enter the intake channel designed to cool the thermal power plant systems. It was found that, during the unsteady operation of a hydroelectric station, the arrival of warm water to the intake channel of a power plant can be observed even under calm conditions.
Thus, the performed computational experiments showed the significant effect of the non-stationary nature of the hydroelectric power plant operation on the hydrodynamic regime in the upper pool of the reservoir and the peculiarities of water use by the facilities located near it.

Author Contributions

Conceptualization—T.L. and A.L.; methodology—T.L. and A.L.; numerical calculations—Y.P. and A.T.; analysis of the results—T.L., A.L., Y.P. and Y.L.; visualization—Y.P. and A.T.; writing—T.L., A.L., Y.P. and Y.L. All authors have read and agreed to the published version of the manuscript.

Funding

This research was funded by RUSSIAN SCIENCE FOUNDATION, grant No. 17-77-20093.

Conflicts of Interest

The authors declare no conflict of interest.

References

  1. Abbaspour, A.H.J.; Moghimi, P.; Kayhan, K. Modeling of thermal pollution in coastal area and its economical and environmental assessment. Int. J. Environ. Sci. Technol. 2005, 2, 13–26. [Google Scholar] [CrossRef] [Green Version]
  2. Madden, N.; Lewis, A.; Davis, M. Thermal effluent from the power sector: An analysis of once-through cooling system impacts on surface water temperature. Environ. Res. Lett. 2013, 8, 035006. [Google Scholar] [CrossRef]
  3. Hester, E.T.; Bauman, K.S. Stream and retention pond thermal response to heated summer runoff from urban impervious surfaces. J. Am. Water Res. Assoc. 2013, 49, 328–342. [Google Scholar] [CrossRef]
  4. Raptis, C.E.; Pfister, S. Global freshwater thermal emissions from steam-electric power plants with oncethrough cooling systems. Energy 2016, 97, 46–57. [Google Scholar] [CrossRef]
  5. Issakhov, A.; Mashenkova, A. Numerical study for the assessment of pollutant dispersion from a thermal power plant under the different temperature regimes. Int. J. Environ. Sci. Technol. 2019. [Google Scholar] [CrossRef]
  6. Alcamo, J.; Flörke, M.; Märker, M. Future long-term changes in global water resources driven by socio-economic and climatic changes. Hydrol. Sci. J. 2007, 52, 247–275. [Google Scholar] [CrossRef]
  7. Directive 2006/44/EC of the European Parliament. 2006. Available online: https://eur-lex.europa.eu/legal-content/EN/ALL/?uri=uriserv:OJ.L_.2006.264.01.0020.01.ENG (accessed on 4 May 2020).
  8. Van Vliet, M.T.H.; Franssen, W.H.P.; Yearsley, J.R.; Ludwig, F.; Haddeland, I.; Lettenmaier, D.P.; Kabat, P. Global river discharge and water temperature under climate change. Glob. Environ. Chang. 2013, 23, 450–464. [Google Scholar] [CrossRef]
  9. Ptak, M.; Sojka, M.; Kałuża, T.; Choiński, A.; Nowak, B. Long-term water temperature trends of the Warta River in the years 1960–2009. Ecohydrol. Hydrobiol. 2019, 19, 441–451. [Google Scholar] [CrossRef]
  10. Webb, B.W.; Nobilis, F. Long-term changes in river temperature and the influence of climatic and hydrological factors. Hydrol. Sci. J. 2007, 52, 74–85. [Google Scholar] [CrossRef]
  11. Ptak, M.; Sojka, M.; Choiński, A.; Nowak, B. Effect of environmental conditions and morphometric parameters on surface water temperature in Polish lakes. Water 2018, 10, 580. [Google Scholar] [CrossRef] [Green Version]
  12. Ling, F.; Foody, G.M.; Du, H.; Ban, X.; Li, X.; Zhang, Y.; Du, Y. Monitoring thermal pollution in rivers downstream of dams with Landsat ETM+ thermal infrared images. Remote Sens. 2017, 9, 1175. [Google Scholar] [CrossRef] [Green Version]
  13. Issakhov, A. Mathematical modeling of thermal process to aquatic environment with different hydro meteorological conditions. Sci. World J. 2014, 2014, 678095. [Google Scholar] [CrossRef] [PubMed]
  14. Issakhov, A. Mathematical modeling of the discharged heat water effect on the aquatic environment from thermal power plant. Int. J. Nonlinear Sci. Numer. Simul. 2015, 16, 229–238. [Google Scholar] [CrossRef]
  15. Miara, A.; Vorosmarty, C.J. A dynamic model to assess tradeoffs in power production and riverine ecosystem protection. Environ. Sci. Process. Impacts 2013, 15, 1113–1126. [Google Scholar] [CrossRef]
  16. Stewart, R.J.; Wollheim, W.M.; Miara, A.; Vörösmarty, C.J.; Fekete, B.; Lammers, R.B.; Rosenzweig, B. Horizontal cooling towers: Riverine ecosystem services and the fate of thermoelectric heat in the contemporary Northeast US. Environ. Res. Lett. 2013, 8, 025010. [Google Scholar] [CrossRef] [Green Version]
  17. Miara, A.; Cohen, S.M.; Macknick, J.; Vorosmarty, C.J.; Corsi, F.; Sun, Y.; Tidwell, V.C.; Newmark, R.; Fekete, B.M. Climate-Water Adaptation for Future US Electricity Infrastructure. Environ. Sci. Technol. 2019, 53, 14029–14040. [Google Scholar] [CrossRef]
  18. Issakhov, A.; Zhandaulet, Y. Numerical Study of Technogenic Thermal Pollution Zones’ Formations in the Water Environment from the Activities of the Power Plant. Environ. Model. Asess. 2020, 25, 203–218. [Google Scholar] [CrossRef]
  19. Durán-Colmenares, A.; Barrios-Piña, H.; Ramírez-León, H. Numerical Modeling of Water Thermal Plumes Emitted by Thermal Power Plants. Water 2016, 8, 482. [Google Scholar] [CrossRef] [Green Version]
  20. Hester, E.T.; Doyle, M.W. Human Impacts to River Temperature and Their Effects on Biological Processes: A Quantitative Synthesis. J. Am. Water Resour. Assoc. 2011, 47, 571–587. [Google Scholar] [CrossRef]
  21. Issakhov, A. Mathematical modeling of the discharged heat water effect on the aquatic environment from thermal power plant under various operational capacities. Appl. Math. Model. 2016, 40, 1082–1096. [Google Scholar] [CrossRef]
  22. McGuirk, J.J.; Rodi, W. A depth-averaged mathematical model for the near field of the side discharge into open-channel flow. J. Fluid Mech. 1978, 86, 761–781. [Google Scholar] [CrossRef]
  23. Park, S.W.; Chung, M.K. Prediction of 2-dimensional unsteady thermal discharge into a reservoir. J. Korean Soc. Mech. Eng. 1983, 7, 451–460. [Google Scholar]
  24. Lyubimova, T.; Lepikhin, A.; Konovalov, V.; Parshakova, Y.; Tiunov, A. Formation of the density currents in the zone of confluence of two rivers. J. Hydrol. 2014, 508, 328–342. [Google Scholar] [CrossRef]
  25. Lyubimova, T.; Lepikhin, A.; Parshakova, Y.; Lyakhin, Y.; Tiunov, A. The modelling of the formation of technogenic thermal pollution zones in large reservoirs. Int. J. Heat Mass Transf. 2018, 126 Pt A, 342–352. [Google Scholar] [CrossRef]
  26. Lyubimova, T.; Lepikhin, A.; Parshakova, Y.; Lyakhin, Y.; Tiunov, A. Application of hydrodynamic modeling in 2D and 3D approaches for the improvement of the recycled water supply systems of large energy complexes based on reservoirs-coolers. Int. J. Heat Mass Transf. 2019, 140, 897–908. [Google Scholar] [CrossRef]
  27. Faulkner, A.; Bulgin, C.E.; Merchant, C.J. Coastal Tidal Effects on Industrial Thermal Plumes in Satellite Imagery. Remote Sens. 2019, 11, 2132. [Google Scholar] [CrossRef] [Green Version]
  28. Pivato, M.; Carniello, L.; Viero, D.P.; Soranzo, C.; Defina, A.; Silvestri, S. Remote Sensing for Optimal Estimation of Water Temperature Dynamics in Shallow Tidal Environments. Remote Sens. 2020, 12, 51. [Google Scholar] [CrossRef] [Green Version]
  29. Vreugdenhil, C.B. Numerical methods for shallow-water flow. In Water Science and Technology Library; Kluwer Academic Publishers: Dordrecht, The Netherlands, 1994; Volume 13. [Google Scholar]
  30. Reference Manual “RiverFlow2D Two-Dimensional River Dynamics Model” August, 2016, Hydronia LLC. Available online: http://www.hydronia.com/riverflow2d (accessed on 4 May 2020).
  31. Launder, B.E.; Spalding, D.B. Lectures in Mathematical Models of Turbulence; Academic Press: London, UK; New York, NY, USA, 1972; 169p. [Google Scholar]
  32. Wu, J. Wind stress and surface roughness at sea interface. J. Geophys. Res. 1969, 74, 444–453. [Google Scholar] [CrossRef] [Green Version]
Figure 1. Morphometry of the considered section of the Kama reservoir. The brown rectangle shows the area of interest in the vicinity of Dobryanka town.
Water 12 01336 g001
Figure 2. Change in the discharge flow rate of water from the Kamskaya Hydroelectric Power Plant (HEPP) and the flow rate of water inflow into the Kama reservoir.
Water 12 01336 g002
Figure 3. A map of the morphometric peculiarities of the bottom of the Kama reservoir in the region of the Permskaya Thermal Power Plant (TPP). Red lines show the boundaries of the computational domain for three-dimensional modeling.
Water 12 01336 g003
Figure 4. Scheme of the computational domain. Computational grid. For sufficient visualization, the vertical size is increased by 40 times.
Water 12 01336 g004
Figure 5. The velocity vector field in the vicinity of Dobryanka town at 4 days, 13 h from the start of calculations, which corresponds to 1 h of the day (stock flow, calm conditions).
Water 12 01336 g005
Figure 6. The velocity vector field in the vicinity of Dobryanka town at 4 days, 1 h from the start of calculations, which corresponds to 1 h at night (back flows, calm conditions).
Water 12 01336 g006
Figure 7. Change in the velocity module in the area of the water intake channel of Permskaya TPP (blue line), in comparison with the change in discharge flow rate of water from the Kamskaya HEPP (green line) and in comparison with the velocity module at a constant discharge of water through the Kamskaya HEPP (red line).
Water 12 01336 g007
Figure 8. Temperature fields in the near-surface layer for southeasterly wind; the time from the start of calculations (t). The calculations were carried out for the period starting from midnight.
Water 12 01336 g008aWater 12 01336 g008b
Figure 9. The velocity vector field in the horizontal plane near the surface (a) and at a depth of 6 m (b) for the southeasterly wind. The time after the start of calculations is 20 h.
Water 12 01336 g009
Figure 10. Temperature fields in the surface layer for northwesterly wind; the time from the start of calculations (t). The calculations were carried out for the period starting from midnight.
Water 12 01336 g010aWater 12 01336 g010b
Figure 11. Temperature fields in the near-surface layer for calm conditions; the time from the start of calculations (t). The calculations were carried out for the period starting from midnight.
Water 12 01336 g011aWater 12 01336 g011b
Figure 12. The temperature distributions in depth at different verticals for calm conditions at t = 97 h.
Water 12 01336 g012
Figure 13. Temperature fields for Wind SE 8 m/s for 95 H. (a,c,e)—under the influence of a discharge from HEPP, regular mode in a changing discharge of water; (b,d,f)—under minimum influence of a discharge from HEPP, continuous discharge mode.
Water 12 01336 g013aWater 12 01336 g013b
Table 1. The average monthly values of air temperature according to observations at a meteorological station in Dobryanka.
ValueMonth
IIIIIIIVVVIVIIVIIIIXXXIXII
Cp. T, °C−13,0−9,6−3,02,610,414,816,715,69,51,7−6,0−9,7