1. Introduction
Water deficit is one of the most serious problems of the modern world. However, apart from water shortage, water quality is a high priority. Eutrophication of water is a common problem, especially for inland surface waters [
1]. This is because the quality of lake waters, particularly those located in urban areas and used for recreational purposes, is generally deteriorating. The water of such lakes is often characterized by low transparency due to the presence of cyanobacterial blooms (often potentially toxic), oxygen deficits and high concentrations of nutrients in the over-bottom layers [
2,
3,
4,
5]. To improve the ecological status of such lakes and enable their use for various purposes, both protective measures in the catchment area and restoration treatments within them are implemented [
4,
6,
7,
8,
9,
10,
11]. The Water Framework Directive requires the good status of water bodies to be achieved by 2027 [
12]. This goal is possible through the application of several complementary methods of lake restoration [
13,
14,
15] and protection against runoff from the adjacent surroundings [
16]. One approach is sustainable restoration, based on the simultaneous application of several pro-ecological solutions, which in a complementary way prevent the formation of feedback in the ecosystem. These methods, used to improve water quality, stimulate the natural regulatory capacity of the lake ecosystem without changing it radically [
17,
18], but by influencing selected processes like nutrient cycling, submerged macrophyte succession and through changes in food-web relations and in the composition of communities of organisms [
19,
20,
21,
22]. One of the lakes in which it was implemented was the hypereutrophic, urban Swarzędzkie Lake [
23,
24,
25,
26]. To return a lake to a state of very good condition is often impossible due to its excessive degradation and difficulties in carrying out the restoration process. A common problem is also the short-term effect of the applied treatments due to the continuous nutrient loading from external sources. Another reason for the lack of visible effects of water quality improvement is too short period of restoration treatments or their reduction before the ecosystem reaches a state of equilibrium [
27,
28].
The aim of the study was to determine the impact of a limitation of restoration treatments three years after the implementation of sustainable restoration on the water quality in Swarzędzkie Lake. The following hypothesis was formulated: limiting the restoration measures before the lake’s ecosystem is balanced leads to a return to the state before restoration.
2. Materials and Methods
Swarzędzkie Lake (52°24′49″ N, 17°03′54″ E) is a shallow, urban lake of post-glacial origin (
Figure 1). It is located in the northwestern part of Swarzędz Town, on the border with the City of Poznań, on the course of the River Cybina, which is a right-bank tributary of the River Warta. The total length of River Cybina is 41 km and its catchment area is 195.5 km
2. This catchment is typically agricultural, as 77% is covered by farmland, 17% by forest, 4% by buildings and the remaining 2% by water [
29]. The direct basin of Swarzędzkie Lake is 45% covered by forest, 31.8% by meadows and pastures and 21.7% by built-up areas. Farmland covers only 1.3%. The altitude of the lake is nowadays 70.9 m above sea level, and its natural level has been dammed 1.15 m by a weir at the outflow about 200 years ago. The water level on the weir is not regulated, so it changes over the year in a range close to natural—less than half a meter. The highest level is observed in early spring and the lowest in late summer and autumn. Its total area is 93.7 ha, free water surface is 80.4 ha, average depth 2.6 m and maximum depth 7.2 m. The lake is elongated in shape, narrowing from half its length towards the outflow. The maximum depth of the lake is in the wider part, while the narrower part does not exceed 2 m depth (
Figure 1). It is a polymictic lake, as no hypolimnion is formed in summer [
30,
31]. Swarzędzkie Lake receives a supplementary supply from the waters of the small Mielcuch Stream, which drains rainwater and some sanitary sewage from illegal discharges. The inflows (Cybina and Mielcuch) bring water throughout the year and the discharge from the lake is over a dam. The mean flow rate of the River Cybina flowing into the lake is 0.468 ± 0.43 m
3s
−1, for the Mielcuch Stream 0.037 ± 0.05 m
3s
−1, and for the River Cybina at the outlet of the lake 0.508 ± 0.46 m
3s
−1 [
29]. The groundwater supply to the lake was not analyzed due to its small expected share in the total lake balance and in the balance of nutrients.
The lake was a direct receiver of sewage from Swarzędz Town until 1991, after which time it was diverted to a sewage treatment plant and after treatment to the River Warta [
23,
31].
Research on the water quality of Swarzędzkie Lake conducted from the 1950s shows that it deteriorated significantly because of many years of excessive inflow of biogenic compounds from external sources [
29,
31]. More recent research has shown that internal phosphorus loading from bottom sediments plays a significant role in the appearance of water blooms of cyanobacteria in this lake [
32]. As a consequence, all recreational use of the lake was stopped [
23,
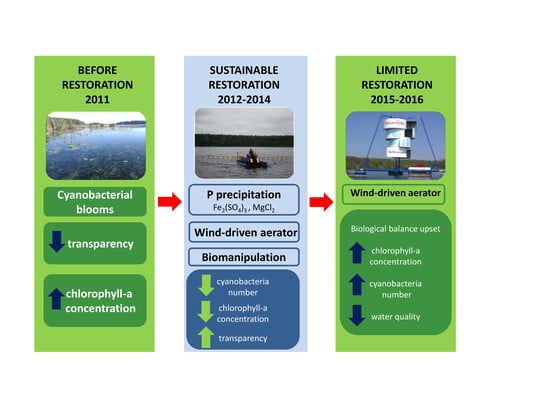
33]. In order to improve water quality, in 2012–2014, sustainable restoration was implemented, i.e., a program of restoration measures based on several methods. The first of them was aeration of the deoxygenated water in the deepest part of the lake during summer with the use of a wind-driven aerator, without disturbing the thermal stratification [
34,
35]. The second was phosphorus inactivation with chemicals used with specialized mobile equipment [
19]. Iron sulphate (Fe
2(SO
4)
3) and magnesium chloride (MgCl
2) were applied 5–9 times per year (19 times in total) in small doses—each time about 2–5 kg ha
−1. The third method was biomanipulation, which consisted of stocking the lake with pike and pikeperch fry (5 times) and catching an excessive population of planktivorous fish (mainly cyprinids—roach
Rutilus rutilus (L.) and bream
Abramis brama (L.)) [
23,
24,
25,
26,
36]. Unfortunately, for financial reasons, in the years 2015–2016, the restoration treatments were limited to only one method, i.e., aeration with a pulverizing aerator [
37].
The study of water quality changes in Swarzędzkie Lake was conducted in the years 2011–2016, i.e., in the period before restoration (2011) (BR), during sustainable restoration (2012–2014) (SR) and after its limitation (2015–2016) (LR—limited restoration). Water was sampled at the deepest place of the lake in the water column at monthly intervals from April to September each year (
Figure 1). Water temperature, pH, conductivity and dissolved oxygen concentration were measured in situ in a depth profile, using an YSI 610 DM meter, and water transparency using a Secchi disk. Concentrations of particular forms of nitrogen (ammonium, nitrite, nitrate and organic) and phosphorus (soluble reactive phosphorus and total phosphorus) were determined. Water temperature, dissolved oxygen and chlorophyll
a were analyzed every 1 m (from the surface layer to a depth of 6 m) and concentration of nutrients, pH, conductivity and suspended matter from the surface (0m) and bottom (6 m). The concentration of nutrients was determined by using spectrophotometric methods. For ammonium nitrogen (N-NH
4) by method with Nessler’s reagent, for nitrate nitrogen with sodium salicylate (N-NO
2), for nitrite nitrogen (N-NO
3), with sulphanilic acid, for soluble reactive phosphorus (SRP) with ascorbic acid and for total phosphorus (TP) with ascorbic acid after mineralization. The concentration of organic nitrogen was determined by Kjeldahl’s method. These analyses were done according to Polish Standards [
38].Chlorophyll
a concentration (spectrophotometric method with 90% acetone extraction) and total suspended solids (weight method, samples filtered using GF/C and dried at 105°C) were also analyzed. The results obtained in 2011 (BR) and 2012–2014 (SR) were presented in two previous publications [
23,
25]. They were also used for comparison with the results from 2015–2016 (LR), which are presented and discussed in this article (
Table S1). Trophic conditions were estimated with criteria proposed by Carlson [
39] based on summer values in the epilimnion for transparency (TSI SD), chlorophyll
a (TSI ChL) and total phosphorus (TSI TP). Statistical calculations were made with STATISTICA version 10.0 software. To confirm the significance of differences between the analyzed variables in time, a non-parametric test was used, i.e., the Kruskal–Wallis test. The Pearson coefficient was used to determine relationships between variables.
The area of the direct catchment of the Swarzędzkie Lake was determined by means of vectorization through the analysis of the relief on the topographic map 1:10,000. The catchment cover structure was developed with the use of the digital National Database of Topographic Objects (BDOT) by calculating the area of individual land cover divisions within the direct catchment area in the QGIS (version 3.4, license GNU GPLv2,
http://qgis.org) geoinformation software.
3. Results
The temperature of water at the surface of Swarzędzkie Lake ranged from 10.4 °C (April 2015) to 23.6 °C (July 2016), while the mean was 18.5 °C in the period LR. The temperature was lower than during the period of SR when it reached a maximum of 27 °C in 2013 and an average of 19.97 °C. The average temperature of water above the bottom during LR was 13.9 °C in 2015 and 12.5 °C in 2016,which was similar to previous years (
Figure 2a). There were no significant differences between temperature data in successive years of research either in the surface or bottom layers (Kruskal–Wallis test
p>0.05). The greatest variation of water temperature distribution in depth profile occurred in 2013. It is worth emphasizing that aeration, as one of the restoration methods, did not disturb the thermal stratification in the lake. There was also no increase in water temperature in the bottom zone, in either SR or LR as a result of aeration (
Figure 2a).
The maximum oxygen content in LR at the surface increased to 16.4 mgO
2 L
−1 in summer of the last year of study compared to the period of SR when it did not exceed 13.4 mgO
2 L
−1 (
Figure 2b). In the case of bottom waters, oxygen deficits were noted in BR, and average oxygenation during summer (June–August) was only 0.19 mgO
2 L
−1. During restoration treatments, it systematically increased in summer from 2013 (on average 0.51 mgO
2 L
−1) to 2015 (0.86 mgO
2 L
−1). The anaerobic periods were shorter (
Figure 2b). In turn, in 2016 there was a slight deterioration of aerobic conditions above the bottom in summer (on average 0.73 mgO
2 L
−1). However, no significant differences in dissolved oxygen concentrations were found between studied years in either surface or bottom layers (Kruskal–Wallis test
p>0.05).
The transparency of water in Swarzędzkie Lake ranged from 0.55 m to 1.00 m, and the mean was 0.75 m in LR. The minimum value was noted in July 2016 and the maximum in April 2015. Comparing the average water transparency with the value from the period SR (1.01 m), it clearly decreased. However, it was similar to that observed in BR (0.74 m) (
Figure 3a).
The concentrations of chlorophyll
a of Swarzędzkie Lake increased almost 2-fold in the years 2015–2016 (it was on average 71.1 µg L
−1) in comparison to the SR period (on average 39.5 µg L
−1). The maximum value was recorded in the first year of the LR period in September—112.3 µg L
−1. However, this value was still lower than those recorded in BR (on average 106.7 µg L
−1, maximum 211.8 µg L
−1) (
Figure 3b). There were statistically significant differences between some of the studied years, both in the case of chlorophyll
a (Kruskal—Wallis test
p = 0.005 for 2011 and 2012) and water transparency (
p = 0.02 for 2012 and 2016).
During LR, the average content of total suspended solids at the surface of Swarzędzkie Lake increased to 16.9 mg L
−1 in comparison to the SR period when it reached 13.0 mg L
−1. The maximum value of 22.3 mg L
−1 was recorded in 2016. However, this value was lower than that noted in BR (37.0 mg L
−1) and slightly higher than that observed in SR (21.0 mg L
−1). A similar tendency was found in the bottom zone. The values from the LR period (mean 8.6 mg L
−1) were not as high as those observed during the period of BR (mean 14.7 mg L
−1) and only slightly higher than in SR (mean 7.9 mg L
−1) (
Figure 4a). Statistically significant differences of suspended matter between the studied years were noted only in the surface layer (Kruskal–Wallis test,
p = 0.017).
The maximum value of pH in LR at the surface of the Swarzędzkie Lake was 8.89 in summer of the last year of research. It was lower in SR, reaching a maximum of 8.58, and higher in BR, up to 8.93. In the water above the bottom, it reached a maximum value of 8.25 in BR, then decreased to 7.72 (2014) during SR and increased again to 8.36 during LR (
Figure 4b). Statistically significant differences in pH were noted only at the surface layer (Kruskal–Wallis test,
p = 0.006).
Throughout the LR period, higher values of conductivity were recorded in the bottom waters of the Swarzędzkie Lake than on its surface. The average conductivity in the surface layer in 2015 was 612 µS cm
−1 and above the bottom 711 µS cm
−1. This was similar in the next year at the surface (609 µS cm
−1) but clearly higher above the bottom (760 µS cm
−1). Nevertheless, it was still lower compared with the SR period, especially in 2013, when it was 694 µS cm
−1 at the surface and 929 µS cm
−1 near the bottom (
Figure 4c). Statistically significant differences between the studied years were found only for the conductivity at the bottom layer (Kruskal–Wallis test,
p = 0.002).
The average concentration of phosphates at the surface layer in LR was similar to results observed in the last year of SR (0.03 mgP L
−1), reaching values lower than in the years 2011–2013. On the other hand, in waters above the bottom during SR, the concentration of phosphates initially increased, but in the following years, a downward trend was observed. This trend was still present in 2015 (average 0.33 mgP L
−1), but in 2016 there was already an increase in concentrations of this form of phosphorus, to an average 0.56 mgP L
−1 with a maximum of 1.2 mgP L
−1 in September (
Figure 5a,b). Similar variability was noted for total phosphorus. During the LR, the average concentration of this nutrient at the surface increased to 0.11 mgP L
−1 in the last year of research, reaching a maximum value of 0.24 mgP L
−1 in September. Above the bottom, the average concentration of total phosphorus clearly increased to 0.63 mgP L
−1 in 2016. The maximum concentration was also found in September—1.35 mgP L
−1 (
Figure 5a,b). No significant differences were found either for phosphates or total phosphorus between the studied years for the surface and bottom layers (Kruskal–Wallis test
p>0.05).
Considering the share of individual forms of nitrogen, a clear advantage of ammonium was found in the bottom zone of the Swarzędzkie Lake. During the LR period, its average concentration in 2016 increased by 1.5-fold to 5.63 mgN-NH
4 L
−1, compared to the last year of SR, i.e., 3.79 mgN-NH
4 L
−1. The highest values were noted at the end of summer or in early autumn, especially in the last year of the study. In the surface layer of the lake, the values were much lower and fairly uniform, ca., 0.9 mgN-NH
4 L
−1. However, the average concentration of ammonium in 2016 increased and reached 1.12 mgN-NH
4 L
−1 (
Figure 6a).
In the case of nitrates, a similar average concentration was observed in 2015–2016. In the surface layer it was about 0.60 mgN-NO
3 L
−1 and above the bottom 0.67 mgN-NO
3 L
−1 (
Figure 6b). These values were similar to those recorded in 2014, and at the same time much lower than in the year before restoration, when they reached an average of 1.42 mgN-NO
3 L
−1 at the surface and up to 1.38 mgN-NO
3 L
−1 at the bottom. The highest concentrations were found in spring (April), and they were clearly lower in the following months. No significant differences were found for individual forms ofnitrogen between the studied years (Kruskal–Wallis test
p>0.05).
The average concentration of organic nitrogen at the surface in the first year of LR was 1.79 mgN L
−1, and in the second year, it increased to 1.92 mgN L
−1. These values were close to the average recorded in the last year of SR (1.88 mgN L
−1), but definitely lower than in BR (3.17 mgN L
−1) (
Figure 6c). In the bottom zone, the concentration of organic phosphorus ranged from 0.99 mgN L
−1 to 1.16 mgN L
−1 in LR. These values were much lower than those observed in the BR period, but at the same time, higher than those found in the first years of SR (
Figure 6c). Statistically significant differences were found between the studied years for both the surface and bottom layers of the lake (Kruskal–Wallis test
p < 0.05).
The average concentration of total nitrogen in the surface layer reached a similar value in LR and ranged from 3.33 to 3.63 mgN L
−1. These values were similar to those observed in the last two years of SR and are clearly lower than in BR (5.50 mgN L
−1) (
Figure 6d). The dominant form in BR was organic nitrogen, in SR mineral nitrogen and in LR the organic form slightly prevailed again. In the bottom layer, a gradual increase in the average concentration of total nitrogen from 5.81 mgN L
−1 in 2015 to 7.37 mgN L
−1 in 2016 was observed during LR. A similar value was recorded in BR (7.17 mgN L
−1). However, it was higher than during SR (
Figure 6d). Nitrogen was the dominant form in water near the bottom throughout the research period. Significant differences in the concentration of total nitrogen were noted between the studied years only at the surface layer (Kruskal–Wallis test,
p = 0.01).
The ratio of total nitrogen to total phosphorus at the surface layer of Swarzędzkie Lake was on average 68.4 in BR (
Table 1). During the SR period, it first significantly decreased to 20.3 (in 2012), and then increased almost 3-fold in subsequent years (in 2016). Similar variability was observed in the bottom zone, except for the last year of the study, when it significantly decreased. At the surface layer, the lowest ratio (9.3) was found in the period June–September 2012–2013. During summer 2014–2015, the N:P ratio did not reach values lower than 30. In turn, in the last year of the study, it again decreased during summer to 9.8 (
Table 1). In addition, statistically significant differences in the surface layer between data from subsequent years were found (Kruskal–Wallis test
p = 0.046).
Trophic state index by Carlson indicated that the lake was hypereutrophic in BR. In SR, the values of the index were lower, and the lake was classified as eutrophic. However, the lake returned to hypereutrophic conditions in the second year of LR (
Table 2).
4. Discussion
Sustainable restoration is a non-aggressive way to improve water quality in a lake without drastic changes in most of the biotic elements of the ecosystem. The effect of improving water quality, however, does not occur immediately but requires a long period of time. The aim of the methods that are used is to restore the balance in the ecosystem so that the effect of improving water quality will be permanent [
19,
20,
21,
22,
40]. One of the methods used in Swarzędzkie Lake was the aeration of deoxygenated bottom layers using a wind-powered aerator [
34]. Although the device is intended for bottom zone water, which is aerated in the atmosphere and discharged again to the bottom, this did not lead to an increase in the temperature of the overbottom waters, which could accelerate nutrient-removal processes and increase the release of nutrients from bottom sediments [
41]. Thus, the use of pulverization aeration as one of the restoration methods did not disturb the thermal stratification.
A positive effect of improving the water transparency of Swarzędzkie Lake was observed during the SR in comparison to the BR [
25,
26,
37]. In turn, limiting the treatments resulted in a decrease of water transparency in LR. Thus, oxygenation with a pulverizing aerator alone was not enough to limit the proliferation of phytoplankton, which primarily contributed to a marked reduction of transparency. The concentration of chlorophyll
a also increased during the LR period compared to the value from the SR. In addition, a clear negative relationship between chlorophyll
a and transparency was found (
Figure 7a). This was also evidenced by the changes in the phytoplankton composition of Swarzędzkie Lake. During the SR period, a marked decreased in cyanobacteria abundance and simultaneous proliferation of chlorophytes, chrysophytes and cryptophytes were observed. The total biomass of phytoplankton decreased by half compared to the year before restoration [
22]. In turn, during the LR, a renewed increase in the share of cyanobacteria was noted, but it was still lower than in the BR period [
24,
25,
26,
37]. Changes in pH, as well as the content of suspended matter in water also indicated a decrease in the intensity of primary production during SR and its subsequent increase during LR. This is due to the dominance of suspended matter by phytoplankton, as evidenced by the significant relationship between chlorophyll
a concentration and total suspended solids (
Figure 7b). However, as in the case of chlorophyll
a, the pH and seston values recorded in the LR period were still slightly lower than in the BR period.
Changes in water oxygenation in the depth profile of Swarzędzkie Lake were caused by the action of the aerator (above the bottom layer) and the growth of phytoplankton (in the epilimnion). The aim of the implementation of aeration as one of the restoration methods was to improve oxygen conditions in the bottom area and thus increase redox potential, which limits the internal phosphorus supply from bottom sediments [
4,
19,
42]. It contributed to shortening anaerobic periods by improving oxygenation in the lake’s deeper zone. This was visible both in the SR period and in the first year of the LR. In addition, a gradual lowering of phosphorus release was observed in subsequent years of SR [
43]. In the second year of LR, when the aeration method was used without additional treatments, changes in the composition and abundance of phytoplankton were observed, which caused an increase in the concentration of dissolved oxygen in the surface layers of water, while the additional supply of organic matter to hypolimnion caused more intensive oxygen consumption, which in turn reduced its concentration.
The treatments also affected changes in conductivity, especially at the bottom of the lake. During the first two years of restoration an increase was noted, which was caused by intensive consumption of organic matter accumulated in the bottom sediments as a result of improved oxygenation in this zone [
25]. In turn, in the next year of SR and the first of LR, a decrease in the value of this variable was already noted. This was caused by an increase in the sorption capacity of the sediments and a smaller internal supply [
43]. Limitation of treatments increased conductivity again above the bottom in the second year.
Sustainable restoration in Swarzędzkie Lake has been used to reduce the amount of biogenic compounds that contributed to excessive eutrophication [
25,
37,
43]. One of the most important elements contributing to the formation of blooms in degraded lakes is phosphorus, originating not only from external sources but also from internal loading from bottom sediments [
44,
45,
46]. As a result of phosphorus inactivation with small doses of chemicals, a gradual decrease in the concentration of this element (both SRP and TP) was observed, despite its increase in the initial phase of the SR period [
25], which was caused by intensive decomposition of organic matter by microorganisms at increased oxygen concentrations above the bottom. Using phosphorus inactivation as one of the restoration methods resulted in an increase in the redox-dependent sorption of phosphorus, which contributed to a decrease in the trophic state [
19,
42]. In turn, because of limited treatments and, most importantly, cessation of inactivation of phosphorus in the water column, the aim of which was to eliminate SRP available for phytoplankton, the concentrations of both forms of this element increased again. In the first year of LR the equilibrium effect was still achieved, but in the second year it was unfortunately disturbed. The increase in available phosphorus for algae contributed to the return of cyanobacteria blooms, which consequently increased the concentration of chlorophyll
a and reduced water transparency [
22,
37].
Thus, the deterioration of oxygen conditions in the last year of the study in the bottom zone contributed to an increase in phosphorus concentration, as confirmed by a significant relationship between the concentration of both forms of phosphorus over the bottom and oxygen concentration in this zone (
Figure 7c,d). It is associated with the release of phosphorus from the bottom after reducing iron compounds as a result of deoxygenation of bottom sediments [
4].
Implementation of restoration treatments in Swarzędzkie Lake was also intended to reduce the nitrogen available for algae, an excess of which is one of the factors contributing to the degradation of water bodies [
4]. The aerator operation activated the nitrification processes in the hypolimnion leading to the reduction of ammonium nitrogen concentrations, visible especially in the last year of SR [
25,
47]. A significant negative relationship was found between ammonium nitrogen and oxygen concentration over the bottom (
Figure 7e), which indicated a positive effect of aeration. The use of magnesium chloride was also important. Several doses of this chemical during the year in the SR period contributed not only to the inactivation of phosphorus but also to the binding of ammonium nitrogen and the formation of struvite (an insoluble magnesium ammonium phosphate MgNH
4PO
4·6H
2O). Therefore, elimination of inactivation treatments in LR caused an increase in the concentration of this form of nitrogen in the lake’s bottom zone.
In the case of nitrates, their concentration in the surface layer was the result of surface runoff, highest in the spring period [
48]. Their concentrations above the bottom were low, despite the activation of the nitrification process, due to simultaneous denitrification, active due to low oxygen concentrations. The content of organic nitrogen in the water of Swarzędzkie Lake in turn resulted from a decrease in the intensity of primary production in the lake.
The implementation of SR resulted in a significant decrease in the concentration of this form of nitrogen [
25], as well as its gradual increase in the LR period. This was also related to an increase in phytoplankton abundance in LR, as confirmed by the significant relationships between chlorophyll
a and organic nitrogen concentration, which proves that phytoplankton cells constitute an important share in the pool of organic nitrogen in the lake surface layer (
Figure 7f).
The TN:TP ratio was significantly higher than the Redfield ratio of 16, which may indicate a phosphorus limitation of primary production [
49]. Meanwhile, SRP has never been depleted, even in the surface layer of water, indicating the excess of nitrogen in the lake. The ratio of mineral forms of nitrogen and phosphorus probably better characterizes the effect of nutrients on phytoplankton production [
50]. However, the average value of this ratio in individual years of Swarzędzkie Lake research was even higher than TN:TP, which is associated with the inflow of high loads of mineral nitrogen from the agricultural catchment in spring. It was only in summer months (July–September) that this ratio decreased significantly, favoring the development of cyanobacteria. It was the lowest in 2013, amounting to around 15, which caused the cyanobacteria to return despite the restoration treatments. A clear increase in another two years to 43 greatly worsened the conditions for the cyanobacteria growth, and another reduction in 2016 to 25 favored their re-development.
The third of the restoration methods implemented in Swarzędzkie Lake during SR was biomanipulation, which contributed to an increase of cladocerans and a decrease of phytoplankton abundance, and the almost complete disappearance of cyanobacteria [
26]. Due to the lack of predatory fish stocking in LR, changes in zooplankton reverted and phytoplankton again began to be dominated by cyanobacteria [
37]. Study results indicate that SR was too short to achieve sustainable ecosystem improvement. The application of the same methods in the deeper Durowskie Lake, but over a longer period of time, resulted in visible results in the improvement of water quality, a reduction of cyanobacterial abundance, and a strong decrease of internal phosphorus loading [
20,
51].

 ,
, 


