Article

Using a PIV Measurement System to Study the Occurrence of Bursting in the Flow Over a Movable Scour Hole Downstream of a Groundsill

1
Department of Civil Engineering, National Chung Hsing University, Taichung 40227, Taiwan
2
Department of Civil Engineering, National Chiao Tung University, Hsinchu 30010, Taiwan
*
Author to whom correspondence should be addressed.
Water 2020, 12(5), 1396; https://doi.org/10.3390/w12051396
Submission received: 8 April 2020 / Revised: 6 May 2020 / Accepted: 12 May 2020 / Published: 14 May 2020
(This article belongs to the Section Hydraulics and Hydrodynamics)

Abstract

:
Generally, hydraulic structures are installed along with rivers in Taiwan to prevent erosion. The groundsill is one of the most common structures to protect the underlying riverbed. However, the occurrence of bursting during the process of scouring can intensify the disturbance of sediment in the bed, sometimes even causing hydraulic structures to collapse. This paper aimed to study the mechanisms of bursting, the effects of bursting, and the scouring exceedance probability of sediment movement. To study this topic, a particle image velocimetry (PIV) was used to measure the hydraulic characteristics of a scour hole under different flow conditions. The results showed that, firstly, the bursting and the sediment entrainment rate increased with time at the beginning. Secondly, when bursting occurred at the beginning stage of scouring, the averaged velocity of main flow was reduced by about 30% and the thickness of the riverbed was deepened by about 20%. Moreover, when scouring time was 15 min, at the location of maximum scouring depth, all the experimental groups carried the proximity values of the scouring exceedance probability that stuck to a range from 35% to 53% at the bursting stage. Therefore, the scouring exceedance probability of the bursting of the maximum scouring depth can be further applied to designs and to protect the foundation of hydraulic structures.

1. Introduction

In Taiwan, the hydraulic structure of the groundsill is frequently used to prevent lateral scouring and to protect riverbeds. To estimate the formation of scour holes of groundsills at their downstream sides, experiments under equilibrium conditions are usually made. However, in the real world, the process of scouring is often accompanied by the occurrence of bursting. Not only does bursting intensify the sediment disturbance of a bed, it can even cause damage to the foundation of a groundsill.
The bursting that occurs in a bed under turbulent flow transports sediment in the bed [1]. Models have been established to explore the relationship between bursting and sediment transport both in space and time, and it has been further illustrated that sediment transport mainly depends on bed-shear velocity [1]. Liang et al. [2] discussed the mechanisms of local scouring with the designed structure. They extensively reviewed the mechanisms, contributing factors, and equations in previous studies. They concluded that there were some limitations on investigating scouring in reality due to the complexity of the its process [2]. In order to obtain precise values during calculations, instantaneous velocities of near-bed and scouring variations of bed sediment can be measured by laser doppler anemometry. This study illustrated the interaction between the phenomenon of bursting and bed sediment transport [3]. The relation between spur and sediment scouring was also worth discussing. Bursting was generated quite frequently in the initial stage of the experiment, which led to the sediment, at the front end of the spur, continuously moving downstream with the flows. In addition, it was noted that the spur caused a concentration of flow, resulting in an increase of averaged shear stress and scouring depth in Nasrollahi et al.’s research [4]. Then, Mazumder et al. examined and compared the events of turbulent flow with spatial variation and turbulence among different types of separation areas, and they gained better insight into flow physics, as well as future model development and validation [5]. Keshavarzi et al. studied the bursting events around a bridge pier with a three-dimensional octant analysis to discuss the scouring process, sediment particles movement, and their relationships [6]. They demonstrated that the events of external sweep and internal ejection are the major cause of sediment transport. Similarly, Pizarro and Tubaldi surveyed the problems of scouring at the bridge foundation and discussed the literature in previous studies to provide multiple strategies and views for future research [7]. Bernd et al. simulated bridge scouring and then analyzed the relationship between the flow and critical velocities of sediment. Their results showed that bursting occurs frequently when the velocity is five times the critical velocity—however, there were no significant change in the shape of the bed [8].
It can be noted that bursting and particle sediments near riverbeds play important roles in the scouring process. Measurements of sediment scouring and its depth have been made in many studies. Regarding scouring processes, the formation of scour holes under clear-water conditions and the experimental results of horizontal current at low Froude numbers in fixed-bed and fine-grain moving beds were observed, and it was found that, at the junction of the fixed bed and the moving bed, the velocity gradient was much larger in the near bed area than at the bottom of the equilibrium scour hole. In other words, the magnitude of the velocity gradient affects the scour depth [9,10]. In addition, the process of the evolution of scour holes can be divided into four phases: an initial phase, a development phase, a stabilization phase, and an equilibrium phase [11]. In fact, the development of scouring is quite rapid, and the equilibrium phase can be reached in a very short time [12]. For large scale studies, a measurement system can be developed to improve efficiency and accuracy, and researchers have been performing experiments of the characterization of submarine sediments [13]. At the scale of laboratory spillway scouring experiments, the tail water depth has been found to affect the location of the hydraulic jump and the maximum scouring depth downstream of the structure [14,15]. Gaudio et al. examined the effects of bed sills without chutes or multi-stage drops in their landsides [16]. The distance between bed sills was varied in the case of steep or moderate slopes [17]. They also analyzed the scouring depth and the length of scour hole downstream of the bed sills with a steady flow for clear water [16,17]. The characteristics of the turbulent flow in the movable scour hole was studied, and it was demonstrated that the importance of instantaneous shear stress in the scouring process is significant in a weir or a grade-control structure with a particle image velocimetry (PIV) system [18]. The laser doppler anemometer (LDA) system has also been commonly adopted to measure the velocity in multiple dimension open channel flows. The distribution of eddy viscosity, mixing length, and turbulence intensities in multiple dimension open channel flow have also been examined [19]. Pagliara conducted experiments showing that downstream of a rock ramp, the maximum equilibrium scouring depth is related to the specific gravity, Froude number, and the slope of the rock ramp [20]. Lu et al. showed that approximately 90% of the maximum scour depth occurs within 5 h [21]. On this basis, 5 h was selected as the dividing time in this study. Overall, when observing the sediment transport and turbulent flow field at the bottom of a scour hole, it is helpful to understand the interaction between water and sediment, as well as the physical mechanism of the scour hole. Further discussion and research were carried out to find out how best to protect the stability of the foundation of a groundsill.
The following research aimed to investigate different factors that may affect the development of scouring. Regarding critical shear velocity, it can be essentially estimated via a given median diameter when temperature and particle density have slightly changed [22]. In a comprehensive examination of scour and bridge foundations, the critical launch speed of sediment in a bed was determined by the regression of the critical threshold velocity based on experimental data and a known water depth [23]. The flow field of a scour hole at the bottom of horizontal jets was also examined. These experiments were conducted by assuming that there was no head cut phenomenon, and the overall flow field was calculated by the numerical simulation and LDA. The results revealed that the slope of the front section of the scour hole was steeper than that of the back section [24]. In order to reduce the probability of errors for measuring free-water surfaces, laser scanning has been commonly adopted to get the free-water-surface profiles of hydraulic phenomena with turbulence [25]. This measurement method was proved to be a useful strategy to study turbulence, and many conventional methods have failed to examine the turbulence. Dodaro et al. measured variations in a scour hole downstream of a rigid bed in space and time using a three-dimensional laser flowmeter. The results showed the Reynolds stress to be convex-shaped, with the maximum occurring at the bed [26]. Guan et al. further developed a new transitional regime boundary equation as a function of the upstream Froude number and the ratio of the weir height to the tailwater depth [27]. The local scouring for submerged weirs upstream with different slopes were investigated. They examined the relationship between the averaged and maximum scouring depth. In addition, studies of partial scouring for submerged weirs downstream with different slopes and particle sizes have been carried out to determine safe designs of scouring coefficients [28,29].
In this study, scour hole experiments using a movable bed were carried out to examine the development of scour holes downstream of a groundsill. Two different slopes and three kinds of discharge rates were studied. PIV was used for measurement. The variation of the flow field and characteristics of the turbulence with the occurrence of bursting in the scour hole were also researched. Moreover, the bed sediment transport mechanism was affected by the instantaneous Reynolds stress pulsation. This concept was used for the statistical analysis of instantaneous Reynolds stress, and then the scouring exceedance probability was calculated to analyze the probability of full-section bed scouring [30]. Through the above analysis, a comparison of incidence variation at bursting and non-bursting is presented. In addition, a charge-coupled device (CCD) camera was used to record the whole scouring process so as to examine the correlation between the frequency of the occurrence of bursting and scouring.

2. Experimental Setup

After obtaining the global velocity field for the measured area by using a PIV system, the turbulent flow fields were analyzed. A sophisticated PIV system was used to further clarify the phenomenon of bursting. A high-speed photography method was adopted for PIV system in this study. The experiments were conducted by using Phantom Miro ex4 high-resolution digital camera with a resolution of 800 × 600 pixels, exposure times of 2–788 μs of the highest frequency array of 1265 Hz, and a Nikon 50 mm zoom lens of to take 600 photos in total per second. It is known that the part near a riverbed is measured with difficulty because the water is disturbed with some slight deviations caused by fluctuations and bubbles that usually cause errors in the PIV measurement. In conventional PIV measurements, lasers are predominantly used in PIV setups. However, there were some difficulties in directly applying this method to our movable bed experiments our movable bed experiments due to the scattering of particles. To reduce the particle scattering and produce reasonably uniform light, a sheet of soft light paper was attached on the back sidewall, and halogen lamps were used [18]. Black acrylonitrile-butadiene-styrene (ABS) particles were used as the seeding particles. The particle size ranged from 0.25 to 0.3 mm, and the density was 1.04 g/cm3. The image velocimetry was then adopted to analyze the moving trajectories of the black particles projected on the soft light paper.
A schematic representation of the movable bed experimental equipment is shown in Figure 1. The main component of the channel was the flume with a length of 17 m, a width of 0.6 m, and a depth of 0.5 m. It was noted that the slope of the flume could be adjusted within the range of 0%–15%. The main experimental reach consisted of a 2.67 m-long, 0.42 m-high movable bed where the PIV measurement system was implemented. The upstream end of the reach was located at x 0   = 11.48 m, as shown in Figure 1. In the experiments, water was pumped from pools using an outdoor pumping motor to a head tank at the front. After passing through the contracting rectification plate, the water flowed through the experimental zone. The material of the sidewall of the channel was transparent glass, which made the observation much easier and clearer.
The experimental setups were set up at Lung-En weir of the Toucian River, Hsin-Chu County, Taiwan. The experiments were conducted while considering the two independent variables of unit flow discharge (q) and bed slope (S). Flow discharges were selected on the basis of the Froude law with a length ratio and the slope of typical gravel bed rivers in Taiwan. The site was studied because the partial of Lung-En auxiliary weir was destroyed by Typhoon Aere in 2004. In addition, the reach in the Lung-En auxiliary weir is mainly covered by Alluvial fans, and much its sediment is obstructed by the groundsill of the upstream Zhongzheng Bridge. This has led to bedrock exposures and local scour downstream. The piers were built both upstream and downstream due to the establishment of a railway, a high speed rail, and a controlled-access highway. These constructions resulted in a complexity of hydraulic conditions near the weir and even increased its risk of destruction. Generally, there were turbulent flows in the bed in this experiment of the scouring downstream of the groundsill. Through the comparison between viscosity and gravity, the former factor had slight effects on the experiment. Thus, the influence of gravity was taken as an experimental condition, that is, the same Froude number was used for calculations. As stated above, the unit discharge corresponding to the return periods of 10, 20, and 100 years were calculated as q1 = 0.0167 m2/s (M1), q2 = 0.0283 m2/s (M2), and q3 = 0.0475 m2/s (M3), respectively, and had mild slopes. The other types of cases were S1, S2, and S3 with the same unit discharge corresponding to the return periods of 10, 20, and 100 years, respectively, to calculate when S = 0.015. The bed slope was based on the average bed slope of the middle and lower reaches of this river in Taiwan. The slopes were selected as S = 1% and S = 1.5% in order to fully explore changes in the discharge with space and time for both mild and steep slopes. Lastly, the particle size referred to the riverbed of Lung-En auxiliary weir at a scale of 1:50. A medium value of particle size D50 = 2.7 mm was adopted. Detailed information is shown in Table 1.

3. Results and Discussion

3.1. The Phenomenon of Bursting and It’s Occurrence Frequency

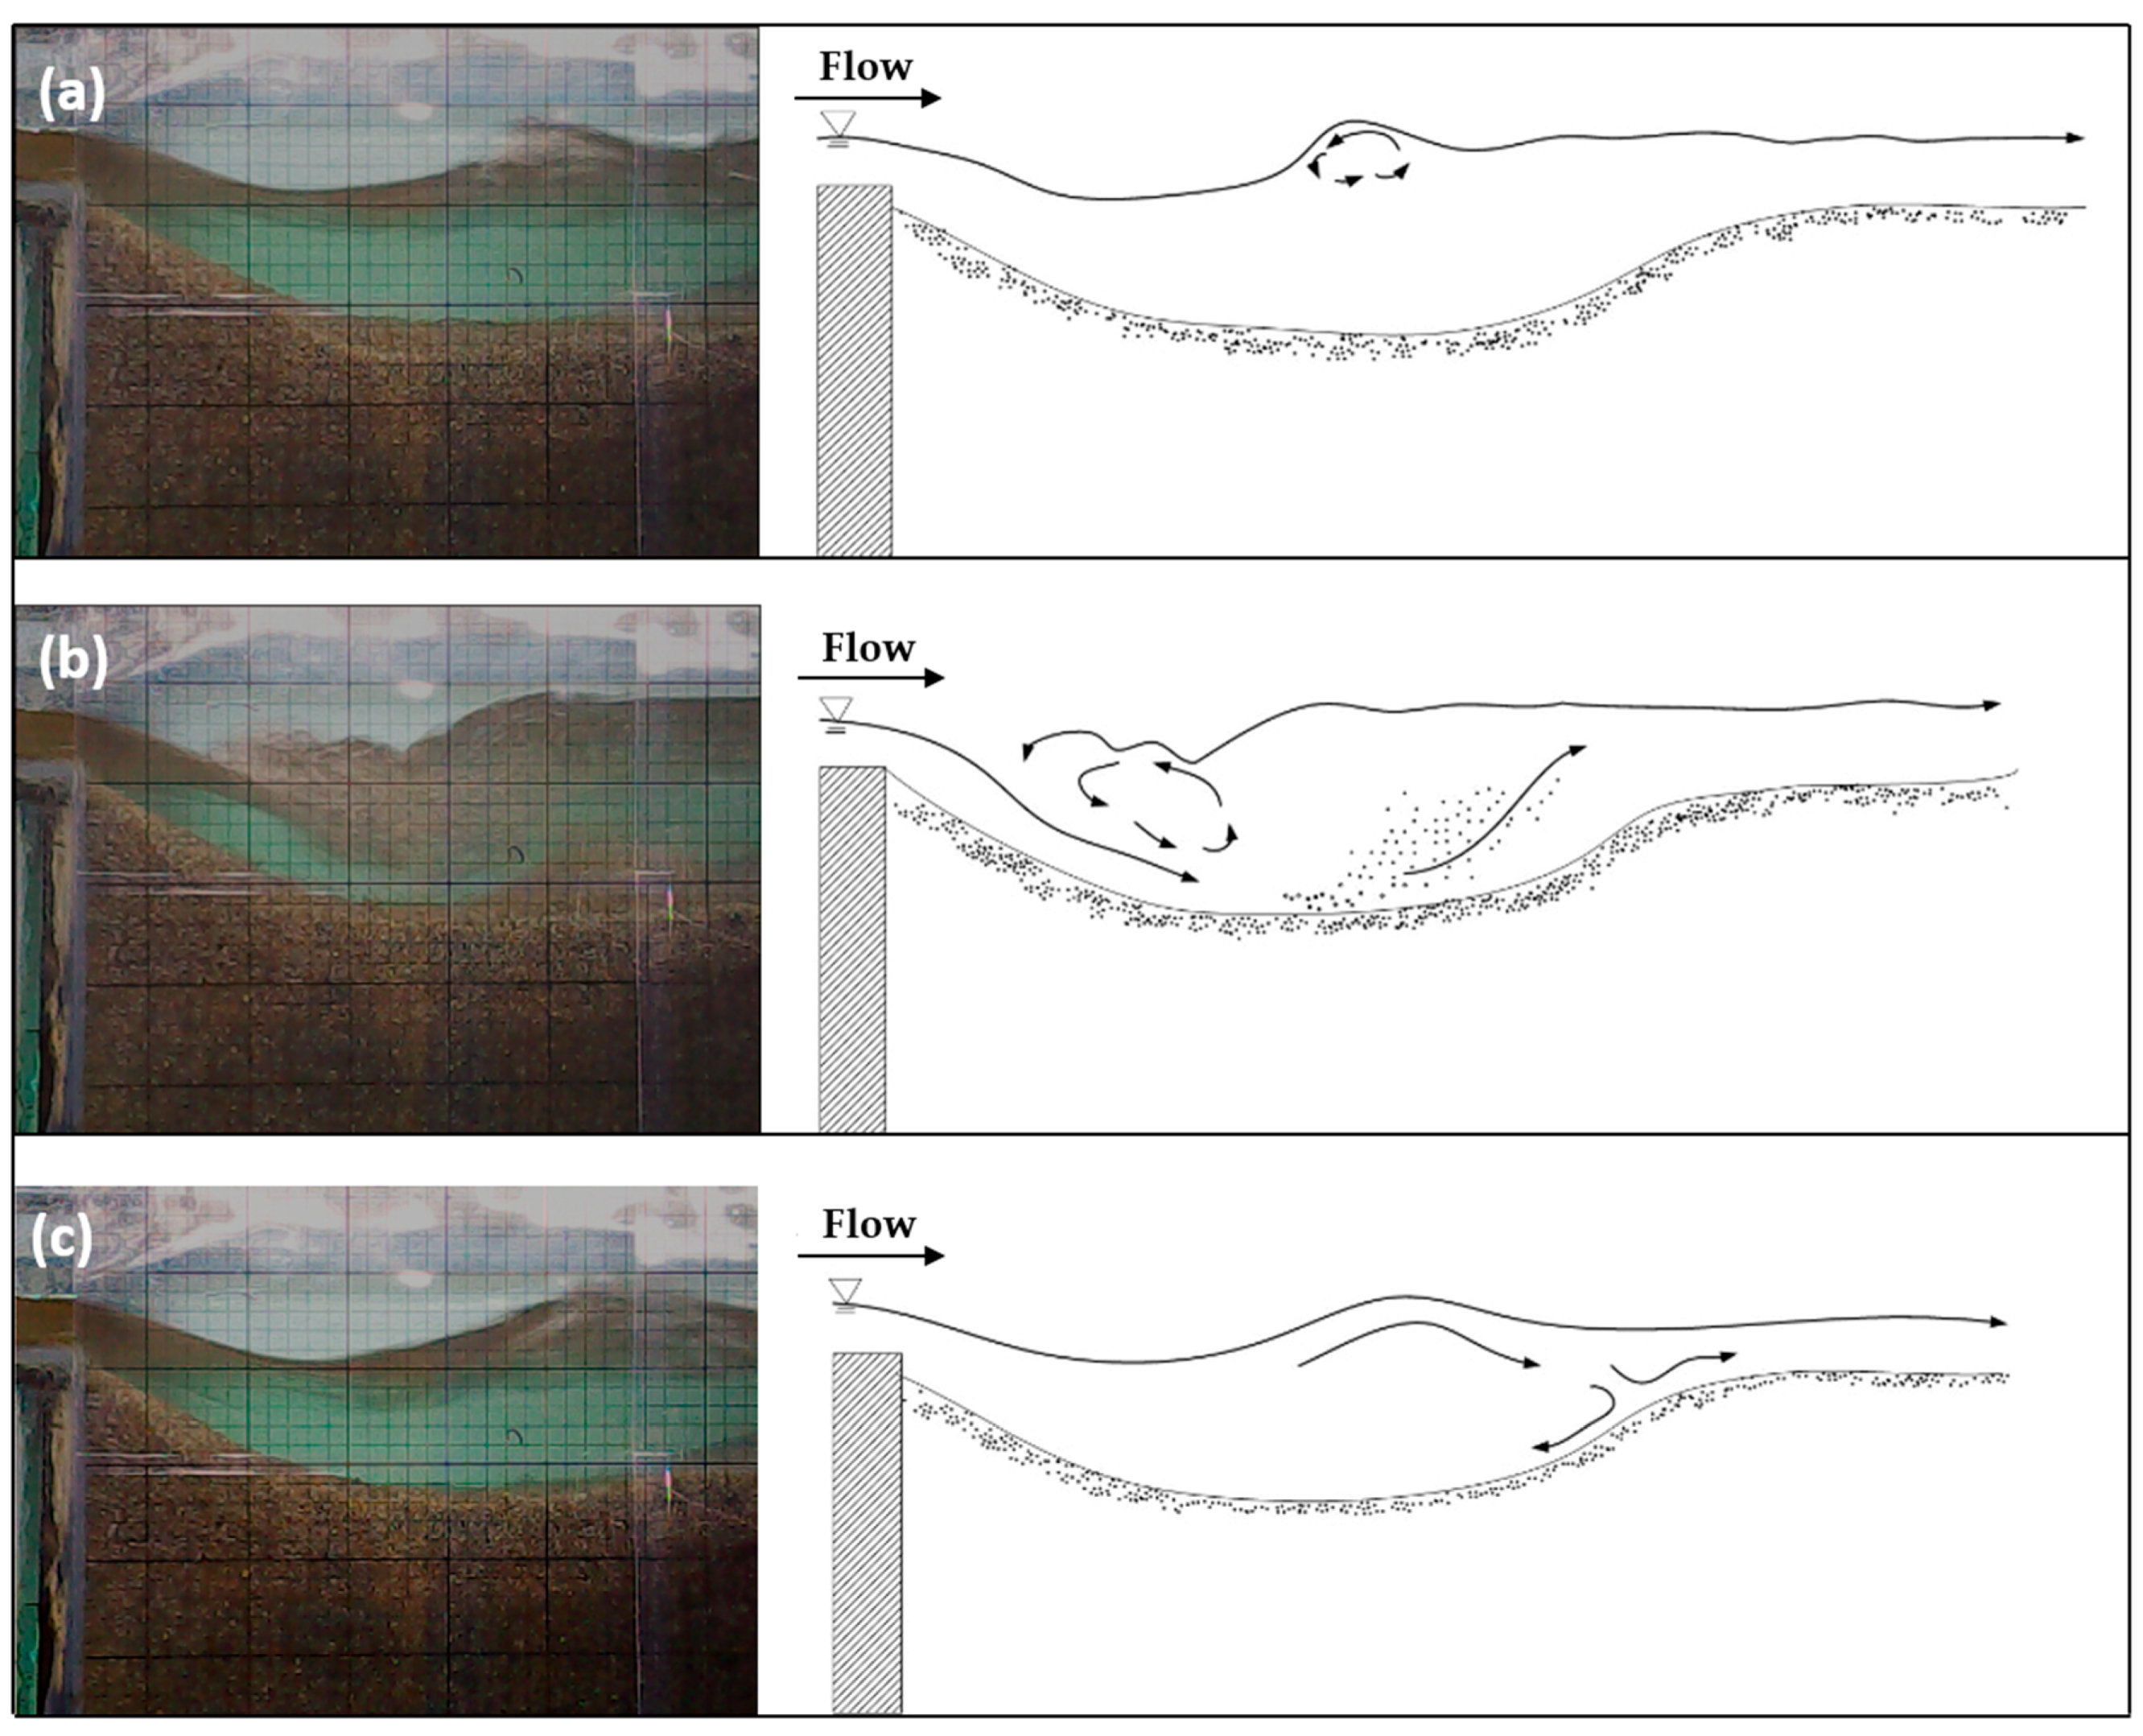
Much research work has been done to gain insight into the turbulent bursting phenomenon in riverbeds, such as the occurrence of bursting, scouring variation in riverbeds, and sediment transport [1,3,4,9]. This study further found that regarding bursting induced by high-speed submerged jets, as based on the finding of Shen and Lu [30], it is the instantaneous shear stress that moves the particles. Thus, this concept was adopted in the study to analyze the instantaneous Reynolds stress (τt). In order to verify the accuracy of the PIV measurement system, a preliminary test in a fully developed scouring zone to examine PIV measurement was implemented [18]. The results indicated that the PIV-measured profiles revealed good agreement with the curves presented by Nezu and Rodi [19], except that the region was very close to the water surface and had some noises. This may have been affected by lights from the outdoors. However, as our research focused on the flow field near the riverbed, the errors near the water surface could be ignored; case M2, which had a medium flow depth (H = 0.025 m), was selected for detailed observation in this study. The CCD camera recorded images of the scouring evolution of the downstream groundsill. The process of the evolution of scour holes can be divided into four phases: an initial phase, a development phase, a stabilization phase, and an equilibrium phase [11]. Lu et al. [18] conducted experiments to compare previous studies [31,32,33,34]. They indicated the turbidity of the flow was extremely high for the first 15 min, a very high scouring rate occurred during the first hour, and the scouring phenomenon almost reached equilibrium after 5 h. Thus, an initial phase of scouring within 15 min, a developing phase within 1 h, a stabilization phase of 5 h, and an equilibrium phase after 5 h was defined in this study. Figure 2 shows images of the non-equilibrium scouring process (T = 15 min). When the scour hole was in the developing stage, bursting occurred. At the beginning of the experiment, the scour hole was relatively small, and the nappe flow easily impacted the bed during the flow plume, so the scouring was rapid. The sediment was lifted within the water to form suspended solids that were directly transported away from the scour hole, as shown in Figure 2b. Moreover, as former bursting stopped until the next bursting occurred, the water flow in the scour hole was separated because of the impact on the bed by flow, which also served as a counter flow; see Figure 2c. In the initial stage of the development of the scour hole, bursting was found to be more frequent, and the duration of the occurrence of a single bursting event was shorter.
Figure 3 shows the evolution of bursting under the condition of near-equilibrium, with sediment lifted in the aforementioned water flow pattern. However, in the near-equilibrium stage, the maximum depth and length of the scour hole were relatively large, which led to the lifted sediment failing to be immediately transported away from the scour hole. Thus, the sediment was deposited as a small deposition mound, as shown in Figure 3c. When the bed was stable without lifted grains, the water flow directly impacted the deposition mound, thus creating a separated flow and then gradually sweeping sediment from the deposition mound into both upstream and downstream. Some of the sediment was backfilled to the deepest part of the scour hole upstream, and the rest was transported away with the main flow, as shown in Figure 3d. As the depth of the scour hole was deepened, the time required to be swept and to backfill the deposition mound was prolonged, as shown in Figure 3e.
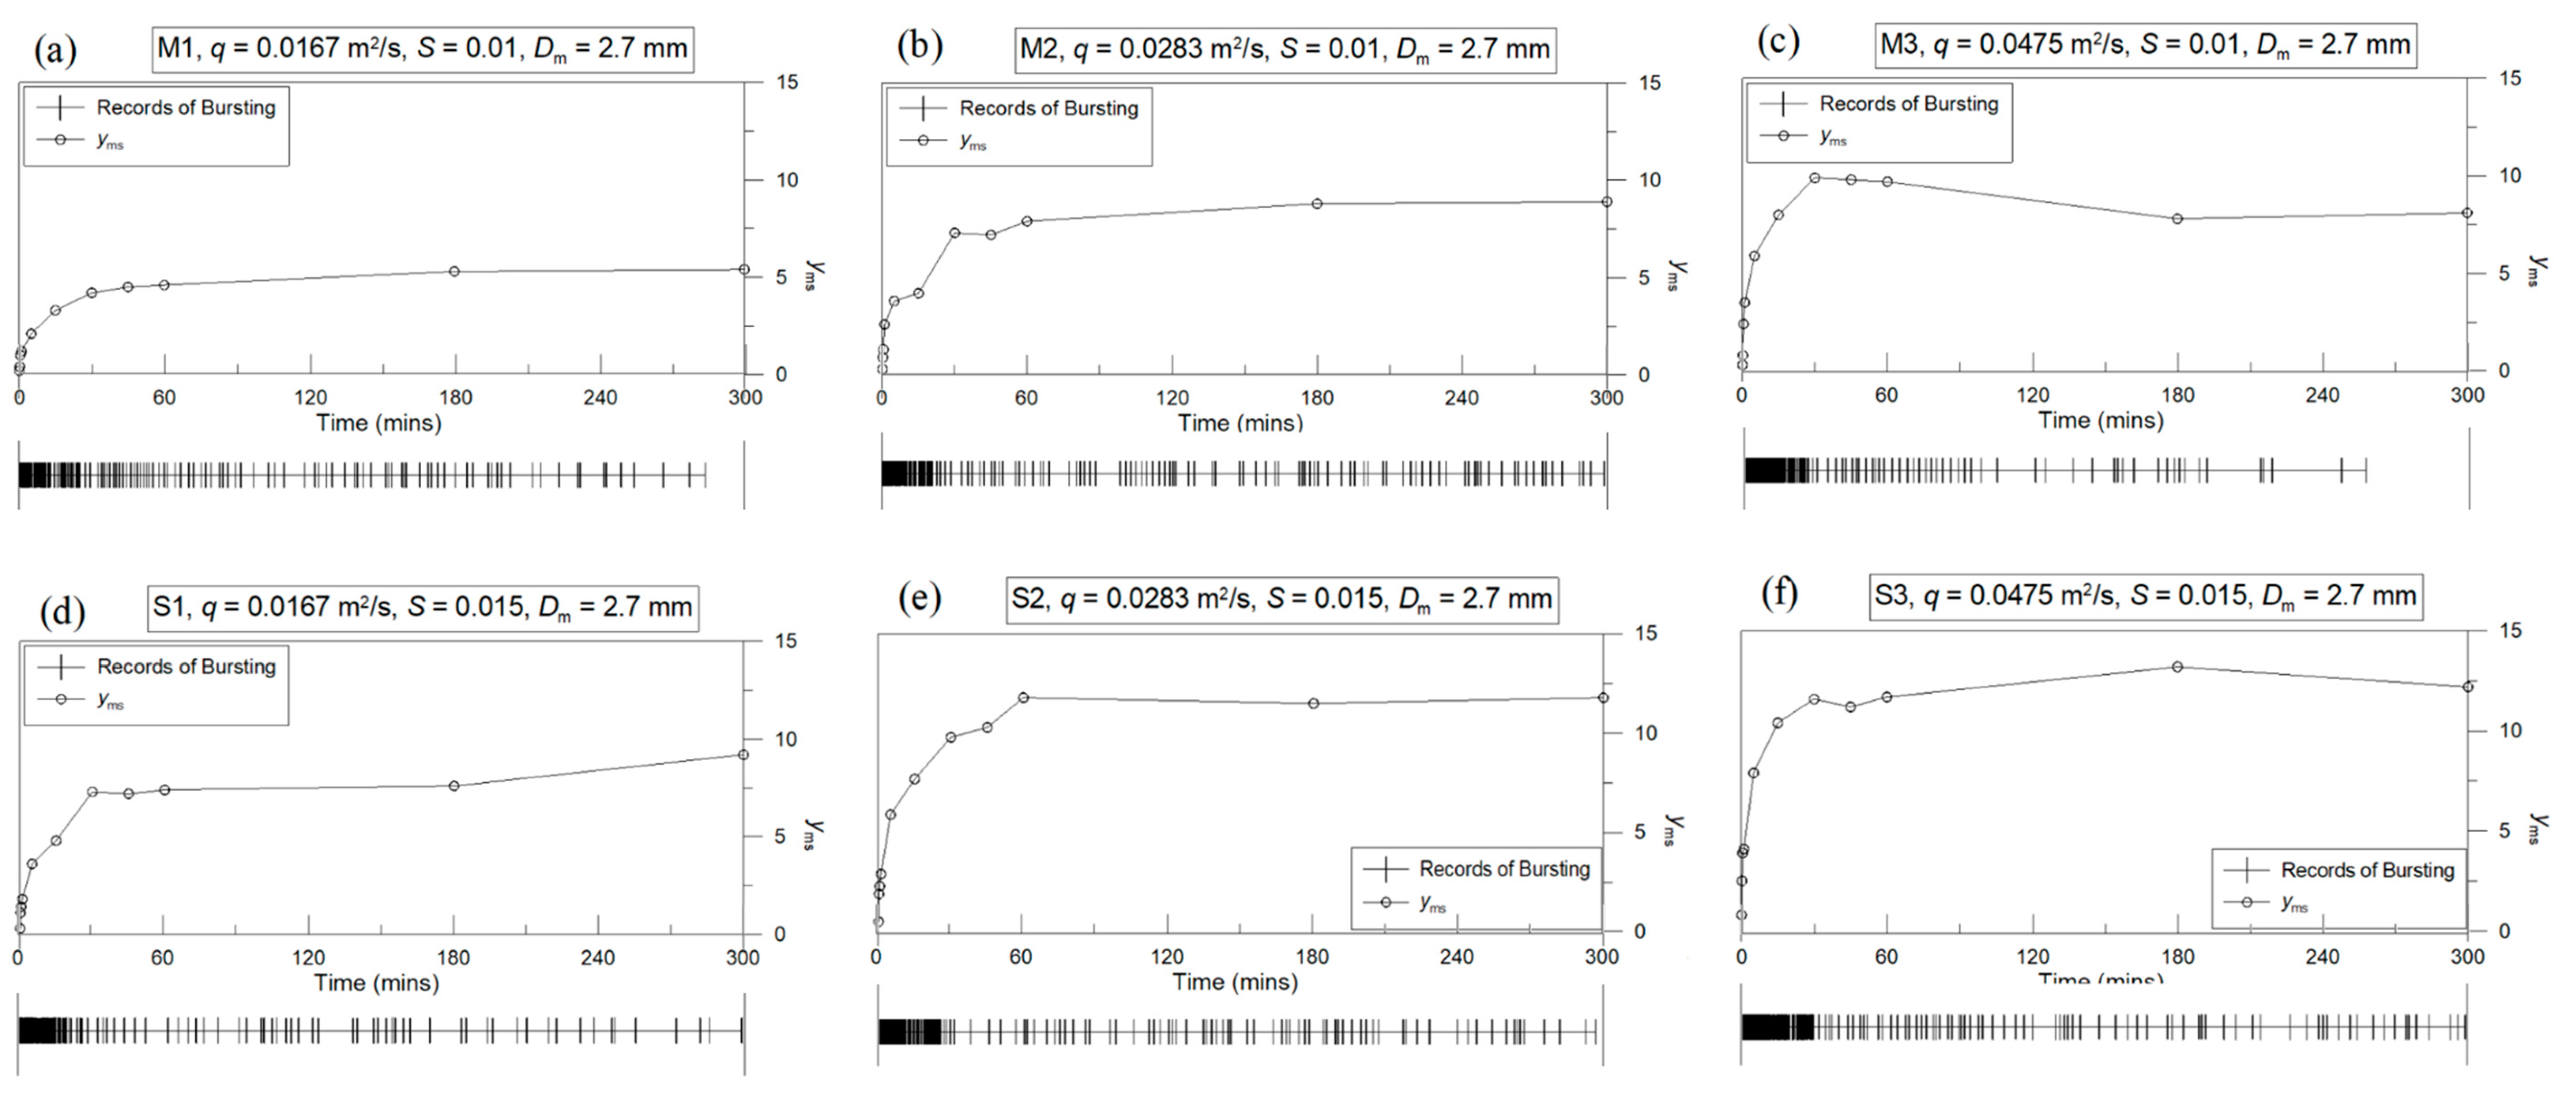
The relationship between the maximum scouring depth and the frequency of bursting occurrence in the CCD experiment is shown in Figure 4 and Figure 5. Figure 4 shows the data at a scouring time of T = 1 h. For a fixed slope, as the discharge increased, bursting occurrence could be maintained for a longer time. Taking the M1 and S1 groups as examples, the comparison with conditions of fixed discharge showed that the duration of the frequent bursting was longer in the S1 group. However, with the high-intensity flow and maximum scour depth, low-frequency bursting occurred in the zone of the non-frequency burst occurrence. These could be treated as the cushion effects. Because of the high-speed nappe, the flow plume did not easily touch the bed through the flow vibration; the situation was similar to that of the M2, S2, and other groups.
Figure 5 shows the results for the overall scouring time of 5 h in this study. After an hour (the scouring time), there was no obvious change in the maximum scouring depth in each group, and there was also a significant reduction in the frequency of bursting. The reason for this outcome was that during the period from 1 to 5 h, even if the bursting occurred, bed sediment may not have been transported downstream from the scour hole. In summary, the observations from this study show that bursting is primarily induced by the impingement of submerged jets on a stream bed. It can be noted that the submerged flow can be divided into impinging jet and surface flow regimes. At the early stage of scouring, the impinging jet may occur while entraining a significant amount of bed sediment, thus causing bursting [21]. The submerged jet mentioned here was a high-speed nappe impinged on the channel bed. During the process of the development of the scour hole, most of the sediment that was initially entrained by the bursting was transported downstream with the main flow, and the bursting occurred with increasing frequency. As the scour hole evolved with time into near-equilibrium, the amount of sediment transported downstream during bursting was reduced, and the frequency of occurrence was also gradually reduced. In addition, the slight variation in scour depth occurred due to the decrease in transported amount of downstream sediment.

3.2. Analysis of the Characteristics of Bursting on the Flow Fields

Mainstream velocity has a great impact on the scouring process. Therefore, the discussion of this section used the conditions of M2 to conduct the analysis. The velocity profile of the mean mainstream was used along with the x direction at every 0.06 m to identify the effects between the occurrence or non-occurrence of bursting. As known from previous section, when bursting occurred, scouring in the bed as rapid with lifting sediment, and then the flow was affected by the resistance of suspended grains, which led to the deceleration of the overall flow velocity and the deepening of water depth. As can be seen in Figure 6a, at T = 15 min, the scour hole mainly developed within the range from 0.12 to 0.18 m. It can be clearly seen that when bursting occurred, the flow velocity was slowed down by around 30% and the bottom of the bed was deepened by about 20%. As time increased at T = 1 h, the scour hole converted to develop within the range from x = 0.12 to 0.24 m. In Figure 6b, when bursting occurred, the velocity slowed down by about 35% and the bed was deepened by about 10%. At T = 5 h, the scour hole was close to the equilibrium stage, as shown in Figure 6c. When bursting occurred, the velocity was slowed down by about 40%, but there was no obvious difference in the depth of the bed at x = 0.24 m. In summary, during bursting, there was a positive correlation between the slowing down of the main flow velocity and the increase of time; the deepening of the bed gradually decreased with time.
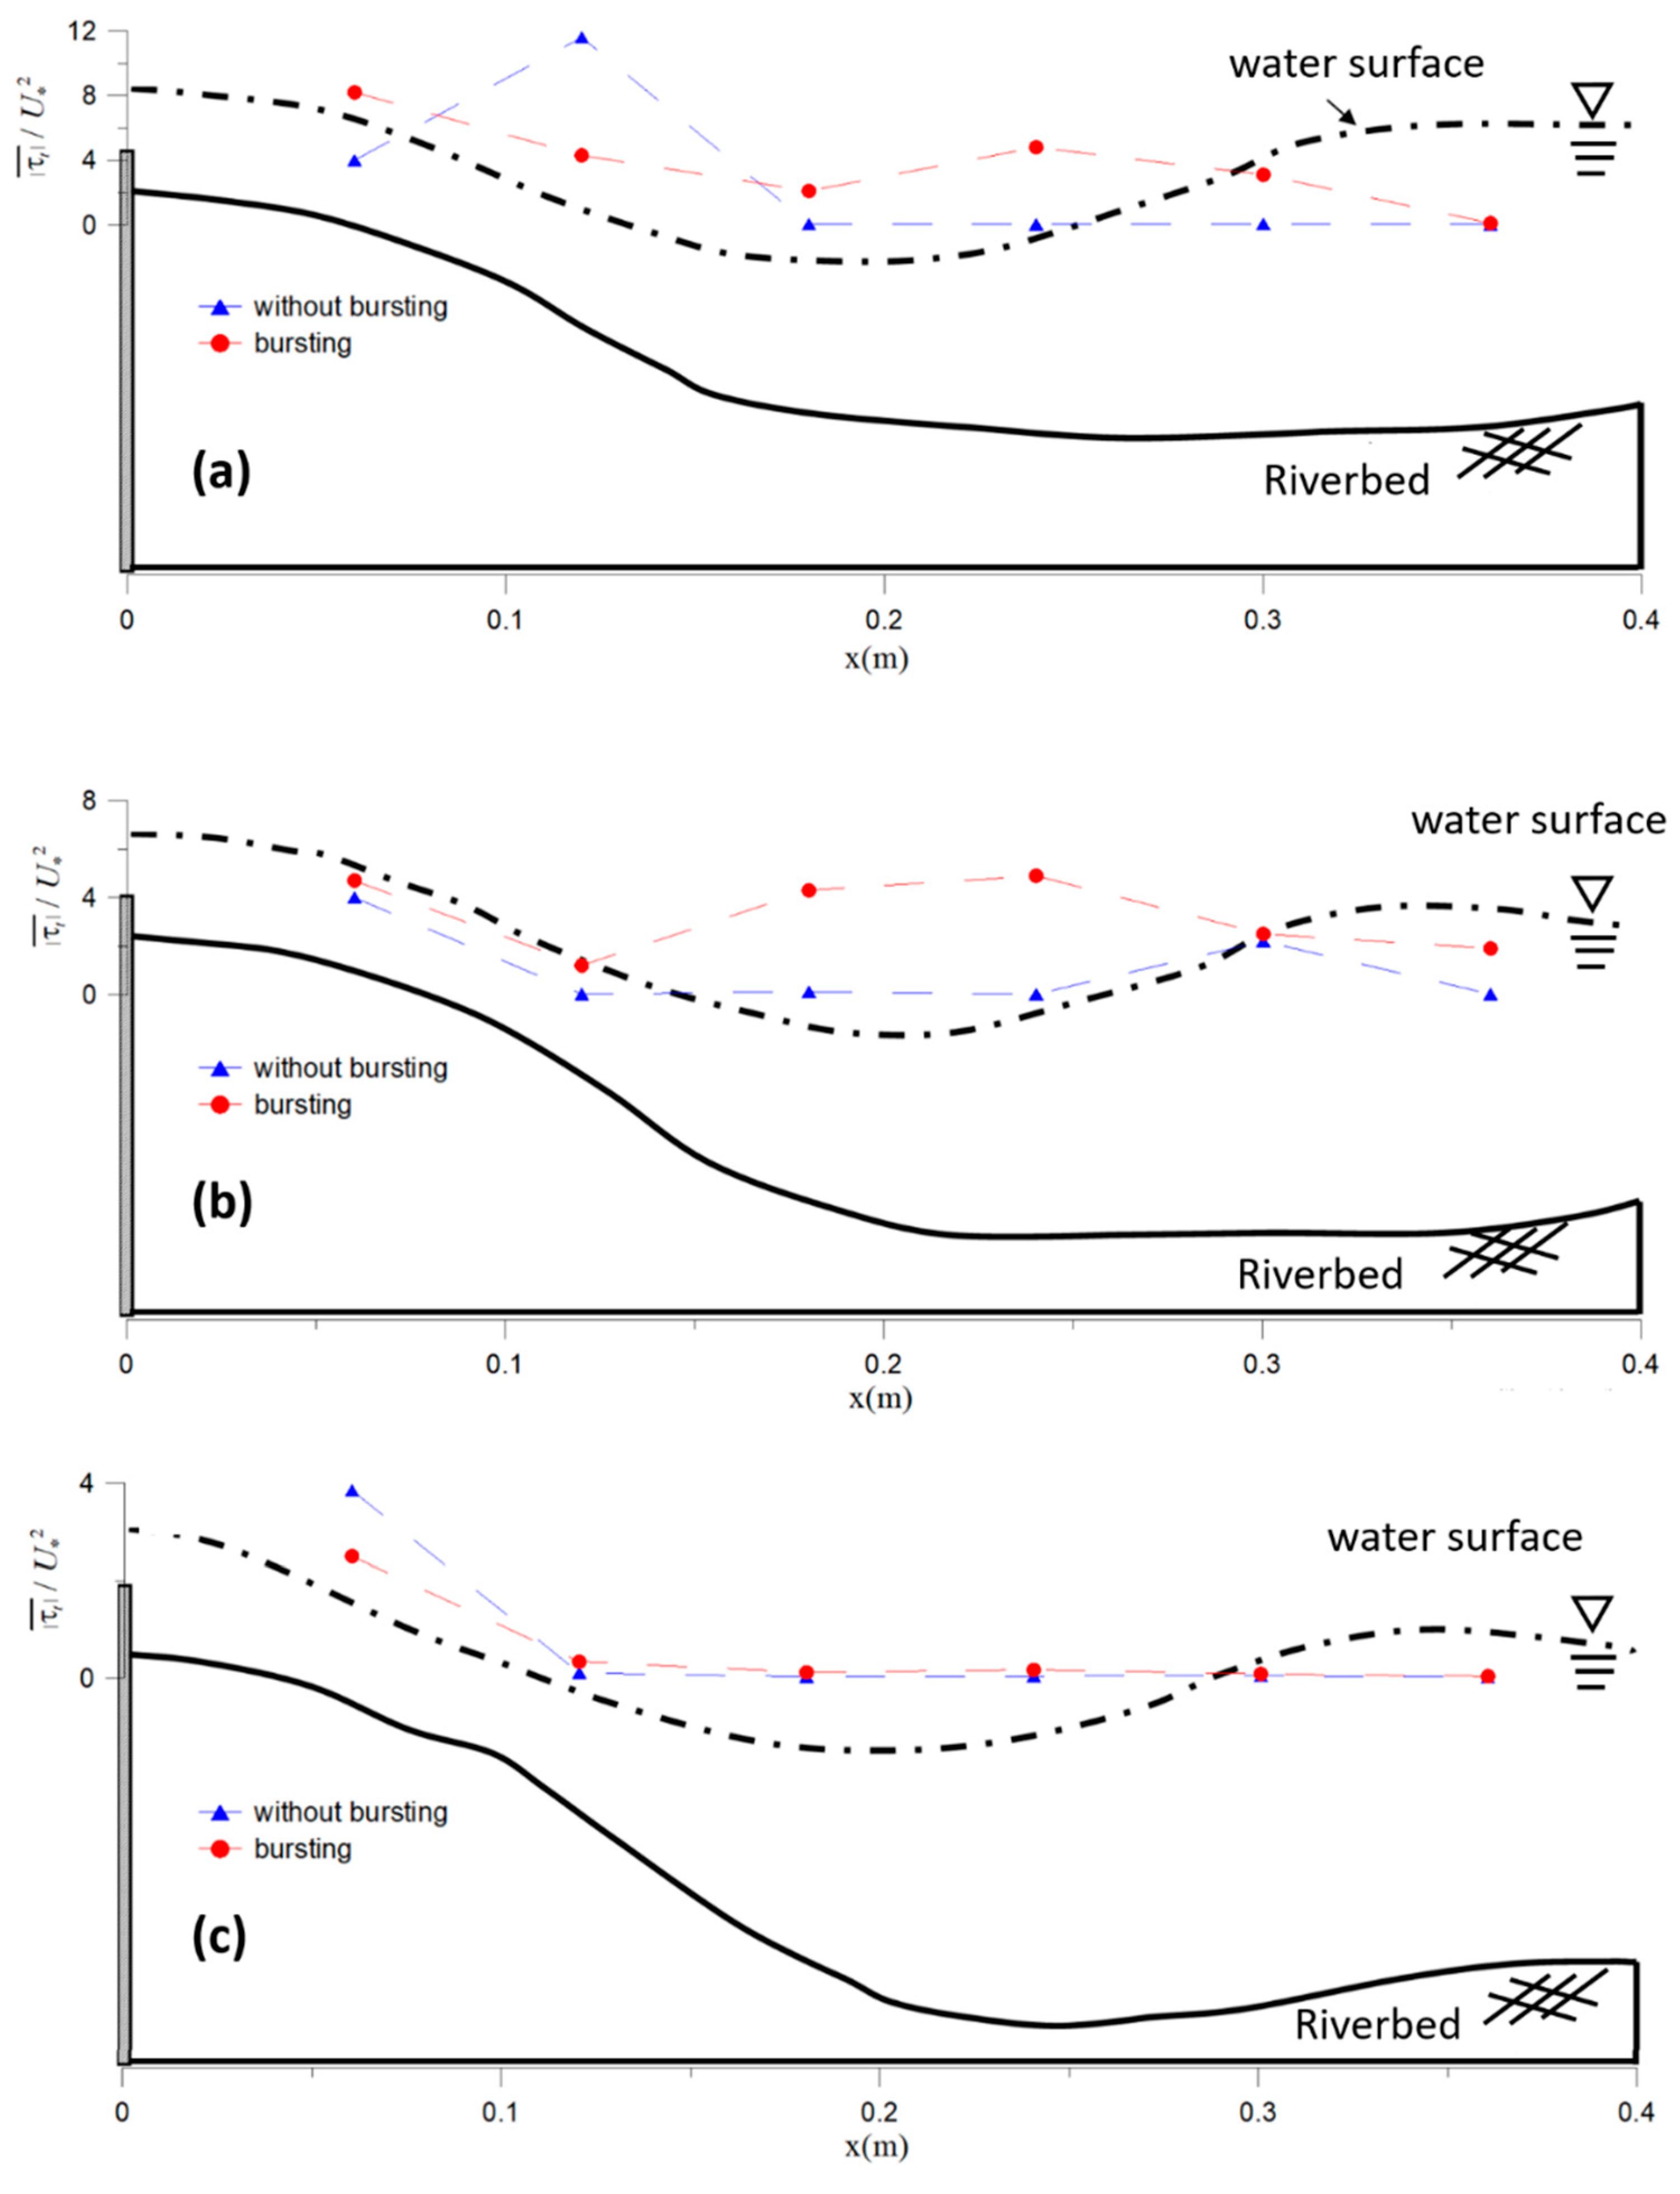
The relationship between bursting and the Reynolds stress was scrutinized next. The instantaneous Reynolds shear stress (τt = ρu‘v’) was obtained based on a Shields diagram where the critical shear stress (τc) = 2.1 N/cm2 when D50 = 2.7 mm. In this study, M2 was used as the representative group to calculate the dimensionless mean absolute Reynolds shear stress (τD = | τ t ¯ | / U * 2 ) at the lowest point along the x direction at every 0.06 m for a comparison of the occurrence or non-occurrence of bursting, as shown in Figure 7. As can be clearly seen in Figure 7a, at T = 15 min, the dimensionless mean absolute Reynolds stress (τD) significantly increased when the high-speed flow nappe approached the bed at the section of the scour hole (X = 0.06 m). When it flowed into the scour hole (X = 0.12 m), it could be found that the value of τD was greater than 2 with the occurrence of bursting, and it was even higher with the non-occurrence due to the impingement of the high-speed flow nappe toward the channel bed near the entrance region. When T = 1 h, as shown in Figure 7b, when the scour hole developed, the range of bursting continued to increase. Therefore, after X = 0.18 m, the dimensionless mean absolute Reynolds stress with bursting continually increased, and then it exceeded the value of τD with non-bursting. At T = 5 h, there was a great reduction in the frequency of bursting, and the lifting of sediment was also reduced. The calculation of the dimensionless mean absolute Reynolds stresses was averaged over all stages (before, during, and after) of bursting. Additionally, the τD was slightly larger during bursting than non-bursting. It was also found that the dimensionless mean absolute Reynolds stress was larger than the critical shear stress when bursting occurred. Only after T = 5 h, due to the reduction in the frequency, did the average of τD become smaller than the critical shear stress.

3.3. Discussion of the Experimental Results with Scouring Exceedance Probability

The Reynolds stress results helped us to further understand the relationship between the Reynolds stress and the critical shear stress during bursting. According to Shen and Lu [30], the sediment transport mechanism is affected by instantaneous Reynolds stress (τt) pulsation. Our statistical analysis adopted their ideas in this study to analyze the instantaneous Reynolds stress and then calculate the scouring exceedance probability (Pexc):
P e x c = N | τ t ¯ | > τ c / N t o t a l
where N | τ t ¯ | > τ c indicates the number of values greater than the critical shear stress and N t o t a l is the total number of the instantaneous Reynolds shear stress values collected during the sampling period of 8 s.
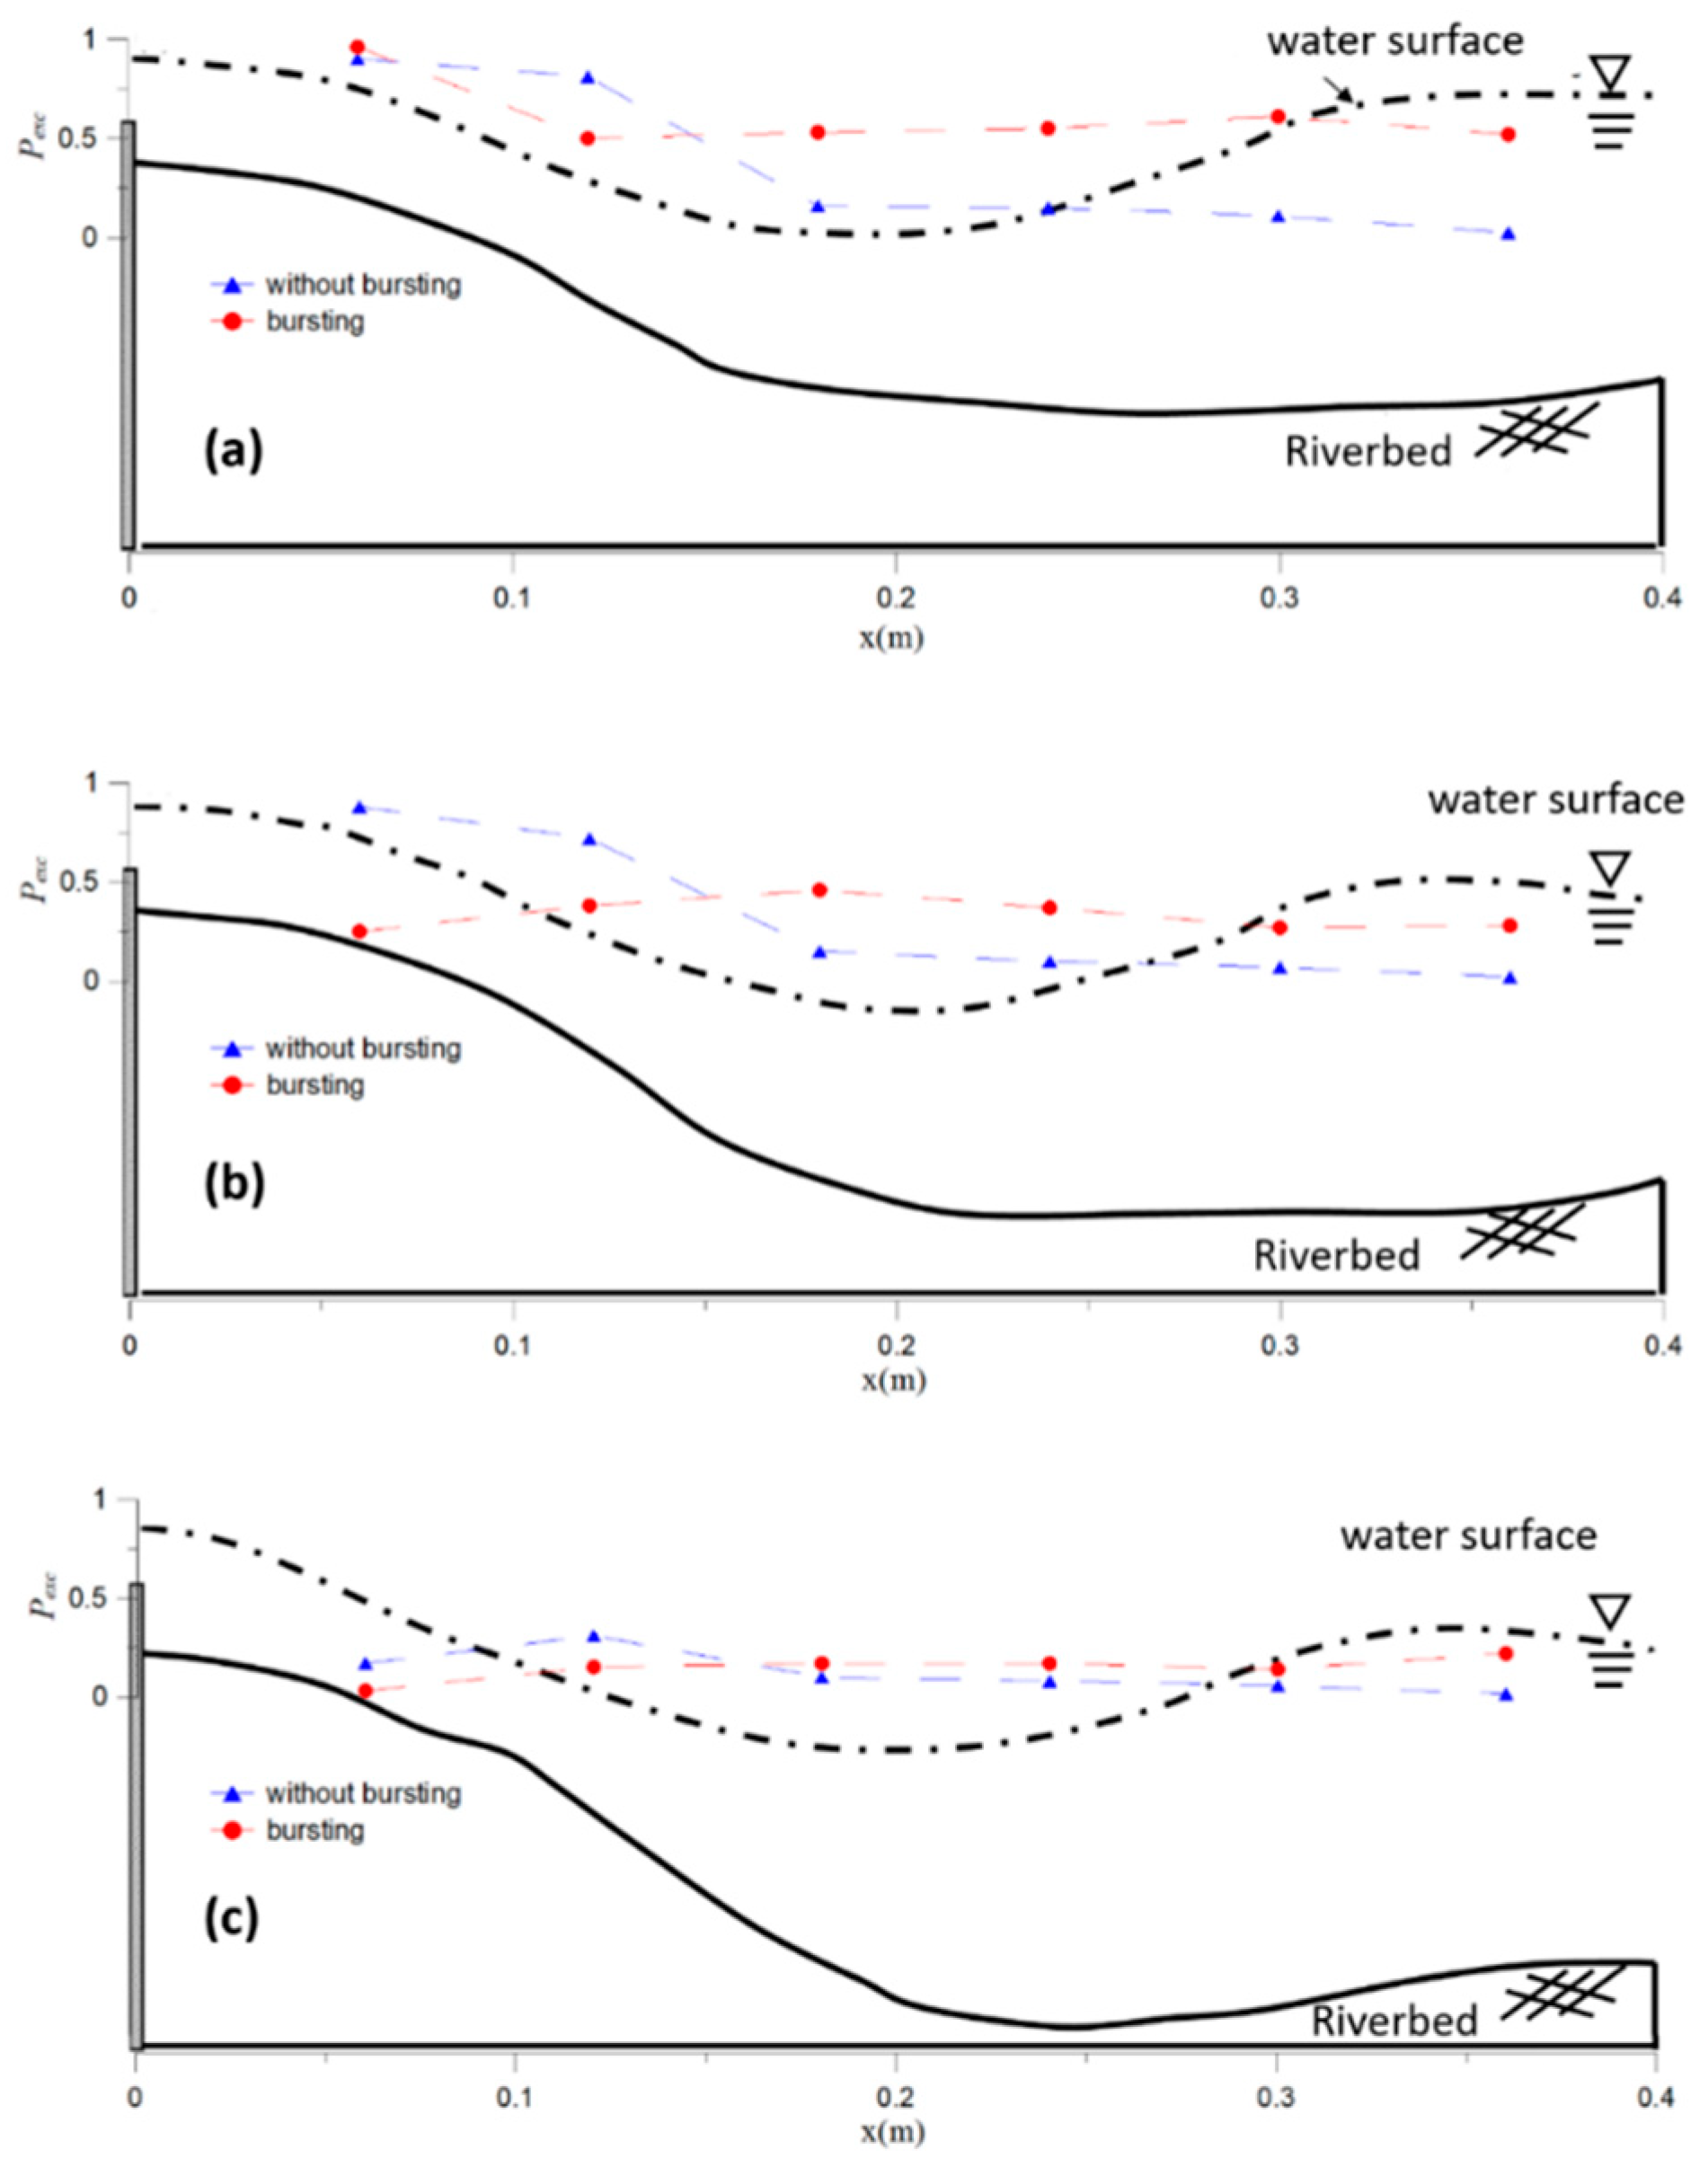
The above probability statistics methodology was used to analyze the probability of full-section bed scouring for the M2 representative groups to make a comparison between the probability of bursting and non-bursting, as shown in Figure 8. As can be seen in Figure 8a at T = 15 min, the scour hole was still in the developmental stage. A scouring exceedance probability that was greater than 0.5 meant that sediment would be expected to start to be transported downstream over more than half of the time that when bursting occurred. On the other hand, when bursting did not occur, the primary motion of particles at the beginning was caused by the impingement of the high-speed flow nappe toward the channel bed near the entrance region, e.g., x = 0.12 m in Figure 8a. As time progressed at T = 1 h, a similar phenomenon occurred near the entrance region for the case without bursting. Though there was a slight decrease in the scouring exceedance probability in the scour hole, the sediment in the scour hole mainly started to be transported downstream, as shown in Figure 8b. At T = 5 h, the scour hole gradually reached an equilibrium, and the maximum scouring depth was generated downstream. However, there was no significant variation in the scouring exceedance probability, as shown in Figure 8c. In other words, whether bursting occurred or not, the potential energy expenditure of sediment transport by flows was progressively decreased as time prolonged.
In short, after bursting occurred, the scouring exceedance probability decreased as time prolonged, and this indicated that the amount of sediment that could be transported away by the flows gradually decreased during the development of the scour hole. Therefore, bursting strength and the scouring exceedance probability were highly correlated. In addition, jet deflection angle, maximum water depth, and jet width were the major contributing factors in the intensity of bursting. A greater jet deflection angle (the early stage of the scouring process) may be accompanied by an impinging jet [35]. The flow was deeply affected by the depth of the scour hole as time prolonged. The deeper the scouring depth was, the smaller the variation of the deflection angles of the jet was with different durations. Therefore, over a long duration, the incidence of scouring that was generated by the jet impacting the bed was decreased, as was the scouring exceedance probability.
Table 2 shows the scouring exceedance probability at the maximum scouring depth for bursting and non-bursting at T = 15 min. When bursting occurred, the exceeding probability in each experimental group was in a fixed range between 35% and 53%. At the maximum scouring depth, the scouring exceedance probability was significantly greater with the occurrence of bursting than that with non-bursting. In summary, in the initial stage of the development of the scour hole, from T = 15 min to T = 1 h, bursting was the main factor that shaped the scour hole. In the non-bursting stage, the overall scouring exceedance probability and maximum scouring depth were reduced to less than 15%. In the future, with the aim of protecting the foundations of groundsills, the particle size distribution in river beds should also be investigated in advance. In addition, the discharge rate and the scouring exceedance probability of the bursting of the maximum scour depth could also be estimated to protect and ensure the safety of the foundation of the groundsill.

4. Conclusions

This study aimed to explore the physical characteristics of bursting. A CCD camera was used to observe the scouring process and the frequency of bursting occurrence under different conditions. Moreover, a PIV measurement system was used to investigate the characteristics of the flow field during bursting downstream of a groundsill. The scouring exceedance probability and statistical analysis of the bed shear stress were also discussed. Then, the following conclusions were obtained.
During the development of the scour hole, most of the sediment entrained by the bursting occurred in the initial stage and was transported downstream by the main stream, and the frequency of bursting was relatively high. However, with the time prolonged, the amount of sediment and the frequency of the occurrence of bursting gradually decreased, and the variation of the maximum scouring depth gradually slowed down. From the main stream velocity profile, it could be seen that after bursting occurred, the retardation of velocity slowed down from 30% to 40%, and the variation in depth of the bed decreased in the early stages to 20% and then stabilized in the later stages with prolonged time. A comparison of the Reynolds stress near the bed of the scour hole with and without bursting occurrence was conducted. The results showed that the average values of the instantaneous Reynolds stress was greater than the critical shear stress when bursting occurred; however, at T = 5 h, the Reynolds stress was less than the critical shear stress due to the low incidence of bursting. In the non-bursting stage, the Reynolds stress was greater than the critical shear stress in sections where the high-speed nappe impinged on the channel bed, but there was no significant variation in other positions.
In addition, a probability analysis of full section of bed scouring was exploited to compare the variation in probability between bursting and non-bursting occurrences. In terms of the full section scouring exceedance probability, when bursting occurred, the scouring exceedance probability in the bed of the scour hole decreased as time prolonged. The relationship between scouring exceedance probability and maximum scouring depth was that when the scouring was deeper, it was not as easy for the oscillating jet to penetrate through the flow, so there was no obvious variability in the scouring exceedance probability with the alternation of discharge rate and slope. With the initial development of scouring, the exceedance probability was in the range of 35%–53% for the flow conditions investigated. The scouring exceedance probability without bursting was at least 15% less than that with bursting at the maximum scouring depth. The results indicated that the instantaneous Reynold stress pulsation plays an important role in the evolution of a scour hole, especially during the early stages of the scour development. These findings of scour and bursting phenomenon can be taken as reference for the future design of hydrological structures.

Author Contributions

C.-K.C.; implemented data analysis, and wrote the paper. J.-Y.L.; conceived, and designed the study. S.-Y.L. and K.-T.H.; conducted the experiment, implement data analysis. D.-S.S.; conceived and designed the study, and wrote the paper. All authors have read and agreed to the published version of the manuscript.

Funding

This research is founded by the Ministry of Science and Technology, Taiwan, under Grant no. MOST-108-2628-M-009-005.

Conflicts of Interest

The authors declare no conflict of interest.

References

  1. Cao, Z. Turbulent bursting-based sediment entrainment function. J. Hydraul. Eng. 1997, 123, 233–236. [Google Scholar] [CrossRef]
  2. Liang, B.; Du, S.; Pan, X.; Zhang, L. Local scour for vertical piles in steady currents: Review of mechanisms, influencing factors and empirical equations. J. Mar. Sci. Eng. 2019, 8, 4. [Google Scholar] [CrossRef] [Green Version]
  3. Sechet, P.; Le Guennec, B. Bursting phenomenon and incipient motion of solid particles in bed-load transport. J. Hydraul. Res. 1999, 37, 683–696. [Google Scholar] [CrossRef]
  4. Nasrollahi, A.; Ghodsian, M.; Neyshabouri, S.S. Local scour at permeable spur dikes. J. Appl. Sci. 2008, 8, 3398–3406. [Google Scholar] [CrossRef] [Green Version]
  5. Mazumder, B.S.; Pal, D.K.; Ghoshal, K.; Ojha, S. Turbulence statistics of flow over isolated scalene and isosceles triangular-shaped bedforms. J. Hydraul. Res. 2009, 47, 626–637. [Google Scholar] [CrossRef]
  6. Keshavarzi, A.; Melville, B.; Ball, J. Three-dimensional analysis of coherent turbulent flow structure around a single circular bridge pier. Environ. Fluid Mech. 2014, 14, 821–847. [Google Scholar] [CrossRef]
  7. Pizarro, A.; Manfreda, S.; Tubaldi, E. The science behind scour at bridge foundations: A review. Water 2020, 12, 374. [Google Scholar] [CrossRef] [Green Version]
  8. Bernd, E.; Franciska, O.; Oscar, L. Live-bed scour at bridge piers in a lightweight polystyrene bed. J. Hydraul. Eng. 2015, 141. [Google Scholar] [CrossRef]
  9. Breusers, H.N.C. Proc. Symposium on model and prototype conformity: 1–8. In Conformity and Time Scale in Two-Dimensional Local Scour; Hydraulic Research Laboratory: Poona, India, 1966. [Google Scholar]
  10. Dietz, J.W. Scouring in fine or lightweight bed materials by subcritical flow. In Mitteilungen der Versuchsanstalt für Wasserbau und Kulturtechnik; Theodor-Rehbock-Flußbaulaboratorium, Universität Karlsruhe: Karlsruhe, Germany, 1969; pp. 1–120. (In German) [Google Scholar]
  11. Zanke, U. Zusammenhange Zwischen Stromung und Sedimenttransport; Des Franzius Instituts der Univ.: Hannover, Germany, 1978. (In German) [Google Scholar]
  12. Breusers, H.N.C.; Raudkivi, A.J. Scouring: Hydraulic Structures Design Manual; Balkema Publication: Rotterdam, The Netherlands, 1991. [Google Scholar]
  13. Adamo, F.; Andria, G.; Bottiglieri, O.; Cotecchia, F.; Di Nisio, A.; Miccoli, D.; Sollecito, F.; Spadavecchia, M.; Todaro, F.; Trotta, A.; et al. GeoLab, a measurement system for the geotechnical characterization of polluted submarine sediments. Measurement 2018, 127, 335–347. [Google Scholar] [CrossRef]
  14. Farhoudi, J.; Smith, K.V.H. Local scour profiles downstream of hydraulic jump. J. Hydraul. Res. 1985, 23, 343–358. [Google Scholar] [CrossRef]
  15. Oliveto, G.; Comuniello, V.; Onorati, B. Temporal development of local scour downstream of positive-step stilling basins. River flow 2008, 2, 1673–1678. [Google Scholar]
  16. Gaudio, R.; Marion, A.; Bovolin, V. Morphological effects of bed sills in degrading rivers. J. Hydraul. Res. 2000, 38, 89–96. [Google Scholar] [CrossRef]
  17. Gaudio, R.; Marion, A. Time evolution of scouring downstream of bed sills. J. Hydraul. Res. 2003, 41, 271–284. [Google Scholar] [CrossRef]
  18. Lu, S.Y.; Lu, J.Y.; Shih, D.S. Temporal and spatial flow variations over a movable scour hole downstream of a grade-control structure with a PIV system. Water 2018, 10, 1002. [Google Scholar] [CrossRef] [Green Version]
  19. Nezu, I.; Rodi, W. Open-channel flow measurements with a laser doppler anemometer. J. Hydraul. Eng. 1986, 112, 335–355. [Google Scholar] [CrossRef]
  20. Pagliara, S. Influence of sediment gradation on scour downstream of block ramps. J. Hydraul. Eng. 2007, 133, 1241–1248. [Google Scholar] [CrossRef]
  21. Lu, J.Y.; Hong, J.H.; Chang, K.P.; Lu, T.F. Evolution of scouring process downstream of grade-control structures under steady and unsteady flows. Hydrol. Process. 2012, 27, 2699–2709. [Google Scholar] [CrossRef]
  22. Shields, A. Anwendung der Ahnlichkeitsmechanik und Turbulenz Forschung Auf Die Geschiebebewegung; Mitteil. Preuss, Versuchsanst, Wasser, Erd; Schiffsbau: Berlin, Germany, 1936. [Google Scholar]
  23. Melville, B.W.; Coleman, S.E. Bridge. Scour; Water Resources Publications, LLC: Lone Tree, CO, USA, 2000; pp. 193–196. [Google Scholar]
  24. Bennett, S.; Alonso, C.V. Turbulent flow and bed pressure within headcut scour holes due to plane reattached jets. J. Hydraul. Res. 2006, 44, 510–521. [Google Scholar] [CrossRef]
  25. Rak, G.; Hočevar, M.; Steinman, F. Non-intrusive measurements of free-water-surface profiles and fluctuations of turbulent, two-phase flow using 2-D laser scanner. Meas. Sci. Technol. 2020, 31. [Google Scholar] [CrossRef]
  26. Dodaro, G.; Tafarojnoruz, A.; Calomino, F.; Gaudio, R.; Stefanucci, F.; Adduce, C.; Sciortino, G. An experimental and numerical study on the spatial and temporal evolution of a scour hole downstream of a rigid bed. In River Flow 2014; Informa UK Limited: London, UK, 2014; pp. 1415–1422. [Google Scholar]
  27. Guan, D.; Melville, B.; Friedrich, H. Local scour at submerged weirs in sand-bed channels. J. Hydraul. Res. 2016, 54, 1–13. [Google Scholar] [CrossRef]
  28. Wang, L.; Melville, B.; Guan, D. Effects of upstream weir slope on local scour at submerged weirs. J. Hydraul. Eng. 2018, 144. [Google Scholar] [CrossRef]
  29. Wang, L.; Melville, B.; Guan, D.; Whittaker, C. Local scour at downstream sloped submerged weirs. J. Hydraul. Eng. 2018, 144. [Google Scholar] [CrossRef]
  30. Shen, H.W.; Lu, J. Development and prediction of bed armoring. J. Hydraul. Eng. 1983, 109, 611–629. [Google Scholar] [CrossRef]
  31. Li, Y.; Wei, J.; Gao, X.; Chen, D.; Weng, S.; Du, W.; Wang, W.; Wang, J.; Tang, C.; Zhang, S. Turbulent bursting and sediment resuspension in hyper-eutrophic Lake Taihu, China. J. Hydrol. 2018, 565, 581–588. [Google Scholar] [CrossRef]
  32. Powell, D.M. Flow resistance in gravel-bed rivers: Progress in research. Earth-Sci. Rev. 2014, 136, 301–338. [Google Scholar] [CrossRef]
  33. Bathurst, J.C.; Li, R.M.; Simons, D.B. Resistance equation for large-scale roughness. J. Hydraul. Div. 1981, 107, 1593–1613. [Google Scholar]
  34. Lawrence, D.S.L. Macroscale surface roughness and frictional resistance in overland flow. Earth Surf. Proc. Land 1997, 22, 365–382. [Google Scholar] [CrossRef]
  35. Wu, S.; Rajaratnam, N. Submerged flow regimes of rectangular sharp-crested weirs. J. Hydraul. Eng. 1996, 122, 412–414. [Google Scholar] [CrossRef]
Figure 1. Plan view of the experimental channel (from Lu et al. [18]).
Water 12 01396 g001
Figure 2. The actual photos and their schematic diagram of the bursting of the initial development of scouring at time (a) 15 min 20 s, (b) 15 min 23 s, and (c) 15 min 28 s.
Water 12 01396 g002
Figure 3. The actual photos and their schematic diagram of bursting near scouring equilibrium at time (a) 2 h 58 min 14 s, (b) 2 h 58 min 20 s, (c) 2 h 58 min 35 s, (d) 2 h 58 min 41 s, and (e) 2 h 59 min 3 s.
Water 12 01396 g003
Figure 4. Relationship between the frequency of bursting at T = 1 h and the cumulative maximum depth of the scour hole (yms) of cases (a) M1, (b) M2, (c) M3, (d) S1, (e) S2, and (f) S3.
Water 12 01396 g004
Figure 5. Relationship between the frequency of bursting at T = 5 h and the cumulative maximum depth of the scour hole (yms) of cases (a) M1, (b) M2, (c) M3, (d) S1, (e) S2, and (f) S3.
Water 12 01396 g005
Figure 6. Comparison of the measured mean velocity profiles in the scour hole during bursting for M2: (a) T = 15 min, (b) T = 1 h, and (c) T = 5 h.
Water 12 01396 g006
Figure 7. Comparison of the Reynolds stress ( | τ t | ¯ / U * 2 ) near the bed during bursting for M2: (a) T = 15 min, (b) T = 1 h, and (c) T = 5 h.
Water 12 01396 g007
Figure 8. Comparison of the scouring exceedance probability ( P e x c ) near the bed of the scour hole during bursting for M2: (a) T = 15 min, (b) T = 1 h, and (c) T = 5 h.
Water 12 01396 g008
Table 1. Experimental setups.
CaseS
(%)
H
(m)
q
(m2/s)
U
(m/s)
U *
(m/s)
FrReB/h
M11.00.0170.01670.980.03972.411575735
M21.00.0250.02831.130.04762.292604524
M31.00.0340.04751.400.05472.424553318
S11.50.0160.01671.040.04732.631732738
S21.50.0230.02831.230.05612.592620626
S31.50.0300.04751.580.06342.924305320
Note: S = channel slope; h = water depth; Q = discharge; U = mean velocity; U * = friction velocity = g R S ; R = hydraulic radius; Fr = Froude number; Re = Reynolds number; and B/h = aspect ratio (flume width: B = 0.6 m).
Table 2. Exceedance probability of scouring at the maximum scouring depth for bursting or non-bursting on the case of T = 15 min and D50 = 2.7 mm.
M1M2M3S1S2S3
Scouring exceedance probability with bursting53%52%43%35%47%47%
Scouring exceedance probability without bursting11%13%27%18%19%32%