1. Introduction
Vegetation is produced as a result of the interactions among factors such as soil, atmosphere, and moisture [
1]. Vegetation is affected by climate because of biophysical responses such as plant respiration, photosynthesis, and evapotranspiration [
2]. Recent research found that vegetation plays a key role in future terrestrial hydrologic response, and understanding water stress is of the utmost importance for properly predicting future dryness and water resources [
3]. Changes in global climate and associated effects on vegetation condition have received an increasing amount of attention [
4]. Among such research, the Normalized Difference Vegetation Index (NDVI) is frequently used to monitor changes in vegetation conditions, because of its close relationship with photosynthetically active radiation, which is absorbed by photosynthesizing tissues [
5,
6]. With the improvement of remote sensors, the NDVI has been widely applied in continental and regional research [
7]. Continuous NDVI datasets make it possible to trace vegetation conditions changes and explore the underlying climate factor-associated mechanisms [
8,
9]. The NDVI has been widely exploited to monitor and quantify drought disturbance in semiarid and arid regions with low values corresponding to stressed vegetation [
10,
11]. As a known covariate with other environmental variables, the NDVI was also applied to soil-loss-prone area identification [
12,
13], wetland delineation [
14], irrigation and soil salinity management [
15]. Therefore, quantifying the relationship between NDVI and climate factors, and predicting the NDVI trends will help effectively guide regional water resource managements [
16,
17].
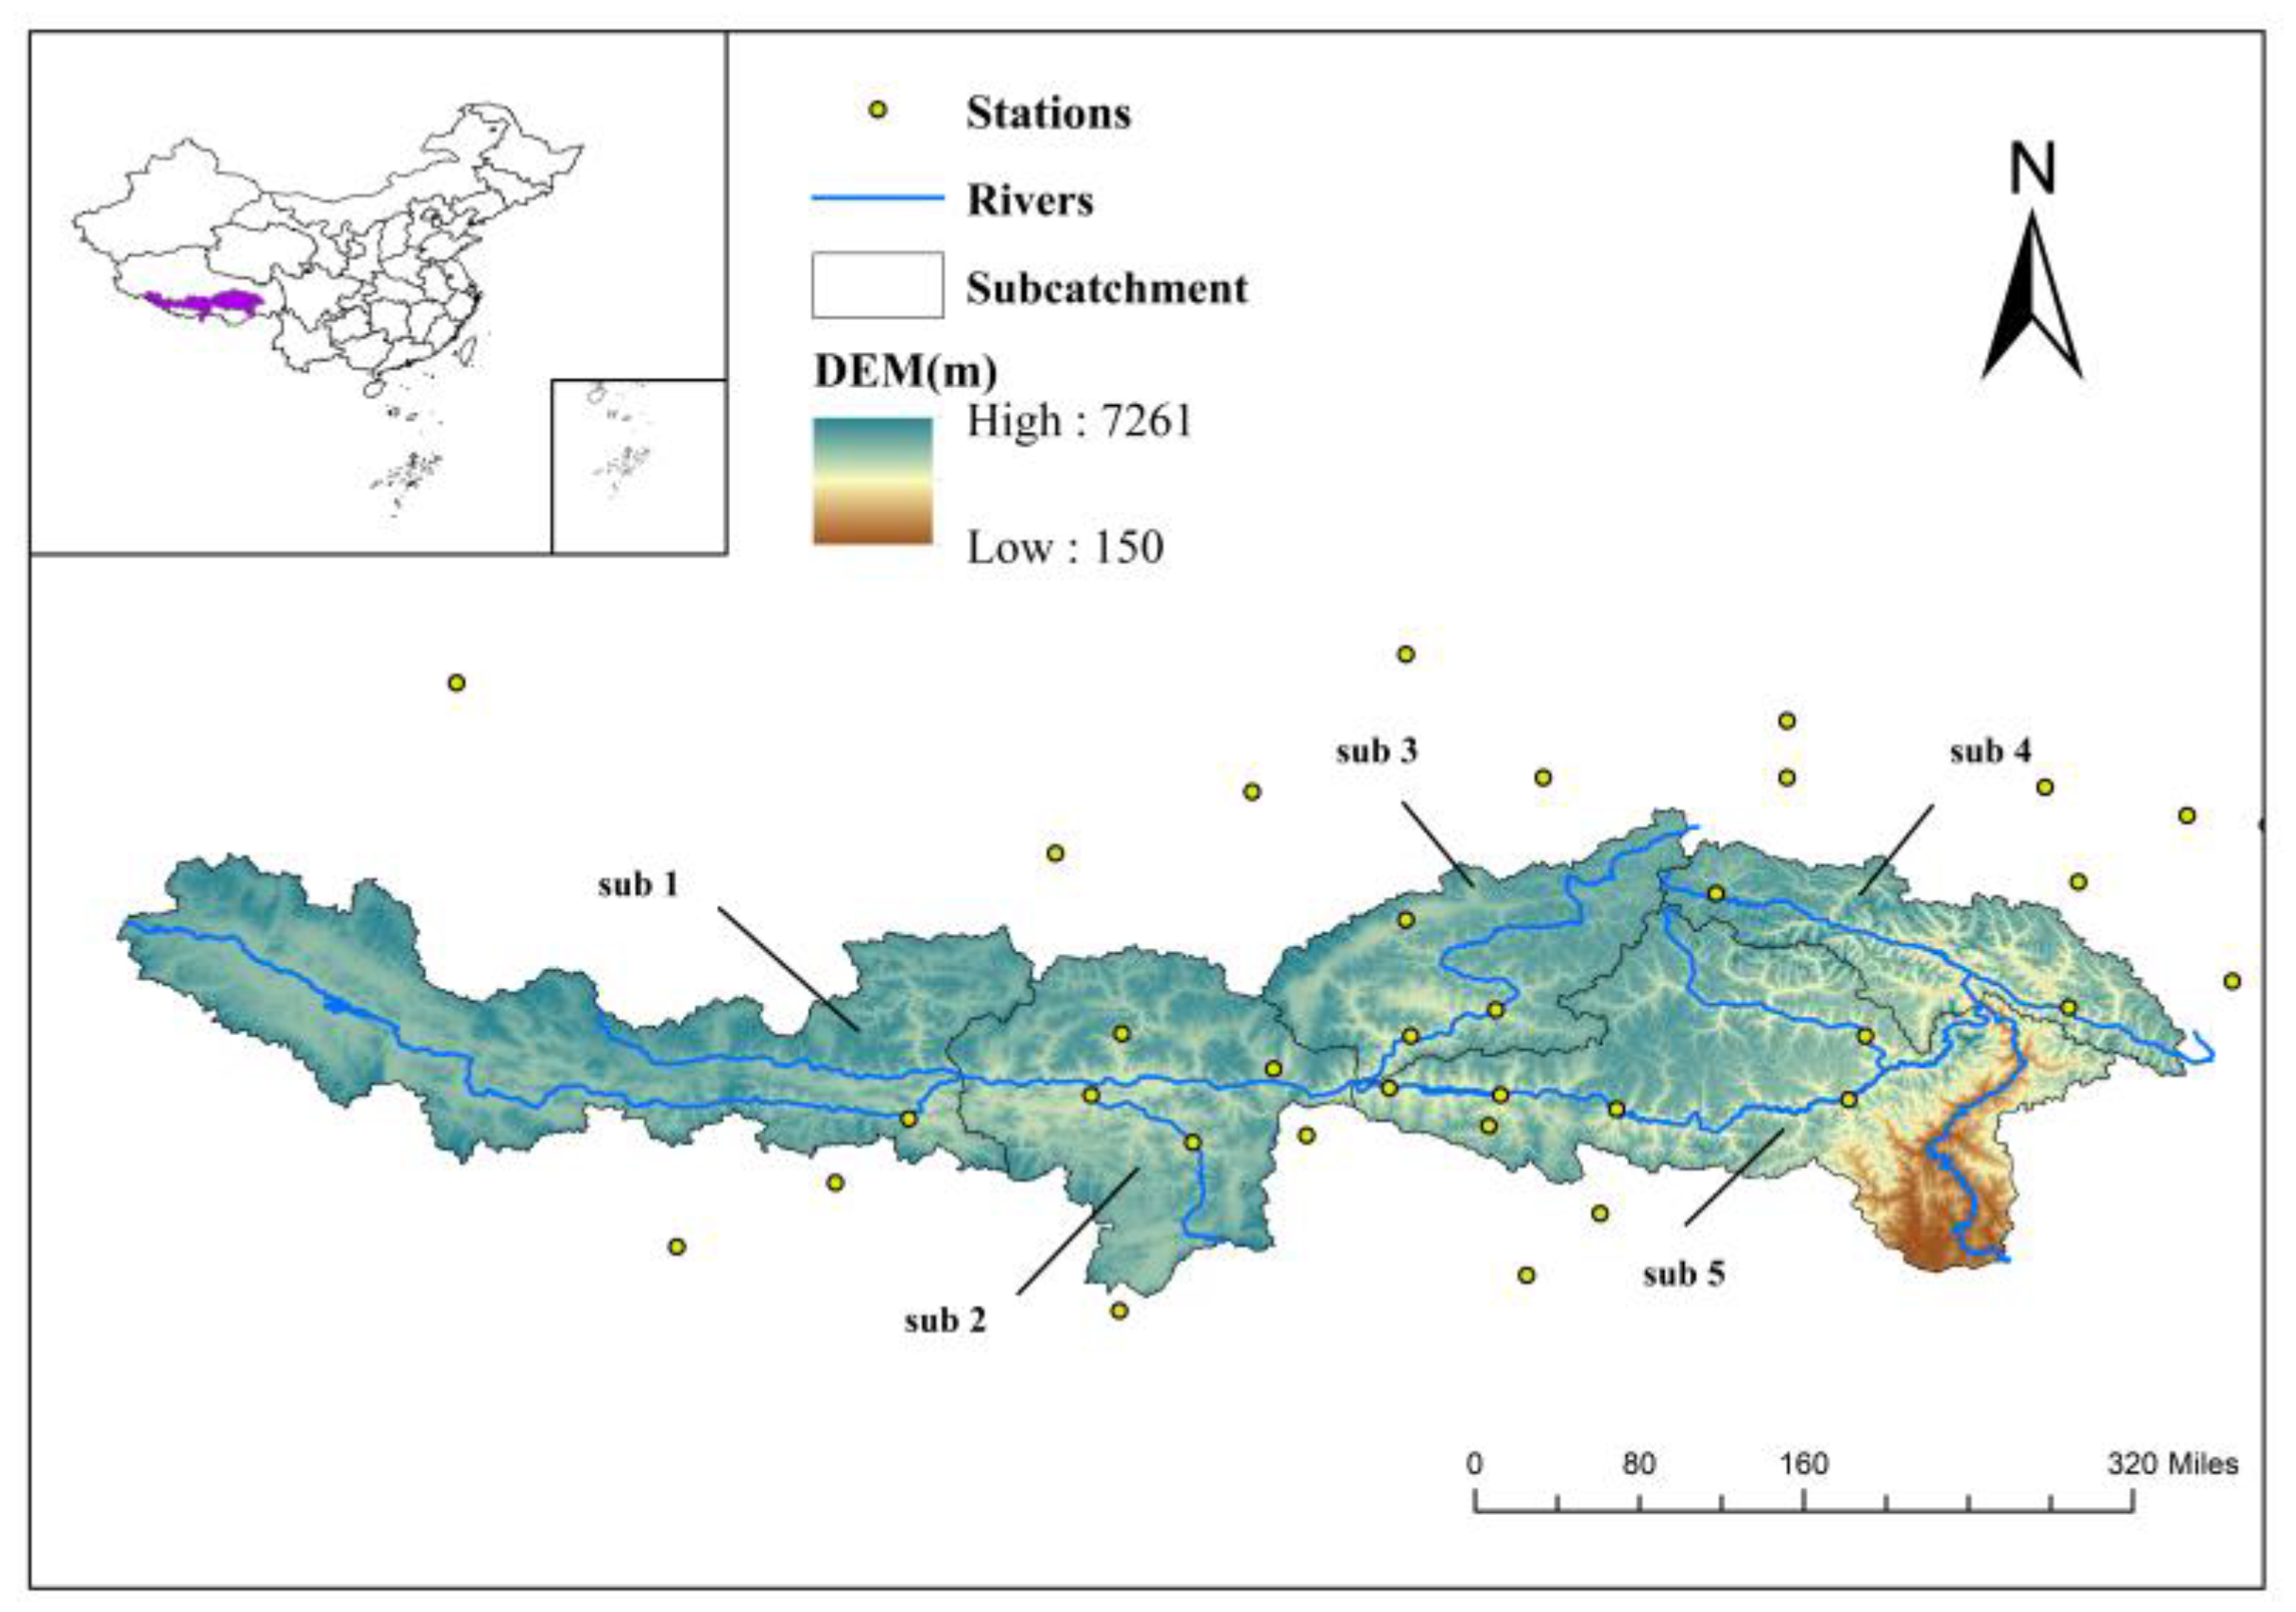
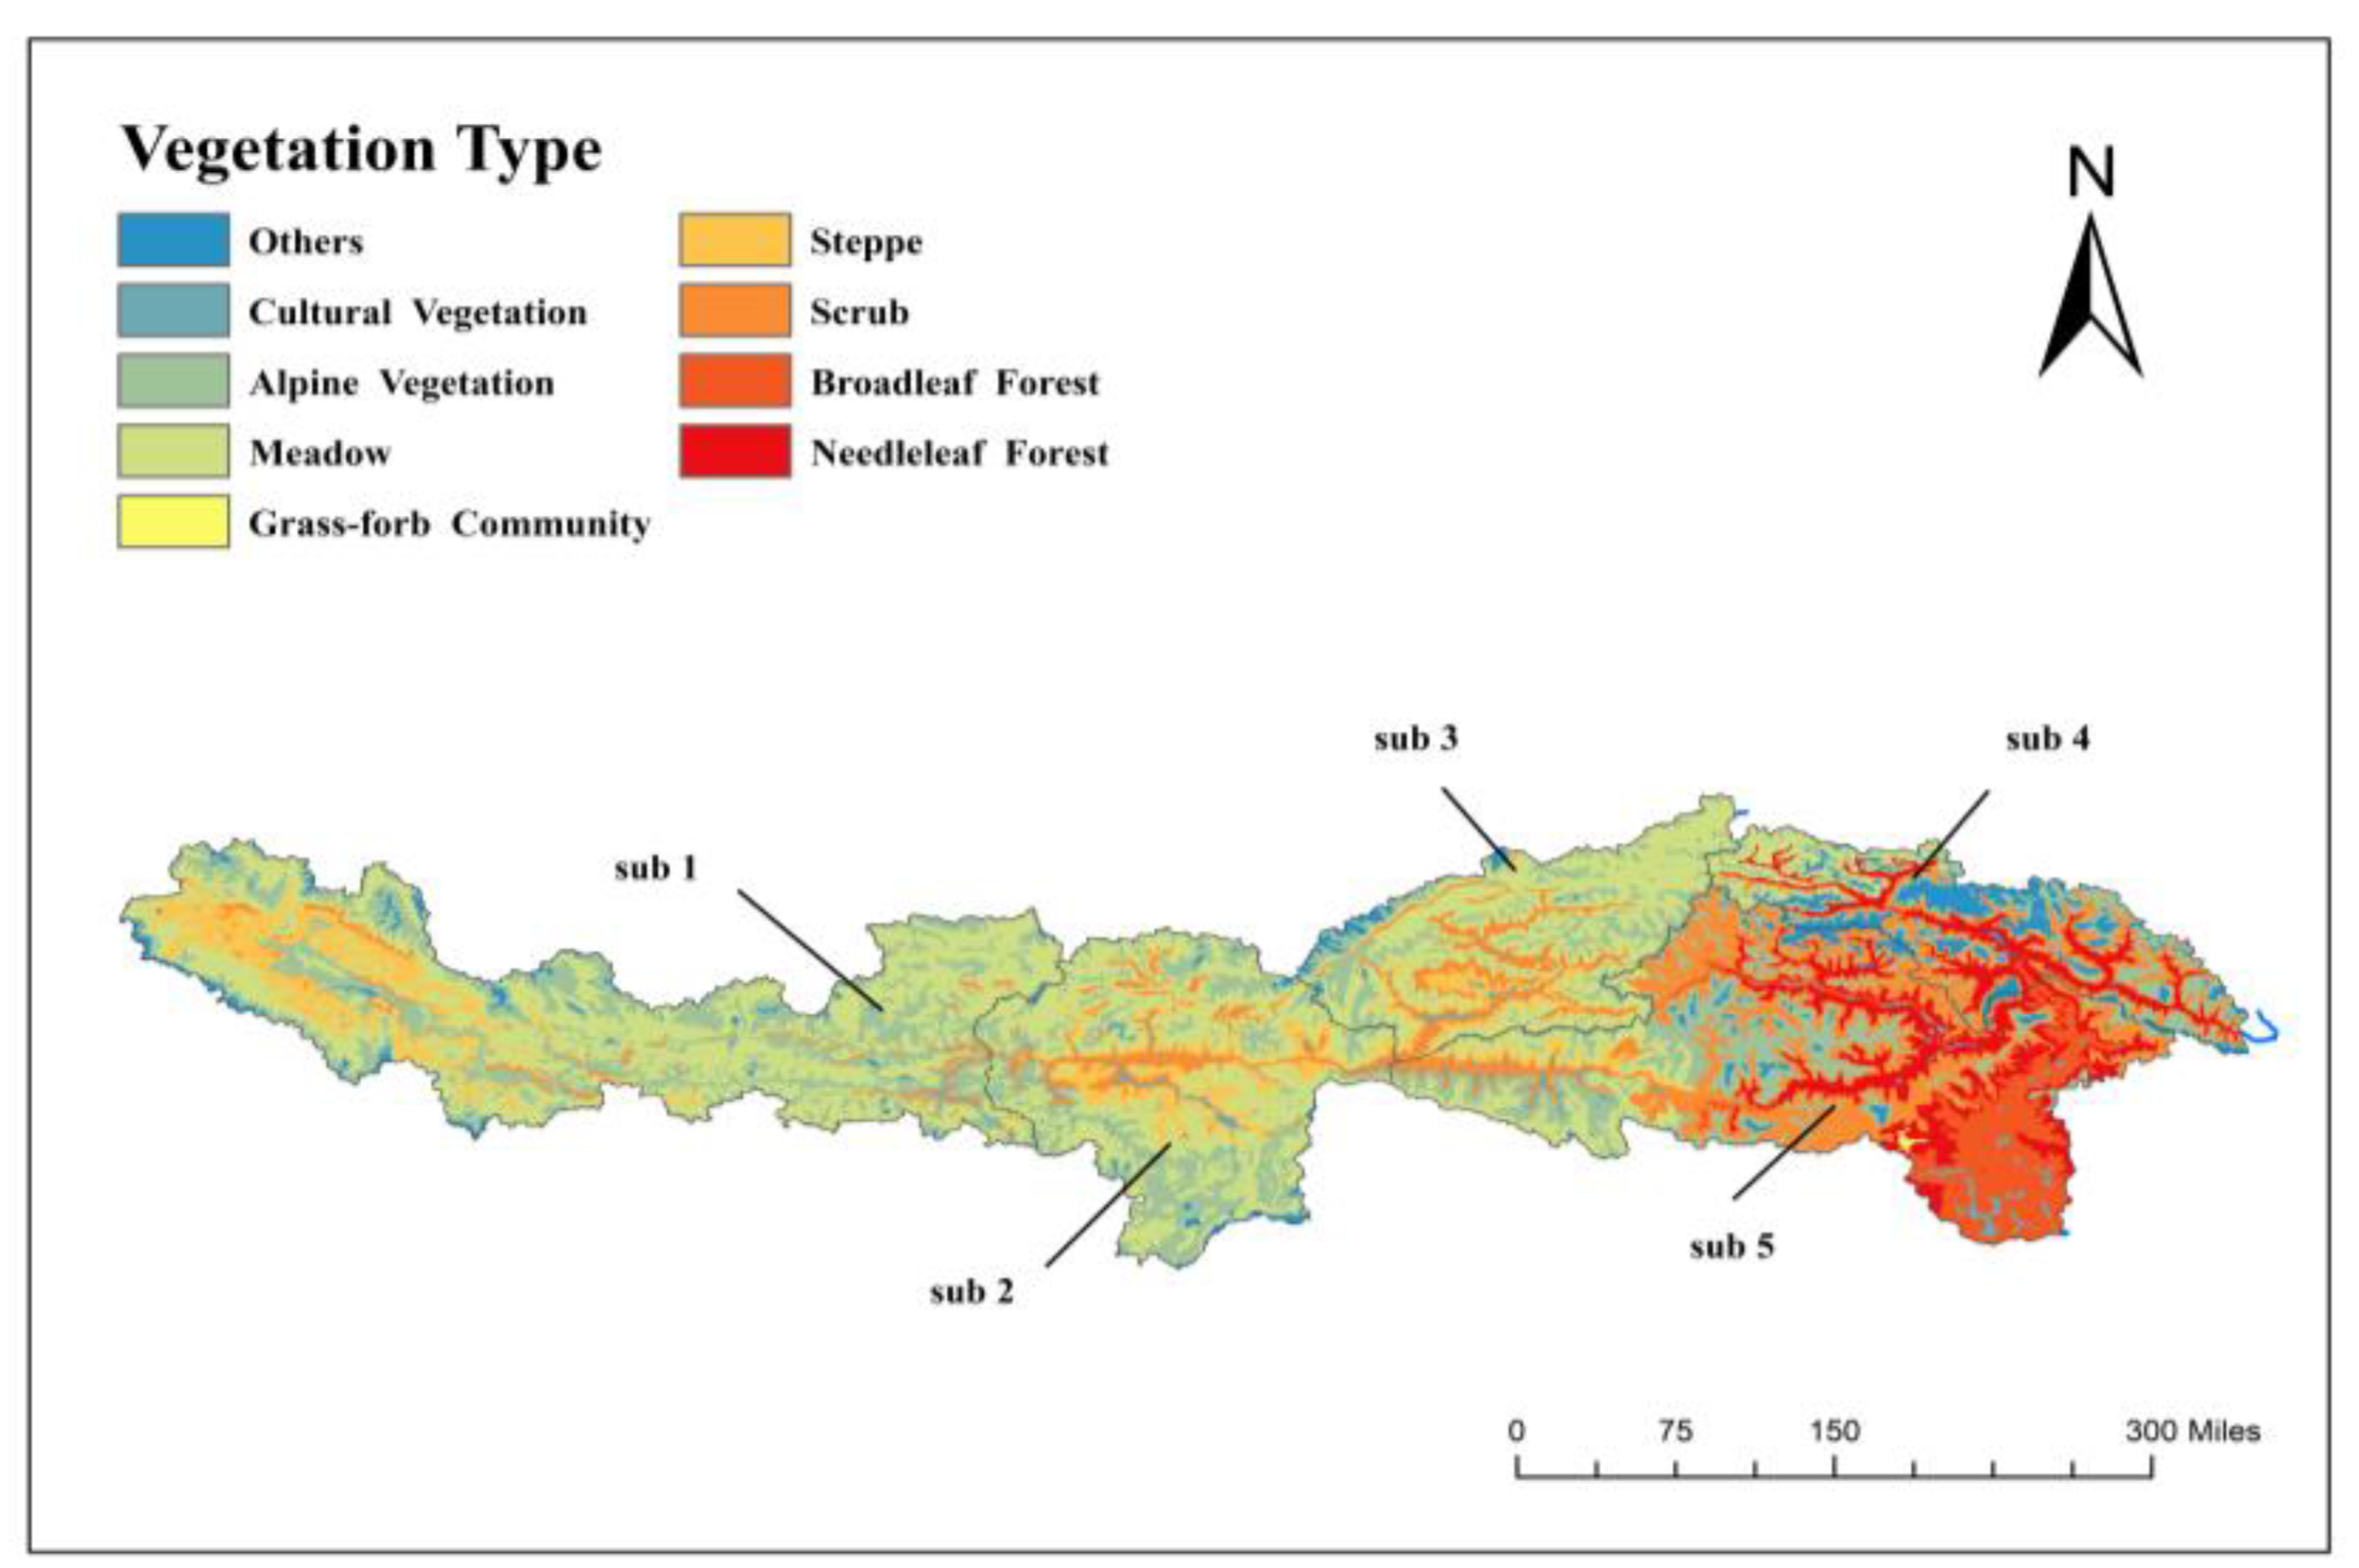
Yarlung Zangbo River, the longest river on the Tibetan Plateau, has high spatial heterogeneity in vegetation conditions and is the main freshwater resource of local residents and downstream countries. As one of the most important ecosystems in the Tibetan Plateau, the vegetation conditions of the Yarlung Zangbo River Basin (YZRB) have a significant impact on the water balance and biological population of the Tibetan Plateau and surrounding areas [
17]. Because of the influence of the plateau’s high altitude, YZRB vegetation is extremely fragile and sensitive to global climate change. In recent years, statistically significant warming and intensive drought were observed in the YZRB [
18], where the cultivated land accounts for about 62.89% of the area of the Tibet Autonomous Region [
19]. Soil erosion is another water resources problem of YLZB, where the vegetation conditions play an important role [
20]. Moreover, the changes in vegetation cover also influence the water availability of the YLZB [
21,
22]. Therefore, investigating and modelling the vegetation responses to climate changes is of great significance to the water resource management of YLRB and the water governance of the transboundary rivers [
23]. Han et al. explore the relationship between the NDVI and the meteorological variables of the YZRB [
24]. Liu et al. analyzed the spatiotemporal patterns of vegetation during 1998–2014 using the NDVI [
25]. Sun et al. investigate the spatial heterogeneity of changes in vegetation growth and their driving forces using the NDVI of the YLZB [
26]. Based on these researches, an NDVI prediction model that incorporates a comprehensive understanding of the climate–vegetation–hydrology relationships could be important for integrated water resource management.
A large amount of studies have been devoted to exploring the response of the NDVI to precipitation and temperature on regional and global scales, which are the most common climate factors [
27,
28]. Most of the studies adopted linear methods, such as partial correlation coefficient [
29], complex correlation coefficient [
30] and linear regression [
31]. Due to the complexity of ecosystem and the uncertainties of vegetation dynamics, nonlinear modes, especially machine learning models, attached the attention of researchers [
32,
33,
34,
35]. Moreover, because the climate and topography show high heterogeneity from upstream to downstream regions [
36,
37], it puts forward higher requirements on the universal abilities of prediction models in the YZRB. Furthermore, because of the diversity of ecosystems and climate characters, the correlation between NDVI and climate are diverse in different regions [
38]. Therefore, predictor selection is also a challenge for NDVI prediction models. Recently, random forest (RF) has received substantial attention in water resource research [
39,
40]. RF is advantageous because it can handle large datasets and undergoes predictor selection using a built-in variable importance evaluation method [
41,
42]. Therefore, RF should be highly suitable for the NDVI prediction of the YZRB. This is the first time RF has been applied to explore the complex relationship between the NDVI and climatic factors to the best of our knowledge.
The objective of this study was to propose feasible NDVI prediction models for the YZRB on the subzone scale. RF was adopted to simulate the relationships between NDVI and climatic factors. A comparison was then conducted between the RF and Artificial Neural Network (ANN) and Support Vector Machines (SVM) models. For comparative study, principal component analysis (PCA) and partial correlation analysis (PAR) were used for predictor selection of the models. This research will improve our knowledge on the climate–vegetation–hydrology relationships of the YZRB, which is an important high-altitude continental plateau basin.
3. Results and Discussion
3.1. Spatial and Temporal Characteristics of the NDVI in the YZRB
The inter-annual variations of the NDVI, precipitation, and temperature on the subzone scale from 2000 to 2015 are shown in
Table 3. The NDVI and temperature values showed a statistically insignificant increase, whereas the average precipitation of the Yarlung Zangbo River Basin significantly decreased from 528 mm in 2000 to 396 mm in 2015, with a total increase of 0.8 °C over the 16 years. This finding is consistent with the results of previous studies [
26].
In the five subzones, NDVI gradually increased from upstream to downstream. The average annual growth of NDVI in the five subzones was 0.1 × 10⁻³, 0.1 × 10⁻³, 0.4 × 10⁻³, 0.7 × 10⁻³, and 0.2 × 10⁻³. The precipitation and temperature show similar trends. The average annual growth of precipitation was −3.9, −3.7, −9.86, −13.86, and −12.8; the average annual growth of temperature was 0.02, 0.04, 0.07, 0.04, and 0.01.
3.2. Predictors Selection
In order to determine the optimal predictors for NDVI prediction models, PCA and PAR were used to analyze the relationships between NDVI and precipitation/temperature at different lead times. The results are shown in
Table 4 and
Table 5, where
Pn represents the average precipitation with a lead time n month, and
Tn represents the average precipitation with a lead time n month. With reference to similar studies and the meteorological cycles [
32,
33,
34,
35], the maximum lead times were set to 6 months.
As shown in
Table 4 and
Table 5, the correlations between the NDVI and precipitation/temperature gradually decayed with the increase of lead time. The PCA results show that the precipitation and temperature whose lead time was shorter than 2 months had major impacts on the NDVI in these subzones. However, the PAR results varied in these subzones. In Sub1 and Sub5, the precipitation in the present month and temperature whose lead time was shorter than 2 months had major impacts on the NDVI. In Sub2, the precipitation whose lead time was shorter than 1 month and temperature whose lead time was shorter than 2 months had major impacts on the NDVI. In Sub3, the precipitation whose lead time shorter than 1 months and temperature whose lead time shorter than 3 months had major impacts on NDVI. In Sub4, the precipitation whose lead time was shorter than 2 months and temperature whose lead time was shorter than 3 months had major impacts on the NDVI. In general, the relationships between the NDVI and temperature were slightly closer than those between NDVI and precipitation in the five subzones.
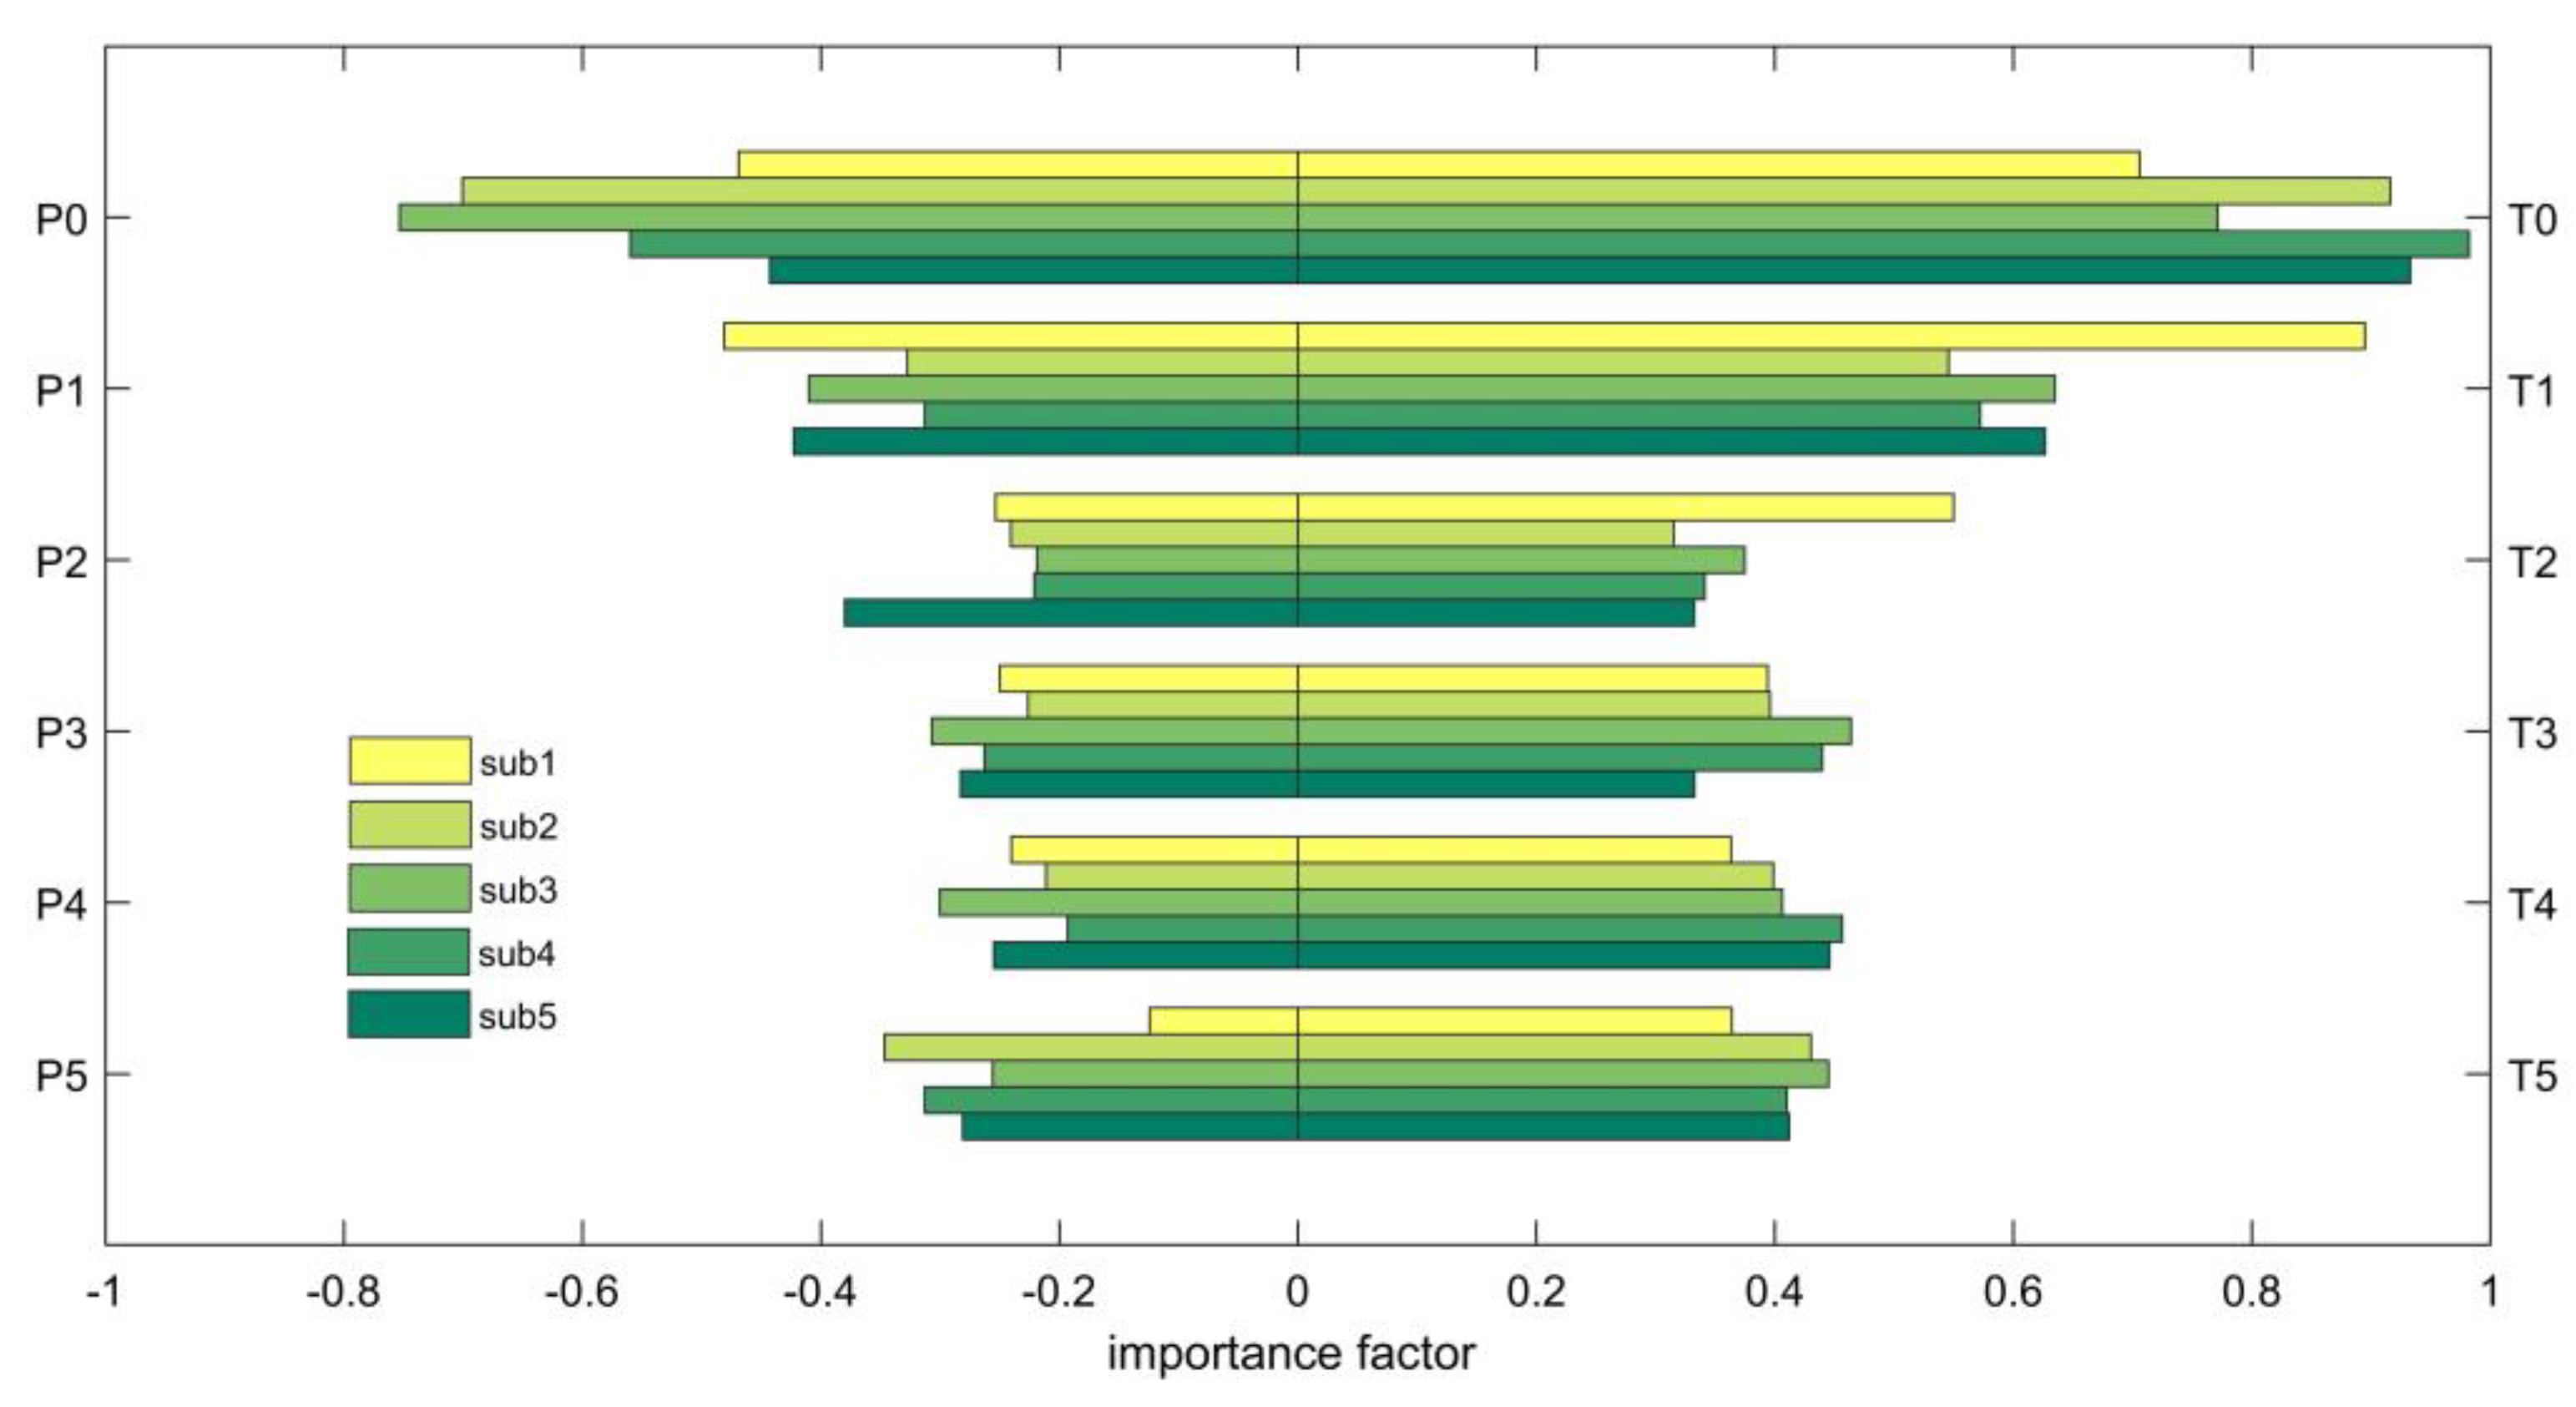
RF evaluates the relative contribution of each predictor using a built-in variable importance evaluation process. The importance of the precipitation/temperature at different lead times in these subzones are calculated and indicated in
Figure 3. As illustrated in
Figure 3, although the importance of precipitation and temperature gradually decreased, the increase in lead time and the decreases were not as significant as in the PCA and PAR results. This finding may indicate that RF can use all predictors without overfitting. Thus, the precipitation and temperature whose lead time was shorter than 6 months were used for RF modeling of the five subzones.
3.3. Comparative Study
The calibration and validation results of the RF and comparative models are summarized in
Table 6.
The results show that RF was superior to the comparative models in the calibration and validation periods. The NASH RF values for the five subzones were 0.96, 0.97, 0.96, 0.94, and 0.92 in the calibration period, and 0.91, 0.95, 0.96, 0.89, and 0.83 in the validation period. All of the measured criteria were superior to those of the compared models (ANN and SVM).
The results of the two-parameter selection were also compared between the ANN and SVM models. PCA was superior to PAR for both the ANN and SVM models. For the ANN models, the average RMSE and MAE were similar in both the calibration and validation periods. However, the average NASH and R of the results using PAR were superior to those of the PCA by 0.03 and 0.04 in the calibration period, and 0.03 and 0.05 in the validation period, respectively. For the SVM models, the average NASH and R increased by 0.03 and 0.02 in the calibration period, and 0.03 and 0.02 in the validation period, respectively. The average RMSE and MAE decreased by 0.002 and 0.004 in the calibration period, and 0.004 and 0.006 in validation period, respectively. Therefore, PCA was advantageous over PAR, with increases of NASH and R, and decreases of RMSE and MAE.
4. Conclusions
As a key component of ecohydrological processes, vegetation conditions influence the efficiency of plant water use and potentially affect water resources. Therefore, investing the changes of vegetation conditions and exploring the vegetation responses to climate changes will provide essential information for regional water resource management [
53,
54]. Combining with climate models, NDVI prediction models can assess the effects of future drought events [
10]. As a covariate with other environmental variables, NDVI prediction models will also provide essential information for irrigation management [
15] and soil-loss-prone area identification [
12,
13], etc. By exploring the vegetation condition changes of the YZRB and their relationship with climatic factors, we proposed an NDVI prediction model based on RF with area-averaged precipitation and temperature as predictors. The monthly rainfall and temperature observations from 30 meteorological stations in the YZRB and the MODIS NDVI datasets from 2000 to 2015 were selected to calibrate and validate the proposed model. The RF results were also compared with those of ANN and SVM models. The primary conclusions are as follows:
RF successfully simulated the relationship between NDVI and climatic factors. The NASH coefficients of the proposed model during the calibration period in the five subzones were all higher than 0.9, and those during the verification period were all higher than 0.8. Among the five tested models, RF showed the highest model efficiency in both the calibration and validation periods among all compared models.
RF showed advantages for predictor selection. The built-in variable importance evaluation allowed RF to select predictors without additional selection methods, such as PAR and PCA. Moreover, the numbers of predictors were greatest for RF among the compared models. RF showed robustness for modeling, because it could take full advantage of all predictor and avoid overfitting.
PCA and PAR were used to analyze the factors that affect the NDVI in YZRB subzones. The results show that the rainfall and temperature of the first 3 months had significant impacts on NDVI, and temperature had a greater influence than rainfall in most of the subzones.
Because of sparse meteorological networks, this research was conducted on a subzone scale. In the future, we will try to explore the relationships between NDVI and climatic factors at a higher resolution with gridded meteorological observations, which will be more applicable for integrated water resource management. The adoption of more vegetation indices, such as leaf area index (LAI), is another important direction.


 ,
, 


