Article

Experimental and Numerical Investigations of Turbulent Open Channel Flow over a Rough Scour Hole Downstream of a Groundsill

1
Department of Civil Engineering, National Chung Hsing University, Taichung 40227, Taiwan
2
Department of Civil Engineering, National Chiao Tung University, Hsinchu 30010, Taiwan
*
Author to whom correspondence should be addressed.
Water 2020, 12(5), 1488; https://doi.org/10.3390/w12051488
Submission received: 15 April 2020 / Revised: 13 May 2020 / Accepted: 21 May 2020 / Published: 22 May 2020
(This article belongs to the Section Hydraulics and Hydrodynamics)

Abstract

:
This study discusses the mechanism for the occurrence of equilibrium and non-equilibrium scour holes. By using a particle image velocimetry (PIV) measurement system, it measures the turbulent flow fields in an open channel moving through the rough bed below a groundsill. Then, the Reynolds-stress model (RSM), embedded in FLUENT software, is applied to perform a numerical simulation. The experimental results show that at equilibrium, the location of the re-attachment point is significantly affected by the flow discharge. Further, the re-attachment point of the scour hole affects the size and range of the counterflow zone, which becomes the main region for deposits in the natural channel. In addition, the formation of erosion is mainly affected by turbulence intensity and Reynolds stress. However, in non-equilibrium scour holes, our results clearly show that the turbulence intensity and the Reynolds stress are significantly larger at the end of the scour holes near the bed due to the continual development of the scouring. The correlation between the numerical simulation and experimental results are also examined. Overall, it can be seen that the simulated mean velocity profiles are quite consistent with the measured data. However, in terms of turbulence intensities and Reynolds stress, the simulated results could be overestimated when compared with the measured data; they are overestimated with a sudden decrease near the liquid surface. Although, the simulations in the near bed area show some divergence and the trend in the scour hole is quite consistent. Therefore, numerical simulations can be performed in advance to act as an important reference when evaluating the safety of downstream structures.

1. Introduction

Hydraulic structures are often installed along the rivers in Taiwan to control the flow and prevent erosion. A groundsill is one of the most common types of structure, which is built to ensure that the riverbed remains stable and does not degrade. Much research has been conducted on the formation of scour holes downstream of a groundsill. Most studies emphasize the estimation of the maximum scour depth under the equilibrium condition, but damage does not necessarily occur, only at the maximum scour depth in relation to the groundsill. The critical point at which downstream structural damage may occur has to be taken into consideration. In addition, there are still many detailed physical phenomena that need to be examined more closely, such as the flow field characteristics of equilibrium and non-equilibrium scour holes, in order to protect downstream structures. In recent years, advancements in computing hardware and software have meant that large amounts of numerical calculations are now used to solve the governing equations of fluid mechanics. Thus, computational fluid dynamics (CFD) has become an important technology in the field of fluid mechanics for simulating changes in the flow field. For a narrow open channel, the maximum flow velocity on a vertical line may occur below the surface of the liquid due to an increase in the lateral vortex swirling effect [1]. Therefore, in order to measure the two-dimensional flow field, this study adopts groups with a width to depth ratio (aspect ratio) greater than 5.
In a study of multi-phase flow and volume of fluid problems, Khan [2] used a commercial soft ware, STAR-CD, to express the free surface. The flow field is simulated using the k-ε turbulence mode and the governing equation is solved with second-order accuracy [2]. Yazdi et al. [3] performed a full three-dimensional turbulent flow simulation of a spur using the volume of the fluid to define the free surface and observing changes in the shear stress of the bed under different flow conditions. Then, the study of Salaheldin et al. [4] used the FLUENT software to simulate the three-dimensional flow and turbulence of clear water flowing around circular piers and then compared the simulation results of different turbulence models with actual data. The comparison showed that the results obtained using the Reynolds Stress Model (RSM) were closer to the actual data than the results obtained with the other models. Satisfactory results were also obtained for the bottom part of the flow. It is therefore concluded that a more accurate solution can be obtained using an RSM simulation of the complex flow field around a pier [4]. Breusers [5] and Dietz [6] observed the formation of scour holes under clear-water and low Froude numbers conditions in fixed-bed and fine-grain moving bed tests. The velocity gradient at the junction of the fixed bed and the moving bed was much larger in the near bed area than at the bottom of the equilibrium scour hole. It can be seen that the magnitude of the velocity gradient affects the scour depth [5,6]. In fact, the process of the evolution of scour holes could be divided into four phases: the initial phase, the development phase, the stabilization phase, and the equilibrium phase [7].
After comparing the length of the scour hole and the maximum scour depth, it could be found that if the x and y coordinates are dimensionless, the scour hole profiles all seem to have some similarities in previous experiments [8,9]. Ben Meftah et al. [10] examined the flow hydrodynamic structure in the scour hole at equilibrium. The flow velocity distribution, the turbulence intensities, the Reynolds shear stresses, the turbulent kinetic energy, and the turbulent length scales were also analyzed in this study. They successfully proposed a new scaling of the maximum scour depth, which improves the understanding of the scouring mechanisms [10]. A new transition regime boundary equation, which depends upon the upstream Froude number and the ratio of the weir height to the tailwater depth, was developed by Guan et al. [11]. Wang et al. [12,13] studied local scouring for different slopes in upstream submerged weir of the relationship between the average and maximum scouring depth. Ben Meftah and Mossa [14] exploited laboratory experiments to analyze the scour-hole development downstream in alluvial channels by Grade-control structures (GCSs). They devoted themselves to demonstrate more general formulas to predict scour evolution and equilibrium scour profiles. They found that the slope affects the scour evolution and a new scaling approach was proposed to predict equilibrium scour profiles downstream. In addition, studies of scouring given different slopes and different particle sizes with downstream submerged weir have been carried out to determine the scouring coefficient for a safe design.
In order to improve our understanding of the mechanism of equilibrium and non-equilibrium scour holes, this study investigates the formation of scour holes on the downstream side of a groundsill via experimental and simulation approaches. Two representative profiles were measured before and after equilibrium scour and chosen to build a fixed bed model with measurements, which was made by high-precision particle image velocimetry (PIV). Then, the numerical modelling software FLUENT was used to carry out a simulation. The simulation results from the Reynolds stress turbulence model were compared with the indoor PIV measurement data. The applicability of FLUENT for simulation of the flow field downstream of the groundsill was also discussed. This study provides insight discussions to the changes in the flow field and the hydraulic characteristics during the evolution of a scour hole. Using the proper water flow and sediment conditions, the model can be simulated before hydraulic model tests in the future as an important reference for planning and design.

2. Background of the Experiments and Model Setups

2.1. Experimental Equipment and Setups

Mobile bed tests were conducted first to determine the equilibrium and non-equilibrium scour hole profiles after the fixed bed models were constructed. Measurement was made by using a Particle Image Velocimetry (PIV) system to analyze the turbulent flow fields after obtaining the global velocity field for the measurement area. A schematic representation of the experimental flume zooming to the working zone is shown in Figure 1. The main dimensions of the channel included a flume with a length of 12 m, a width of 0.25 m, and a depth of 0.5 m; the sides and the bottom bed were constructed of 1 cm thick transparent glass. Note that the slope of the flume could be adjusted to obtain grades from 0% to 10%. The discharge rate was controlled by a fine-tunable flowmeter. A honeycomb flow-amendment system was set up at the flume inlet for the purpose of energy dissipation to ensure that the large-scale vortex was rectified and turned into a small-scale vortex [15].
The high-speed photography method was examined by PIV in order to capture scouring processes in this study. The experiments were conducted while using Phantom Miro ex4 high-speed camera with a resolution of 800 × 600 pixels and exposure times of 2–788 μs and combined the zoom lens of Nikon 50 mm with taking pictures, specifically 600 photos per second, as shown as Figure 2. The study used a UTOPIA laser, manufactured by UTOPIA Instruments Company at Taipei, Taiwan. It can be adjusted according to the different experiments’ settings to present vivid and clear experimental observations and data. In addition, the 8.2 m was determined as the landing elevation conducted in the experiment [15,16].
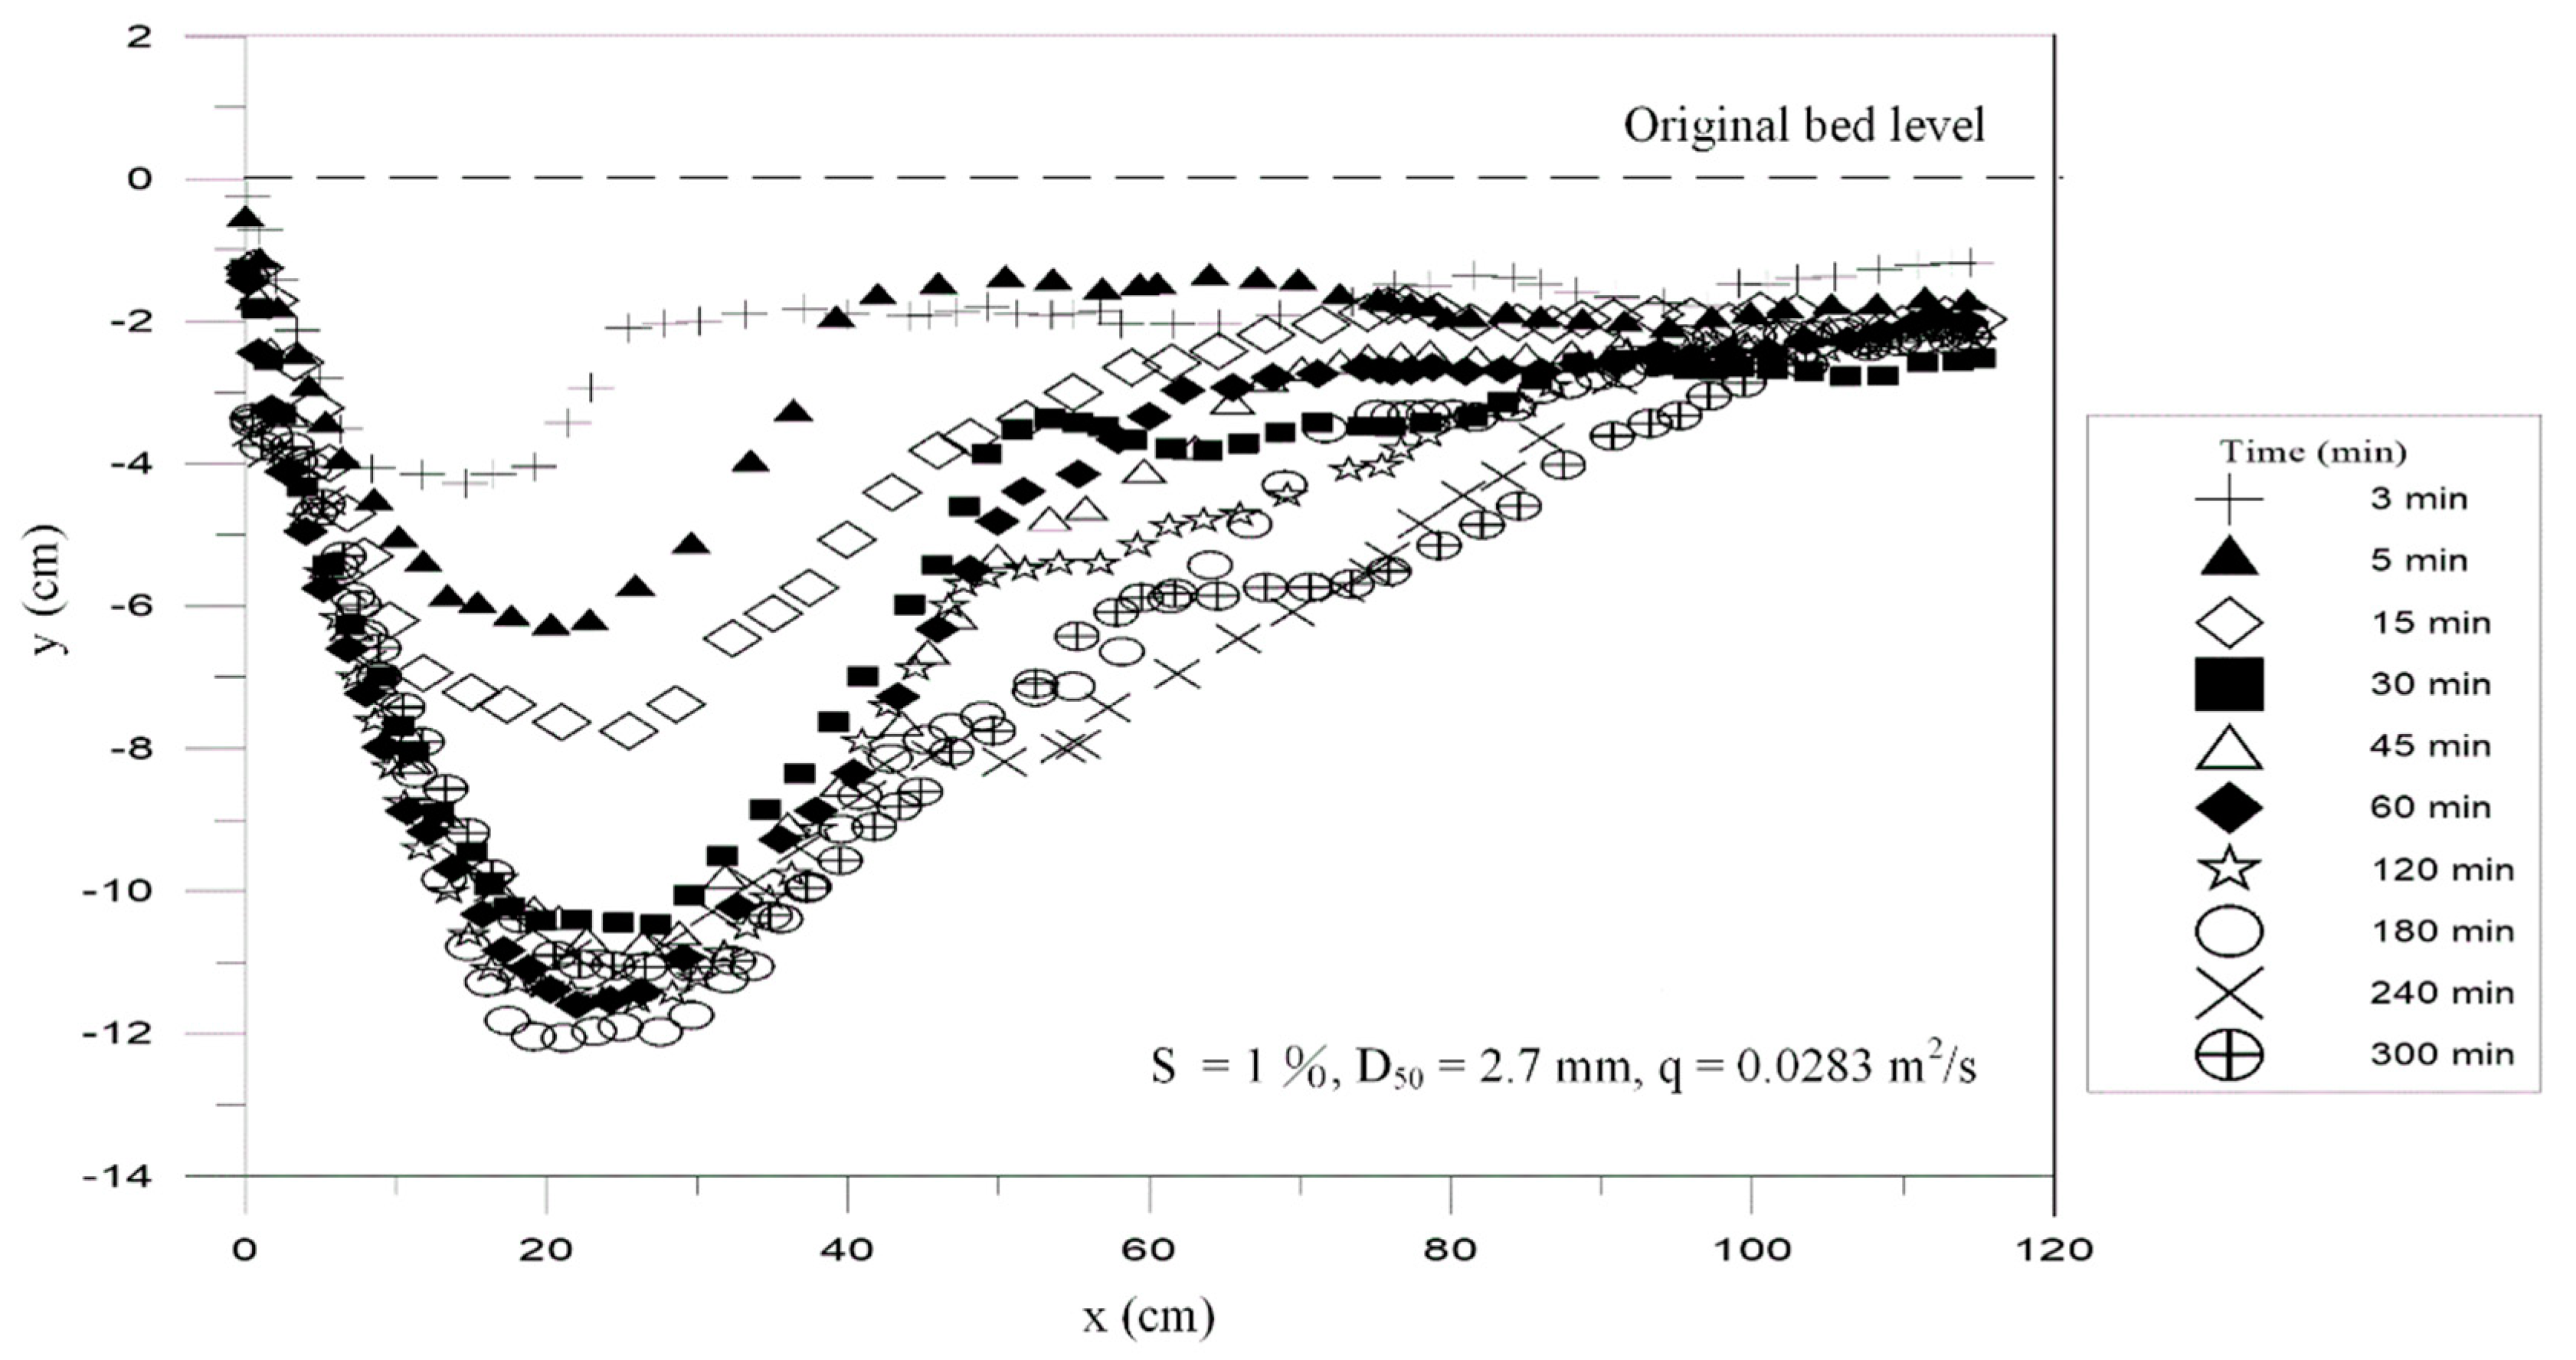
For the overall experimental design in this study, we referred to the study of Lu et al. [15]. The study adopted the formation of equilibrium scour holes near the Lung-En Weir on the Toucian River in Taiwan, parts of which were damaged by Typhoon Aere in 2004. The site was studied because the reach in Lung-En auxiliary Weir is mainly covered by Alluvial fans and much of its sediment is obstructed by the groundsill of Zhongzheng Bridge upstream. This leads to the bedrock exposures and local scour downstream. The piers were built both upstream and downstream due to the establishment of railway, high speed rail, and a controlled-access highway. These constructions resulted in the complexity of hydraulic conditions near the weir and even increasing its risk of destruction. Therefore, the experiments were conducted considering two independent variables of unit flow discharge (q) and bed slope (S). Data selected for scour holes downstream from the groundsill included unit flow discharge (q = 0.0283 m2/s), medium particle size (D50 = 2.7 mm), and bed slope (S = 1%). One percent was selected because it is a typical slope value for mid-stream western rivers in Taiwan, e.g., Toucian River. Further, unit discharge corresponding to a 20 year return period and the medium value of particle size (D50) referred to the riverbed of Lung-En auxiliary Weir at a scale of 1:50, which is 2.7 mm. For a non-equilibrium scour hole, it is not easy to establish as the scale has a short scouring time and a small depth of scour hole. It is difficult to see the difference between a scour hole before equilibrium and one produced after a long scouring time but with a similar depth, as shown in Figure 3. Therefore, in this study, a time of 15 min was selected and the average for ten groups of scour holes was obtained in repeated experiments. Moreover, as Lu et al. presented, the scour hole reaches equilibrium less than 5 h [15]. Based on the above, the study selected 5 h as the dividing time. And considering the similarity theory for the Froude number, the length and depth of the scour hole before and after equilibrium were downscaled by half. Glass granules, which have a diameter of one-half of the median diameter of about 1.3 mm, were fixed to the bottom of the bed.
The characteristics of the different flow fields in the open channel before and after equilibrium scour hole formation were discussed for a slope S = 1%. Three water depths were used: 2.4 cm, 3.1 cm, and 3.6 cm (corresponding to flow discharge Q = 0.0030, 0.0058, and 0.0085 cm, respectively) to obtain statistics for six flow conditions. Then, the PIV system was used to measure the flow field of the entire scour hole and on the vertical line (equilibrium scour hole, along the direction of water flow x = 4 cm, 8 cm, 14 cm, 20 cm, 26 cm; non-equilibrium scour hole, along the direction of water flow x = 3 cm, 6 cm, 9 cm, 13 cm, 17 cm). A schematic illustration of measurement is shown in Figure 4. The results were analyzed to explore the flow field characteristics of the open channel flow over the scour hole for different pit types. When the water flows into the scour hole, the flow field changes greatly due to the shape of the hole. This model mainly includes the hydraulic characteristics such as the mean flow velocity, turbulence intensity, and Reynolds stress of the channel centerline (x-direction). The experimental design included different hole types and water depths, as shown in Table 1. Among them, S1H24, S1H31, and S1H36 had the same slope for comparison in different flow experiments. Flow discharges were selected on the basis of Froude law with a length ratio and the slope, which was referring to typical gravel bed rivers in Taiwan.

2.2. Setups of Numerical Simulations

In terms of numerical simulation, this study adopted the Computational Fluid Dynamics (CFD) software to simulate flow field in a scour hole downstream. Then, the characteristic of flow field was further analyzed and compared with the experiment results. The differences of results between the simulation and experiment can be explored using numerical simulation to hydraulic design in the future. The FLUENT was used to establish a numerical model using the size of the fixed bed model, which applied the volume of fluid (VOF) method to construct a binary flow simulation of the free surface flow field [17,18]. A two-dimensional (2-D) with steady state flow simulation was implemented in this study. The computational domain included a 5 m length of straight flume before entering the scour hole, the length of scour hole in equilibrium and non-equilibrium, and the length of 8 m after fluid draining out of the scour hole. In order to ensure the accuracy of simulation, the height of the overall channel was set as 0.15 m. The grid resolution was 0.05 m in the straight flume. Further, the finer resolution in the scour hole was 0.01 m for the accuracy of the simulation. The quality of grid can be evaluated by skewness check by FLUENT. If a case of skewness is greater than 0.9, there is not an effective calculation in simulation. Thus, the average skewness is modified by the grids and is less than 0.9 in the study. This can be used effectively for a grid convergence.
The Reynolds-stress model (RSM) was selected to compare the difference between the experimental simulation and the numerical simulation. The RSM models can serve to demonstrate the importance of accuracy and validation in tests to enhance general understanding of the complex hydrological phenomena [19]. The simulation used the standard wall function in the bed [18]. The exit boundary was set to the pressure-outlet both on air and water and the inflow boundary of air and water was defined as the inlet velocity. The fluid in the upper layer of the inner zone was set to air and the lower layer was set to water. The two-layer zonal model was chosen for the wall boundaries and the VOF model was used at the free-surface. Moreover, the initial velocities at the inlet section were set to be the measured mean velocity. The pressures at the outlet were as follows: the pressure at the water surface was assumed to be zero; the effective pressure below the water surface was assumed to be hydrostatic. The numerical simulation in this study mainly discusses the applicability of simulations of turbulence and Reynold stress. Thus, the initial turbulent intensity adopted FLUENT defaults to discuss the simulation results. Further, the turbulence intensity (I) for the fully developed turbulent flow can be estimated by referring to the following pipe empirical formula [18]:
I = u u 0.16 ( R e ) 1 / 8 ,
in which I is initial turbulence intensity; u means longitudinal turbulence intensity; u is mean velocity of the cross section; and Re represents Reynolds number.
The turbulence length scale L is related to the largest energy containing eddies in the turbulent flow. For the fully developed pipe flow, the turbulence length scale was limited by the pipe diameter. The turbulence length scale (L) in meters can be estimated with the following approximate relationship [16]:
L = 0.07 J ,
in which J represents pipe diameter. The coefficient was estimated based on the maximum mixing length (0.07) of the fully developed turbulent pipe flow. For a channel with a non-circular cross-section, J can be considered as the hydraulic radius.
The roughness height (ks) and roughness constant (kr) were set for the bottom of the channel. For the roughness to take effect, one must specify a non-zero value for ks. A roughness height (ks0) of zero corresponds to smooth walls. For a uniform sand-grain roughness, the height of the sand-grains can simply be ks. The roughness height was set to be 0.0013 m of D50, referring to the experiment.
Lu et al. [15] indicated that the normalized velocity profiles can be approximated as a normal distribution as follows:
u ¯ u ¯ m a x = e x p ( h / h m a x 2 σ ^ u 2 ) ,
where u ¯ is longitudinal mean velocity, h is vertical distance measured above the recirculation zone, u ¯ m a x and h m a x are maximum u ¯ and h values at u ¯ m a x , respectively, and σ ^ u represents standard deviation. The upper envelope curve was estimated by interpolation. Based on the results of regression analysis, it indicates that although the maximum velocity of the submerged jet decreases as the flow expands downstream, the similarity criterion can be applied in this experiment [15]. The study applied the above theory to validate the normalized mean velocity profiles and a reasonable mean velocity was obtained. Due to the fact that the mean velocity can be simulated reasonably, using the basis empirical relationships of FLUENT is feasible in this study.

3. Results and Discussion

3.1. Scour Hole Model and Measurement System Verification

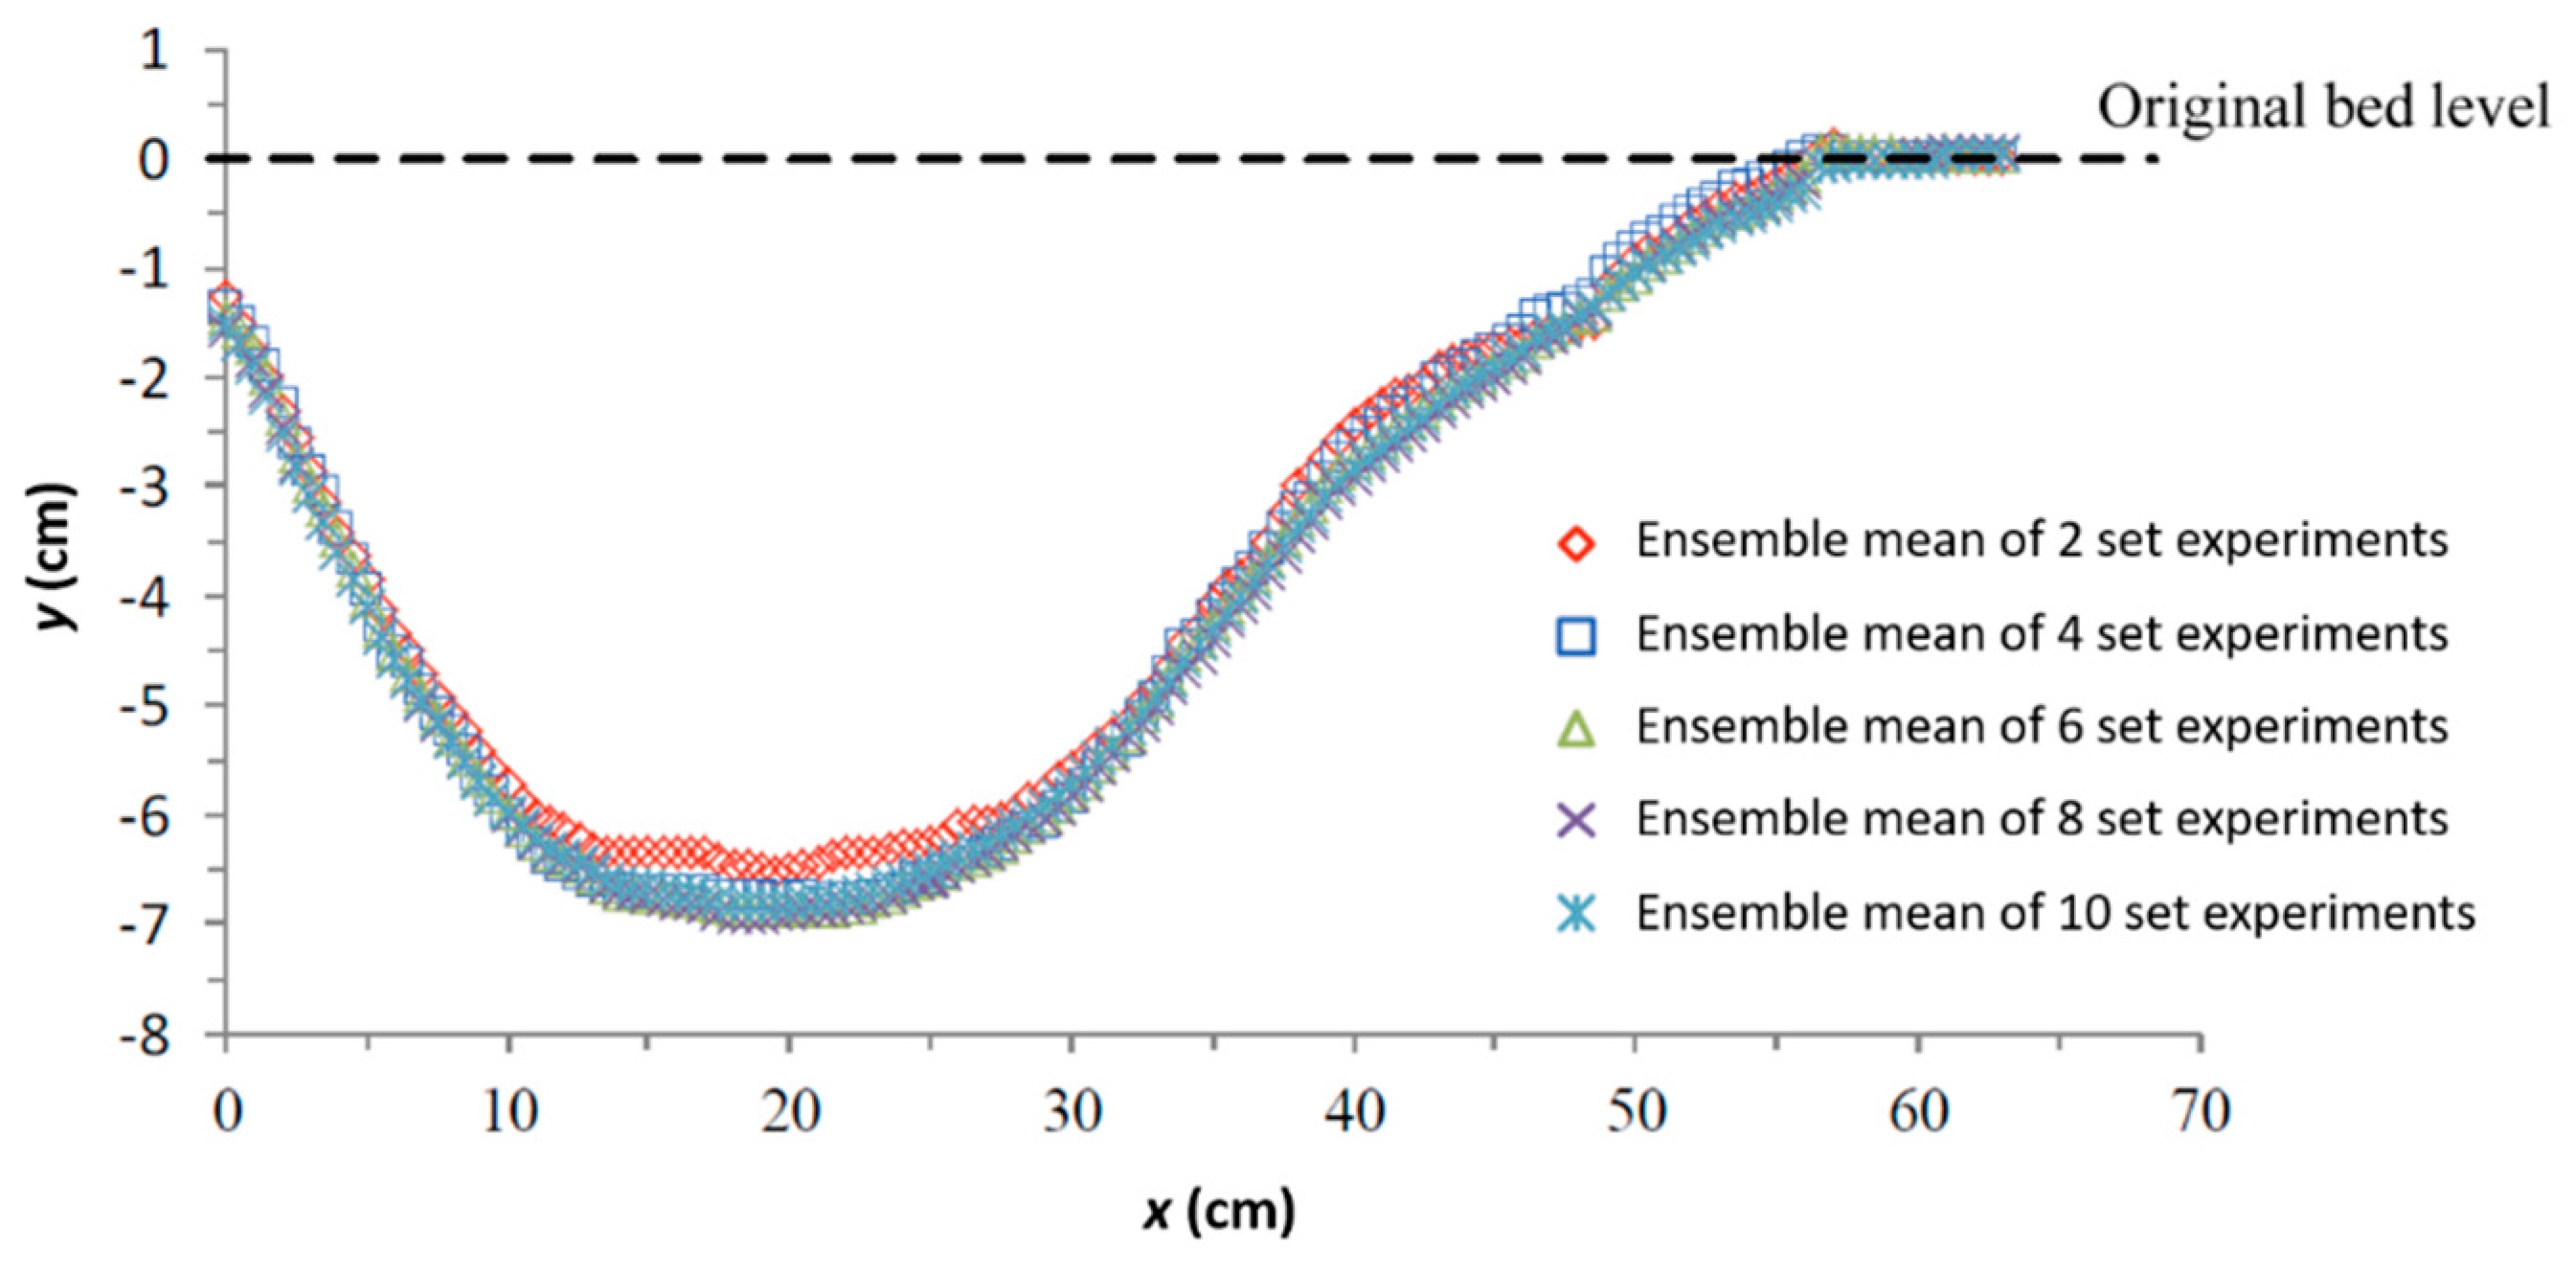
Lu et al. [15] indicated a very high scouring rate for the first hour and the scouring will almost reach equilibrium after 5 h. The experimental duration of 5 h represents the peak flow duration for an unsteady flood event. The repetitive experiments have implemented to perform the average deformation of scouring hole by using PIV mage analysis, shown in Figure 5. The experiments revealed that the deformation of the scouring hole tended to gradually stabilize after taking an average of more than four set experiments. Thus, an ensemble mean of the 10 times measured data was adopted. In this study, the average data for being repeated 10 times with 5 h equilibrium scour hole experiments were compared with the previous results [8,9,20], as seen in Figure 6. The coordinates x and y are dimensionless, corresponding to the maximum scour hole length (Ls,m) and the maximum scour depth (ys,m), respectively. The dimensionless equilibrium scour hole profiles reveal a considerable similarity among these experiments. Figure 6 also presents that experimental results of dimensionless analysis showed the high repeatability of the formation of the equilibrium scour hole. Lu et al. [20] defined the relations between dimensionless scour depth and its scouring time. Here, the depth of the non-equilibrium scour hole in this study is similar to the scour depth obtained from previous studies [20].
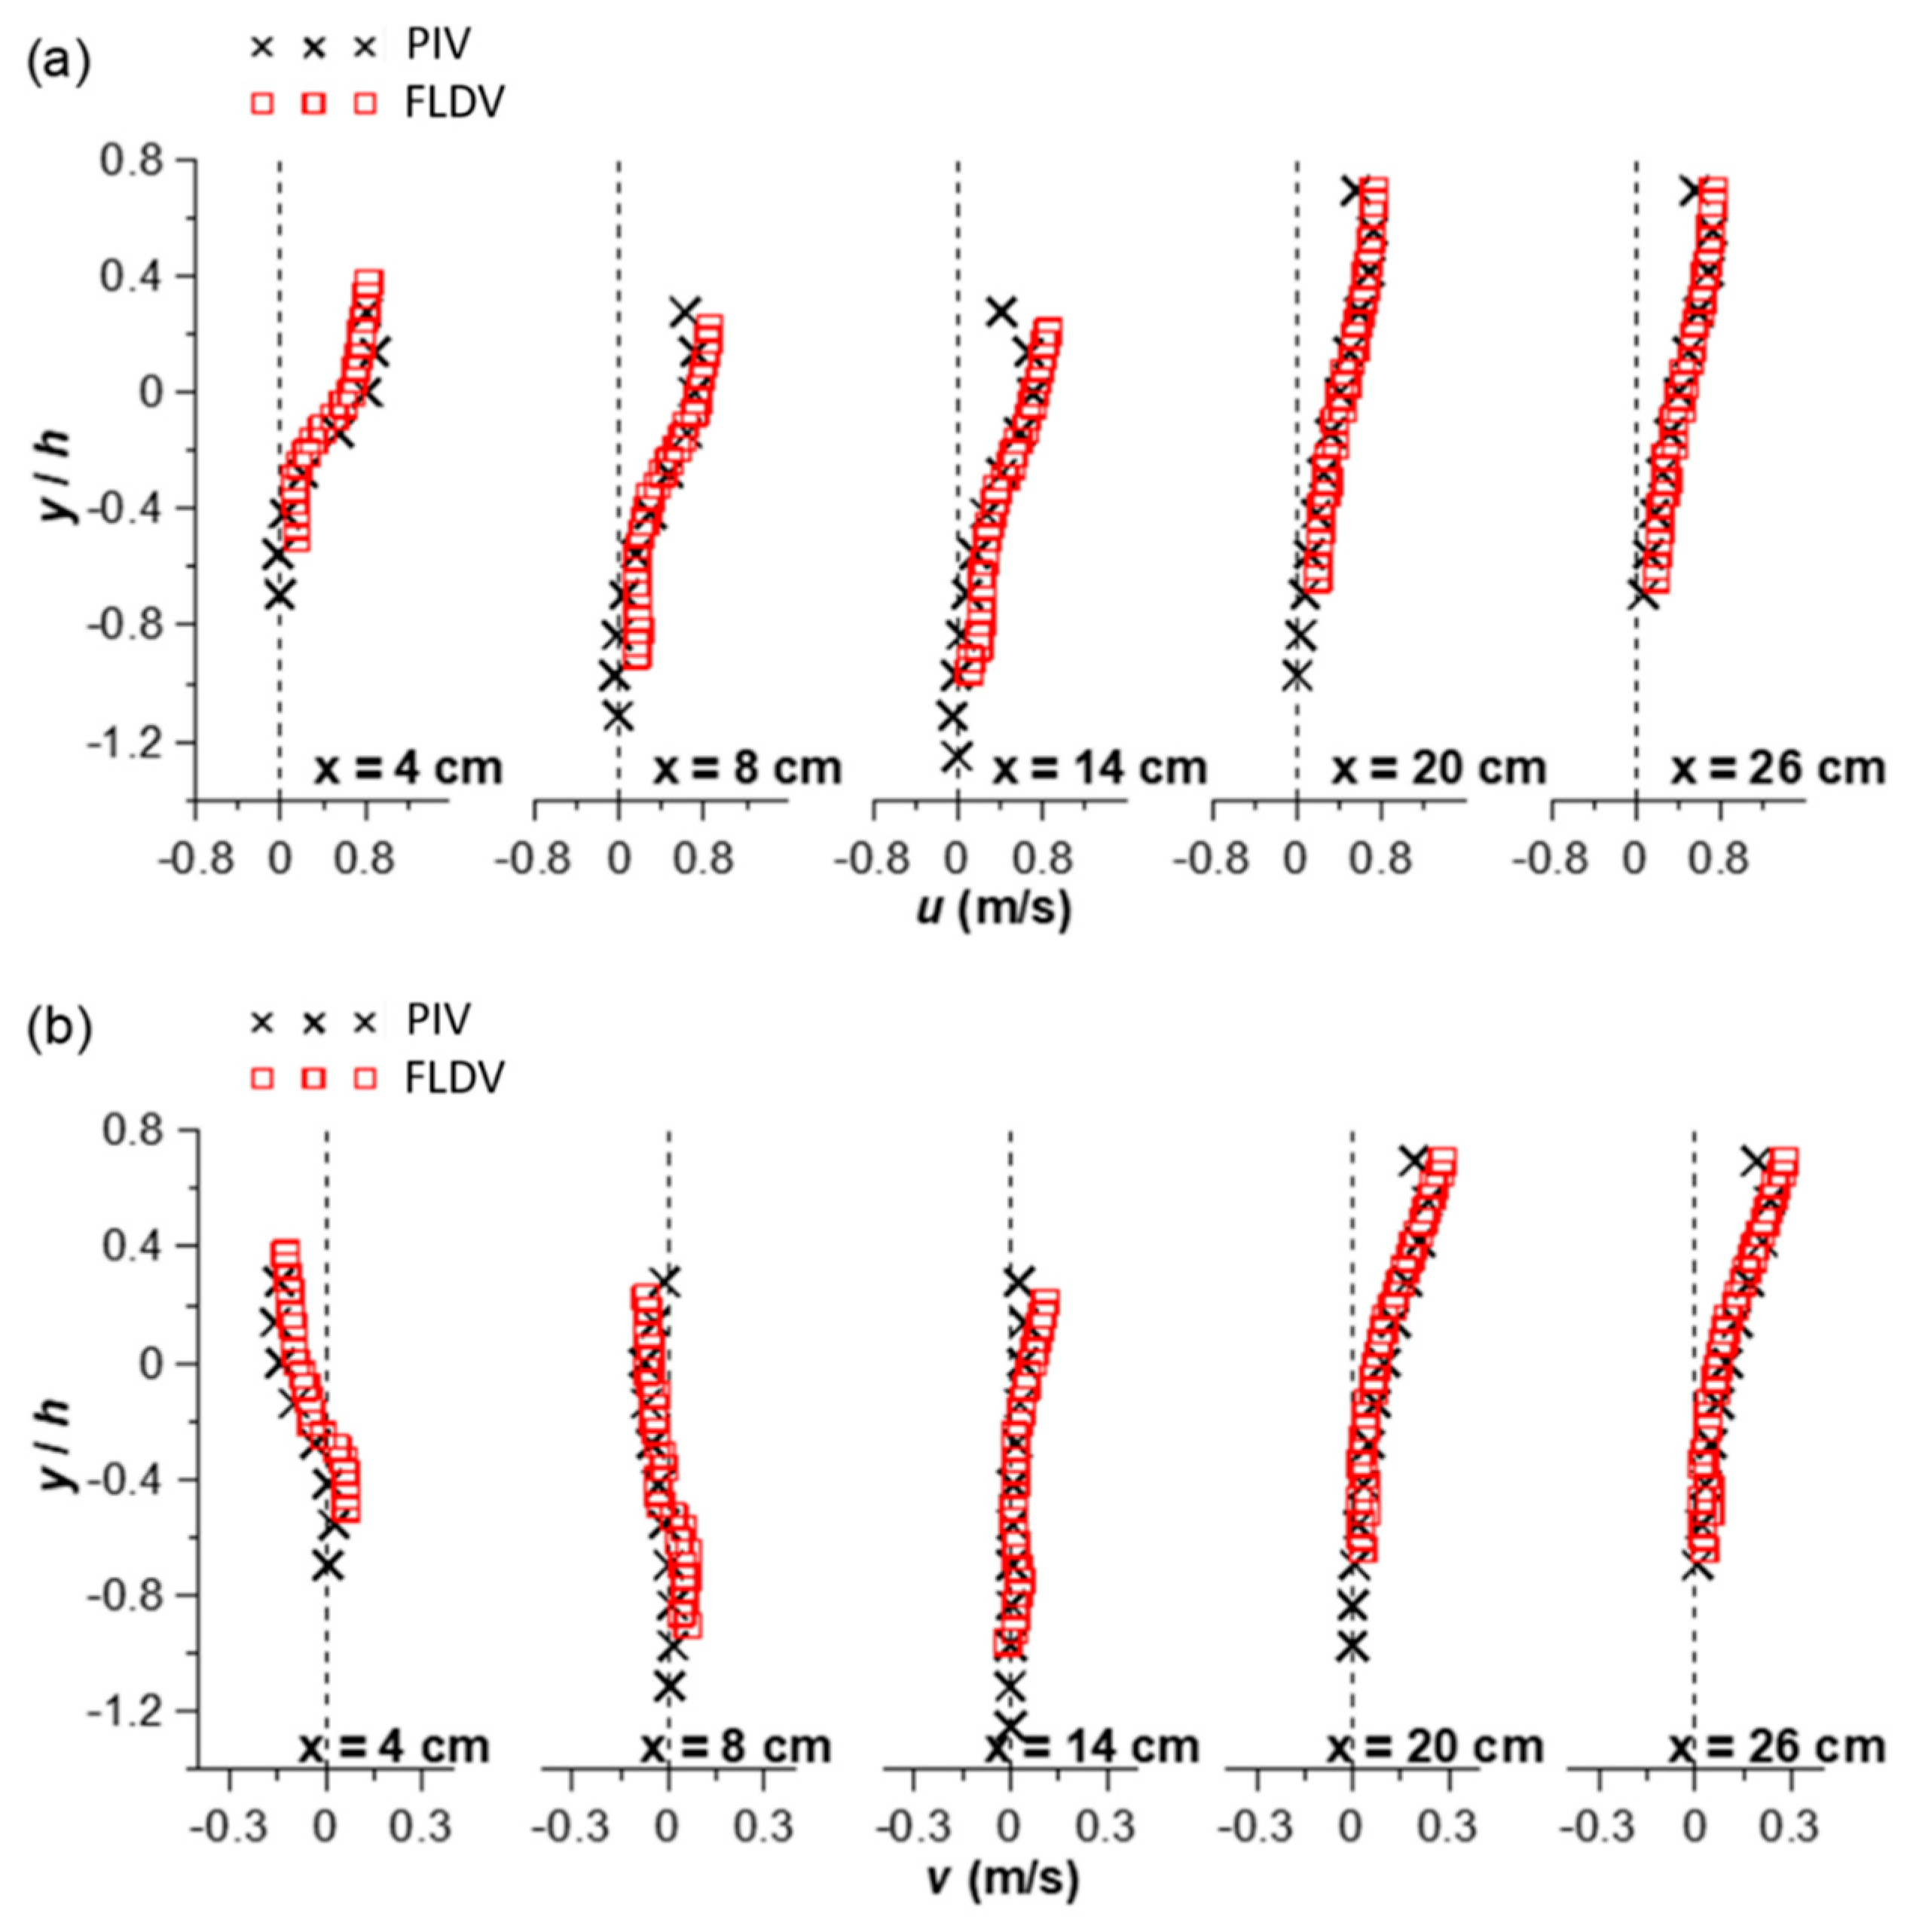
The feasibility of the PIV system was verified by comparison with the measurement results from a fiber-optic laser doppler velocimeter (FLDV) system. The conditions for the balanced scour hole for S1H36 (Table 1) were selected for verification, with the FLDV measurement data compared with the PIV measurement data for the same position. The measured vertical line positions were x = 4, 8, 14, 20, and 26 cm downstream of the groundsill and the measurement items included longitudinal velocity and vertical velocity. The results are shown in Figure 7, where x is presented by velocity along flow direction and y is dimensionless corresponding to the water depth. The near part of the bed could not be measured with the FLDV and the water surface was disturbed, with some slight deviations caused by fluctuations in the water surface and bubbles, which caused errors in the PIV measurement. Overall, in addition to the water surface and the bottom bed area, there was good consistency in the velocity field measurement data between the FLDV and PIV.

3.2. Discussion of Experimental Results

The velocity distribution is important in the study of the movement mechanism of open channel water flow. Figure 8 shows the velocity profile for each position measured under different discharges but the same slope. The x axis presents velocity along flow direction, and y axis is location. As can be clearly seen in Figure 8a, an equilibrium scour hole becomes obvious with a reduction in the discharge and the range of the counterflow zone negative velocity becomes larger; S1H24 is particularly obvious. The re-attachment point results in stress of x = 26 cm (x = 23 to 26 cm). The size and range of the non-equilibrium scour hole counterflow zones are almost unaffected by the magnitude of the incoming flow velocity, as shown in Figure 8b. With the exception of S1H36, the velocity profile of each group at the re-attachment point x = 17 cm shows no reverse velocity. This is caused by clockwise eddies in the current protecting the hole and approximately horizontal high-speed nappe flows. Similar dependencies of equilibrium scour hole on velocity can be found in Wang et al. [21]. Their results show that the equilibrium downstream scour depth is determined by the strength of the overflow. Thus, an increased intensity results in a deeper downstream scour hole. Moreover, Dey and Raikar [22] mentioned that velocity is relatively strong when the dimensions of scour holes are small, but it decreases progressively due to increases in flow area as the scour depth increases. In short, there is a correlation between the location of the re-attachment point and the equilibrium of the scour hole. The position of the re-attachment point is relatively consistent before the scouring pit reaches equilibrium. After equilibrium, the size of the scour hole will change with the flow discharge. If the discharge is smaller, the counterflow zone will be larger and the re-attachment point will be further downstream. Therefore, in the actual situation, the counterflow zone is an important factor to the scope of the scouring. Ben Meftah and Mossa [23] studied that in their first set of experiments, it is also displayed that the scour hole dimensions are influenced by the proximity of sills and high discharge, as indicated in the foregoing lines.
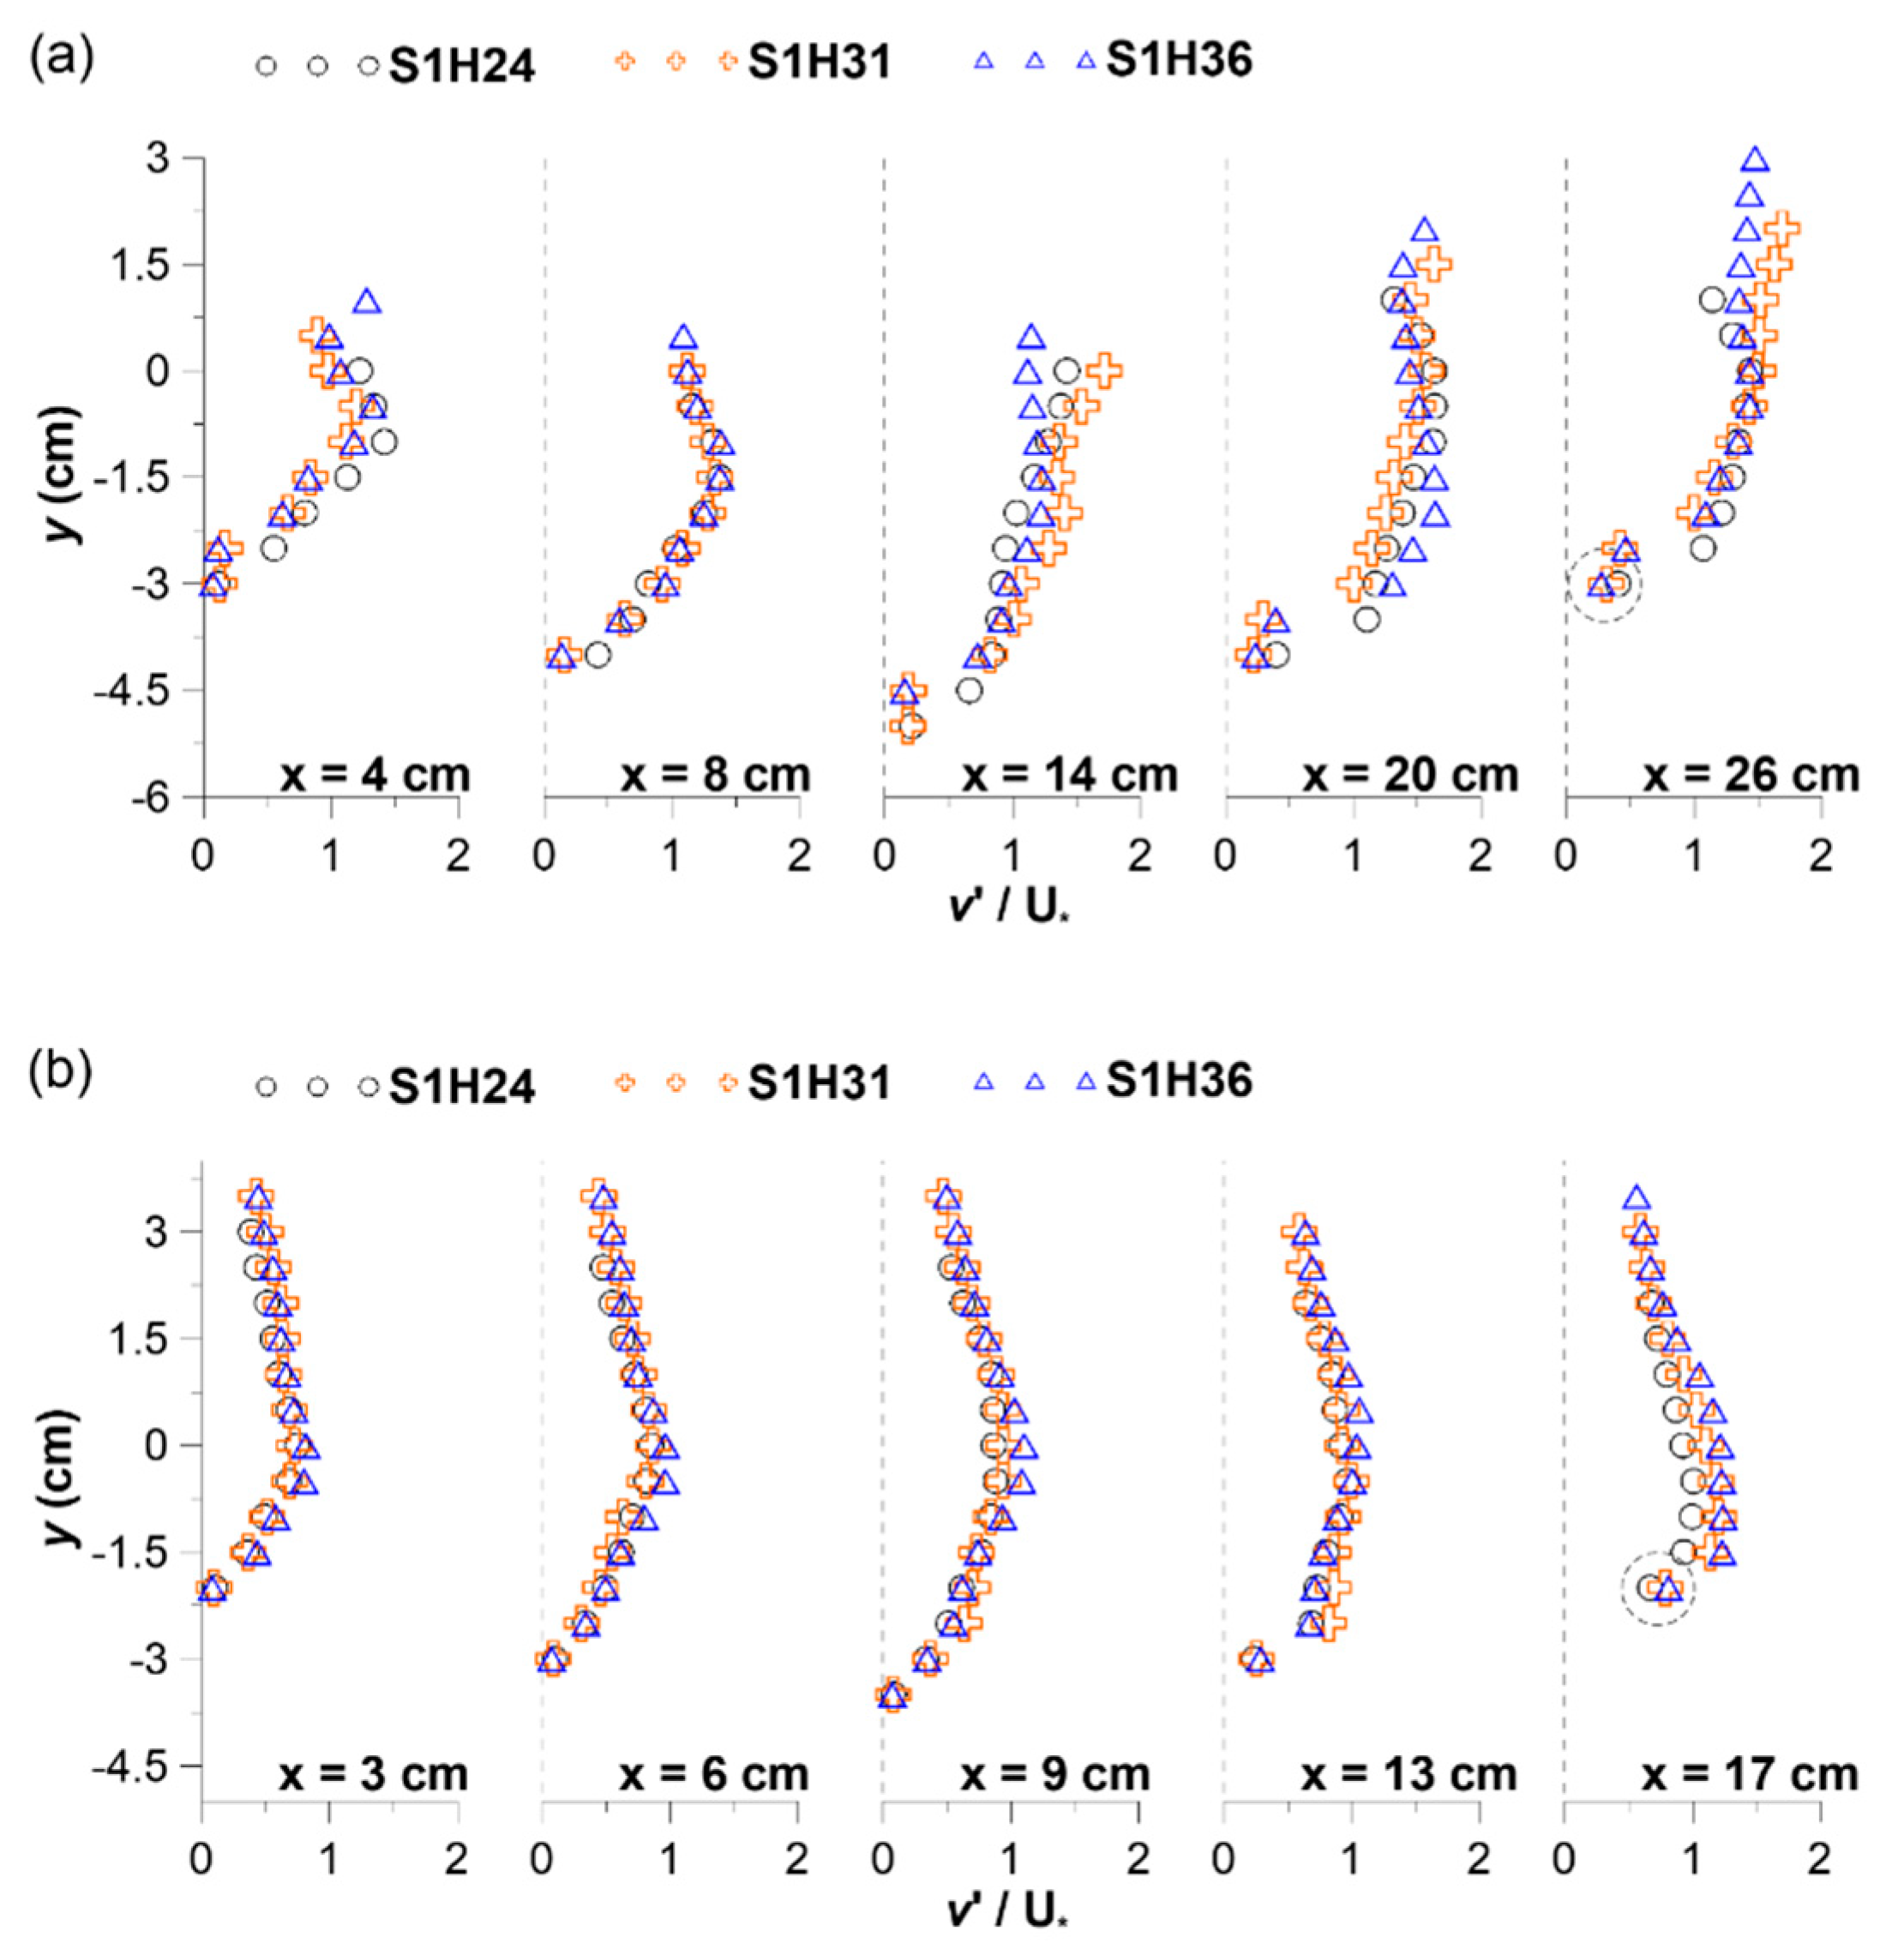
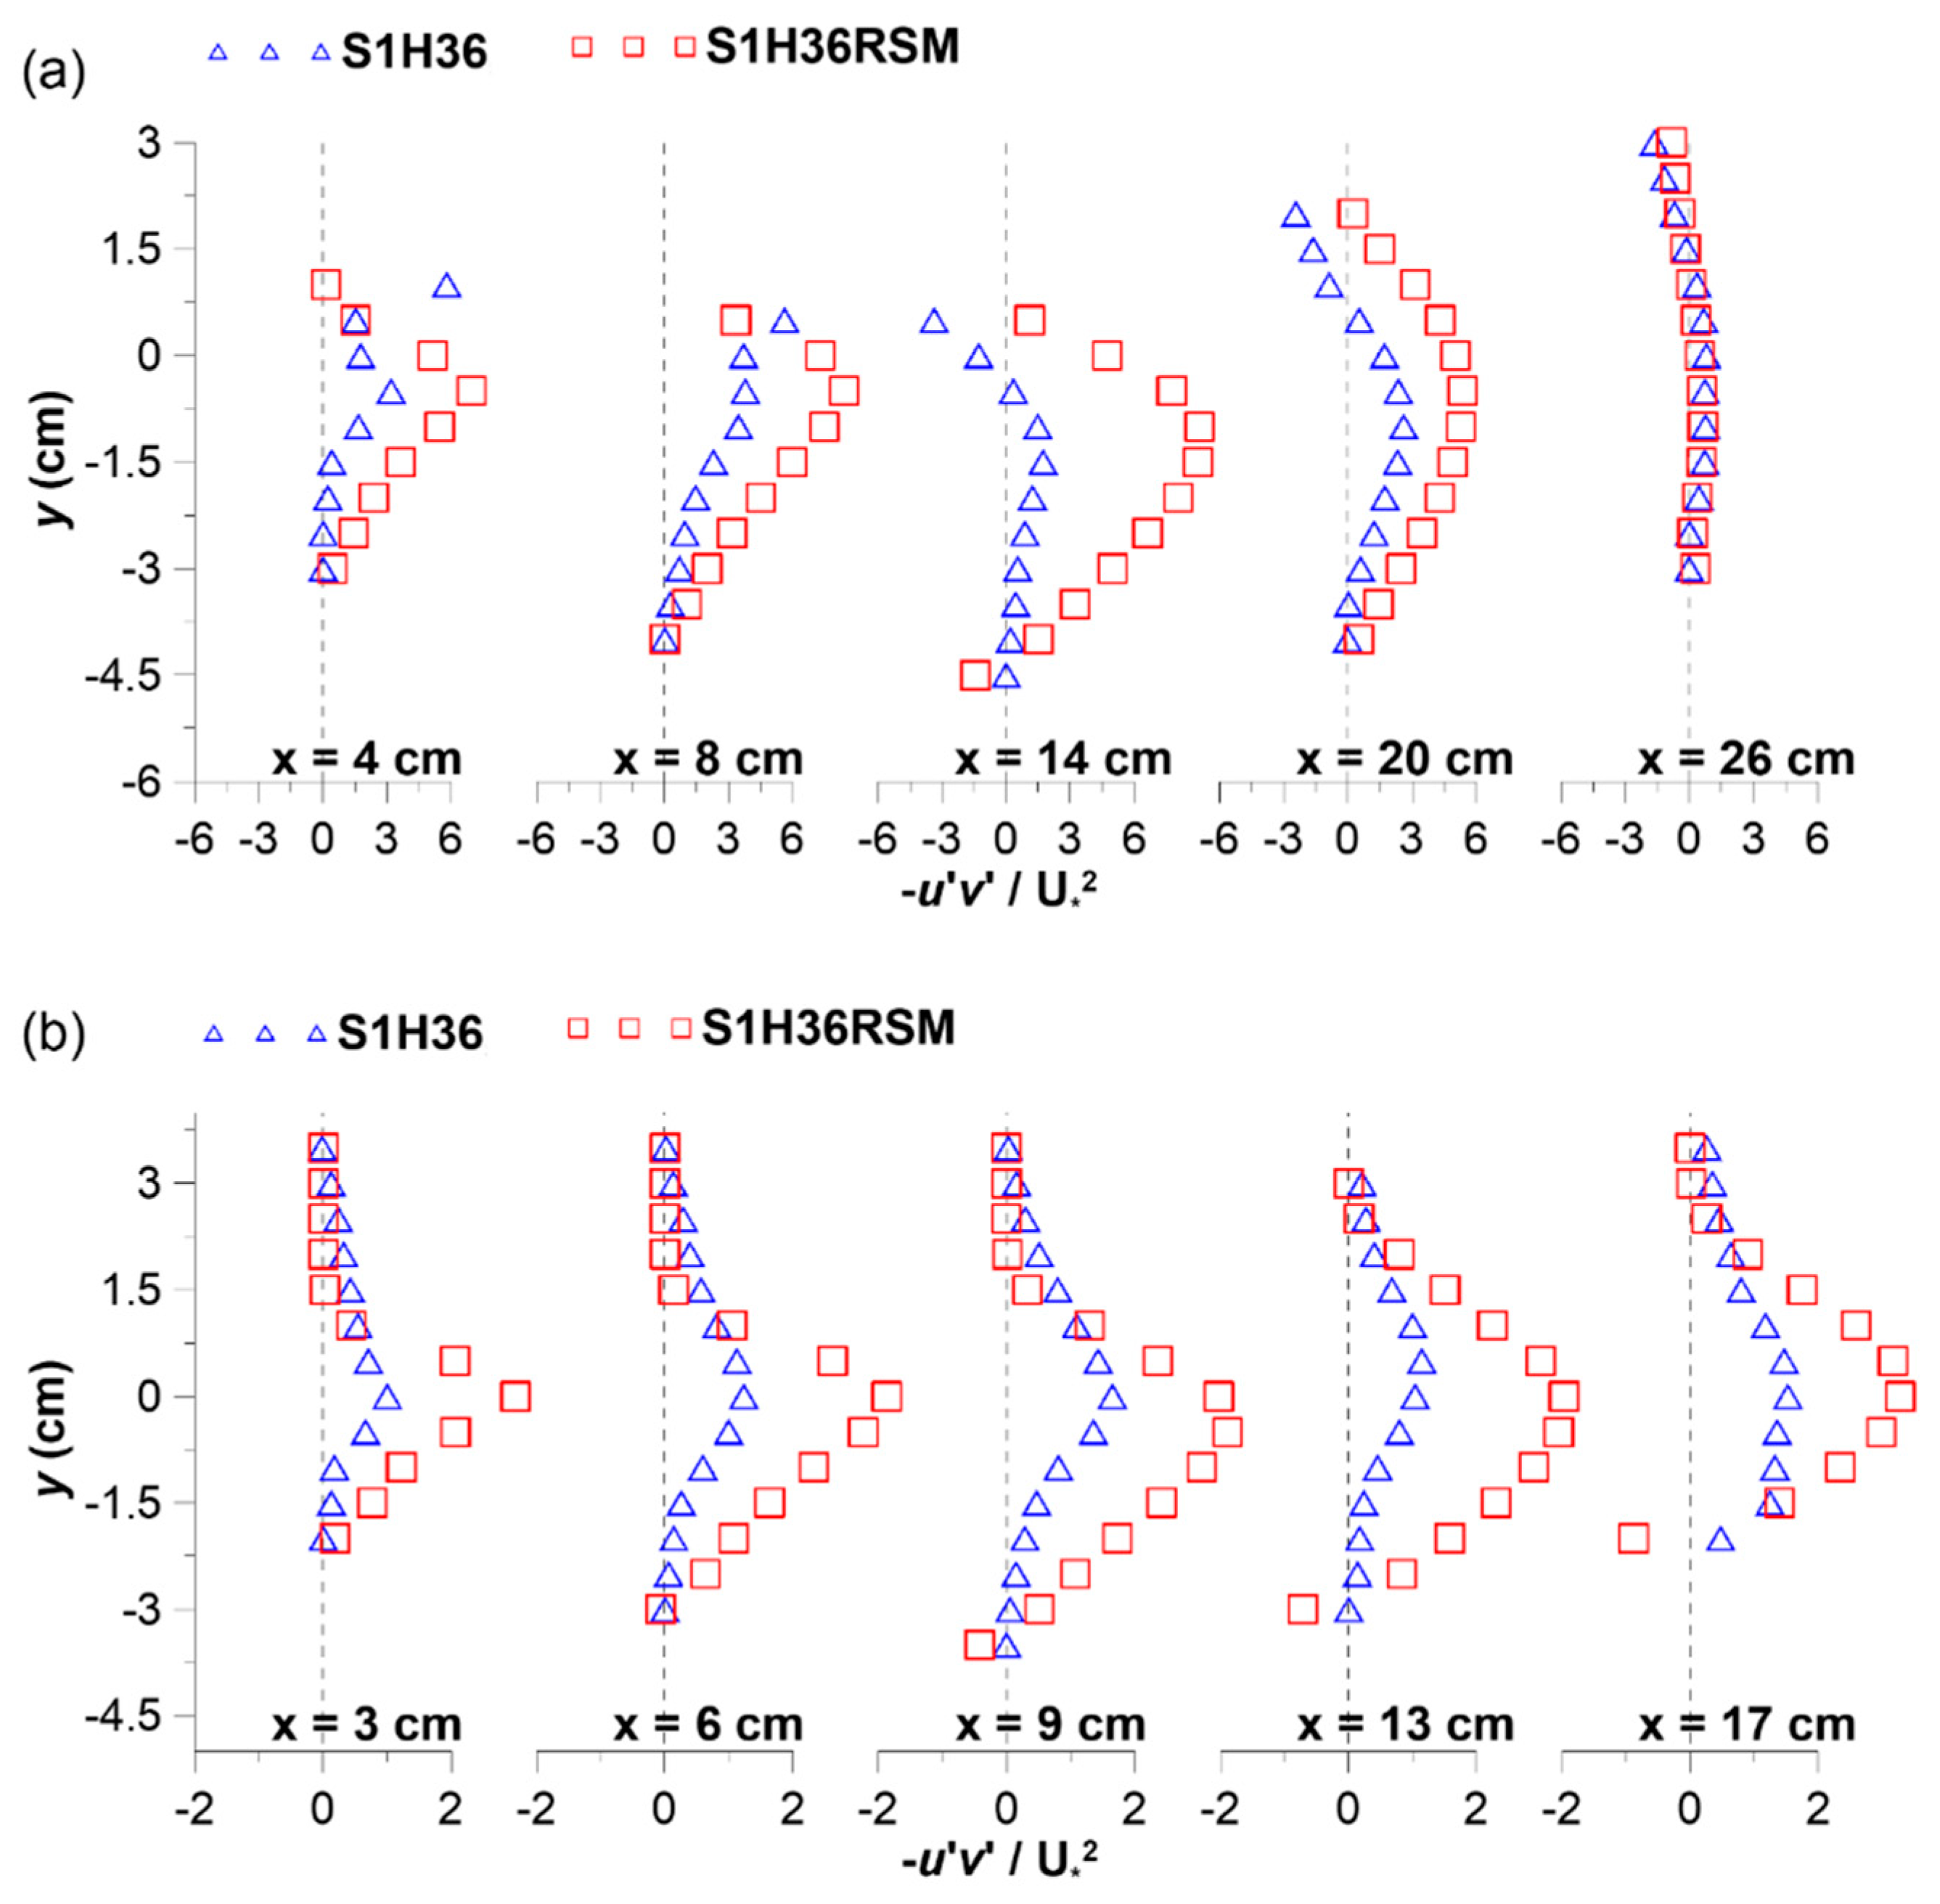
Figure 9 and Figure 10 present the turbulence intensities (I) in the flow field measured with different discharges for scour holes, where the x axis is presented by a dimensionless of velocity along main flow (x) and vertical (y) direction (u’ and v’), respectively, divided by friction velocity ( U * ). Generally, in a fully developed two-dimensional open channel turbulent flow field, the total shear stress can be expressed as the sum of the viscous shear stress and the Reynolds stress. The Reynolds stress in the turbulent flow is mainly the vertical motion of the vortex, which results in the exchange of momentum between the water layers in the turbulent flow field. The momentum exchange is closely related to the turbulence intensity between the water layers. In addition, for a uniform open channel flow, in order to ensure that the Reynolds stress and the direction of the viscous shear stress coincide with a positive value, a negative sign is added before the Reynolds stress term. The positive and negative values of the entire Reynolds stress indicate the direction of momentum transfer. If it is positive, the momentum in the flow field is transmitted downward. In summary, the main cause of scouring is due to the intensity of the turbulence and the Reynolds stress. As can be seen from Figure 9b, the intensity of the turbulence in the main flow direction (u’) is greater for the non-equilibrium scour hole (x = 17 cm) near the bed (y = −2 cm) than for the equilibrium scour hole (x = 26 cm in Figure 9a) near the bed. Similarly, it is also true for the turbulence intensity in the vertical direction (v’), as shown in Figure 10a,b. The Reynolds stress is shown in Figure 11, where the x axis presents the dimensionless of turbulence intensity along main flow direction (u’) multiplied by vertical direction (v’). These results are consistent with Figure 8 where we can see that continued scouring and the downstream movement of the re-attachment point for the non-equilibrium condition is due to the higher turbulence intensities and Reynolds stress. This result is in agreement with the result of a previous study [23]. At the equilibrium stage, the three components of the flow turbulence intensities at different positions are very high in the scour hole. In addition, the scour hole development is due to a consequence of the high forces of the shear stresses acting over the bed. As for the study of Guan et al. [24], they found that the location of maximum scour depth is at the rear of the flow reattachment region. It similarly shows that increased turbulence appears to offer a mechanism by which shear stress is increased in the upstream portion.

3.3. Comparison of Experimental and Simulation Results

Figure 12a shows the mean velocity distribution for equilibrium scour holes. The magnitude and range of the countercurrent velocity decreases with the increase of the discharge, although the range of the counterflow zone (dashed circle) is slightly smaller than the measured value (see dashed circle in Figure 8a). Secondly, with the Reynolds stress model (RSM) we cannot obtain a very accurate simulation of the near-liquid surface area of the high-speed nappe segment, but the trend of the re-attachment point follow-up flow is consistent with the measured value. In addition, the mean velocity of the non-equilibrium scour hole is also overestimated in the near-liquid surface area Figure 12b, while the counterflow zone is almost unaffected by the discharge. However, the velocity at the end of the scour hole (x = 17) near the bed is slightly less than the measured value. Overall, the simulated mean velocity profile is fairly consistent with the experimental data.
In order to facilitate the comparison between the experimental results and the simulation, the turbulence intensity is discussed for the representative group for S1H36. A comparison of Figure 12 and Figure 13 shows that the simulated turbulence intensity is higher than the measured value, and the trend for other scour holes is the same. In addition, there is a sudden decrease in the simulated near liquid surface value and the simulated value in the near bed area is also quite large. In Figure 13b and Figure 14b, it can be seen that the end of the non-equilibrium scour hole (x = 17) near the bed has the same tendency as the experimental value. In Figure 15, taking S1H36 as an example, the dimensionless Reynolds stress simulated by the RSM model were higher than the measured values. However, the trend of the simulated profiles is consistent with the measured one. In general, the predicted location of the maximum Reynolds stress is fairly consistent with the measured one in each profile. In summary, it is speculated that the non-equilibrium scour hole at the position of x = 17 cm in the simulation will continue to develop, because this is the position where the bursting is generated [25]. The simulation results for the high order terms (turbulent intensities and Reynolds stress) are somewhat different from the experimental results. But, overall, they are consistent with the actual measurement trends for the mean flow field. In future, such simulations can be used as the basis for the prediction of downstream scouring.

4. Conclusions

This study used a PIV measurement system to measure the turbulent flow fields in an open channel moving through the rough bed below a groundsill. A numerical simulation was then carried out using the RSM module of the CFD software FLUENT. The following conclusions wrap up the research results.
The results revealed that, firstly, the re-attachment point for equilibrium scour holes depends on the discharge. The lower the discharge is, the furtherer the point moves down towards the downstream. It also enlarges the counterflow zone in the scour hole. In short, this experiment results show a similar trend with the simulations, however there is a smaller counterflow zone in the simulation result. Based on the above slight deviation, it revealed that the real sediment accumulation zone downstream of a groundsill may be underestimated by using numerical simulation-based design in engineering.
Secondly, in the non-equilibrium scour hole, there is no direct correlation between the discharge of incoming flow and the position of re-attachment according to the results of the simulation and experiment. Although the simulation result of mean velocity profiles was consistent with the experiment’s, the near-bed velocity is lower in the simulation than in the experiment. Thus, an underestimation of effect in near-bed sediment transport is exposed by using numerical simulation-based design in engineering.
This study also found that the simulation result of mean velocity is consistent with the experiment outcomes, but the simulation results of turbulent intensity and Reynolds stress are somewhat overestimated compared with the experiment results. In addition, there is a sudden decrease near the liquid surface. Therefore, the impact of high velocity nappe is less easy to simulate. The evaluation of numerical simulation-based design in engineering should gain more serious concern in the future.

Author Contributions

C.-K.C. implemented numerical simulations and wrote the paper. J.-Y.L. conceived and designed the study. S.-Y.L. and Z.-X.W. conducted the experiment and implemented the data analysis. D.-S.S. conceived the study and wrote the paper. All authors have read and agreed to the published version of the manuscript.

Funding

This research was founded by the Ministry of Science and Technology, Taiwan, under Grant no. MOST-108- 2628-M-009-005.

Conflicts of Interest

The authors declare no conflict of interest.

References

  1. Schlichting, H. Boundary Layer Theory, 7th ed.; McGraw-Hill Book Company: New York, NY, USA, 1979; pp. 596–602. [Google Scholar]
  2. Khan, L.A. A Three-Dimensional Computational Fluid Dynamics (CFD)Model Analysis of Free Surface Hydrodynamics and Fish Passage Energetics in a Vertical-Slot Fishway. N. Am. J. Fish. Manag. 2006, 26, 181–193. [Google Scholar] [CrossRef]
  3. Yazdi, J.; Azamathulla, H.M.; Ghani, A.A. 3D simulation of flow around a single spur dike with free-surface flow. Int. J. River Basin Manag. 2010, 8, 55–62. [Google Scholar] [CrossRef] [Green Version]
  4. Salaheldin, T.M.; Jasim, I.; Chaudhry, M.H. Numerical Modeling of Three-Dimensional Flow Field Around Circular Piers. J. Hydraul. Eng. 2004, 130, 91–100. [Google Scholar] [CrossRef]
  5. Breusers, H.N.C. Conformity and time scale in two-dimensional local scour. In Proc. Symposium on Model and Prototype Conformity: 1–8; Hydraulic Research Laboratory: Poona, India, 1966. [Google Scholar]
  6. Dietz, J.W. Scouring in fine or lightweight bed materials by subcritical flow. In Mitteilungen der Versuchsanstalt für Wasserbau und Kulturtechnik, Theodor-Rehbock-Flußbaulaboratorium; Universität Karlsruhe: Heft, Germany, 1969; pp. 1–120. (In German) [Google Scholar]
  7. Zanke, U. Zusammenhange Zwischen Stromung und Sedimenttransport; Mitt. Des Franzius Instituts der Univ. Hannover: Hannover, Germay; Springer: Berlin, Germany, 1978. (In German) [Google Scholar]
  8. Gaudio, R.; Marion, A.; Bovolin, V. Morphological effects of bed sills in degrading rivers. J. Hydraul. Res. 2000, 38, 89–96. [Google Scholar] [CrossRef]
  9. Gaudio, R.; Marion, A. Time evolution of scouring downstream of bed sills. J. Hydraul. Res. 2003, 41, 271–284. [Google Scholar] [CrossRef]
  10. Ben Meftah, M.; De Serio, F.; De Padova, D.; Mossa, M. Hydrodynamic Structure with Scour Hole Downstream of Bed Sills. Water 2020, 12, 186. [Google Scholar] [CrossRef] [Green Version]
  11. Guan, D.W.; Melville, B.W.; Friedrich, H. Local scour at submerged weirs in sand-bed channels. J. Hydraul. Res. 2016, 54, 172–184. [Google Scholar] [CrossRef]
  12. Wang, L.; Melville, B.W.; Guan, D. Effects of upstream weir slope on local scour at submerged weirs. J. Hydraul. Eng. 2018, 144, 04018002. [Google Scholar] [CrossRef]
  13. Wang, L.; Melville, B.W.; Guan, D.; Whittaker, C.N. Local Scour at Downstream Sloped Submerged Weirs. J. Hydraul. Eng. 2018, 144, 04018044. [Google Scholar] [CrossRef]
  14. Ben Meftah, M.; Mossa, M. New approach to predicting local scour downstream of grade-control structure. J. Hydraul. Eng. 2020, 146, 04019058. [Google Scholar] [CrossRef]
  15. Lu, S.Y.; Lu, J.Y.; Shih, D.S. Temporal and Spatial Flow Variations over a Movable Scour Hole Downstream of a Grade-Control Structure with a PIV System. Water 2018, 10, 1002. [Google Scholar] [CrossRef] [Green Version]
  16. Shih, D.S.; Lai, T.Y.; Hsu, Z.M. Applying Biomineralization Technology to Study the Effects of Rainfall Induced Soil Erosion. Water 2019, 11, 2555. [Google Scholar] [CrossRef] [Green Version]
  17. Hirt, C.W.; Nichols, B.D. Volume of Fluid (VOF) Method for the Dynamics of Free Boundaries. J. Comput. Phys. 1981, 39, 201–225. [Google Scholar] [CrossRef]
  18. ANSYS. ANSYS Fluent User’s Guide; ANSYS Inc.: Canonsburg, PA, USA, 2015. [Google Scholar]
  19. Al-Sharif, S.F. Reynolds Stress Transport Modelling. Comput. Simul. Appl. 2011, 1. [Google Scholar] [CrossRef] [Green Version]
  20. Lu, J.Y.; Hong, J.H.; Chang, K.P.; Lu, T.F. Evolution of scouring process downstream of grade-control structures under steady and unsteady flows. Hydrol. Process. 2013, 27, 2699–2709. [Google Scholar] [CrossRef]
  21. Wang, L.; Melville, B.W.; Whittaker, C.N.; Guan, D. Scour estimation downstream of submerged weirs. J. Hydraul. Eng. 2019, 145, 06019016. [Google Scholar] [CrossRef]
  22. Dey, S.; Raikar, R.V. Characteristics of horseshoe vortex in developing scour holes at piers. J. Hydraul. Eng. 2007, 133, 399–413. [Google Scholar] [CrossRef]
  23. Ben Meftah, M.; Mossa, M. Scour holes downstream of bed sills in low-gradient channels. J. Hydraul. Res. 2006, 44, 497–509. [Google Scholar] [CrossRef]
  24. Guan, D.; Melville, B.M.; Friedrich, H. Flow patterns and turbulence structures in a scour hole downstream of a submerged weir. J. Hydraul. Eng. 2014, 140, 68–76. [Google Scholar] [CrossRef]
  25. Hsiao, K.T. PIV Measurement of the Flow Field Downstream of a Grade Control Structure—Preliminary Investigation of Bursting Phenomenon. Master’s Thesis, National Chung-Hsing University, Taichung, Taiwan, 2017. (In Chinese). [Google Scholar]
Figure 1. A schematic illustration of experimental flume (not to scale).
Water 12 01488 g001
Figure 2. Experiment of Particle Image Velocimetry (PIV) with a high-speed camera (extract figure from Shih et al. [16]).
Water 12 01488 g002
Figure 3. Development of the scour hole.
Water 12 01488 g003
Figure 4. A schematic illustration of measurement.
Water 12 01488 g004
Figure 5. Ensemble means of repetitive experiments of the scouring hole.
Water 12 01488 g005
Figure 6. Dimensionless equilibrium scour hole results.
Water 12 01488 g006
Figure 7. Comparison of fiber-optic laser doppler velocimeter (FLDV) and PIV velocity fields in: (a) longitudinal velocity; (b) vertical velocity.
Water 12 01488 g007
Figure 8. Velocity profiles at each position measured with different discharges for scour holes under: (a) equilibrium; (b) non-equilibrium condition.
Water 12 01488 g008
Figure 9. Longitudinal turbulence intensities at each position measured with different discharges for scour holes under: (a) equilibrium; (b) non-equilibrium condition.
Water 12 01488 g009
Figure 10. Vertical turbulence intensities at each position measured with different discharges for scour holes under: (a) equilibrium; (b) non-equilibrium condition.
Water 12 01488 g010
Figure 11. Reynolds stress at each position measured with different discharges for scour holes under: (a) equilibrium; (b) non-equilibrium condition.
Water 12 01488 g011
Figure 12. Comparison of measured and simulated mean velocity profiles at each position with different discharges for scour holes under: (a) equilibrium; and (b) non-equilibrium condition.
Water 12 01488 g012
Figure 13. Comparison of measured and simulated longitudinal turbulence intensities profiles at each position with Q = 0.0085 cm for scour holes under: (a) equilibrium; and (b) non-equilibrium condition.
Water 12 01488 g013
Figure 14. Comparison of measured and simulated vertical turbulence intensities profiles at each position with Q = 0.0085 cm for scour holes under: (a) equilibrium; and (b) non-equilibrium condition.
Water 12 01488 g014
Figure 15. Comparison of measured and simulated Reynolds stress values profiles at each position with Q = 0.0085 cm for scour holes under: (a) equilibrium; and (b) non-equilibrium condition.
Water 12 01488 g015
Table 1. Experimental setups.
CaseS
(%)
h
(cm)
Q
(m2/s)
U
(m/s)
U *
(m/s)
FrReB/h
S1H241/1002.400.00300.500.04441.0310,02910.42
S1H311/1003.100.00580.750.04941.3618,5598.06
S1H361/1003.600.00850.940.05241.5926,1746.94
Note: S = channel slope; h = water depth; Q = discharge; U = mean velocity; U * = friction velocity = g R S ; R = hydraulic radius = A P , where A is cross section area and P is wetted perimeter; Fr = Froude number = U g h ; Re = Reynolds number; B/h = aspect ratio (flume width: B = 0.25 m).