Article

Flood Inundation Mapping in an Ungauged Basin

by
Sofia Sarchani
1,
Konstantinos Seiradakis
1,
Paulin Coulibaly
2 and
Ioannis Tsanis
1,*
1
School of Environmental Engineering, Technical University of Crete, 73100 Chania, Greece
2
Jointly in School of Geography and Earth Sciences and Department of Civil Engineering, McMaster University, 1280 Main Street West, Hamilton, ON L8S4K1, Canada
*
Author to whom correspondence should be addressed.
Water 2020, 12(6), 1532; https://doi.org/10.3390/w12061532
Submission received: 7 April 2020 / Revised: 13 May 2020 / Accepted: 13 May 2020 / Published: 27 May 2020
(This article belongs to the Section Hydrology)

Abstract

:
An increase in severe precipitation events of higher intensity are expected to occur in the southeastern Mediterranean due to intensification of the hydrological cycle caused by climate change. Results of the climate change model’s precipitation data for the period 1970–2100 show a decreasing trend of daily precipitation but of higher intensity. Post-flood field investigation from a severe rainfall event in a small ungauged basin located in northwest Crete produced a validated flow hydrograph, and in combination with two high-resolution digital elevation models (DEMs), were used in the 1D/2D HEC-RAS (Hydrologic Engineering Center’s River Analysis System model), in order to determine the flooded area extent. Lateral structures were designed along the stream’s overbanks, hydraulically connecting the 1D streamflow with the 2D flow areas behind levees. Manning’s roughness coefficient and the weir coefficient were the most crucial parameters in the estimation of floodplain extent. The combined 1D/2D hydraulic model provides more detailed results than the 1D model with regards to the floodplain extent at the peak outflow, maximum flood depths, and wave velocities. Furthermore, modeling with a DEM at 2 m spatial resolution showed more precise water depth output and inundated floodplains. Scenarios of increasing peak precipitation for the same event precipitation depth were used to identify the flood extent due to an increase in daily rainfall recorded by adjacent meteorological stations. These simulation results can be useful in flood risk mapping and informing civil protective measures in flood basin management, for an effective adaptation to increased flood risk caused by a changing climate.

1. Introduction

According to EEA [1], from 1998 to 2009, floods and storms were the most expensive natural hazards in Europe, with the overall losses adding up to about EUR 52 billion for floods and about EUR 44 billion for storms. By 2009, the number of fatalities had reached 1126 in 213 recorded flood events, while the corresponding number of deaths, caused by 155 listed storms, was 729. Flood extremes with return periods over 100 years are expected, on average, to double in frequency in Europe until 2035, with an additional increment up to the end of the century, according to an ensemble of EURO-CORDEX climate projections with RCP8.5 scenario [2]. Analysis in both space and time of significant flood events in Europe during 1985–2009 have indicated an incremental drift of occurred flooding, overtopping the inundation severity and magnitude due to changing climate as well as changes in terrain surface [3].
Some recent studies have followed empirical methods, including field measurements, geographic information systems (GIS), remote sensing, and different statistical approaches in order to evaluate flood inundation depths. Input data, such as inundation maps and digital elevation models (DEMs), when combined with a GIS-based tool (Floodwater Depth Estimation Tool, FwDET), can generate flood water depth mapping [4]. Remote sensing and GIS, along with geology, fuzzy theories, and statistical analysis of hydrological peak discharge and rain height in a GIS environment, can result in accurate flood hazard mapping, estimating the risk of every land use/land cover [5]. In addition, the combination of GIS with multi-criteria decision-making, together with an optimum approach for counting the weights for each criterion, may provide accurate flood hazard, vulnerability, and flood risk maps by using only DEM, land uses, precipitation, geology, and geometry characteristics [6]. Moreover, satellite images through optical sensors may not be adequate in the case of bad weather phenomena or densely developed vegetation covering [7]. However, a newly developed technology, the synthetic aperture radar (SAR) can be very efficient in specifying temporal variations in flooded areal extent [8] and in producing probabilistic inundation maps as well [9].
Despite that, other scientists use different flood models such as FLO and ORSADEM [10,11], both numerical models [12], to compute flood levels and flooded areas. The research community uses hydrodynamic models to produce precise flood inundation mapping. The results obtained by other modeling tools such as the raster-based AutoRoute and the Height Above the Nearest Drainage (HAND), characterized as low complexity, as well as the hydrodynamic model 2D HEC-RAS, applied to two different case studies in the United States, showed that the raster tools may provide comparable flooded areas to the hydraulic model, with the AutoRoute results being in closer agreement with 2D HEC-RAS [13]. Many studies have focused on investigating multiple uncertainty factors linked with the precise determination of inundation mapping through hydraulic models. Lower values of Manning’s roughness coefficient into the river’s channel bed may reduce the travel time of the flood wave and decrease the total flood extent [14]. The roughness coefficient could be calibrated through the analysis of paleo-stage scars on trees’ stems caused by floating wood towards the flood wave direction of previous floods [15]. Habert et al. [16] proposed a procedure to reduce the uncertainties in the water depth-runoff approximation for eight flash flood events on a basin in France through detailed topographic measurements, as well as the local correction of friction coefficients in the channel bed and flow areas. This was done by incorporating measured water depths and applying an Extended Kalman filter algorithm, thus improving the boundary conditions of the 1D hydraulic MASCARET model used. On the other hand, Dimitriadis et al. [17] compared different types of hydraulic models (1D, quasi-2D) to examine the effect of variables such as the incoming discharge, the longitudinal and lateral gradients, Manning’s roughness coefficient, and the grid cell size to verify the flood inundation area using the Monte Carlo technique. The roughness coefficient was also evaluated at an ungauged basin by Papaioannou et al. [18] by using various probability distribution functions to a 1D hydraulic model via the Visual Basic Monte Carlo code. In another study, regional flood frequency analysis was carried out before applying hydraulic modeling to estimate flood quantiles for various probabilistic scenarios at an ungauged basin in Iran in order to reduce the uncertainty of the river discharge magnitude. This was due to flood data being available only at stations far from the ungauged rivers outflowing at Jiroft city; thus, the existing data differed [19]. The scientific interest regarding different sources of uncertainty concerning the hazard and the impact module of a probabilistic flood risk model in the area of Vorarlberg, Austria, was studied by Winter et al. [20]; the effect of variables from two model thresholds responsible for the derivation of different sets of potential inundation events, the distribution function for the flood frequency analysis, the building geometric representation and water level determination, as well as the damage function were compared with the results of a reference model. Another source of uncertainty examined by Domeneghetti et al. [21] was in boundary conditions, both upstream regarding the design hydrograph assessed with a bivariate frequency analysis, and downstream correlated with rating curves, as well as in dike failure mechanisms, in order to generate probabilistic flood mapping, including the confidence intervals in the dike-protected flood-prone area of a reach of River Po in Italy using a hybrid probabilistic-deterministic hydraulic model. Other researchers have used 1D and 2D hydraulic models [22,23], as well as both the aforementioned models and coupled hydraulic models [24] to simulate the flood wave characteristics of flash floods. This was achieved by using different DEM products, pointing out the importance of the terrain model.
The hydraulic/hydrodynamic simulation through the coupled 1D/2D model is a relatively recent capability for HEC-RAS hydraulic software; thus, only a few researchers have already exploited this tool to investigate the efficiency in producing reliable flood mapping. More specifically, Vozinaki et al. [25] noted that via a thorough display of hydraulic results at any grid point of the computed mesh of a river’s floodplains via the coupled 1D/2D modeling (using high-resolution DEM), additional knowledge can be gained regarding the inundation areas and accuracy of water depth values in flood-prone regions. Patel et al. [26] simulated the disastrous impacts due to the release of a huge amount of water discharge from the upstream dam to a developing city in India, through the combined 1D/2D hydrodynamic model, and examined the response of the model to similar discharges through bank protection works, such as levees and retaining walls. Pasquier et al. [27] evaluated the sensitivity of a coastal district to complex sources of flood hazards under a changing climate, through the 1D/2D hydraulic modeling technique. Lea et al. [28] used the combined 1D/2D model method for the simulation of a river levee break event in Korea, and the results compared well to those obtained from previously used 2D flood models.
The objective of this study is to examine parameter uncertainties in combined 1D/2D hydraulic modeling concerning a case study in Crete, regarding the values of the Manning’s roughness coefficient n at the floodplains, as well as the weir coefficient of the connecting lateral structures between the 1D stream’s reach with the flow areas. Detailed flood inundation mapping at the peak runoff was generated, together with water level depths at times before and after the peak rainfall, to examine the evolution of the flood wave propagation on the inundation areas over time. The 1D/2D model’s flood extent is compared to the 1D equivalent [29], giving information about the accuracy in flood risk mapping. A comparison is also carried out between the results produced by using two high accuracy digital elevation models (DEMs) at different spatial resolutions (5 and 2 m). Scenarios of increasing peak precipitation, for the same event precipitation depth, with a simultaneous redistribution of the remaining millimeters of rain over time, are investigated, due to neighboring rain gauges that have recorded more intense rainfall peaking heights to date.

2. Materials and Methods

2.1. Study Area

The study site is the Almyrida stream basin, in the Chania Prefecture, Crete, Greece. The hydrological catchment has a perimeter of 37.86 km, an area extent of 23.17 km2, and an average elevation of 197 m. The river network is dendritic and consists of a main thalweg, three secondary streams outflowing to the main stream, and twenty-six small branches, indicating a rather dense drainage system. The main thalweg has length 11.7 km and longitudinal slope 0.026 m/m, starting at an altitude of 306 m above sea level and flowing into the sea. The secondary streams are 5.83, 8.01, and 4.92 km long, respectively, with corresponding inclinations 4.49%, 4.03%, and 10.33%. The Almyrida basin is a small ephemeral ungauged Mediterranean catchment, with no recorded flow rate. For the years 2016 to 2018, the average annual precipitation in the basin was measured equal to 718 mm.
The geology of the basin consists of karst rocks, mainly found in the upper elevations of the catchment, and clay formations, located in the plain areas. The land cover of the catchment consists mostly of agricultural areas, in particular, olive groves by 40.56%, pastures by 4.52%, and complex cultivation areas by 10.94% [29].
The heavy precipitation event of 17 October 2006 was examined, with a total rainfall height of 196.2 mm in 46.5 hr. The maximum precipitation height was recorded at 10:15 and 10:30, equal to 17.5 mm at both recorded time quarters of the hour. An output hydrograph with a simulated peak discharge of 109 m3/s at 12:00 was created and validated in a previous study, via a measured flood mark of the highest water level in the post-flood control wall equal to 2 m with a measurement uncertainty of ±15% [29]. Figure 1 indicates the extent of the Almyrida stream basin, as well as the existing stream network and the hydraulically studied reach, as resulted from the high-resolution DEM at spatial resolution 5 m × 5 m, provided by the National Cadastre.

2.2. Hydraulic/Hydrodynamic Modeling

Geographic information systems are used as pre- and/or post-processors via modules that are fully [30] or partially [31] coupled with hydraulic models. The US Army Corps of Engineers’ Hydrologic Engineering Center developed the River Analysis System (HEC-RAS) model to conduct hydraulic/hydrodynamic modeling with GIS capabilities. In the present analysis, the combined one/two dimensional (1D/2D) HEC-RAS 5.0.3 model was used for the flood extent simulation and mapping at the downstream segment of the Almyrida stream basin. The 2D flow simulation algorithm of the HEC-RAS model is able to perform coupled 1D/2D modeling within the same unsteady flow in composite river systems, using 1D modeling in the main channel, and 2D modeling in areas requiring a higher level of hydrodynamic reliability. An additional feature is the coupled 1D/2D solution algorithm. Both 1D and 2D solution algorithms are closely linked per time step, with iterations between 1D and 2D flow transfers into a time step, allowing immediate feedback at each time step between 1D and 2D flow elements [32].
HEC-RAS has two sets of equations that can be used to solve the flow moving over the computational mesh: the Saint Venant equations, often referred to as the shallow water equations (full momentum), and the diffusion wave equations, which are used in this study. For unsteady flow, which is uncompressed, with uniform density and hydrostatic pressure, the 2D diffusive wave approximation of the shallow water mass conservation (continuity) equation, having differential form [33], is given as
H t + ( h u ) x + ( h v ) y + q = 0
where t is time; H (m) is the water surface elevation; h (m) is the water depth; u and v (m/s) are the velocity components in the x- and y-directions, respectively; q (m3/s) is the inflow.
The 2D diffusion wave momentum equations used in this paper are based on the 2D full momentum equations (Saint Venant), in which gravity and bottom friction are the dominant terms, while the viscosity, Coriolis effect, advective acceleration, and local acceleration terms are ignored [33]. Therefore, the 2D diffusion wave momentum equations are given as
g H x = c f u
g H y = c f v
where g (m/s2) is the gravitational acceleration; H (m) is the water surface elevation; cf (s−1) is the bottom friction coefficient; u and v (m/s) are the velocities in the x- and y-directions, respectively.
Longer time steps can be used in the 2D diffusion wave equations than in Saint Venant equations, yielding numerically stable and accurate solutions. The recommendations for selecting a computational interval for the 2D Diffusion Wave equations [32] are
C = V Δ T Δ X 2.0   ( with   a   max   C = 5.0 )   or   Δ T 2 Δ X V   ( with   C = 1.0 )
where C (dimensionless) is the Courant number; V (m/s) is the flood wave velocity; ΔT (s) is the computational time step; ΔX (m) is the average cell size.

2.3. Geometry Data in ArcGIS—Connection and Analysis via the Coupled Hydraulic 1D/2D HEC-RAS Model
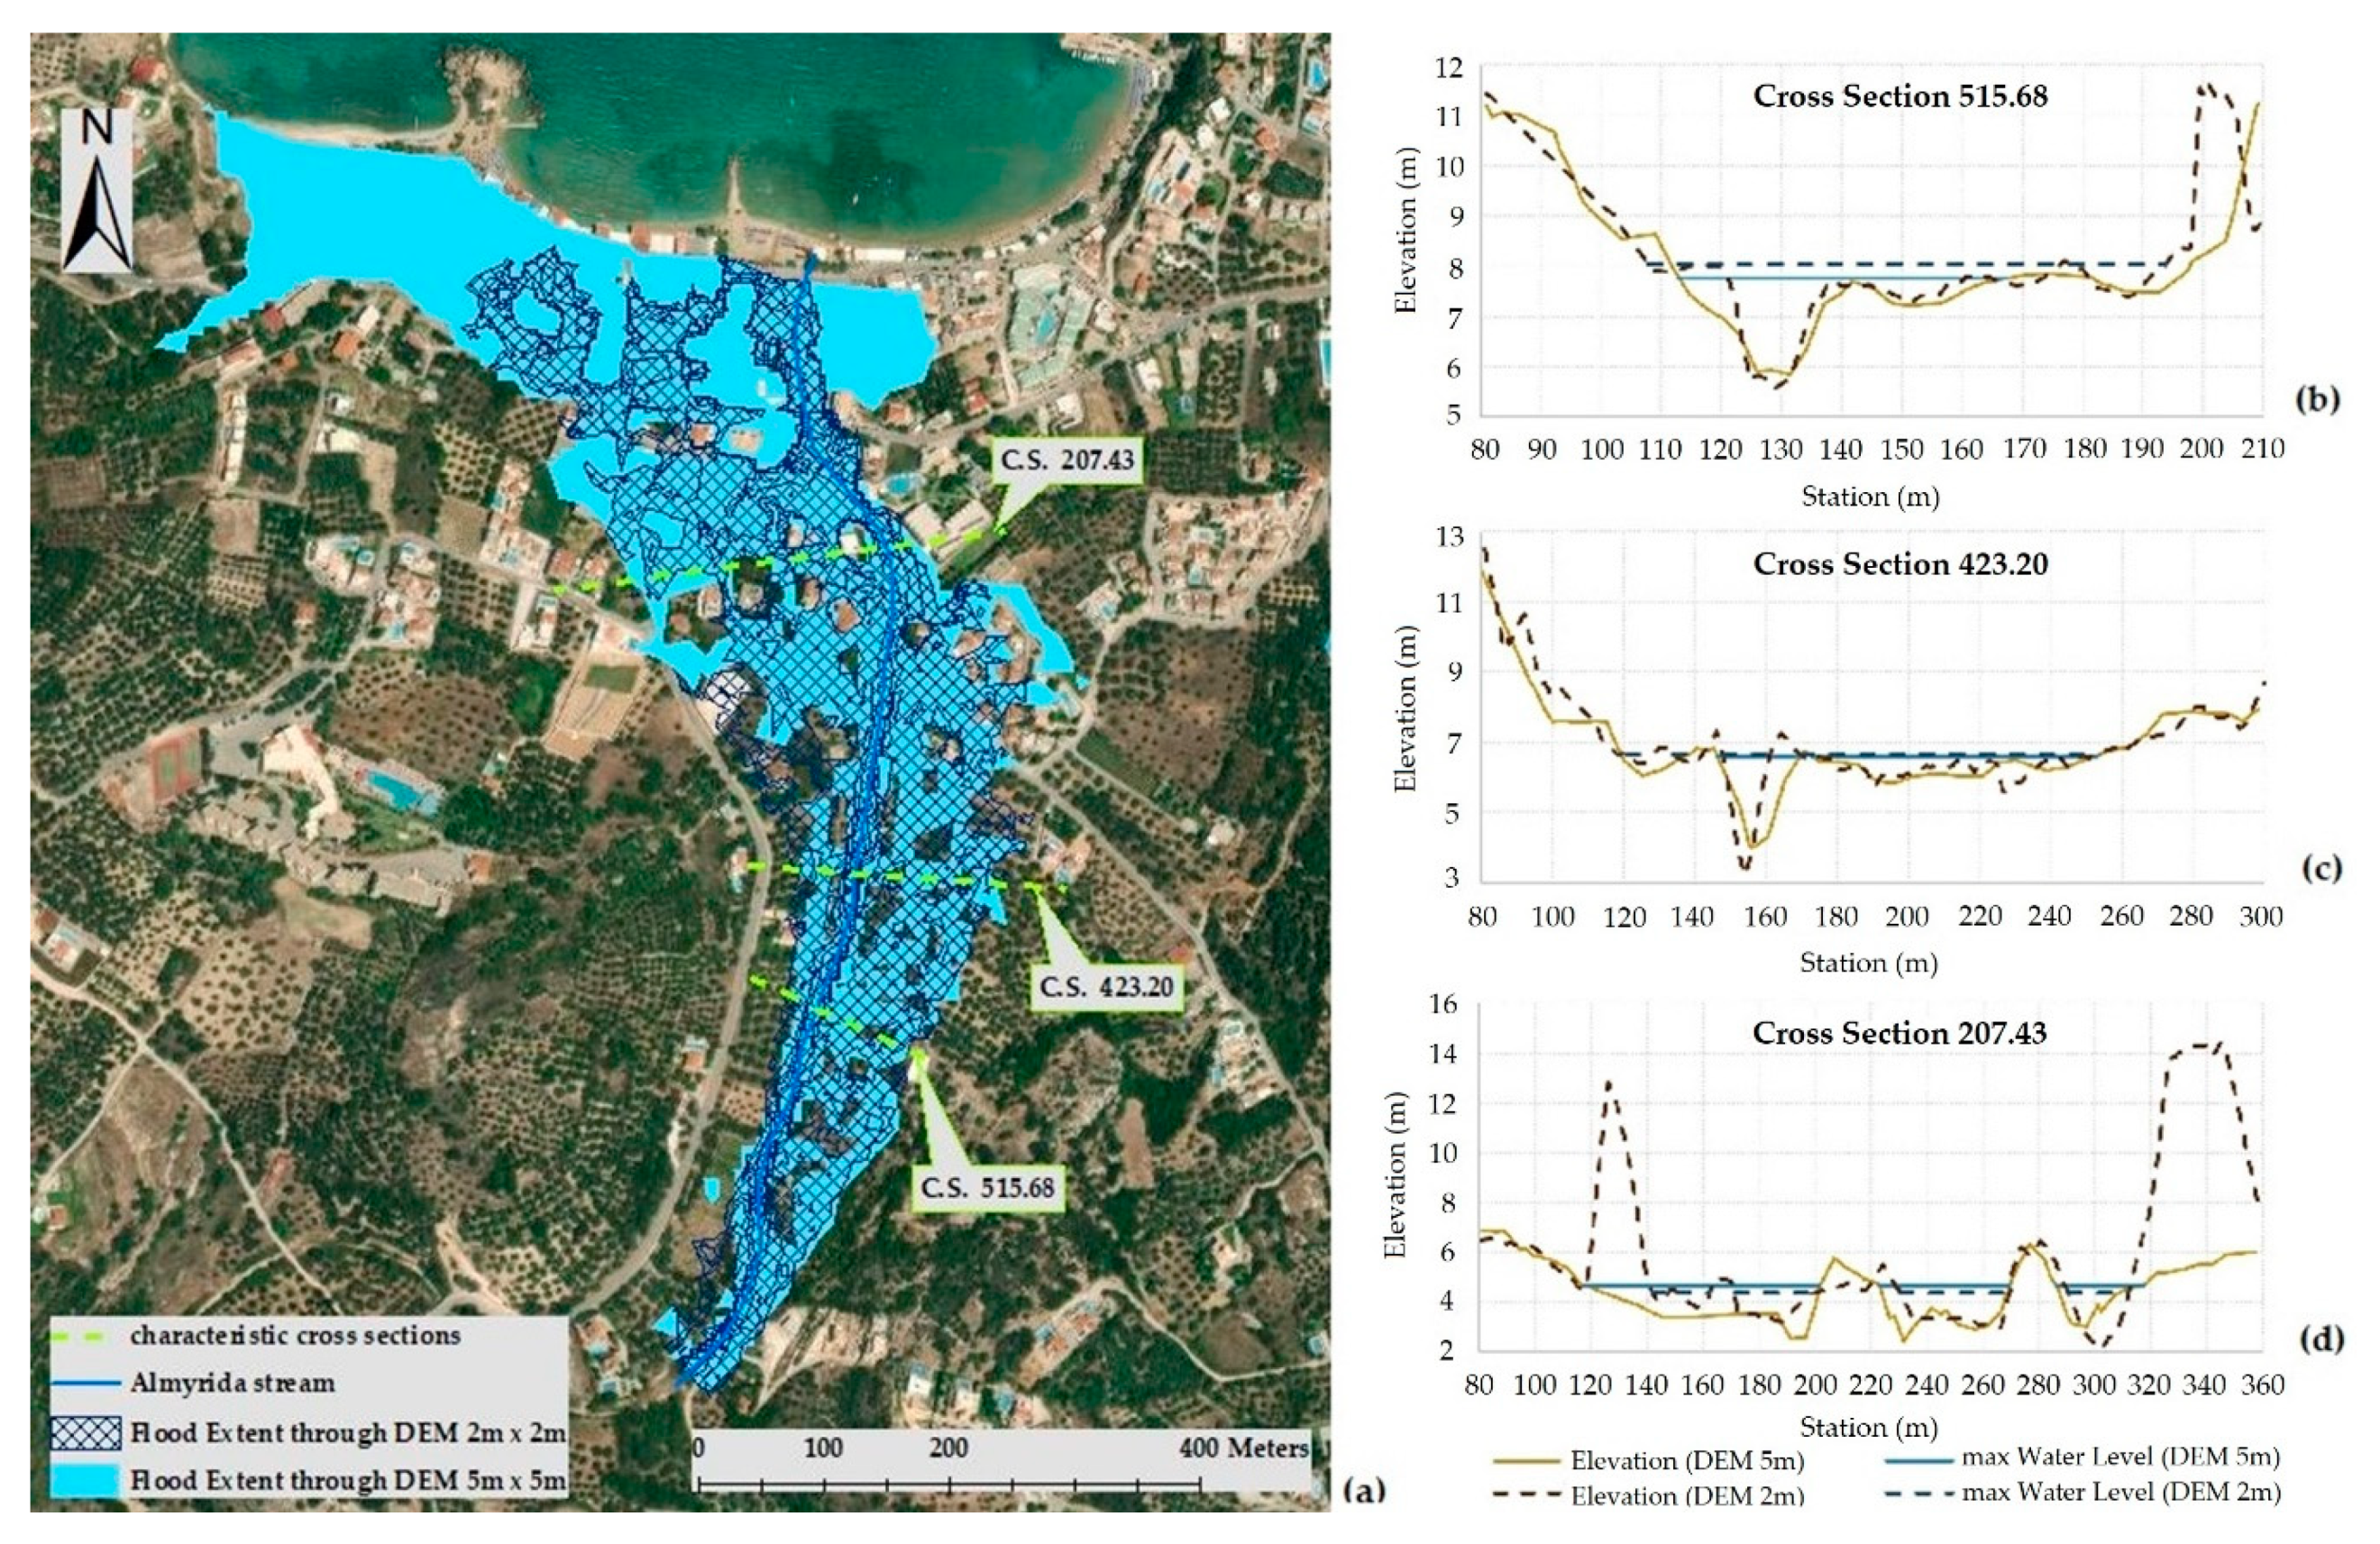
The geometry data of the downstream segment of the Almyrida stream were acquired from two high-accuracy DEMs at spatial resolutions 5 m and 2 m as well, through HEC-GeoRAS, an extension of HEC-RAS hydraulic model to ArcGIS software. The digitized characteristics were the channel centerline with a length of 784 m, the bank lines, the flow-path lines above the banks, and 33 cross-section cut lines, primarily perpendicular to the stream’s flow. Each cross-section covers the elevations of the stream bed to the banks, with a width of about 30 to 126 m. Those geometric characteristics were exported in the HEC-RAS model [34].
The setup regarding the contraction and expansion coefficients of the cross-sections, the design of the cross-section of an existing bridge, and the Manning coefficient nc for the channel as well, were prepared according to the options proposed in a previous paper [29].
Apart from the cross-sections, the floodplain attributes were also provided by the topography of both high-resolution DEMs. Thus, via the combined 1D/2D HEC-RAS hydraulic model, the 2D flow areas were designed as polygons to the left and right of the stream’s banks and along the stream’s length, defining the boundaries within which the software will calculate the flood wave’s propagation. Break lines are recommended to be added to positions within the 2D flow areas that act as barriers to stream’s flow, or affect the flow’s direction. Roads are such barriers; thus, taking into account the topography, four roads exist within the designed 2D flow areas along the perimeter, of which four break lines were digitized. These break lines will prevent redirecting the stream’s flow through enforcement of their perimeter with finite elements during 2D computational mesh [35].
For both 2D flow areas, Manning’s roughness coefficient nf was calibrated in the range of 0.035 to 0.08 [36]. The calculation points of the 2D computational mesh were generated at regular intervals, including all break lines. The latter were enforced at their perimeter so that the flow did not pass through these cells until the water level is higher than the terrain along that specific break line. The distance between the calculating points was set as a grid, DX × DY, equal to 4 m × 4 m. Thus, 13,868 finite elements were created for the left 2D flow area, and 12,275 for the right one regarding the DEM 5 m, whereas concerning the DEM 2 m, the left 2D flow area was composed of 14,142 grid cells, and the right one of 12,693 cells [35]. Figure 2 indicates the geometry of the 1D stream flow, consisting of the river channel reach, the banks, and the cross-sections, as well as the 2D flow areas, the break lines, and the grid cells, as designed outside the stream’s banks.
The boundary between the 1D stream flow and each 2D flow area is the high ground separating the stream from the floodplain. For the connection of the 1D streamflow with the 2D flow areas behind levees, four lateral structures were designed, each one defined by the upstream end of the Almyrida stream, introducing the elevations of the other stations that represent the central line of the top of the structure. The lateral structures designed were named 772.4 and 772.3 from the upstream till the cross-section before the bridge, as well as 95.8 and 95.7 from the cross-section after the bridge till downstream, positioned at the left and right overbanks, respectively, while being connected to the left and right 2D flow area correspondingly. Lateral structures represent high ground above the banks of the stream, as well as model the flow over levees [32]. For the four embankments, the water surface was chosen as the weir flow reference, while the weir crest shape was broad-crested. Weir computations were performed with the standard weir equation. Weir width at its crest was chosen to be 10 m, purely for graphical purposes.
The weir coefficient is a function of the gravitational constant and therefore is not dimensionless. Due to the fact that lateral structures are being used in order to transfer flow from the 1D region of the stream to the 2D flow areas, the appropriate selection of the weir coefficients is to be considerably low, otherwise unusual considerable flow will be transferred. In the case study, the lateral structures are an overland flow interface between the 1D and 2D elements. When there is a non-elevated overbank terrain, thus the lateral structure is not elevated above ground, then the overland flow escapes from the main stream, and in this case, the weir coefficient ranges between 0.11 and 0.28. In addition, when there is a natural high ground acting as a barrier, having a height of 0.33 to 1 m, then the terrain does not exactly act as a weir, but the water must flow over the high ground so as to get into the 2D flow area, and in that case, the weir coefficient extends from 0.28 to 0.55 [32]. For the four lateral structures, the weir coefficient was calibrated for flow over the weir in the range of 0.11~0.55, in SI units. This selection indicates that each lateral structure does not rise above ground or is a natural high ground barrier up to about 1 m [32]. For all the lateral structures, the head water distance of the upstream end of the weir, from the cross-section just before the structure, was set equal to zero [35].
The studied flow is characterized as unsteady, for which the validated flow hydrograph of maximum discharge 109 m3/s due to the flash flood event of 17 October 2006 was the boundary condition at the upstream end of the studied reach, whereas at its downstream end, the normal depth was the boundary condition, using Manning’s equation to estimate the water level at every cross-section, with the friction slope being equal to 0.03. The initial unsteady flow condition was set equal to 1 m3/s at the upstream end [35].
Concerning the unsteady flow analysis, the settings regarding the flow regime, the Froude number, time slicing, and iteration time step, the bridge’s friction slope, as well as the calculation options and tolerances for the 1D modeling, were prepared in accordance to the options proposed in a previous study [29]. The calculation options and tolerances for the 2D flow simulation were entered. The theta implicit weighting was defined equal to 1 for a more stable solution, possibly with less accuracy. The 2D water surface tolerance was determined equal to 0.003 m. The maximum number of iterations to resolve the unsteady flow equations was set equal to 20 so that the solution gives a numerical error smaller than the defined water tolerance at all the positions of the 2D computational mesh. The 2D diffusion wave equations were those used as they perform faster and are characterized by greater stability. The calculation options and tolerances for the 1D/2D flow simulation were set as well. The water surface tolerance was defined as equal to 0.003 m. Minimum flow tolerance was set equal to 0.3 m3/s so that the program does not proceed with iterations when the flow passing through a 1D element to a 2D element is too small and insignificant for the solution [35]. The hydraulic calculations were performed from 17 October 2006 at 08:00 until 18:00, having a computation interval of 10 s either 2 s. The geometry pre-processor, the unsteady flow simulator, and the output post-processor were executed. The hydrograph output interval and the detailed output interval were set at 10 min [35]. All of the steps followed are summarized in a process diagram (Figure 3).

3. Results

3.1. Uncertainty Analysis with Respect to Manning’s Roughness Coefficient

Manning’s roughness coefficient nc was taken equal to its maximum value for the stream’s channel, which is 0.04 for a clean, straight, and full stage bed, having no rifts or deep pools, but with more stones and weeds. Regarding the floodplains, Manning’s coefficient nf was calibrated. The examined values were (i) 0.08 for cleared land with tree stumps and heavy growth of sprouts, (ii) 0.06 for little brush and trees during winter, and (iii) 0.035 for pasture with short grass [36]. Higher values of Manning’s coefficient reduce flow velocities but increase flood depths, whereas smaller values of the friction parameter produce higher velocities with reduced water levels. The best performance of the coupled hydraulic 1D/2D model was achieved through Manning’s roughness coefficient equal to 0.08, concerning the flow areas.

3.2. Uncertainty Analysis Regarding the Weir Coefficient

Weir coefficient, applied to the lateral structures along the stream’s overbanks, was also a calibration parameter. Regarding the design by using the topography of the DEM at 5 m regional analysis, the considered values in order to better evaluate the measured depth on the control wall were 0.01, 0.06, 0.11, 0.28, 0.35, and 0.40. The value of 0.55 was also examined but caused great instabilities in the velocities of the floodplains; thus, it was rejected. The smaller the weir coefficient was, the bigger the maximum flood depths resulted. According to [32], the lower limit of the weir coefficient is 0.11. Thus, the value equal to 0.01 cannot be applied. The value of 0.06 was tested since the previous edition of HEC-RAS [37] proposed this value for the lower limit of the weir coefficient. However, due to the update of the edition, we concluded that the coupled 1D/2D model best performs through the weir coefficient at the connection structures of the 1D streamflow with the 2D flow areas equal to 0.11, producing a modeled depth on the control wall equal to 1.95 m. The results are shown in Figure 4 below.
Concerning the topography of the DEM at 2 m spatial resolution, the considered values of the weir coefficient for the optimum assessment of the measured depth on the control wall were 0.01, 0.06, 0.11, 0.15, 0.17, 0.19, 0.23 and 0.28. The results, with a computational interval of the hydraulic computations equal to 2 s, are shown in Figure 5. Especially for weir coefficients equal to 0.01, 0.06, and 0.11, the analysis took place for various time steps of hydraulic computations, such as 10, 5, 2, and 1 s, both for 0.08 and 0.06 values of Manning coefficient on the floodplains. Regarding those runs, the resulted depths on the control wall were the same regardless of the variation of the computation time interval. The best performance of the 1D/2D model, validated by the post-flood field measurement, is achieved through a weir coefficient of 0.11, resulting in a modeled depth on the control wall equal to 1.93 m.

3.3. Hydraulic Modeling Output

In Figure 6 and Figure 7, the simulated results of the downstream analysis of the Almyrida stream are shown via RAS Mapper, by using the combined 1D/2D HEC-RAS hydraulic model at high-resolution DEM 5 m × 5 m. Figure 6 presents the propagation trend of the flood wave depths over the floodplains after 2, 3.5, 4, 5, 6, and 8 h from the beginning of the simulation, while Figure 7 indicates the variance of the modeled flood wave velocities at the same time intervals. From RAS Mapper’s Animator, it was found that the maximum flooded area of 108,767 m2 took place between 12:00 and 13:00 of 17 October 2006. The flood wave’s depth reached up to 3.94 m. On the water depth’s control wall, it appears that the combined hydraulic 1D/2D modeling verified the 2 m post-flood field measurement, with a simulated flood depth of 1.95 m. Maximum flood wave velocities reached up to 5.09 m/s within the 1D flow channel, about halfway of the entire downstream length of the studied reach, whereas on the 2D flow areas, these were generally very low, of the order of 0.1 to 0.5 m/s. In comparison with the 1D model flood extent output, produced by a recent study [29], the flood inundation area produced by the 1D/2D model was 14.55% higher, with the main flood volume raise being noted in the northwestern part of the outlet.
In Figure 8 and Figure 9, the resulting spread of the water level over the flooded areas at times after the beginning of modeling, as well as the diffusion of the flood wave velocities at the respective times, are displayed correspondingly, regarding the downstream analysis of the Almyrida stream, by using the combined 1D/2D HEC-RAS hydraulic model at high-resolution DEM 2 m × 2 m. The maximum flooded area extent occurred between 12:00 and 13:00 of 17 October, just like the simulation using the DEM at spatial resolution 5 m, but was relatively lower by 33.25%. The main flooded area reduction was noted in the northwestern part of the outlet, whereas a small increase was mentioned in the southeast. On the other hand, the maximum flood wave’s depth reached 4.80 m, interpreted as a 21.83% increase over the maximum water depth, which resulted by using the DEM at regional analysis 5 m. The combined 1D/2D modeling also verified the 2 m post-flood field water level measurement on the control wall, with the simulated flood depth varying from 1.79 to 2.07 m, reaching an average value of 1.93 m.
The highest value of the flood wave velocities reached 6.38 m/s into the 1D channel, while at the floodplains, any modeled velocities were quite low. A high value equal to 5.44 m/s was observed at the channel bed in the last designed cross-section, the one of the stream’s outlet, due to the uplift of the stream bed elevation compared to the previous cross-section.
In Figure 10, the maximum flood depth as well as the flood inundation extent after 0, 2, 3.5, 4, 5, 6, 8, and 10 h from the beginning of the simulation are presented, for both high-resolution DEMs (5 and 2 m) and a total modeling duration equal to 10 h. The modeled flooded area was calculated through ArcGIS tools. The maximum flood depth was greater when using the DEM at regional analysis 2 m in relation, with the DEM 5 m × 5 m, at all times from the simulation start. Specifically, the maximum flood level was higher at a range from 18.01% to 31.52%, reaching an average raise of 24.91%. On the other hand, the flooded area was notably greater when modeling via the terrain attributed by the DEM at spatial resolution 5 m, compared with the DEM 2 m × 2 m, throughout the modeling duration. The variations ranged from 32.95% to 64.89%, reaching an average increase equal to 46.35%.
Extents of the floodplains in the study area through both DEMs are shown in Figure 11a. Also, characteristic cross-sections of the main channel bed, extracted by the two DEMs, are displayed in Figure 11b–d, for comparison. The maximum water level is shown in blue. The x-axis of a cross-section shows the stations in which the terrain elevation values were exported by HEC-GeoRAS, whereas the y-axis depicts the ground elevation values. It is noticeable that the cross-sections from DEM 2 m × 2 m are more detailed because more station positions represent the terrain. In most cross-sections of finer resolution, the channel bed is lying further below than it is on the DEM 5 m × 5 m. The water surface elevation is approximately the same at the above-mentioned cross-sections on both DEMs, or slightly higher at most of the remaining cross-sections extracted by DEM 2 m × 2 m, which along with the deepest bed of the channel, explains why the maximum flood depth and the flood depths at the channel generally are higher when using a DEM of 2 m. Mainly, the cross-sections based on the DEM at spatial analysis 5 m are more flattened; in particular, those very close to the outlet are smoothed, mostly outside the left bank, explaining why the flood has extended significantly to the left floodplain. On the other hand, the cross-sections a few meters before the outlet, derived from a DEM of 2 m, depict higher elevations due to located tall urban buildings, preventing the expansion of the water. Therefore, in the extension of several cross-sections of finer resolution DEM, the flood inundation area is smaller than the respective ones from DEM 5 m × 5 m.

3.4. Historical Precipitation and Future Projections through Climate Model Data

Analysis of climate model’s EC-EARTH_RCP8.5 historical daily and 3-h precipitation data from the Swedish Meteorological and Hydrological Institute Rossby Centre Regional Atmospheric Model (SMHI-RCA4), applied to Kalyves, a station distancing about 16 km from the area of interest, through a grid of 12.5 km × 12.5 km resolution for the period 1970–2098 [38], shows that a lot of heavy precipitation events have already stricken the wider rural area of Almyrida. The most notable rain events are listed in Table 1, concerning their daily rain height, the maximum 3-hourly rain height, as well as the ratio of 3-h data to divided daily with 8 three-hour windows per day. The comparison between daily and 3-hourly historical data is held in order to project the data in the future. Due to the fact that we examine flash floods produced by extreme precipitation heights, the simulated precipitation time-step should be less than an hour in order to have accurate flow hydrographs, not depending on the time interval [29]. In this case, the available minimum time-step of these specific climatic data was equal to 3 h. It is obvious that the 3-hourly data produce rain peaks, which are intensified by a factor of 1.5 to 2.5 over the corresponding rain height of daily data uniformly applied per three hours.
Other climatic data on daily time-step for the period 1981–2098 produced from the Climate Service Center REMO (CSC-REMO) regional climate model (RCM) simulations, being influenced by the Max Planck Institute Earth System Model, low resolution, reanalysis 1 (MPI-ESM-LR-r1) driving global climate model (GCM) regarding the representative concentration pathways RCP4.5 and RCP8.5 [38] showed that Kalyves and Vamos stations which are very close to Almyrida stream basin, may produce in the future significant rain events. In Table 2 we have categorized the number of days that the precipitation depth is expected to be greater than 150, 200, 250, and 300 mm as well, in addition to the number of days at which is likely not to rain at all. More specifically, according to RCP4.5, up to 345 mm are expected to be precipitated at Kalyves, whereas Vamos may reach 329 mm of precipitation height in one day. On the other hand, with respect to the RCP8.5, more dry days are expected in the future, but intense rain events are also likely to happen. Notably are the expected 277 mm of precipitated water at Kalyves, as well as the 301 mm at Vamos.
It is obvious that heavier precipitation events than the studied one equal to 196.2 mm are about to happen, that is the reason that we proceeded below to examining scenarios of increasing the peak precipitation for the same event precipitation depth in order to investigate the effect of rainfall intensity to the maximum flood depth and the total inundation area extent. Before that, we studied three different hypothetical distributions of the projected 345 mm due to the RCP4.5 scenario in a 15-min time-step, just like the event of 2006, as shown in Table 3. Through the coupled 1D/2D HEC-RAS hydraulic model, it is obvious that when using the high-resolution DEM 2 m × 2 m, the maximum flood wave’s depth increases significantly with an intensified precipitation intensity when compared to a smoothed one, by 56.23%. In contrast, with the use of DEM at regional analysis 5 m, the highest flood depth has a small increase by 11.69% in case of increasing the precipitation intensity in relation to the smoothed rain rate.

3.5. Scenarios of Increasing the Peak Precipitation for the Same Event Precipitation Depth

For the observed event precipitation depth of 196.2 mm, being held from 16 October 2006 at 23:30 to 18 October 2006 at 22:00, varying scenarios of raising the peak precipitation and redistributing the remaining rainfall differently over time were studied. In particular, the observed peak rainfall of 17.50 mm, which occurred at 10:15 and 10:30 on 17 October, resulting in an average peak discharge of 109 m3/s at noon, was increased by a factor of 1.5, 2.0, and 3.0, reaching the values of 26.25, 35, and 52.5 mm correspondingly, at the same time of the morning of 17 October 2006. The output peak discharges reached 115.9, 130.6, and 148.2 m3/s respectively, at 12:15, being accordingly 6.33%, 19.82%, and 35.96% increased when compared to the baseline maximum discharge. The resulting flow hydrographs are shown in Figure 12.
By using the high-resolution DEMs (5 m and 2 m), as well as the output hydrographs due to the increase of the peak precipitation for the same event precipitation depth, the maximum inundation depth and the flooded area extent of the downstream segment of the small basin were identified via the coupled 1D/2D HEC-RAS hydraulic modeling, and the results are shown in Table 4. Regarding the output based on the DEM at spatial resolution 5 m, the baseline peak discharge of 109 m3/s resulted in a maximum flood depth of 3.94 m, with the total flooded areas being equal to 108,767 m2. When the maximum discharge was increased, due to increased peak rainfall, then both the outcoming maximum flood depth and flooded area extent rose. More specifically, when the peak rainfall was increased by a factor of 1.5, the maximum flood depth and the flooded area were risen by 2.28% and 1.76%, respectively, in comparison with the base results. In case of increase of the peak precipitation by a factor of 2.0, the maximum flood level as well as the flood extent rose by 7.87% and 7.49% correspondingly, whereas an increment of the peak rainfall by a factor of 3.0 brought an increase to the maximum flood depth and the total flooded area by 16.24% and 14.15% respectively, compared with the resulting ones for the baseline scenario.
On the other hand, with respect to the output based on the DEM at regional analysis 2 m, the modeled peak discharge of 109 m3/s due to observed precipitation resulted in a peak flood depth of 4.80 m, whereas the flood inundation area was equal to 72,606 m2. When the peak precipitation was increased by a factor of 1.5, the highest flood level and the inundation area extent rose by 1.88% and 3.49%, respectively, when compared with the baseline scenario’s results. An increase of the peak precipitation by a factor of 2.0 resulted in an increment of the maximum flood depth and the total flooded area by 5.63% and 10.19%, respectively, while in the case that peak rainfall was increased by a factor of 3.0, the peak flood level and the flooded area extent rose by 9.79% and 18.05% correspondingly, in comparison with the base results.

4. Discussion

Various hydro-meteorological gauges near the study basin have already recorded more intense precipitation data, up to 400 mm. Due to the intensification of the hydrological cycle caused by a changing climate, either more severe precipitation events or events of higher hourly intensity are expected to occur in the area of interest. The aim of this research is based on the hydraulic response of the outlet section of a small ungauged basin to an extreme flood event. Utilizing the EURO-CORDEX climate model’s historical data and future projections downscaled to Kalyves and Vamos, two stations adjacent to the studied basin, it was indicated that rainfall events of greater intensity than those commonly observed are expected to occur. These occurrences are expected to present greater intensity by factors of 1.5 to 2.5, or by order of 250–300 mm daily. We examined scenarios of potential intensified precipitation peaks for the same or higher total precipitation depth in order to investigate the eventual flood impacts on the area of interest. The consideration of examining increased peaks of the studied precipitation was also based on the EC-EARTH_RCP8.5_r12i1p1_SMHI_RCA4 climatic data which produced projected daily data more intensified than the observed used time-series regarding the area of interest, as well as the MPI-ESM-LR_r1i1p1_CSC_REMO daily climatic data [38] regarding RCP4.5 and RCP8.5 scenarios which projected heavier rainfall events to adjacent gauge stations in the future. Through the output hydrographs of these scenarios, with remarkably higher peak runoff, the combined 1D/2D hydraulic modeling resulted in a significant rise of the maximum flood depth and the flooded inundation area as well, with the use of the extracted topography by both high-resolution DEMs. With the use of DEM of 2 m, the increase of maximum flood level is higher than using DEM of 5 m in case of increased peak rainfall for a potential higher total rain depth than the studied one.
On poorly gauged basins such as the one studied, the flow data and the aerial view of the flood inundation does not exist. Post-flood field measurement of the flood level on a control wall is the only existing data, which is used for validating the hydraulic model. The accurate representation of flood mapping depends largely on uncertainty parameters imposed on hydraulic simulation. Coupled 1D/2D hydraulic models are efficient and reliable regarding the output inundation maps. Vozinaki et al. [25] have mentioned this effectiveness when compared to 1D output for another basin in Crete. DEMs at high resolution are also critical for the precise output flood stages and flooded areas so that the potential effect of future extreme flood events to socio-economic interests are limited. Through the analysis of the results presented in Table 4, regarding the scenarios of increasing peak precipitation for the same event precipitation depth, it was found that the fastest increase in maximum flood depth is attributed using the DEM at a spatial resolution of 5 m, whereas the fastest increase in the total inundation area is attributed by using the DEM of 2 m.

5. Conclusions

A number of parameters may significantly impact flood wave propagation, simulated water depths, and inundation extent. It was found that the most significant parameter affecting the depth on the control concrete wall is the weir coefficient of the lateral structures, followed by Manning’s roughness coefficient at the floodplains. In the present study and for both examined high-resolution DEMs, the calibration procedure produced the best performance of the hydraulic model for a weir coefficient equal to 0.11, which is the lower limit proposed in HEC-RAS. On the other hand, Manning’s roughness coefficient produces better results with a value of 0.08.
The studied basin is ungauged, and the only available data was the testimony of residents on the time and depth of the passage of the maximum flood wave. The water depth post-field measurement on the control wall, about 200 m before the outlet of the stream, was around 2 m ± 15%, due to silt and gravels deposited in the control wall during the heavy rainfall. The time of the passage of the maximum flood wave was between 12:00 and 13:00 of 17 October 2006. The novelty of this paper is based on a validated flooded area with very limited available data. The uncertainty analysis of the values of the weir and Manning coefficients, and in addition to limited field data, provided very good results regarding the flood extent.
The output produced by the 1D HEC-RAS hydraulic model [29] is limited in its two-dimensional lateral extent in contrast with the results of the combined 1D/2D HEC-RAS model. The latter produced more detailed and more accurate 2D mapping regarding the flood extent at the peak discharge, as well as the maximum flood depths and flow velocities at every computational grid-cell point of the modeled mesh. In addition, DEM at 2 m spatial resolution also displayed more efficient and precise results than the corresponding DEM at a 5 m spatial resolution. In general, through the DEM 2 m × 2 m, the maximum flood depth was noticeably higher at most cross-sections into the channel, whereas the total flooded areal extent was lower than the respective magnitudes estimated via the DEM 5 m × 5 m. This is explained by the fact that the terrain of finer resolution depicted a deeper channel bed, with the banks being higher. Moreover, the more detailed terrain at 2 m spatial analysis consisted of more levees into the 2D computational mesh, acting as flow barriers, restricting the flood wave to expand further. A similar trend for maximum flood depths and the flooded area was followed by the examined scenarios of intensified peak rainfall for the same total event precipitation depth concerning the different DEM’s. Considering the base precipitation, as well as the scenarios of increased peak rainfall by factors as high as 3.0, it appears that the DEM of 2 m shows that the highest flood depths were greater at a range from approximately 15% to 22%. In contrast, the flood inundation extent was significantly increased via the DEM of 5 m, by approximately 45% to 50%. The projected precipitation of 345 mm due to the medium emissions scenario of the MPI-ESM-LR_r1i1p1_CSC-REMO climate model shows that for a possible hourly precipitation intensity of 40 mm/hr, the maximum flood depth is increased by 30.2% and 17.08%, for DEM 5 m and DEM 2 m, respectively, when compared with the daily precipitation of 196.2 mm in the 2006 event where the precipitation intensity was 45 mm/hr. It is critical to use higher resolution DEM in order to obtain more accurate results, especially when concerning flood extent in flood hazard mapping. In addition, scenarios of raising the rainfall intensity result in more extensive effects in the downstream segment of the studied stream. The definition of the accurate flooded area extent is of significant priority in order to enable civil protection to initiate an appropriate early flood alert. The 1D/2D simulation results of this work will improve the flood basin management under extreme events. Detailed knowledge of gridded rainfall distribution would improve the accuracy of the outlet hydrograph and additional field data from stage-flowrate gauging, video recording and satellite imaging would enhance the accuracy of the flood extent. Flood inundation mapping indicates the need for improvement of flood defense plans in both rural and urban environment.

Author Contributions

Conceptualization, S.S., K.S., P.C., and I.T.; methodology, S.S.; software, S.S.; validation, S.S.; formal analysis, S.S.; investigation, S.S.; data curation, S.S. and K.S.; writing—original draft preparation, S.S.; writing—review and editing, S.S., P.C., and I.T.; visualization, S.S.; supervision, P.C. and I.T.; funding acquisition, I.T. All authors have read and agreed to the published version of the manuscript.

Funding

This research was partly funded by the Horizon 2020 Framework programme through the project IMPREX, grant agreement No. 641811. The APC was funded by the Technical University of Crete.

Acknowledgments

The authors would like to thank Alexakis D. Dimitrios, Assistant Researcher on the Lab of Geophysical-Satellite Remote Sensing and Archaeo-environment of the Institute for Mediterranean Studies, Foundation for Research and Technology, Hellas, for providing technical support for GIS application. The research reported of this paper was supported by the project IMPREX.

Conflicts of Interest

The authors declare no conflict of interest.

References

  1. EEA. Mapping the Impacts of Natural Hazards and Technological Accidents in Europe: An Overview of the Last Decade; Technical Report No 13/2010; EEA: Copenhagen, Denmark, 2010; ISSN 1725-2237. [Google Scholar] [CrossRef]
  2. Alfieri, L.; Burek, P.; Feyen, L.; Forzieri, G. Global warming increases the frequency of river floods in Europe. Hydrol. Earth Syst. Sci. 2015, 19, 2247–2260. [Google Scholar] [CrossRef] [Green Version]
  3. Kundzewicz, Z.W.; Pińskwar, I.; Brakenridge, G.R. Large floods in Europe, 1985–2009. Hydrol. Sci. J. 2013, 58, 1–7. [Google Scholar] [CrossRef]
  4. Cohen, S.; Brakenridge, G.R.; Kettner, A.; Bates, B.; Nelson, J.; McDonald, R.; Huang, Y.-F.; Munasinghe, D.; Zhang, J. Estimating Floodwater Depths from Flood Inundation Maps and Topography. JAWRA J. Am. Water Resour. Assoc. 2017, 54, 847–858. [Google Scholar] [CrossRef]
  5. Mousavi, S.M.; Roostaei, S.; Rostamzadeh, H. Estimation of flood land use/land cover mapping by regional modelling of flood hazard at sub-basin level case study: Marand basin. Geomat. Nat. Hazards Risk 2019, 10, 1155–1175. [Google Scholar] [CrossRef] [Green Version]
  6. Rincón, D.; Khan, U.; Armenakis, C. Flood Risk Mapping Using GIS and Multi-Criteria Analysis: A Greater Toronto Area Case Study. Geosciences 2018, 8, 275. [Google Scholar] [CrossRef] [Green Version]
  7. Teng, J.; Jakeman, A.; Vaze, J.; Croke, B.F.; Dutta, D.; Kim, S. Flood inundation modelling: A review of methods, recent advances and uncertainty analysis. Environ. Model. Softw. 2017, 90, 201–216. [Google Scholar] [CrossRef]
  8. Clement, M.; Kilsby, C.; Moore, P. Multi-temporal synthetic aperture radar flood mapping using change detection. J. Flood Risk Manag. 2017, 11, 152–168. [Google Scholar] [CrossRef]
  9. Giustarini, L.; Hostache, R.; Kavetski, D.; Chini, M.; Corato, G.; Schlaffer, S.; Matgen, P. Probabilistic Flood Mapping Using Synthetic Aperture Radar Data. IEEE Trans. Geosci. Remote Sens. 2016, 54, 6958–6969. [Google Scholar] [CrossRef]
  10. Aricò, C.; Filianoti, P.G.F.; Sinagra, M.; Tucciarelli, T. The FLO Diffusive 1D-2D Model for Simulation of River Flooding. Water 2016, 8, 200. [Google Scholar] [CrossRef] [Green Version]
  11. Costabile, P.; Macchione, F.; Natale, L.; Petaccia, G. Flood mapping using LIDAR DEM. Limitations of the 1-D modeling highlighted by the 2-D approach. Nat. Hazards 2015, 77, 181–204. [Google Scholar] [CrossRef]
  12. Morales-Hernandez, M.; Petaccia, G.; Brufau, P.; García-Navarro, P. Conservative 1D–2D coupled numerical strategies applied to river flooding: The Tiber (Rome). Appl. Math. Model. 2016, 40, 2087–2105. [Google Scholar] [CrossRef]
  13. Afshari, S.; Tavakoly, A.A.; Rajib, M.A.; Zheng, X.; Follum, M.L.; Omranian, E.; Fekete, B.M.; Rajib, A. Comparison of new generation low-complexity flood inundation mapping tools with a hydrodynamic model. J. Hydrol. 2018, 556, 539–556. [Google Scholar] [CrossRef]
  14. Lamichhane, N.; Sharma, S. Effect of input data in hydraulic modeling for flood warning systems. Hydrol. Sci. J. 2018, 63, 938–956. [Google Scholar] [CrossRef]
  15. Ballesteros-Cánovas, J.; Bodoque, J.M.; Díez-Herrero, A.; Sánchez-Silva, M.; Stoffel, M. Calibration of floodplain roughness and estimation of flood discharge based on tree-ring evidence and hydraulic modelling. J. Hydrol. 2011, 403, 103–115. [Google Scholar] [CrossRef]
  16. Habert, J.; Ricci, S.; Le Pape, E.; Thual, O.; Piacentini, A.; Goutal, N.; Jonville, G.; Rochoux, M. Reduction of the uncertainties in the water level-discharge relation of a 1D hydraulic model in the context of operational flood forecasting. J. Hydrol. 2016, 532, 52–64. [Google Scholar] [CrossRef] [Green Version]
  17. Dimitriadis, P.; Tegos, A.; Oikonomou, A.; Pagana, V.; Koukouvinos, A.; Nikos, M.; Koutsoyiannis, D.; Efstratiadis, A. Comparative evaluation of 1D and quasi-2D hydraulic models based on benchmark and real-world applications for uncertainty assessment in flood mapping. J. Hydrol. 2016, 534, 478–492. [Google Scholar] [CrossRef]
  18. Papaioannou, G.; Loukas, A.; Vasiliades, L.; Aronica, G.T. Sensitivity analysis of a probabilistic flood inundation mapping framework for ungauged catchments. Eur. Water 2017, 60, 9–16. [Google Scholar]
  19. Sarhadi, A.; Soltani, S.; Modarres, R. Probabilistic flood inundation mapping of ungauged rivers: Linking GIS techniques and frequency analysis. J. Hydrol. 2012, 458, 68–86. [Google Scholar] [CrossRef]
  20. Winter, B.; Schneeberger, K.; Huttenlau, M.; Stötter, J. Sources of uncertainty in a probabilistic flood risk model. Nat. Hazards 2017, 91, 431–446. [Google Scholar] [CrossRef] [Green Version]
  21. Domeneghetti, A.; Vorogushyn, S.; Castellarin, A.; Merz, B.; Brath, A. Probabilistic flood hazard mapping: Effects of uncertain boundary conditions. Hydrol. Earth Syst. Sci. 2013, 17, 3127–3140. [Google Scholar] [CrossRef] [Green Version]
  22. Tsanis, I.; Seiradakis, K.D.; Daliakopoulos, I.N.; Grillakis, M.G.; Koutroulis, A. Assessment of GeoEye-1 stereo-pair-generated DEM in flood mapping of an ungauged basin. J. Hydroinform. 2013, 16, 1–18. [Google Scholar] [CrossRef]
  23. Petroselli, A.; Vojtek, M.; Vojteková, J. Flood mapping in small ungauged basins: A comparison of different approaches for two case studies in Slovakia. Hydrol. Res. 2018, 50, 379–392. [Google Scholar] [CrossRef] [Green Version]
  24. Papaioannou, G.; Loukas, A.; Vasiliades, L.; Aronica, G.T. Flood inundation mapping sensitivity to riverine spatial resolution and modelling approach. Nat. Hazards 2016, 83, 117–132. [Google Scholar] [CrossRef]
  25. Vozinaki, A.-E.K.; Morianou, G.G.; Alexakis, D.D.; Tsanis, I. Comparing 1D and combined 1D/2D hydraulic simulations using high-resolution topographic data: A case study of the Koiliaris basin, Greece. Hydrol. Sci. J. 2016, 62, 642–656. [Google Scholar] [CrossRef]
  26. Patel, D.; Ramirez, J.A.; Srivastava, P.K.; Bray, M.; Zhang, S. Assessment of flood inundation mapping of Surat city by coupled 1D/2D hydrodynamic modeling: A case application of the new HEC-RAS 5. Nat. Hazards 2017, 89, 93–130. [Google Scholar] [CrossRef]
  27. Pasquier, U.; He, Y.; Hooton, S.; Goulden, M.; Hiscock, K.M. An integrated 1D–2D hydraulic modelling approach to assess the sensitivity of a coastal region to compound flooding hazard under climate change. Nat. Hazards 2018, 98, 915–937. [Google Scholar] [CrossRef] [Green Version]
  28. Lea, D.; Yeonsu, K.; Hyunuk, A. Case Study of HEC-RAS 1D–2D Coupling Simulation: 2002 Baeksan Flood Event in Korea. Water 2019, 11, 2048. [Google Scholar] [CrossRef] [Green Version]
  29. Sarchani, S.; Tsanis, I. Analysis of a Flash Flood in a Small Basin in Crete. Water 2019, 11, 2253. [Google Scholar] [CrossRef] [Green Version]
  30. Tsanis, I.; Boyle, S. A 2D hydrodynamic/pollutant transport GIS model. Adv. Eng. Softw. 2001, 32, 353–361. [Google Scholar] [CrossRef]
  31. Naoum, S.; Tsanis, I.K.; Fullarton, M. A GIS pre-processor for pollutant transport modelling. Environ. Model. Softw. 2005, 20, 55–68. [Google Scholar] [CrossRef]
  32. Brunner, G.W. HEC-RAS, River Analysis System, 2D Modeling User’s Manual; CPD-68A, Version 5.0; U.S. Army Corps of Engineers, Hydrologic Engineering Center: Davis, CA, USA, 2016.
  33. Brunner, G.W. HEC-RAS, River Analysis System Hydraulic Reference Manual; CPD-69, Version 5.0; U.S. Army Corps of Engineers, Hydrologic Engineering Center: Davis, CA, USA, 2016.
  34. Cameron, T.; Ackerman, P.E. HEC-GeoRAS GIS Tools for Support of HEC-RAS using ArcGIS® 10 User’s Manual; CPD-83, Version 10; U.S. Army Corps of Engineers, Hydrologic Engineering Center: Davis, CA, USA, 2012.
  35. Brunner, G.W. HEC-RAS, River Analysis System User’s Manual; CPD-68, Version 5.0; U.S. Army Corps of Engineers, Hydrologic Engineering Center: Davis, CA, USA, 2016.
  36. Chow, V.T. Open-Channel Hydraulics; McGraw-Hill: New York, NY, USA, 1959. [Google Scholar]
  37. Goodell, C. Lateral Structure Coefficients. 2013. Available online: http://hecrasmodel.blogspot.com/2013/12/lateral-structure-coefficients.html (accessed on 10 February 2020).
  38. Jacob, D.; Petersen, J.; Eggert, B.; Alias, A.; Christensen, O.B.; Bouwer, L.M.; Braun, A.; Colette, A.; Déqué, M.; Georgievski, G.; et al. EURO-CORDEX: New high-resolution climate change projections for European impact research. Reg. Environ. Chang. 2013, 14, 563–578. [Google Scholar] [CrossRef]
Figure 1. Almyrida stream basin.
Water 12 01532 g001
Figure 2. Geometry of the study reach, including the 2D flow areas, break-lines (pink), and 2D finite elements on the left and right of the 1D stream, through high-resolution digital elevation model (DEM) 2 m × 2 m.
Water 12 01532 g002
Figure 3. Diagram of the applied process.
Water 12 01532 g003
Figure 4. Simulated depth on control wall for varying Weir coefficient in the lateral structures and Manning’s roughness coefficient nf in the flow areas, through the coupled hydraulic 1D/2D HEC-RAS (Hydrologic Engineering Center’s River Analysis System) model, at high-resolution DEM 5 m × 5 m.
Water 12 01532 g004
Figure 5. Simulated depth on control wall for varying Weir coefficient in the lateral structures and Manning’s roughness coefficient nf in the flow areas, through the coupled hydraulic 1D/2D HEC-RAS model, at high-resolution DEM 2 m × 2 m.
Water 12 01532 g005
Figure 6. Modeled flood depths (m) at (a) 10:00, (b) 11:30, (c) 12:00, (d) 13:00, (e) 14:00, and (f) 16:00 of 17 October 2006, by using the coupled 1D/2D HEC-RAS model, at high resolution DEM 5 m × 5 m.
Water 12 01532 g006
Figure 7. Modeled velocities (m/s) at (a) 10:00, (b) 11:30, (c) 12:00, (d) 13:00, (e) 14:00, and (f) 16:00 of 17 October 2006, by using the coupled 1D/2D HEC-RAS model, at high resolution DEM 5 m × 5 m.
Water 12 01532 g007
Figure 8. Modeled flood depths (m) at (a) 10:00, (b) 11:30, (c) 12:00, (d) 13:00, (e) 14:00, and (f) 16:00 of 17 October 2006, by using the coupled 1D/2D HEC-RAS model, at high-resolution DEM 2 m × 2 m.
Water 12 01532 g008
Figure 9. Modeled velocities (m/s) at (a) 10:00, (b) 11:30, (c) 12:00, (d) 13:00, (e) 14:00, and (f) 16:00 of 17 October 2006, by using the coupled 1D/2D HEC-RAS model, at high resolution DEM 2 m × 2 m.
Water 12 01532 g009
Figure 10. Maximum flood depth (m) and flood extent (m2) variations from the beginning till the end of the simulation, by using the coupled 1D/2D HEC-RAS model, at both high-resolution DEMs.
Water 12 01532 g010
Figure 11. (a) Flood extent of the downstream reach of Almyrida stream as derived from DEM 2 m × 2 m (dark blue) and DEM 5 m × 5 m (light blue); Characteristic cross-sections and water level (b) 515.68 m before end; (c) 423.20 m before end; (d) 207.43 m before end, from both DEMs through the coupled 1D/2D HEC-RAS model.
Water 12 01532 g011
Figure 12. Rainfall and flow hydrograph due to scenarios of increasing peak rainfall by factors of 1.5, 2.0, and 3.0.
Water 12 01532 g012
Table 1. Recorded daily rain events (mm), maximum 3-hourly measured rain (mm) and the ratio of 3-hourly rain data to daily data divided with 8 three-hours per day through the EC-EARTH_RCP8.5_r12i1p1_SMHI_RCA4 climate model.
DateDaily Rain (mm)Max 3-Hourly Rain (mm)Ratio:
3-Hourly/Daily/8
20 February 1972212.7538.911.46
6 November 1973107.1219.671.47
21 March 1985100.7331.502.50
13 February 199398.5430.282.46
Table 2. Analysis of rainy days on a daily basis, of neighboring stations to the area of interest via MPI-ESM-LR_r1i1p1_CSC_REMO climate models.
Period 1981–2098RCP4.5RCP8.5
Kalyves StationVamos StationKalyves StationVamos Station
No of days with precipitation >300 mm1201
No of days with precipitation >250 mm1413
No of days with precipitation >200 mm510214
No of days with precipitation >150 mm1138931
No of days with no precipitation37,49636,62837,74736,967
Table 3. Maximum flood depth (m) at high resolution DEMs (5 and 2 m) resulting from different distributions of peak precipitation for a total amount of precipitated water equal to 345 mm.
P = 345 mmMax Precipitation Depth in 15 Min (mm)Precipitation Intensity (mm/h)Peak Discharge (m3/s)Max Flood Depth [DEM 5 m] (m)Max Flood Depth [DEM 2 m] (m)
smooth peak10(10 × 4) = 401755.135.62
base17.5(17.5 × 2) + (10 × 2) = 55211.65.456.02
intense peak52.5(52.5 × 2) + (10 × 2) = 1252795.738.78
Table 4. Maximum flood depth (m) and flood extent (m2) resulting from the observed precipitation and increase in peak precipitation by factors of 1.5, 2.0, and 3.0, by using the coupled 1D/2D HEC-RAS model, at high-resolution DEMs (5 and 2 m).
P = 196.2 mmPeak Discharge (m3/s)DEM 5 m × 5 mDEM 2 m × 2 m
Max Flood Depth (m)Flood Extent (m2)Max Flood Depth (m)Flood Extent (m2)
Observed Precipitation1093.94108,7674.8072,606
50% Increase of Peak Precipitation115.94.03110,6864.8975,142
100% Increase of Peak Precipitation130.64.25116,9135.0780,003
200% Increase of Peak Precipitation148.24.58124,1605.2785,708

