Article

A Qualitative Study of the Critical Conditions for the Initiation of Mine Waste Debris Flows

1
Department of Geological Engineering, Chang’an University, No. 126 Yanta Road, Xi’an 710054, China
2
Key Laboratory of Western China Mineral Resources and Geological Engineering, Xi’an 710054, China
3
China Electronic Research Institute of Engineering Investigations and Design, Xi’an 710055, China
*
Author to whom correspondence should be addressed.
Water 2020, 12(6), 1536; https://doi.org/10.3390/w12061536
Submission received: 23 April 2020 / Revised: 26 May 2020 / Accepted: 26 May 2020 / Published: 28 May 2020
(This article belongs to the Section Hydraulics and Hydrodynamics)

Abstract

:
Mine waste debris flows are a type of man-made debris flow that commonly lead to major disasters. In this study, the Xiaotong Gully, which is located in the Xiaoqinling gold mining area in China and contains a typical mine waste debris flow gully, was selected as the study area. Since a debris flow can be classified as either a geotechnical debris flow or hydraulic debris flow based on its initiation mode, we conducted 46 experimental model tests to explore the initiation conditions of these two different types of debris flows. According to our tests, the initiation conditions of hydraulic debris flows were mainly affected by the flume gradient, the water content of the mine waste, the inflow discharge, the water supply modes, and the clay particle content. A larger flume gradient and higher mine waste water content were more conducive to initiating a hydraulic debris flow. However, the influence of the water supply mode on the initiation of a hydraulic debris flow was complex (influenced by factors such as water content of mine waste, runoff discharge rate and rainfall intensity). The critical runoff of a hydraulic debris flow, which starts with a parabolic relationship to the clay particle content of the mine waste, decreased with increasing clay particle content and then increased. There was a minimum critical runoff when the clay content of the mine waste was 30%. The initiation conditions of a geotechnical debris flow were mainly affected by the flume gradient, the water content, and the clay particle content. The critical gradient of a geotechnical debris flow decreased with increasing water content and had a parabolic relationship to the clay particle content. In tests 31–46 of this study, the second and third critical slopes both decreased and then increased with increasing clay particle content. These preliminary research results provide a scientific reference for subsequent research on the prevention and mitigation of mine waste debris flows.

1. Introduction

Debris flows occur when masses of poorly sorted agitated sediment that are saturated with water surge downslope in response to gravity [1,2,3]. Debris flows, which consist of a mixture of water, sediment, rocks, and soils, cause more damage than other kinds of geo-hazards due to their enormous impact force, rapid velocity, and long spread distance [4].
Prior research conducted on the formation mechanism of debris flows has focused on geological disasters. Scholars in China and abroad have done a great deal of research on the formation mechanism of debris flows [1,5,6,7]. Various mechanisms that are likely to trigger debris flows include the mobilization of debris deposits on steep impermeable surfaces [5], landslides [7,8], and the collapse of natural or artificial dams [9,10,11,12]. The initiation modes of debris flows can be divided into two types: hydraulic debris flow and geotechnical debris flow. Hydraulic debris flows are always initiated by the mobilization of a channel bed due to surface water flow [5,13,14,15]. In this type of flow, the shear stress of the water mobilizes individual particles and the solid concentration increases until it reaches an equilibrium dependent on the slope angle and water supply [16]. Geotechnical debris flows are always mobilized from landslides when the triggering rainfall causes an increase in pore water pressure within the soil associated with the critical groundwater levels along a basal slip zone [17,18]. This increase in pore water pressure is commonly associated with the rise of the water table perched on the bedrock or on top of relatively impermeable soils [19,20,21]. In this case, landslide materials contain a fine fraction to retain water in the unsaturated zone and limit the saturated conductivity, which inhibits drainage from the source area [22,23]. Therefore, three basic requirements have to be fulfilled simultaneously for geotechnical debris flows to occur: the presence of steep slopes, the availability of unconsolidated material, and an unusually high supply of water [1,24]. Many scholars have carried out studies focusing on these factors. For instance, Iverson et al. [25] found that a certain clay content effectively reduces the resistance to debris flow. Therefore, the clay content is one of the important parameters affecting soil failure, debris flow initiation, and movement. Chen et al. [26] investigated soil mass failure and debris flow initiation with different clay contents through experimental tests. Zhuang et al. [27] explored the effects of slope on debris flow initiation and motion through 46 sets of model experiments. They identified three different initiation modes (initiation from erosion, dam failure, and slope failure) with corresponding slope ranges. The grain composition and hydrodynamic conditions of debris flow initiation have also been investigated through experimental tests [10,28] and numerical simulations [29,30]. In general, the initiation of debris flow is a complex process that is controlled by multiple factors and cannot be fully reflected by studies focused on the influence of a single factor.
Mine waste debris flows are a type of man-made geological process, which can lead to a disaster, that are caused or exacerbated by the unreasonable stacking of mine waste during the exploitation of mineral resources [31]. The formation, development, and extinction of mine waste debris flows are always accompanied by human intervention [15]. According to incomplete statistics, there were 627 well-documented mine waste debris flow disasters in China between 1958 and 2005, which caused a total of 987 deaths and direct economic losses of up to USD120 million [15]. Among these were several catastrophic debris flow disasters. The most notable mine waste debris flow disaster was the “7.11” debris flow in the Daxicha Gully, Tongguan County, Shaanxi Province, which was a catastrophic debris flow triggered by heavy rainfall in the Daxicha Gully on July 11, 1994. The flow delivered a large volume of mine waste along the channel, creating a large-scale debris flow with a depth of 5 m and a flow discharge of 260 m3/s. The debris flow resulted in 51 deaths, more than 2000 missing, and economic losses of more than 3 million dollars [31]. Hence, it is particularly urgent to carry out systematic research on the formation mechanisms of mine waste debris flows, and at present, few studies have been conducted in this area. Since mine waste consists of mainly coarse particles and has good water permeability [3,31,32,33], it follows that the formation mechanisms of mine waste debris flows are different from those of natural debris flows [11,15]. However, the aforementioned studies on the formation mechanisms of natural debris flows provide a reference for the systematic study of mine waste debris flows.
In this study, the Xiaotong Gully in the Xiaoqinling Gold Mine area was chosen as the study area. We investigated the distribution and physical properties of the mine waste along the gully and chose the loose mine waste from upstream as the experimental material. Forty-six experimental model tests were designed and conducted to explore the initiation conditions of geotechnical debris flows and hydraulic debris flows. The relationships between the flume gradient, the water supply modes, and the grain composition of the mine waste were investigated through these model tests. To preserve the in-situ conditions of the mine waste material as much as possible, all the tests were carried out during our field investigation on the site in this gully. No pieces of sophisticated measuring equipment, such as a piezometer, were accessible at that time, and, therefore, only cameras were used for the observation. The purpose of our experiments was to gain a mechanistic, but, at this stage, inevitable, qualitative understanding of the initiation conditions of mine waste debris flows. We have identified a few key factors controlling the initiation of mine waste debris flows, which provides direction for further research. This study also provides useful guidance for the prevention and mitigation of mine waste debris flows.

2. Experimental Methods

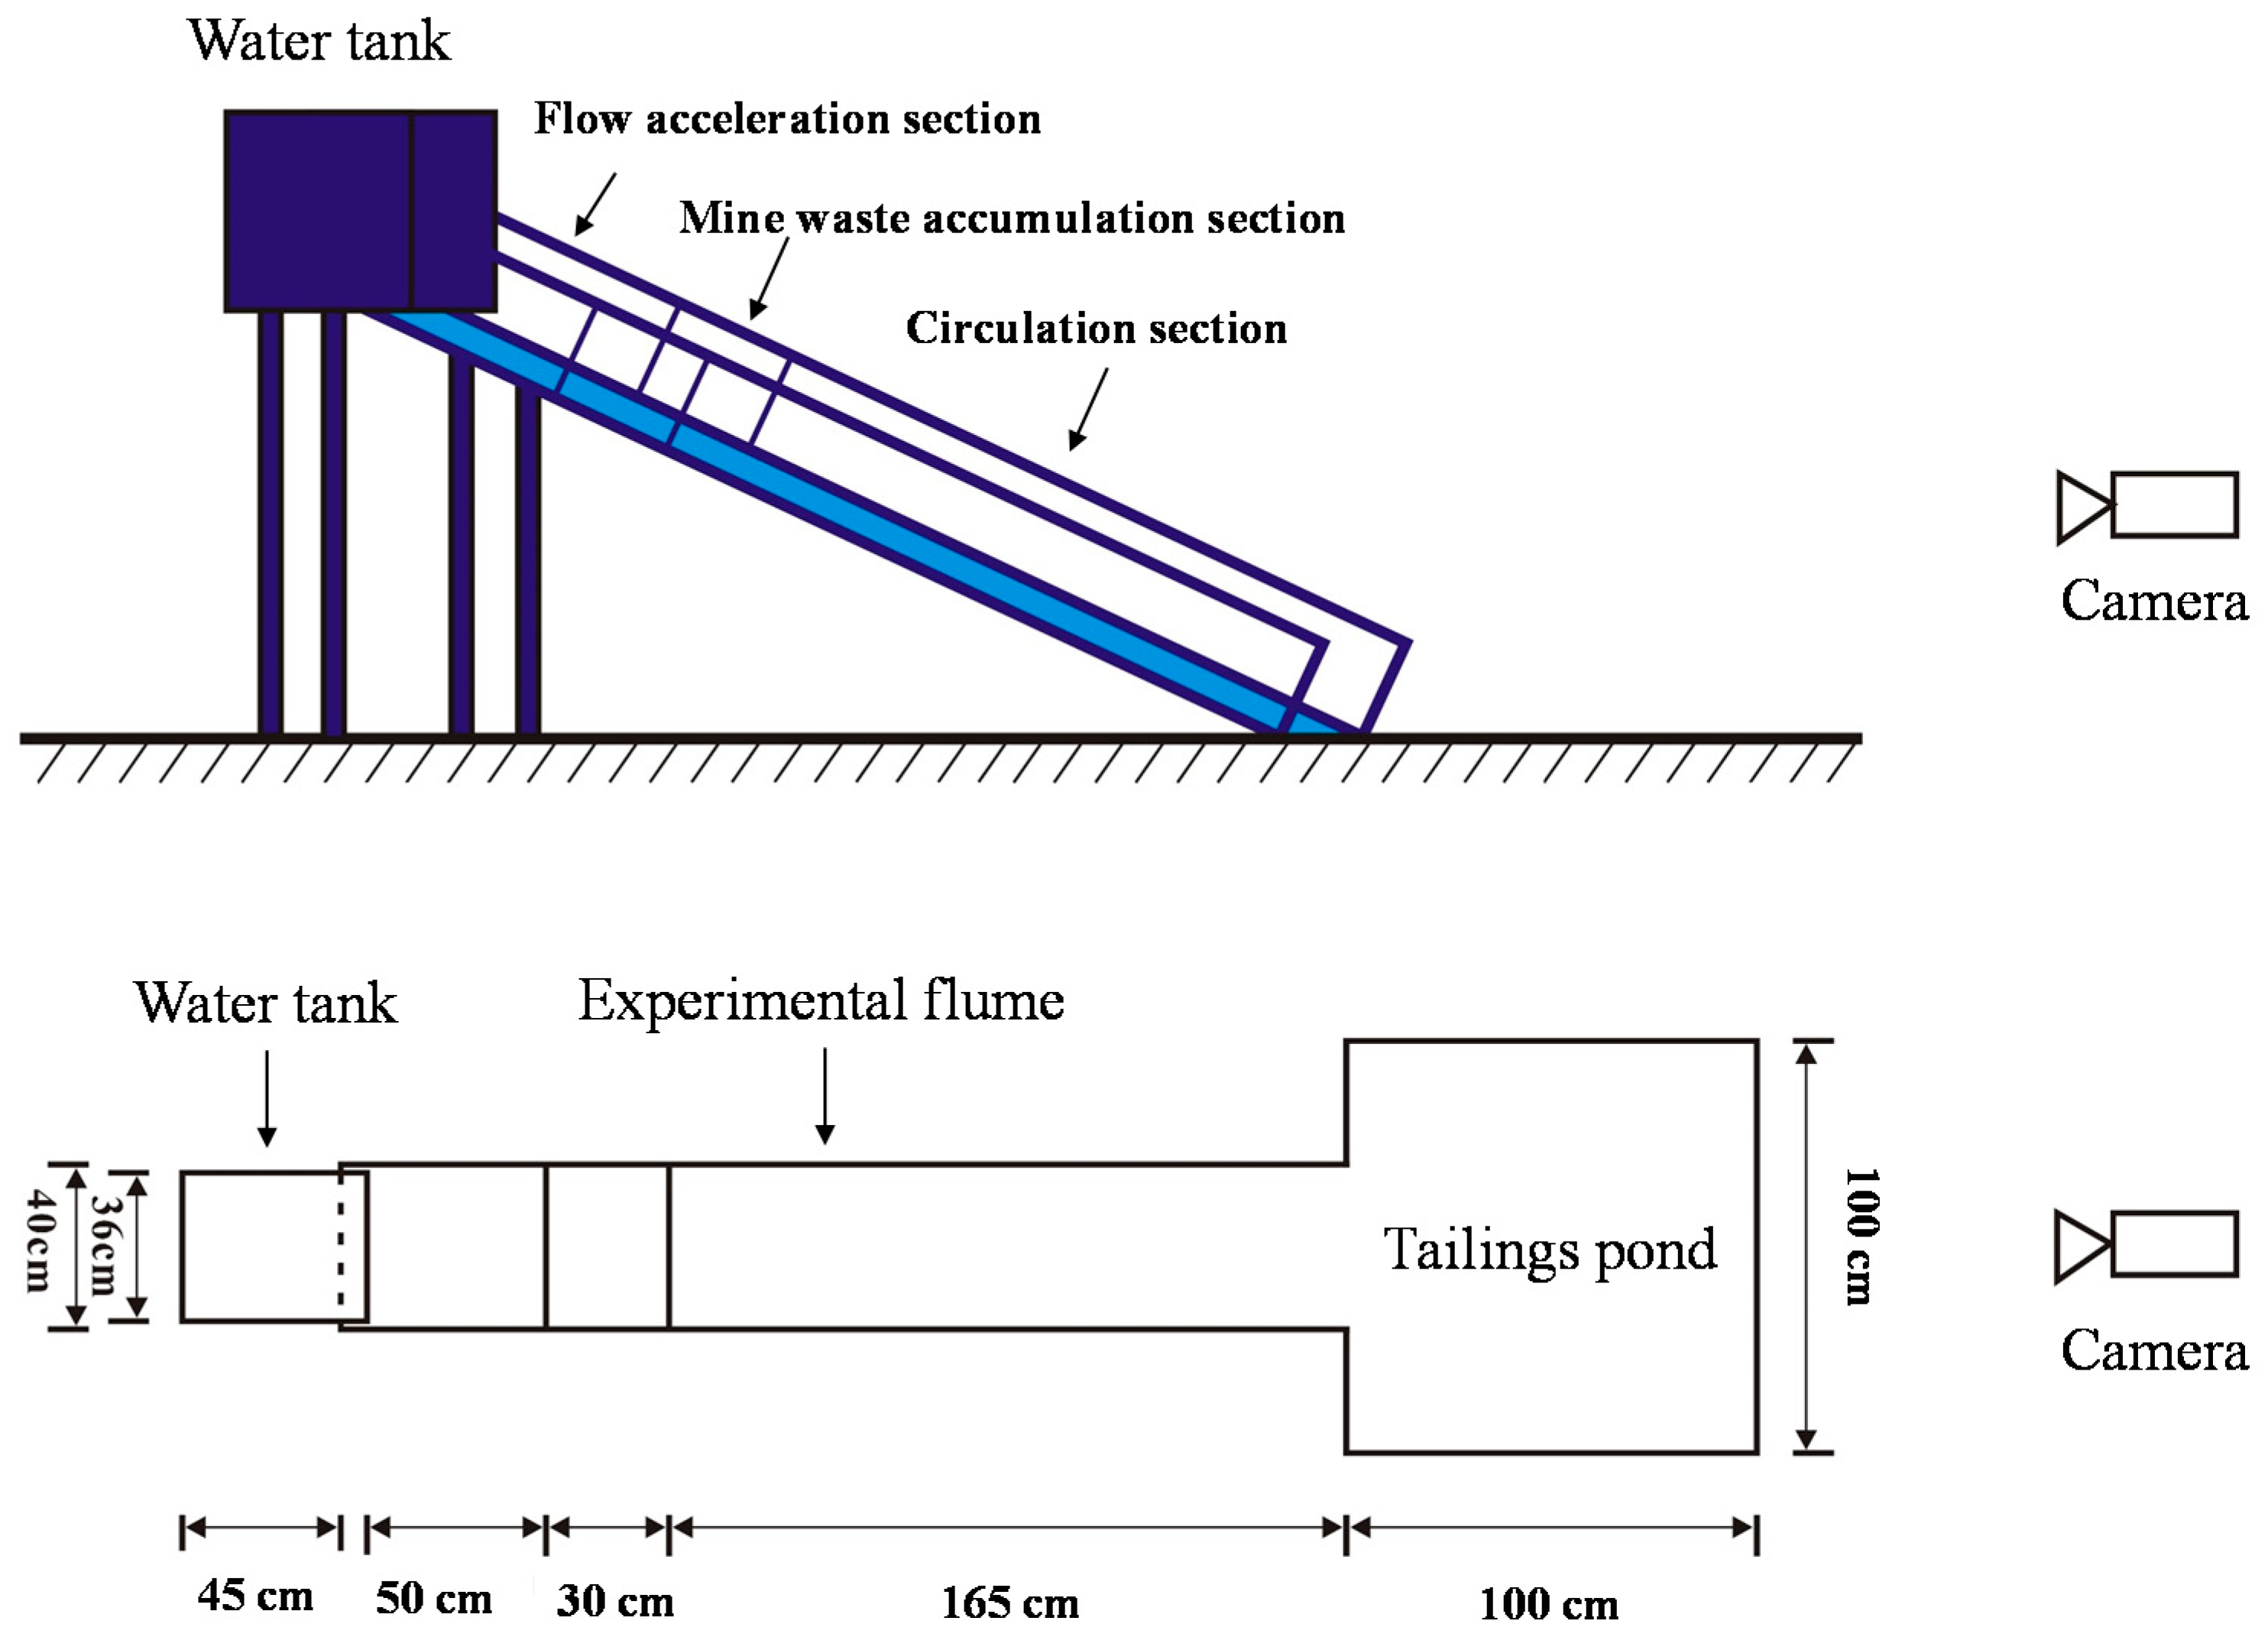
2.1. Experimental Setup

An experimental setup was designed based on our field investigations in the Xiaotong Gully in the Xiaoqinling gold mining area. The experimental setup consisted of a water tank and an experimental flume (Figure 1). The experimental flume was 245 cm long, 40 cm wide, and 25 cm deep. The water tank was 45 cm long, 36 cm wide, and 48 cm deep. The experimental flume was divided into three sections: the upper 50 cm of the experimental flume was the flow acceleration section, which were used to simulate the runoff generation and concentration; the middle 30 cm was the mine waste accumulation section, which simulates the process of mine waste accumulation and initiation; the lower 165 cm was used for debris flow circulation, which were used to observe the motion characteristics of debris flow after initiation. This division is based on the detailed field investigation of catchment area, the distribution of mine waste heaps, and circulation distance.

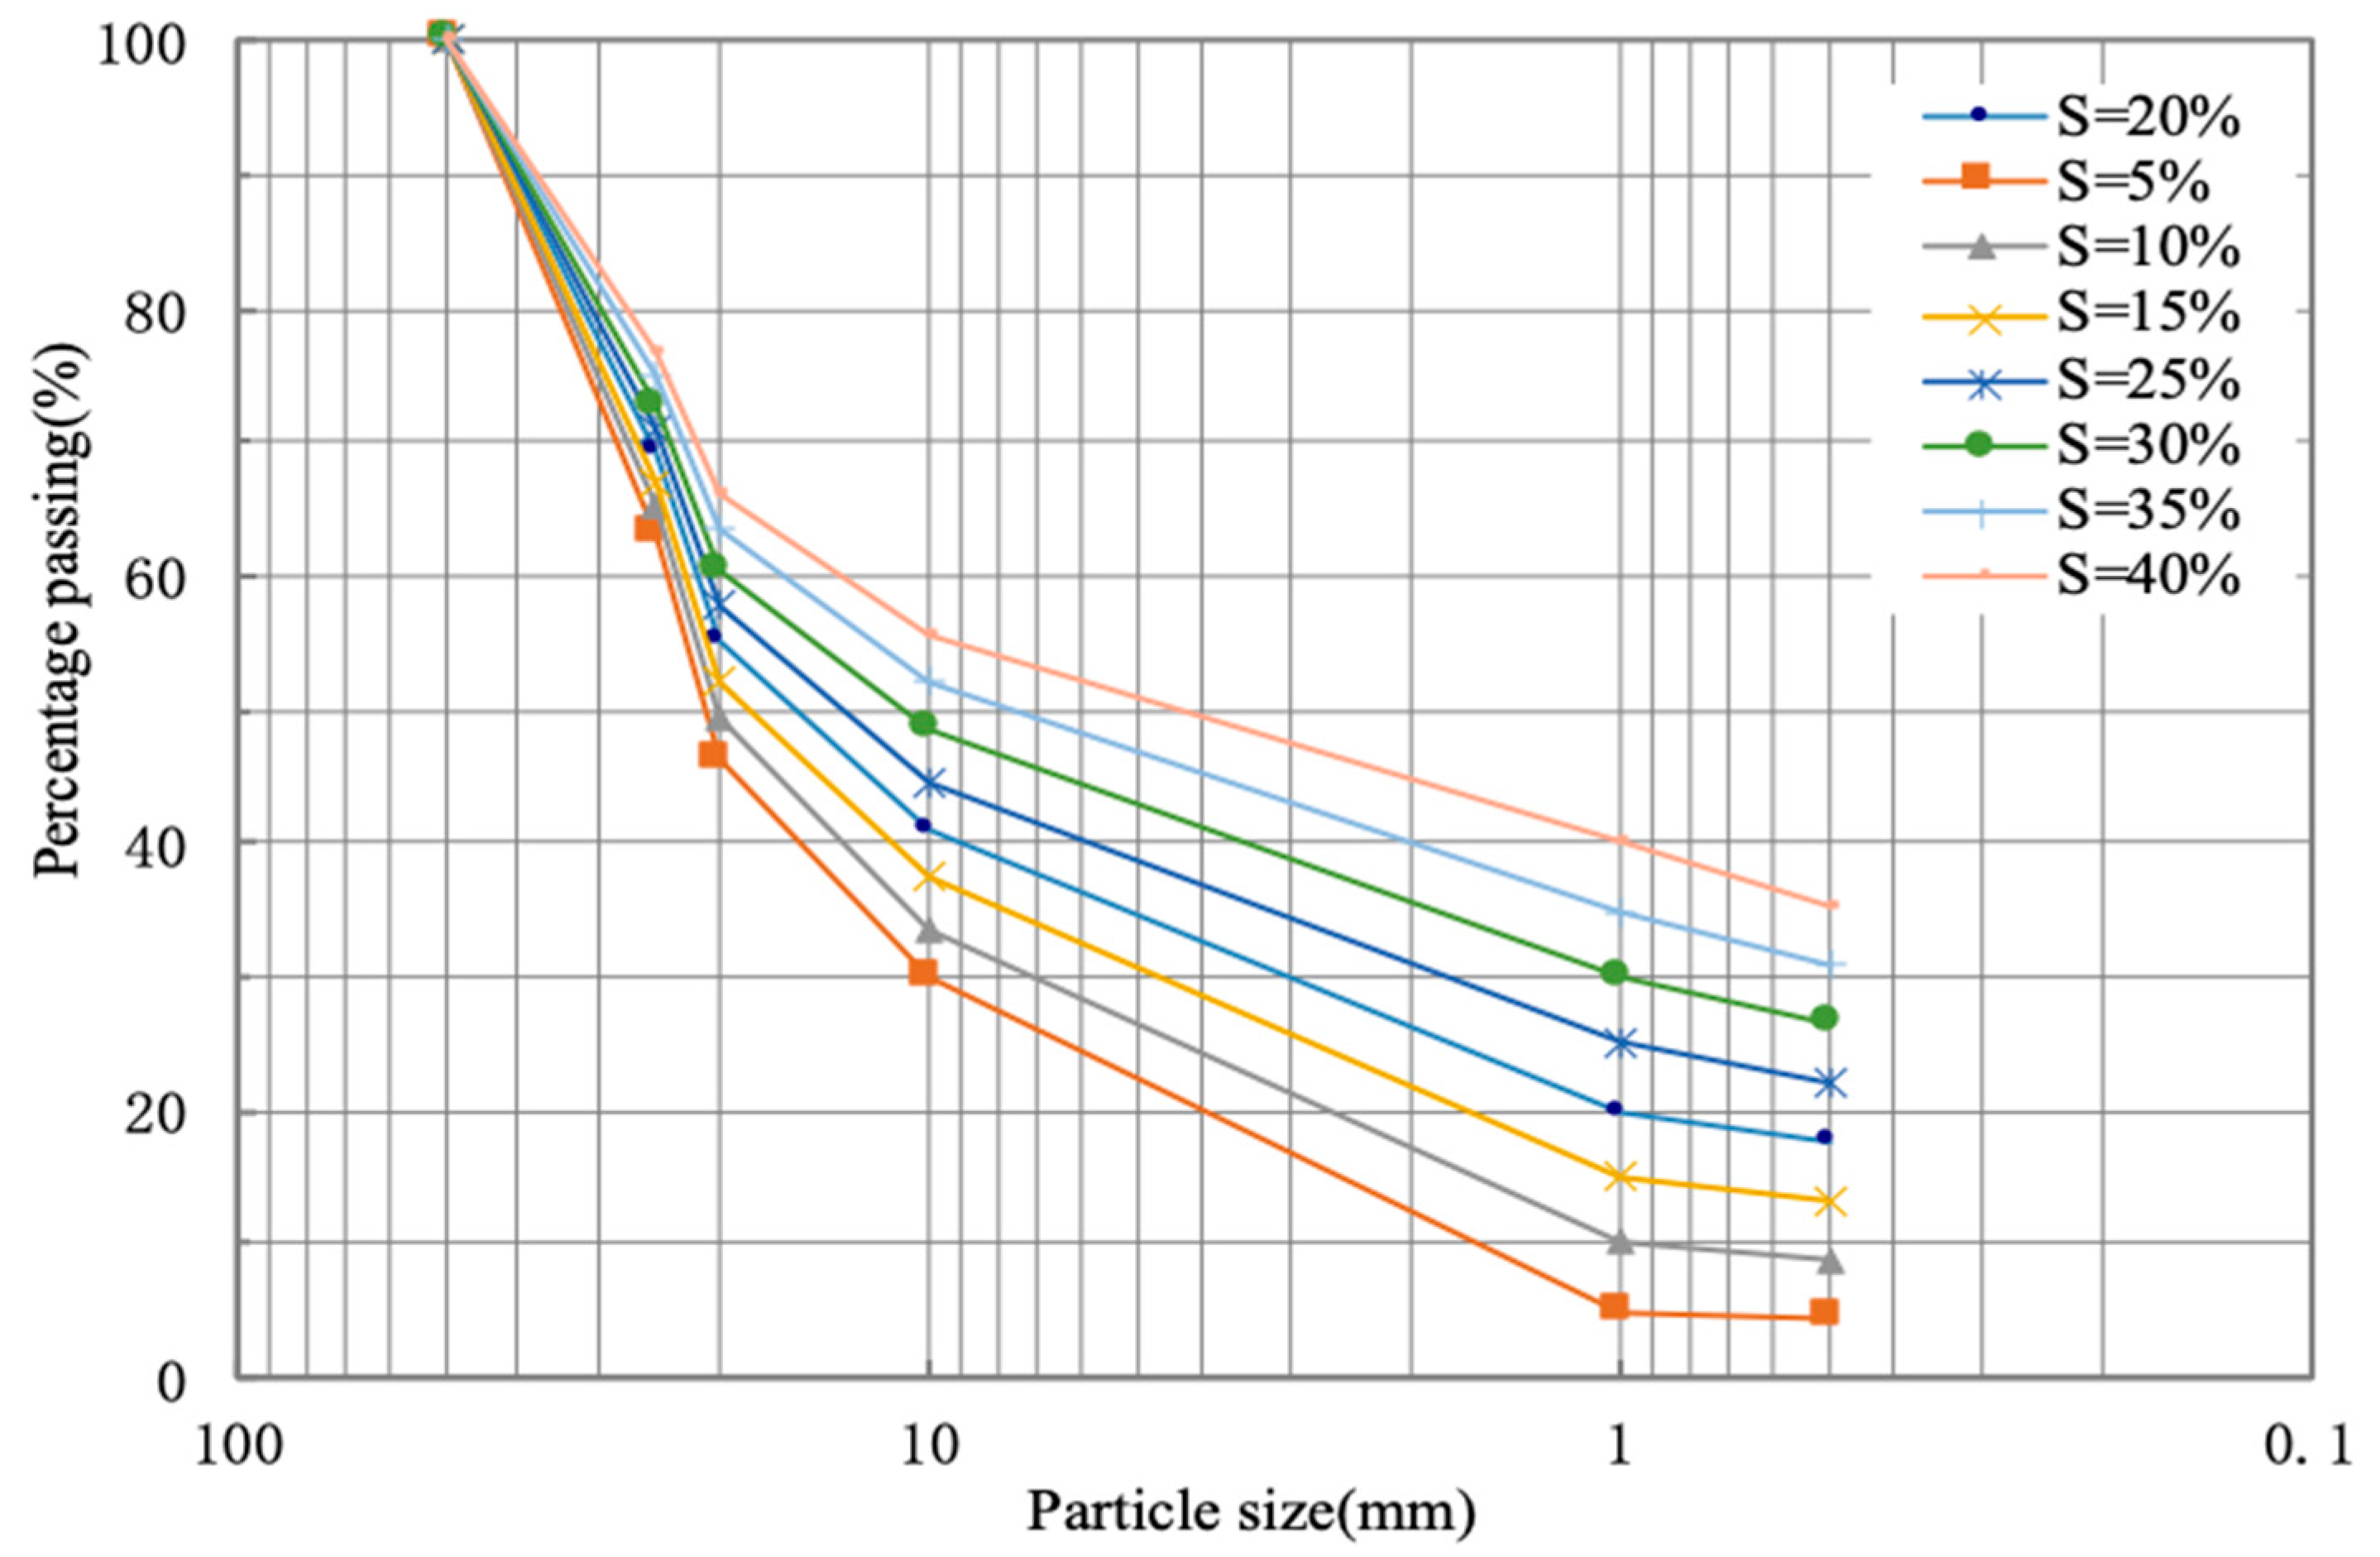
2.2. The Characteristics of the Mine Waste

Figure 2 shows the location of Xiaotong Gully, which is a very active debris flow gully. Man-made debris flows have occurred in this gully at least three times due to mining in recorded history. We conducted a detailed field investigation in the gully and designed a series of model experiments to simulate the initiation process of its debris flows.
The profile of the mine waste heaps in Xiaotong Gully is shown in Figure 3, which shows that a large amount of mine waste is distributed in this gully. The gully develops from east to west, while the west is higher than east. The whole length of the gully is 1.6km, and the catchment is about 4 km2. The gully is V-shaped, while the average longitudinal gradient is 25%. Through our field investigation, a total of 21 mine waste heaps were distributed in Xiaotong Gully. The original materials for our experiment were obtained at No. 21 mine waste heap (as shown in Figure 3). Taking into account the limitations of the hydrodynamic conditions of the experimental setup, particles larger than 5 cm were excluded. Figure 4 shows the grading of the in-situ materials and the materials used in the experimental tests. As can be seen in Figure 4, the gradation curve of the mine waste had a double-peak structure. That is, there were more clay particles and large particles and fewer intermediate particles. Such kind of materials are always likely to form a solid–liquid two-phase flow. That is, the fine particles are fully mixed with water to form the liquid phase of the debris flow, while the coarse particles are the solid phase of the debris flow [6].
Many scholars who have done research about fine particle influence on slope stability and debris-flow formation found that fine particles are a major factor in inducing debris flow [3,34]. However, the coarse and fine particle is relative to particle size. In this research, the specific particle size of coarse and fine need to be distinguished. Hence, we take 1 mm as the critical value to distinguish coarse and fine particles [6,23]. By changing the clay particle content, we can explore its influence on the initiation of mine waste debris flows. Changes in fine particle content will lead to changes in the particle gradation of mine waste. Therefore, Figure 5 shows the particle gradation with different fine particle content used in our experimental tests in this research (in No. 23–30 and 39–46 tests).

2.3. Design of the Simulation Experiments

Based on our field investigations, the initiation of the mine waste debris flows in the mining area was divided into two types: geotechnical debris flow and hydraulic debris flow. Based on 46 experimental tests, we explored the critical conditions of the initiation of mine waste debris flows. The specific experimental conditions were set as follows.
The initiation mechanism of a hydraulic debris flow mainly depends on the drag force of the upstream runoff and the ability of the mine waste to resist erosion. For instance, if the mine waste contains a large number of clay particles, the water flow cannot infiltrate the mine waste in time. As a result, the mine waste debris flow will be initiated partially by surface flow erosion (Figure 6). If the coarse particle content is large and the inflow discharge is small, the water flow may infiltrate into the mine waste and initiate the movement of a large amount of saturated mine waste (Figure 7). Taking this into consideration, 30 experimental model tests were designed and conducted in this study. Using these tests, the effects of the flume gradient, the initial water content of the mine waste, the water supply modes (rainfall and upstream), the inflow discharge, and the clay particle content on the critical conditions of the initiation of the debris flows were all considered separately. Specific experimental conditions and results are presented in Table 1.
The steps of the model experiments are as follows: ① Adjust the experimental flume gradient. ② Place 27 kg of source material into the flume, ensuring that the average height of the mine waste heaps is 10 cm and the angle of the front end of the mine waste heaps is 32°–34°. ③ Fill the water tank with water. ④ Open the gate valve of the water tank and start the stopwatch at the same time. Observe the experimental phenomena. ⑤ When the mine waste movement initiates, close the gate valve of the water tank and stop the stopwatch at the same time. Record the volume of the water remaining in the water tank. ⑥ Describe and record the initiation and accumulation characteristics of the debris flow and take photos. ⑦ Clean the experimental flume and prepare the next set of experiments according to the above steps.
We have considered different scenarios of rainfall amount and upstream flow discharge in our experiments. Subsoil water flow is also important for the initiation of debris flow. However, due to the limited accessibility of measuring equipment in our on-site experiments, no piezometer was available. Therefore, the influence of subsoil water flow on debris flow initiation was not studied; we will, however, consider it in our future research.
By considering the delay between the observation of rupture and the close of the water tank gate, the time between the opening of the water gate and the flow of water to mine waste was accumulated before each series of model tests. Since the inflow discharge rate was kept unchanged in every test, based on the delay time, a basic water volume can be calculated and recorded as V0. During our test, we assigned one person to control the water tank gate and another person to observe the rupture. Once we had observed the rupture, we closed the water tank gate as soon as possible. The total amount of water must be reduced by V0, and then the corrected amount of water was the critical water volume to initiate the mine waste. This procedure can significantly reduce the error caused by the delay.
Water content and flume gradient are two crucial factors in the initiation of geotechnical debris flows. Cui et al. [6] defined the critical initiation slope of a debris flow as follows. The first critical initiation slope (θ1) is when the fine-grained mud in the debris flow’s source flows out first. The second critical initiation slope (θ2) is when the slurry part of the source starts to initiate. The third critical initiation slope (θ3) is when all of the mixed slurry is involved in the initiation. For debris flow initiation, the first critical initiation slope was difficult to observe during the experiments and has little practical significance. In this study, a total of 16 experimental tests were carried out to explore the second and third critical initiation slopes. The specific experimental conditions and results are presented in Table 2.
The steps of the model experiments are as follows: ① Keep the experimental flume horizontal and place a baffle 80 cm from the upper end to prevent water loss before the test begins. ② Weigh 13.5 kg of dry mine waste and place it in the container. Then, add a certain amount of water to the container and stir well according to the experimental conditions in Table 2. ③ Pile the prepared mine waste behind the baffle of the experimental flume, ensuring that the height of the mine waste accumulation is about 10 cm. ④ Remove the baffle to start the experiment. Raise the upper end of the flume slowly to ensure a stable increase in slope (Figure 8). ⑤ Gradually raise the flume and observe the initiation conditions of the source. When the front-end of the accumulation initiates, record the flume slope θ2. Continue to raise the flume. When all of the quasi-debris flow material is involved in the movement, record the flume slope θ3. ⑥ Describe the initiation and accumulation characteristics of the debris flow and take photos. ⑦ Clean the experimental flume and prepare the next test according to the above steps. When we were preparing the mine waste for our tests, the mass of dry mine waste remained unchanged and the water was being sprayed on the mine waste continuously and evenly. The water content was obtained according to the ration of the mass of water to the mass of mine waste.

3. Experiment Results and Discussion

3.1. Analysis of the Experimental Results of Hydraulic Debris Flows

Table 1 shows the experimental conditions and preliminary results of 30 model tests. In these tests, the initiation process of hydraulic debris flows with different flume gradients, initial water contents, water supply modes, inflow discharges, and clay particle contents were all considered separately. The specific experimental results are as follows.
(1) The influence of the water content of the mine waste and the water supply mode on the critical conditions of debris flow initiation
In tests 1–5, 27 kg of dry mine waste was used and the inflow discharge rate was 1.9 L/s. In tests 6–10, the initial water content of the mine waste was 5% and the inflow discharge rate was 1.9 L/s. In tests 11–15, 27 kg of dry mine waste was also used in every test, but in addition to the inflow discharge of 1.9 L/s, the water supply method also included artificial rainfall above the mine waste. We recorded the critical water quantity required for the initiation of the mine waste under the different working conditions of each test. Figure 9 shows the critical water quantity of the dry mine waste and the mine waste with an initial water content of 5% for different flume slopes.
We conducted preliminary linear statistical analysis for two different series of experiments. We found that the relationship between the flume gradient and the critical water quantity for tests 1–5 is:
θ + 3.6918 V 0.102 V 2 37.757 = 0   ( R = 0.9218 )
For the mine waste with an initial water content of 5% (tests 6–10), the relationship between the flume gradient and the critical water quantity is:
θ + 3.27 V 0.093 V 2 33.199 = 0   ( R = 0.9437 )
where R is the correlation coefficient, θ is the flume gradient, and V is the critical water quantity. From Figure 4, we determined the following: ① The larger the flume gradient, the smaller the critical water quantity required for mine waste initiation. Conversely, the smaller the flume gradient, the larger the critical water quantity required for initiation. ② The mine waste with an initial water content of 5% initiated more easily than the dry mine waste. However, when the flume slope was 20°, the critical water quantity supplied by upstream inflow and artificial rainfall was slightly larger than that supplied from upstream inflow alone.
The water quantity required to initiate debris flow in a channel can be supplied by surface runoff or rainfall. Different water supply modes also have an impact on debris flow initiation. Figure 10 shows the critical water quantity required for mine waste initiation for three different series of experiments: 1–5, 6–10, and 11–15. The required critical water quantities are quite different for the different water supply modes. At slopes of 10°, 15°, 17°, and 20°, for water supply from upstream inflow and artificial rainfall, the critical water quantity required for mine waste initiation is significantly less than that required for upstream inflow supply only.
Regression analysis was performed on the experimental data for tests 11–15. The relationship between the flume gradient and the critical water quantity is:
V + 0.9335 θ 0.0175 θ 2 = 16.508   ( R = 0.9001 )
where R is the correlation coefficient, θ is the flume gradient, and V is the critical water quantity.
(2) The influence of inflow discharge on the initiation of mine waste
In order to further explore the influence of inflow discharge on the critical conditions for the initiation of mine waste debris flows, tests 16–22 were carried out. In this series of experiments, the flume slope was maintained at 17° and the inflow discharge was adjusted according to the experimental conditions listed in Table 1. The full procedure is described in Section 2.3. Figure 11 shows the relationship between inflow discharge, critical water quantity, and the time required for initiation. As can be seen in Figure 6, as the inflow discharge gradually increases, the time required for debris flow initiation gradually decreases and the critical water quantity required for debris flow initiation gradually decreases. The critical water quantity reaches the minimum value when the inflow discharge is 1.92 L/s, after which the critical water quantity gradually increases as the inflow discharge gradually increases. This demonstrates that, for a certain amount of mine waste, there is an optimum inflow discharge (Q0 = 1.92 L/s).
(3) The influence of clay particle content on the initiation of mine waste debris flows
The clay particle content (with diameters of < 1 mm) of mine waste is also important for the initiation of a debris flow. This factor not only affects the infiltration of surface water but also determines the water holding capacity of the source materials. The influence of the clay particle content on the initiation of debris flows was explored in tests 23–30. The specific experimental conditions are listed in Table 1. During the experiment, the particles with diameters of < 1 mm were sieved from the mine waste and mixed according to the working conditions listed in Table 1. The full experimental process is described in Section 2.3. Figure 12 shows the relationship between the clay particle content of the mine waste and the critical water quantity.
As can be seen in Figure 12, the critical water content and the clay particle content of mine waste have a parabolic relationship. When the clay particle content S is 30%, there is a minimum critical water quantity. When S < 30%, as the clay particle content gradually increases, the critical water quantity required for initiation gradually decreases. When S > 30%, the critical water quantity required for the initiation of the mine waste gradually increases as the fine particle content gradually increases.

3.2. Analysis of the Experimental Results for Geotechnical Debris Flows

Table 2 shows the experimental conditions and preliminary experimental results of 16 model tests (Nos. 31–46), which were used to investigate the initiation conditions of geotechnical debris flows. In tests 31–46, the critical conditions for the initiation of debris flows were investigated for different water contents and fine particle contents. The specific experimental results are as follows.
(1) The influence of the water content of the mine waste on the critical conditions of debris flow initiation
Increasing the water content not only reduces the cohesion and internal friction angle of the mine waste but also increases the weight of the mine waste, which is more conducive to the initiation of a debris flow. Tests 31–38 explored the influence of the water content of the mine waste on the critical slope of debris flow initiation. During these experiments, 13.5 kg of dry mine waste was weighed out. It was then given different water contents according to the working conditions listed in Table 2. The experimental procedures are described in Section 2.3. Figure 13 shows the relationships between the second critical slope (θ2), the third critical slope (θ3), and the water content for the different experimental tests. As can be seen in Figure 13, as the water content gradually increases, the critical slope required for initiation gradually decreases. When the water content reaches 20%, the mine waste is close to saturation. The second critical slope (θ2) and the third critical slope (θ3) were reduced to 16° and 22°, respectively, in Figure 13. Therefore, for mine waste heaps accumulated on a slope, the higher the water content, the easier it was for a debris flow to initiate.
(2) The influence of the clay particle content on the critical conditions for debris flow initiation
A large number of field investigations and experimental tests have found that the clay particle content of the mine waste directly determines the permeability and water holding capacity of the mine waste [3,27,33]. Therefore, the influence of the clay particle content of the mine waste on the critical conditions of debris flow initiation was explored in tests 39–46. During these experiments, particles with diameters of < 1 mm were sieved out of the mine waste and the clay particle content was adjusted according to the working conditions listed in Table 2. Before every test, the mine waste was stacked to a thickness of 10 cm in the initiation area of the experimental flume. The experimental procedures are described in Section 2.3. Figure 13 shows the relationship between the clay particle content of the mine waste and the critical slope.
Figure 14 shows that the critical slope of mine waste initiation and the content of fine particles are generally parabolic. The second and third critical slopes both initially decrease and then increase with increasing clay particle content. The second critical slope (θ2) and the third critical slope (θ3) both have minimum values, but their corresponding clay particle contents are different. When the clay particle content S is 30%, the second critical slope has a minimum value of 20°. However, the minimum value of the third critical slope (θ3) is 30° when the clay particle content S is 20%.

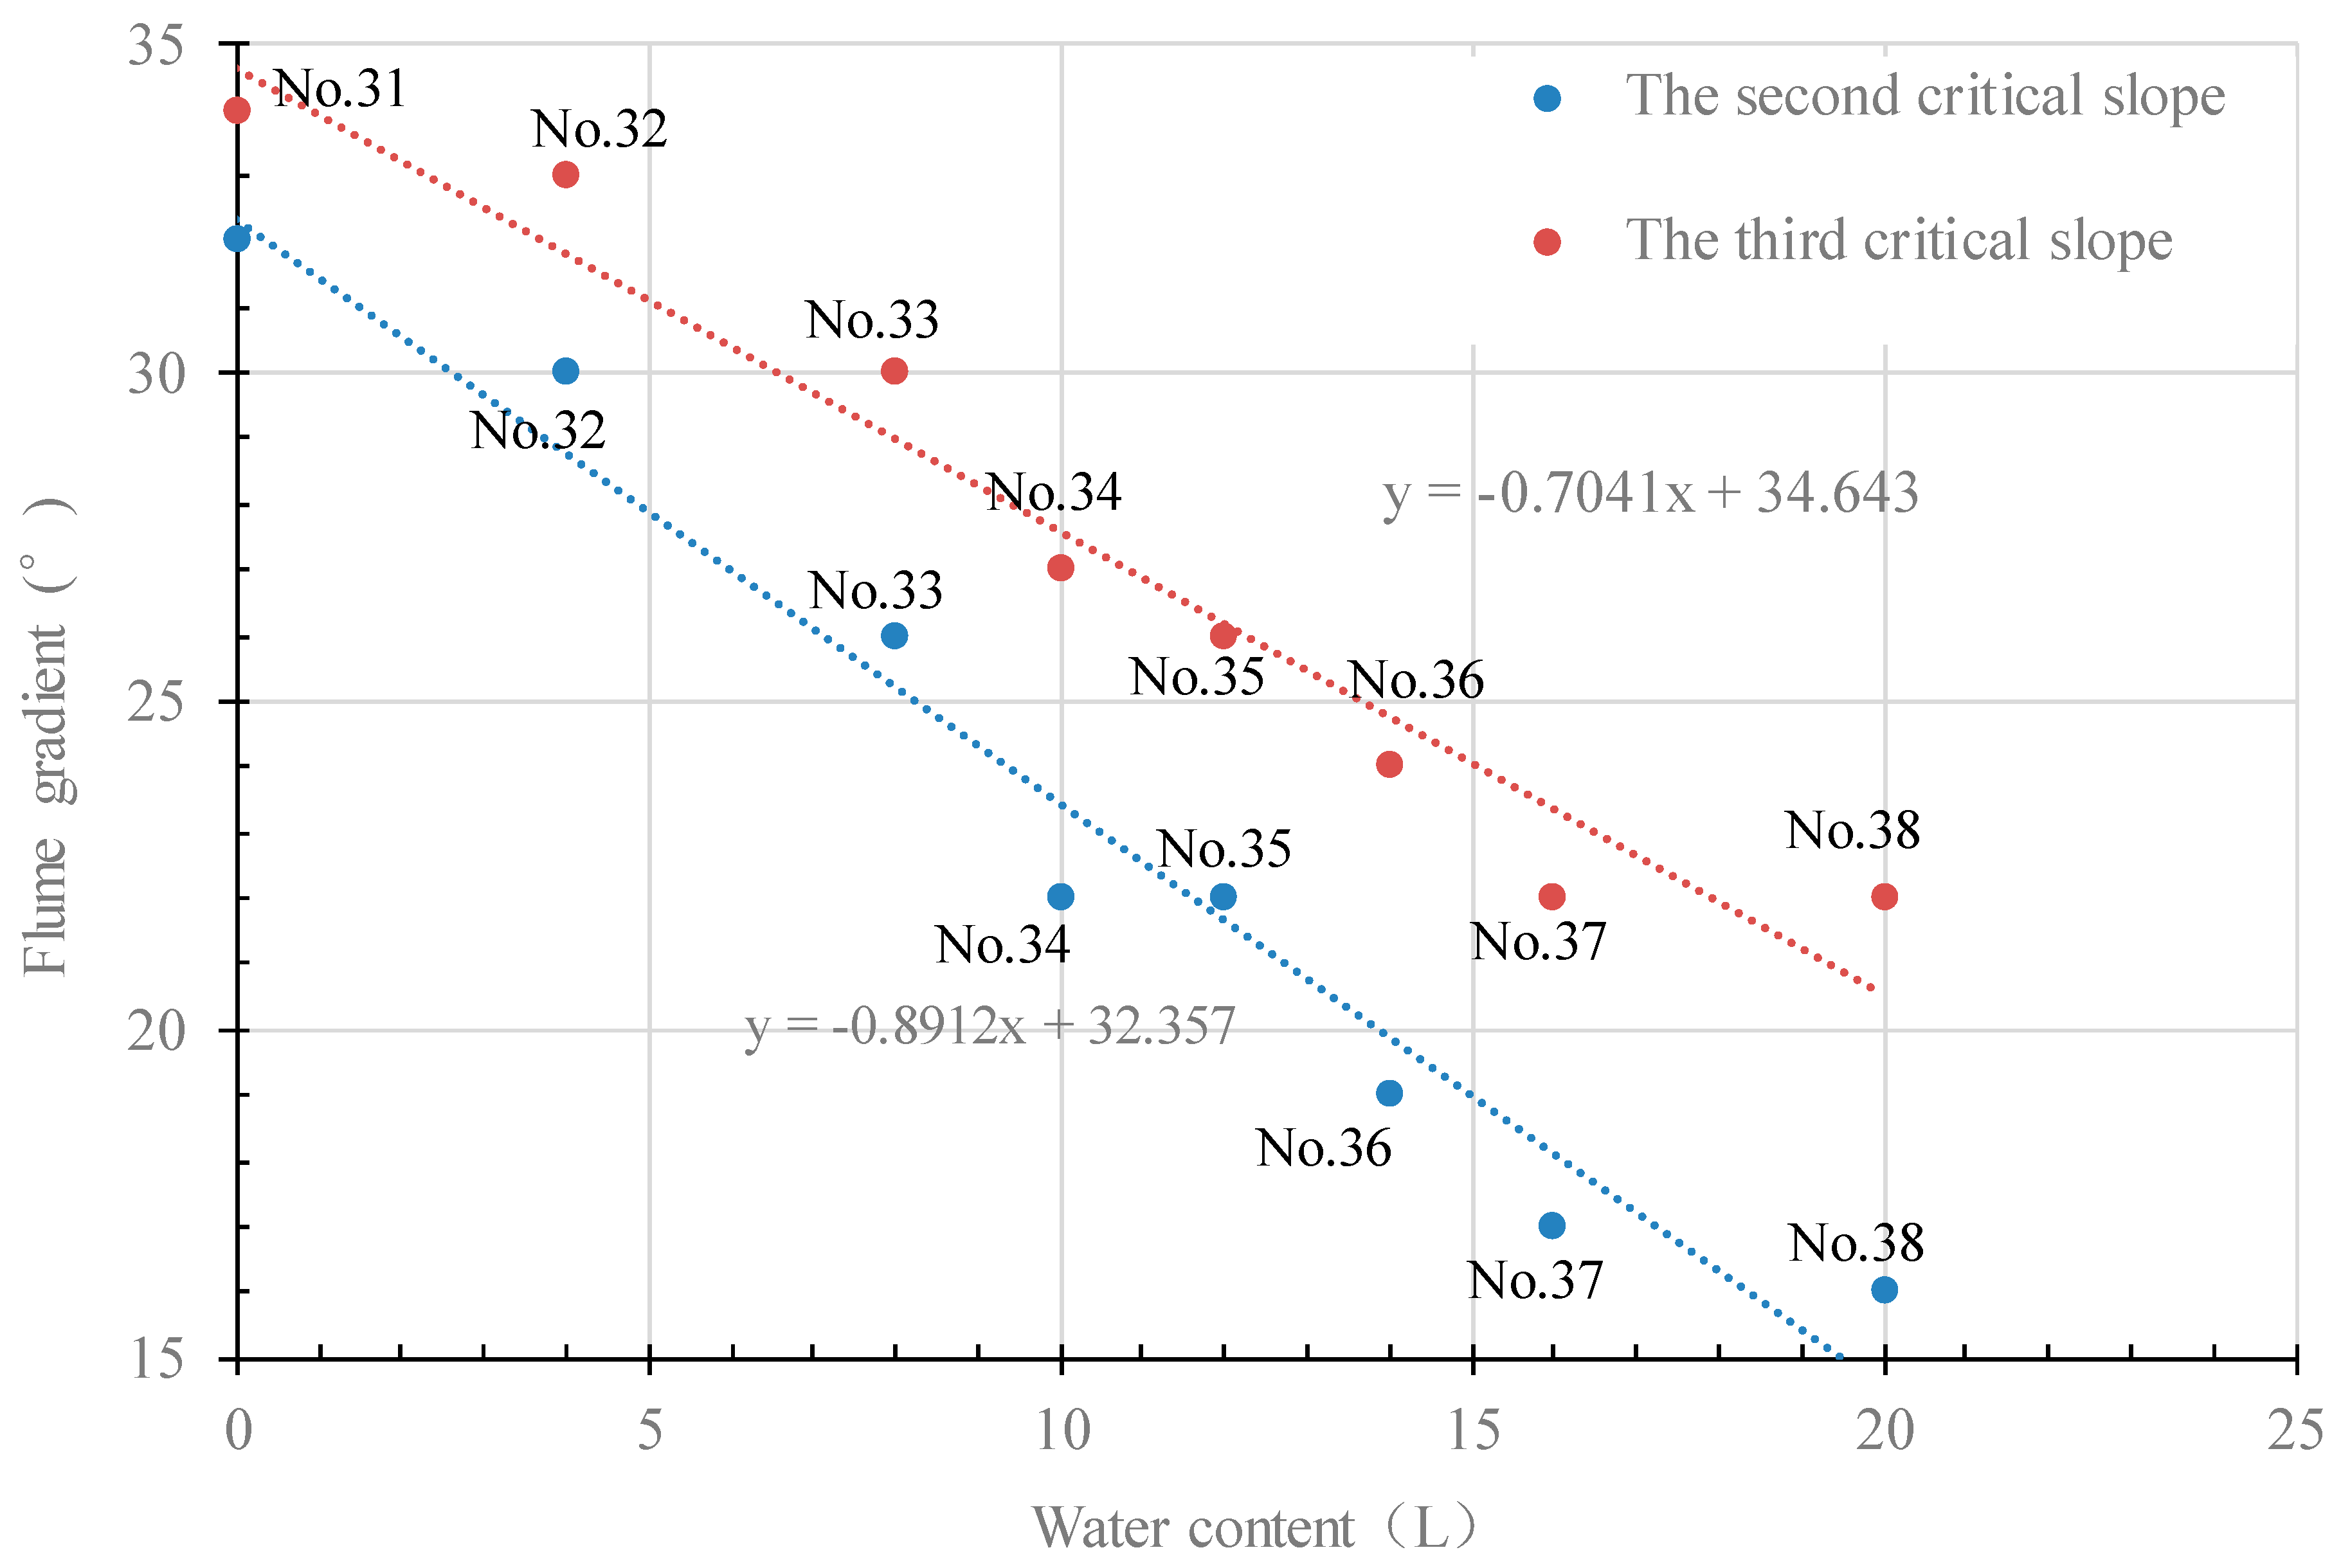
3.3. Analysis of the Critical Conditions for Debris Flow Initiation

Through 46 sets of model experiments, the critical conditions of geotechnical and hydraulic debris flow initiation were explored. In this section, we further discuss the initiation mechanism of geotechnical and hydraulic debris flows.
(1) The initiation mechanism of hydraulic debris flows
Hydraulic debris flows usually form in relatively steep channels. The mine waste involved is always loose, with high porosity and strong permeability [3,27,33]. The hydraulic initiation of a mine waste debris flow is mainly determined by two forces, which can be expressed as follows [6]:
K = T F
where T is the driving force, F is the resistance, and K is the stability factor. Figure 15 shows the stress analysis of the mine waste heaps.
The initiation of a hydraulic debris flow is generally caused by heavy rainfall. Therefore, during rainfall, the driving force of the mine waste mainly comes from aspects F1 and F2. F1 is the component of gravity of the quasi-mudstone fluid along the slope direction:
F 1 = W sin α
where W is the weight of the mine waste heaps and α is the slope angle. F2 is the water drag force, which is generated by surface runoff:
F 2 = γ J R
where γ is the flow bulk density, J is the hydraulic gradient, and R is the hydraulic radius. In addition, if the intensity of the rainfall is high, the raindrops will also form a splash force F3 on the slag particles:
F 3 = i = 1 n m i u i Δ t sin α   ( i = 1 ,   2 ,   3 ,   ,   n )
where mi is the mass of the raindrops and ui is the velocity of the raindrops.
T is the frictional resistance of the mine waste, which can be expressed as:
T = W cos α tan φ + C
where ψ is the internal friction angle, α is the slope gradient, and C is the cohesive force, which can be ignored when the fine particle content is small. Equations (4)–(8) can be combined to obtain:
K = W cos α tan ϕ + C W sin α + γ R J + i = 1 n m i u i Δ t sin α
By combining Equations (8) and (9), we find that F1 increases and T decreases as the flume gradient (such as in tests 1–5) and the initial water content (such as in tests 6–10) increase. In addition, F2 increases as the inflow discharge increases (such as in tests 16–22), which reduces the stability factor K and initiates a debris flow. When artificial rainfall and runoff both supply water (such as in tests 11–15), the infiltration of the water increases and the water content of the mine waste rapidly increases. Thus, debris flows initiate easily. Figure 12 shows that the critical water content and the clay particle content have a parabolic relationship. When S < 30%, as the clay particle content gradually increases, the water holding capacity of the mine waste is significantly improved. As a result, the critical water quantity required for initiation gradually decreases and reaches its minimum value at S = 30%. However, when S > 30%, as the fine particle content gradually increases the cohesion of the mine waste can no longer be ignored and the frictional resistance T gradually increases. Thus, the critical water quantity required for initiation gradually increases.
(2) The initiation mechanism of geotechnical debris flows
Geotechnical debris flows often occur on high, steep slopes, so the water required for initiation mainly comes from precipitation [1,5,6]. Based on the results of the model experiments conducted in this study, the initiation of geotechnical debris flows can be divided into the following four categories, as shown in Figure 16.
As shown in Figure 16a, when there is no rainfall, the water content of the mine waste is the natural water content, and the mine waste heaps remain stable. If the mine waste contains a certain amount of clay particles, its cohesion C cannot be ignored at this time:
F = ρ m g H sin α
F c = ρ m g H cos α t g φ + C
where ρm is the density of the mine waste, α is the slope gradient, F is the driving force, and FC is the resistance. If F < Fc, then:
t g α < t g φ + C / ( ρ m g H cos α )
The cohesion C can be ignored when the fine particle content is small, i.e., if the slope of the slag accumulation body is smaller than the static friction angle of the slag pile, it is stable.
As shown in Figure 16b, when rainfall occurs, the water content of the mine waste heap continues to increase, but it remains unsaturated. In addition, the strength of the mine waste above the infiltration line gradually weakens, but it remains in a stable state. Therefore, when Fc > F, α < ϕ
As shown in Figure 16c, mine waste heaps come close to or reach saturation as rainfall continues. At this point, the mine waste above the saturation line is in the limit equilibrium state, and a slight vibration or other external force can initiate the mine waste. In this case,
d F / d h = d F c / d h ;   d F / d ( H h ) < d F c / d ( H h ) ,
ρ m g h sin α ρ m g h cos α t g φ 2 + C
Therefore, the mine waste above the saturation line must satisfy the following formula:
t g α tg φ 2 + C / ρ m g h cos α
The slope gradient in this critical state is the second critical slope, at which point some of the particles at the front of the heap start to initiate.
As shown in Figure 16d, with continuous rainfall, the infiltration line and the saturation line of the mine waste continue to move downward and the overall saturation continues to increase. At this point, a large amount of mine waste in the upper part of the heap has reached saturation or has become supersaturated. The static friction angle φ3 corresponding to saturated or supersaturated mine waste is further reduced, and:
t g α tg φ 3 + C / ρ m g h cos α
The slope gradient of this critical state is the third critical slope, at which time a large amount of mine waste in the heap starts to initiate.
The above analysis explains why the critical slope required for mine waste initiation gradually decreases with increasing water content in tests 31–38. In addition, as the clay particle content gradually increases, the water holding capacity of the mine waste is significantly improved, and the critical slope required for mine waste initiation gradually decreases. When S is 20%, the third critical slope reaches its minimum value. However, when S > 20%, the critical slope required for mine waste initiation gradually increases since the cohesion of the mine waste can no longer be ignored.

4. Conclusions

The mine waste debris flows in the Xiaoqinling gold mining area generally have two initiation modes: geotechnical debris flow and hydraulic debris flow. In this study, the critical conditions of the initiation of mine waste were explored through 46 experimental tests. The mechanisms and characteristics of mine waste initiation were also analyzed. The conclusions drawn from the results of these tests are as follows.
(1) The initiation of a hydraulic debris flow is significantly influenced by the slope gradient, the initial water content of the mine waste, the inflow discharge, the water supply modes, and the clay particle content of the mine waste. The larger the slope gradient, the more favorable it is for the initiation of a debris flow. Mine waste with a certain initial water content is easier to initiate than dry mine waste. As the inflow discharge gradually increases, the time required for debris flow initiation decreases. For a certain amount of mine waste, there is an optimum inflow discharge (1.92 L/s in tests 16–22). Under this flow condition, the minimum total water quantity can initiate the largest amount of mine waste. However, the influence of the water supply modes on the critical water quantity required for debris flow initiation is more complicated. The experiments revealed that when the slope is < 20°, the combined water supply mode of rainfall and upstream inflow is more conducive to initiating mine waste. When the slope is > 20°, the water supply mode of upstream inflow is more conducive to the initiation of mine waste debris flows.
(2) The critical water quantity of hydraulic debris flow initiation and the fine particle content of the mine waste have a parabolic relationship. As can be seen in Figure 11, the critical water quantity initially decreases and then increases with increasing fine particle content. In addition, there is a minimum critical water quantity when the fine particle content of the mine waste S is 30%. When S < 30%, as the fine particle content gradually increases, the critical water quantity required for debris flow initiation gradually decreases. However, when S > 30%, the critical water quantity required for debris flow initiation gradually increases as the fine particle content increases.
(3) Geotechnical debris flows are mainly affected by the slope gradient, water content, and fine particle content. As the water content gradually increases, the critical slope required for debris flow initiation decreases. The critical slope of mine waste initiation and the clay particle content generally have a parabolic relationship, that is, the critical slope of mine waste initiation initially decreases and then increases with increasing clay particle content. In addition, the second critical slope (θ2) and the third critical slope (θ3) both have minimum values, but their corresponding fine particle contents are different. When S = 30%, the second critical slope has a minimum value of 20°, while the third critical slope has a minimum value of 30° when S = 20%.
(4) The gully gradient, water content and particle size distribution are the main factors affecting the initiation of mine waste debris flow. Therefore, if one of the factors does not meet the initiation condition, the debris flow will not be easy to initiate. In practice, we can reduce the slope of mine waste heaps, restore vegetation, separate mine waste and water, and control the content of clay particles in mine waste to suppress the initiation of debris flow.

Author Contributions

Conceptualization, Y.C.; methodology, Y.C.; validation, Y.N.; formal analysis, X.Z.; investigation, Y.C.; writing—original draft preparation, X.Z. and B.L.; writing—review and editing, Y.C. and X.Z. All authors have read and agreed to the published version of the manuscript.

Funding

This research was funded by the National Natural Science Foundation of China (Grant No. 41790441, 41877249 and 41402254), the Department of Science and Technology of Shaanxi Province (Grant No. 2019ZDLSF07-0701), andthe Fundamental Research Foundation of the Central Universities (300102269211).

Conflicts of Interest

The authors declare no conflict of interest.

References

  1. Iverson, R.M. The physics of debris flows. Rev. Geophys. 1997, 35, 245–296. [Google Scholar] [CrossRef] [Green Version]
  2. Hungr, O.; Leroueil, S.; Picarelli, L. The Varnes classification of landslide types, an update. Landslides 2014, 11, 167–194. [Google Scholar] [CrossRef]
  3. Cui, Y.F.; Zhou, X.J.; Guo, C.X. Experimental study on the moving characteristics of fine grains in wide grading unconsolidated soil under heavy rainfall. J. Mt. Sci. 2017, 14, 417–431. [Google Scholar] [CrossRef]
  4. Kang, S.H.; Lee, S.R. Debris flow susceptibility assessment based on an empirical approach in the central region of South Korea. Geomorphology 2018, 308, 1–12. [Google Scholar] [CrossRef]
  5. Takahashi, T. Debris Flow. Annu. Rev. Fluid Mech. 1981, 13, 57–77. [Google Scholar] [CrossRef]
  6. Cui, P. Experimental study on initiation conditions and mechanism of debris flow. Chin. Sci. Bull. 1991, 21, 1650–1652. (In Chinese) [Google Scholar]
  7. Salvatici, T.; Morelli, S.; Pazzi, V.; Frodella, W.; Fanti, R. Debris flow hazard assessment by means of numerical simulations: Implications for the Rotolon creek valley (Northern Italy). J. Mt. Sci. 2017, 14, 636–648. [Google Scholar] [CrossRef]
  8. Iverson, R.M.; Reid, M.E.; Lahusen, R.G. Debris flow mobilization from landslide. Annu. Rev. Earth Planet. Sci. 1997, 125, 85–138. [Google Scholar] [CrossRef]
  9. O’Connor, J.E.; Hardison, J.H.; Costa, J.E. Debris flows from moraine-dammed lakes in the Three Sisters and Mt. Jefferson Wilderness Areas, Oregon. In US Geological Survey Water Supply Paper; 1997; in press. [Google Scholar]
  10. Carlo, G. The initiation of debris flow at high slopes: Experimental results. J. Hydraul. Res. 2010, 38, 83–88. [Google Scholar]
  11. Zhu, X.H.; Peng, J.B.; Jiang, C.; Guo, W.L. A preliminary study of the failure modes and process of landslide dams due to upstream flow. Water 2019, 11, 1115. [Google Scholar] [CrossRef] [Green Version]
  12. Yan, Y.; Cui, Y.F.; Guo, J.; Hu, S.; Wang, Z.; Yin, S.Y. Landslide reconstruction using seismic signal characteristics and numerical simulations: Case study of the 2017 “6.24” Xinmo landslide. Eng. Geol. 2020, 270, 105582. [Google Scholar] [CrossRef]
  13. Griffiths, P.G.; Webb, R.H.; Melis, T.S. Initiation of debris flows in tributaries of the Colorado River in Grand Canyon, Arizona. In Debris Flow Hazards Mitigation; Chen, C.L., Ed.; American Society of Civil Engineers: New York, NY, USA, 1997; pp. 12–20. [Google Scholar]
  14. Coe, J.A.; Godt, J.W.; Parise, M.; Moscariello, A. Estimating debris-flow probability using fan stratigraphy, historic records, and drainage-basin morphology, Interstate 70 highway corridor, central Colorado, USA. In Debris Flow Hazard Mitigation: Mechanics, Prediction, and Assessment, Davos; Rickenmann, D., Chen, C.L., Eds.; Millpress: Rotterdam, The Netherlands, 2003; Volume 2, pp. 1085–1096. [Google Scholar]
  15. Zhu, X.H.; Cui, Y.F.; Peng, J.B.; Jiang, C.; Guo, W.L. Erosion and transport mechanisms of mine waste along gullies. J. Mt. Sci. 2019, 16, 402–413. [Google Scholar] [CrossRef]
  16. Takahashi, T. Initiation and flow of various types of debris flow. In Debris-Flow Hazards Mitigation: Mechanics, Prediction, and Assessment: Proceedings of the Second International Conference on Debris-Flow Hazards Mitigation/Taipei/Taiwan/16-18 Aug; Wieczored, G.F., Naeser, N.D., Eds.; Balkema: Rotterdam, The Netherlands, 2000; pp. 15–25. [Google Scholar]
  17. Anderson, S.A.; Sitar, N. Analysis of rainfall-induced debris flows. J. Geotech. Eng. 1995, 121, 544–552. [Google Scholar] [CrossRef]
  18. Sidle, R.C.; Swanston, D.N. Analysis of a small debris slide in Coastal Alaska. Can. Geotech. J. 2011, 19, 167–174. [Google Scholar] [CrossRef]
  19. Campbell, R.H. Soil slips, debris flows, and rainstorms in the Santa Monica Mountains and vicinity, Southern California. US Geol. Surv. Prof. Pap. 1975, 851, 51. [Google Scholar]
  20. Montgomery, D.R.; Dietrich, W.E. A physically based model for the topographic control on shallow landsliding. Water Resour. Res. 1994, 30, 1153–1171. [Google Scholar] [CrossRef]
  21. Pack, R.T.; Tarboton, D.G.; Goodwin, C.N. Report Number 4114-0. Terrain Stability Mapping with SINMAP, Technical Description and Users Guide for Version 1.00; Terratech Consulting Ltd.: Salmon Arm, BC, Canada, 1998; p. 68. [Google Scholar]
  22. Ellen, S.D. Description and mechanics of soil slip/debris flows in the storm. USGS Prof. Pap. 1998, 1434, 63–113. [Google Scholar]
  23. Zhu, X.H.; Peng, J.B.; Liu, B.X.; Jiang, C.; Guo, J. Influence of textural properties on the failure mode and process of landslide dams. Eng. Geol. 2020, 271, 105613. [Google Scholar] [CrossRef]
  24. Frattini, P.; Crosta, G.; Sosio, R. Approaches for defining thresholds and return periods for rainfall-triggered shallow landslides, Hydrological. Processes 2009, 23, 1444–1460. [Google Scholar]
  25. Iverson, R.M.; Denlinger, R.P.; LaHusen, R.G.; Logan, M. Two-phase debris-flow across 3-D terrain: Model predictions and experimental tests. In Debris-Flow Hazards Mitigation: Mechanics, Prediction, and Assessment; Wieczorek, G.F., Naeser, N.D., Eds.; A.A. Balkema: Brookfield, VT, USA, 2000; Volume 2, pp. 521–529. [Google Scholar]
  26. Chen, N.S.; Zhou, W.; Yang, C.L. The processes and mechanism of failure and debris flow initiation for gravel soil with different clay content. Geomorphology 2010, 121, 222–230. [Google Scholar] [CrossRef]
  27. Zhuang, J.Q.; Cui, P.; Peng, J.B. Initiation process of debris flow on different slopes due to surface flow and trigger-specific strategies for mitigating post-earthquake in old Beichuan County, China. Environ. Earth Sci. 2013, 68, 1391–1403. [Google Scholar] [CrossRef]
  28. Wang, Y.; Cui, P.; Wang, Z.Y. Threshold criterion for debris flow initiation in seasonal gullies. Int. J. Sediment Res. 2017, 32, 231–239. [Google Scholar] [CrossRef]
  29. Rickenmann, D.; Laigle, D.; McArdell, B.; Hübl, J. Comparison of 2D debris-flow simulation models with field events. Comput. Geosci. 2006, 10, 241–264. [Google Scholar] [CrossRef] [Green Version]
  30. Ouyang, C.J.; He, S.M.; Tang, C. Numerical analysis of dynamics of debris flow over erodible beds in Wenchuan earthquake-induced area. Eng. Geol. 2015, 194, 62–72. [Google Scholar] [CrossRef]
  31. Li, Z.S. A study on the mud rock flow disaster in 1994 in the gold mine area of Tongguan. Shaanxi J. Catastrophology 1995, 10, 51–56. (In Chinese) [Google Scholar]
  32. Xu, Y.N.; Cao, Y.B.; Zhang, J.H.; Chen, H.Q.; Yang, M.; Wang, X.W. Research on starting of mine debris flow based on artificial simulation experiment in Xiaoqinling Gold Ore area. Chin. J. Rock Mech. Eng. 2009, 28, 1389–1395. (In Chinese) [Google Scholar]
  33. Liu, X.; Yang, J. Influence of size disparity on small-strain shear modulus of sand-fines mixtures. Soil Dyn. Earthq. Eng. 2018, 115, 217–224. [Google Scholar] [CrossRef]
  34. Wang, G.; Sassa, K. Pore-pressure generation and movement of rainfall-induced landslides: Effects of grain size and fine-particle content. Eng. Geol. 2003, 69, 109–125. [Google Scholar] [CrossRef]
Figure 1. Diagram of the experimental setup.
Water 12 01536 g001
Figure 2. Overview of Xiaotong Gully. (a) The location of Xiaotong Gully; (b) the gold mining site in upstream of Xiaotong Gully; (c) No. 20 Mine waste heap in Xiaotong Gully; (d) an overview of mine waste heaps’ distribution in Xiaotong Gully.
Water 12 01536 g002
Figure 3. Profile of the mine waste heaps in Xiaotong Gully.
Water 12 01536 g003
Figure 4. Grading of the in-situ materials and the materials used in the flume tests in No. 1–22 and 31–38.
Water 12 01536 g004
Figure 5. Grading of the materials used in the flume tests in No. 23–30 and 39–46.
Water 12 01536 g005
Figure 6. Partial initiation of mine waste caused by surface flow erosion. (a) The water tank starts to supply water when the model test starts; (b) the mine waste was initiated partially by surface flow erosion; (cf) the lateral erosion continued to expand and the mine waste was transported to form a debris flow.
Water 12 01536 g006
Figure 7. Hydraulic debris flow initiation caused by infiltration. (a) The amount of water is small and all infiltrate into the mine waste when the model test starts; (b) the mine waste is saturated and the debris flow initiated; (c) the subsequent surface water transported the mine waste to downstream.
Water 12 01536 g007
Figure 8. The initiation process of a geotechnical debris flow (test No. 39). (a) The mine waste with the configured water content is piled in the experimental flume; (b) the slope of the flume is increased gradually, and the slurry part of the source initiated when it reaches θ2.
Water 12 01536 g008
Figure 9. Critical water quantity for dry mine waste and mine waste with an initial water content of 5% for different flume slopes.
Water 12 01536 g009
Figure 10. Critical water quantity for mine waste initiation in experimental tests 1–5, 6–10, and 11–15.
Water 12 01536 g010
Figure 11. Relationship between inflow discharge, critical water quantity, and the time required for initiation.
Water 12 01536 g011
Figure 12. Relationship between the clay particle content of mine waste and the critical water quantity.
Water 12 01536 g012
Figure 13. Relationship between the critical slope and the water content.
Water 12 01536 g013
Figure 14. Relationship between the clay particle content and the critical slope.
Water 12 01536 g014
Figure 15. Stress analysis of the mine waste heaps by Cui et al. [6] (modified).
Water 12 01536 g015
Figure 16. Initiation mode diagrams of geotechnical debris flows by Cui et al. [6] (modified).(a) There is no rainfall; (b) There is a rainfall, but the mine waste heaps remain unstaturated; (c) The mine waste heaps come close to saturation as rainfall continues; (d)The mine waste heaps come to supersaturated as rainfall continues.
Water 12 01536 g016
Table 1. Experimental conditions and results of the initiation of the hydraulic debris flows.
NoDry DensityInitial Water ContentFlume GradientClay Particles ContentInflow DischargeTotal Volume of the Upstream RunoffTotal Volume of the Artificial Rainfall
ρS (g/cm3)w (%)θ (°)S (%)Q0 (L/s)Vi (L) Vr (L)
11.9405201.915.10
21.94010201.910.530
31.94015201.98.40
41.94017201.96.970
51.94020201.94.70
61.94510201.99.720
71.94515201.96.80
81.94517201.96.480
91.94520201.94.050
101.94525201.93.240
111.94010201.98.420.68
121.94015201.95.80.69
131.94017201.94.840.7
141.94020201.94.050.82
151.94025201.93.041.28
161.94017200.08stable0
171.94017200.511.70
181.94017201.380
191.94017201.87.20
201.940172027.60
211.94017202.79.10
221.94017204.211.90
231.7201750.615.50
241.85017100.6130
251.85017150.6100
261.94017200.69.20
271.94017250.67.10
282.00017300.66.80
292.08017350.68.90
302.12017400.69.60
Table 2. Experimental conditions and results of the geotechnical debris flow initiation experiments.
NoMine Waste Dry DensityClay Particles ContentWater Content Critical Slope
ρS (g/cm3)S (%)w (%)θ2 (°)θ3 (°)
311.942003234
321.942043033
331.942082630
341.9420102227
351.9420122226
361.9420141924
371.9420161722
381.9420201622
391.72533038
401.851062632
411.91592335
421.9420122430
431.9725152131
44230182030
452.0835212040
462.1240242537

