Novel Ensembles of Deep Learning Neural Network and Statistical Learning for Flash-Flood Susceptibility Mapping
Abstract
:1. Introduction
2. Background of the Algorithms Used
2.1. Deep Neural Network
2.2. Analytical Hierarchy Process
2.3. Frequency Ratio
3. Study Area and Data
3.1. Description of the Study Area
3.2. Data Used
3.2.1. Flash-Flood Inventory
3.2.2. Flash-Flood Predictors
4. Proposed Ensemble Approach Based on DNN, AHP, and FR for Flash-Flood Susceptibility Mapping
4.1. Flood Database
4.2. Data Diagnosis and Checking
4.3. Model Setup and Training
4.4. Quality Evaluation
4.5. Compiling Flash-Flood Susceptibility Map
5. Results and Analysis
5.1. Predictive Capability of Flash-Flood Predictors
5.2. AHP and FR Weights
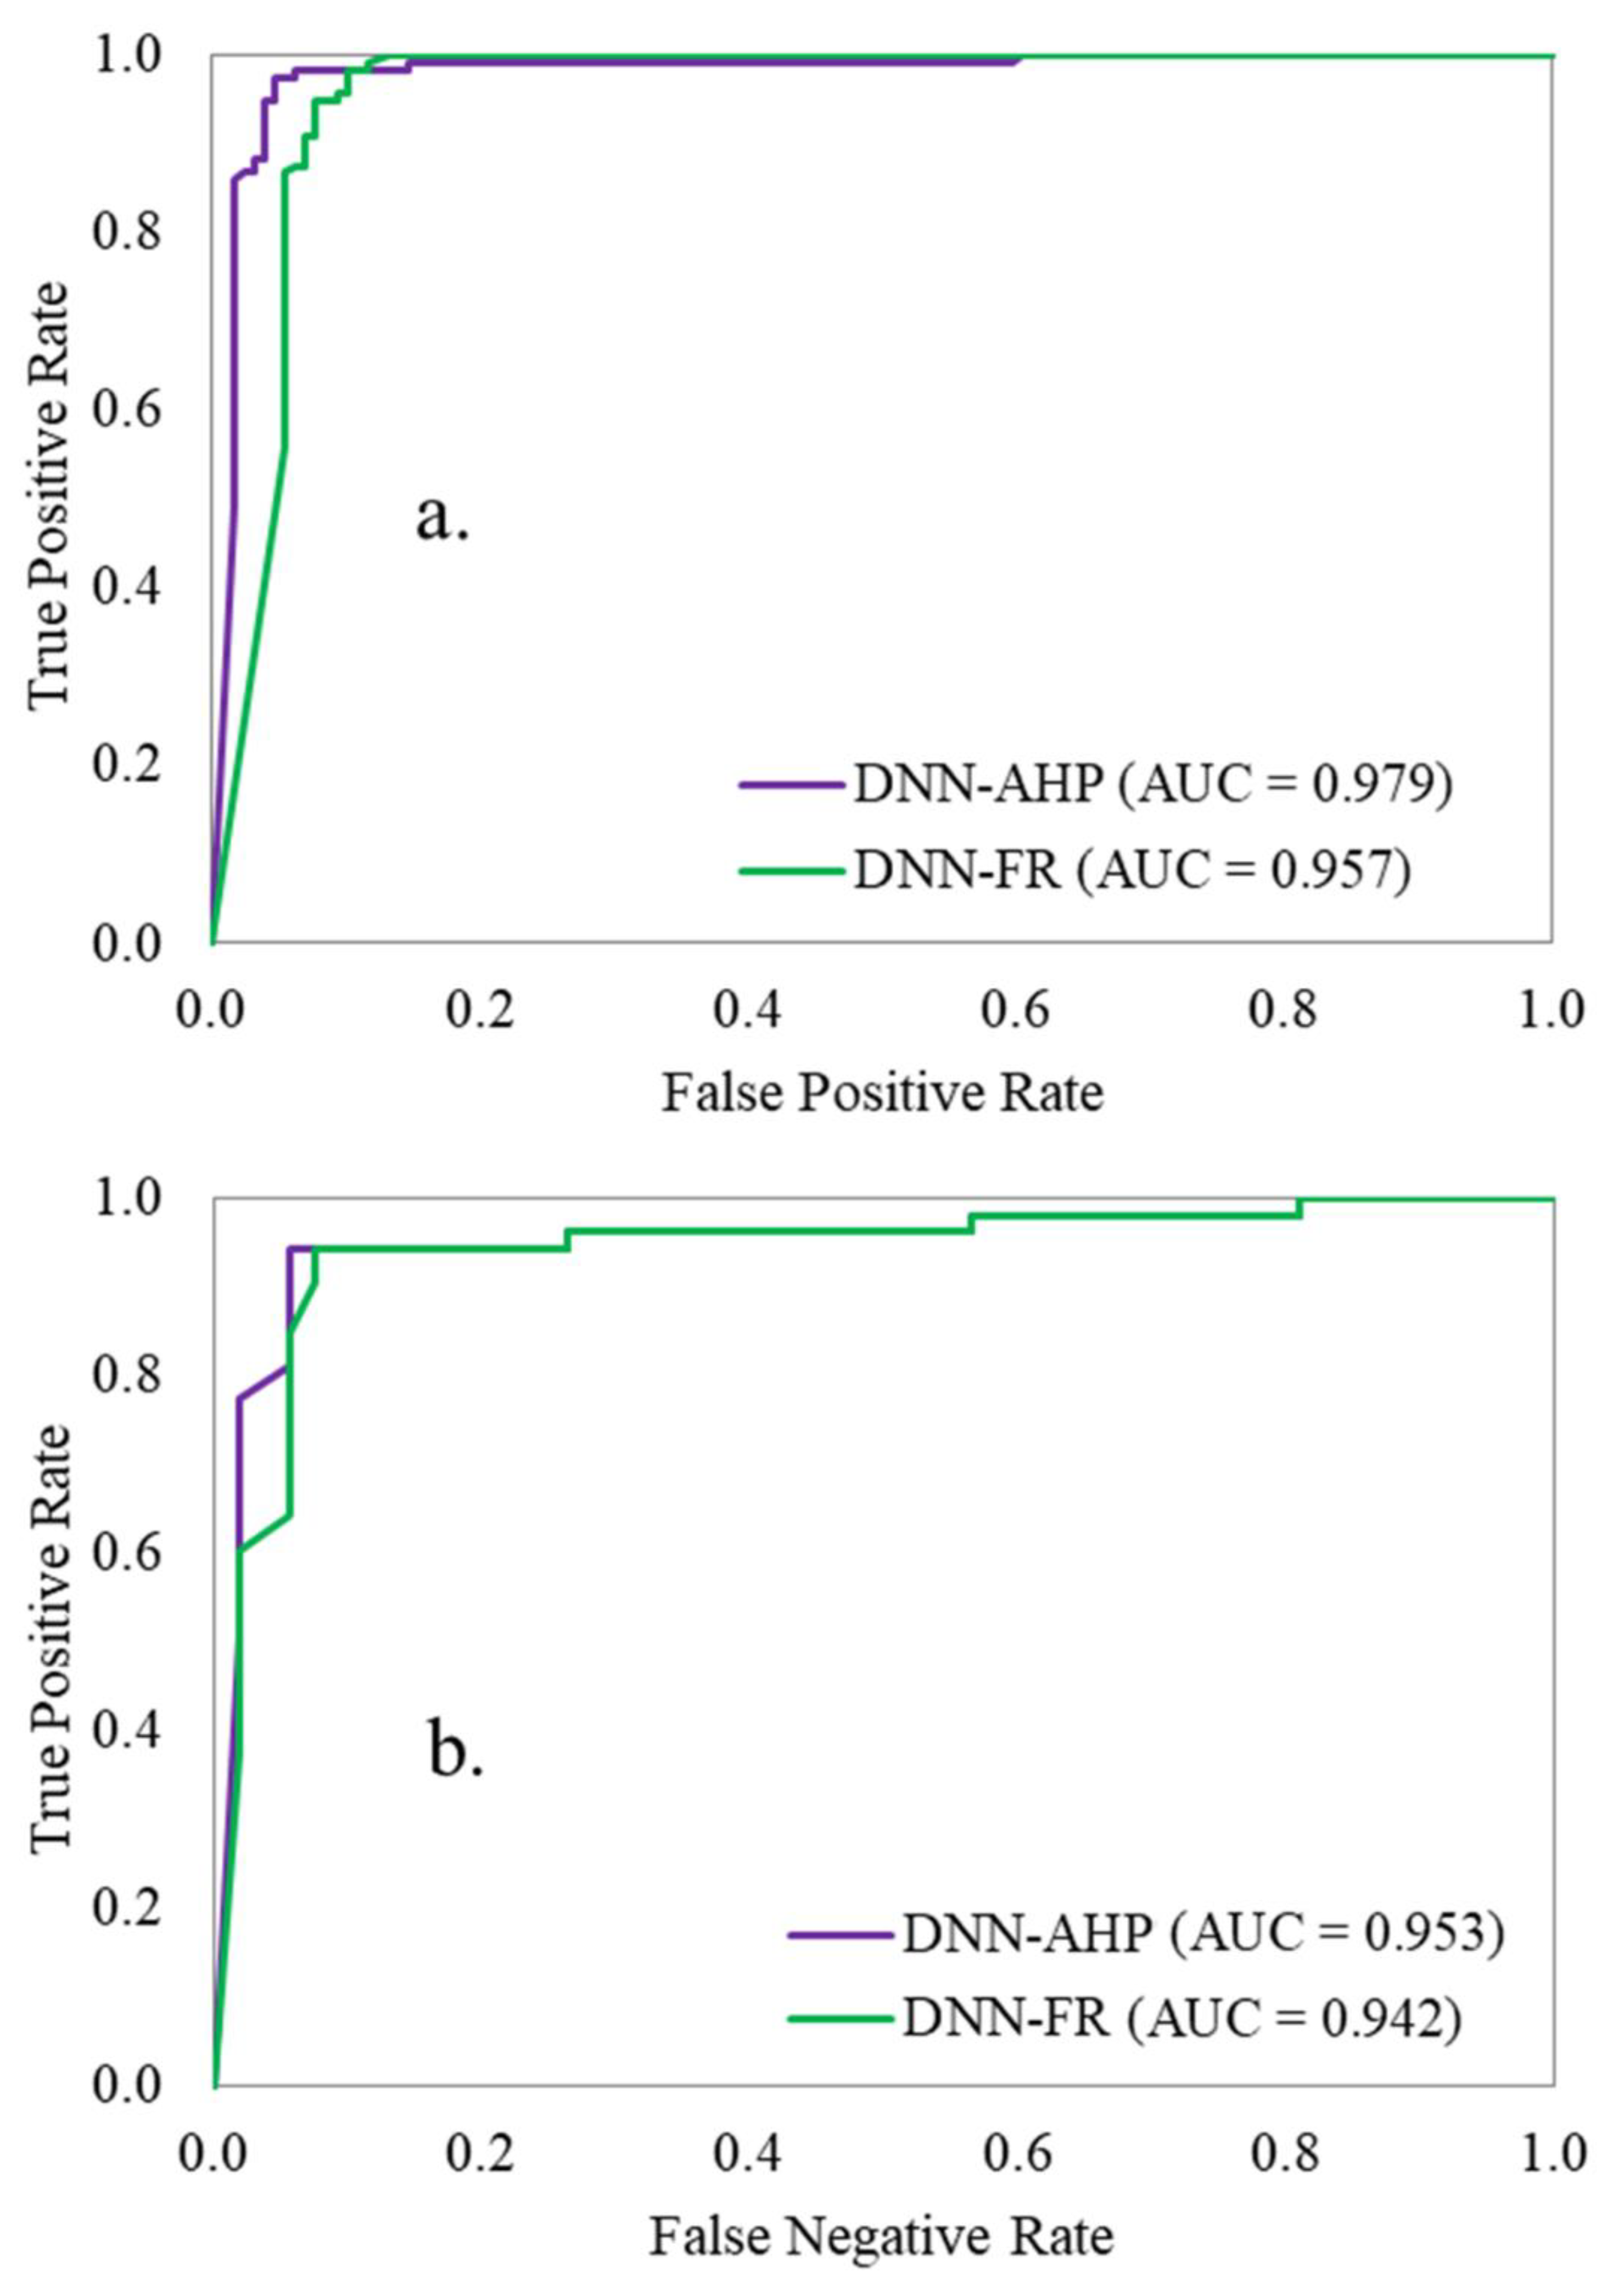
5.3. Flash-Flood Modelling with DNN-AHP and DNN-FR
6. Discussions
7. Conclusions
Author Contributions
Funding
Conflicts of Interest
References
- Khosravi, K.; Pourghasemi, H.R.; Chapi, K.; Bahri, M. Flash flood susceptibility analysis and its mapping using different bivariate models in Iran: A comparison between Shannon’s entropy, statistical index, and weighting factor models. Environ. Monit. Assess. 2016, 188, 656. [Google Scholar] [CrossRef]
- Costache, R.; Pravalie, R.; Mitof, I.; Popescu, C. Flood vulnerability assessment in the low sector of Saratel Catchment. Case study: Joseni Village. Carpathian J. Earth Environ. Sci. 2015, 10, 161–169. [Google Scholar]
- Gashaw, W.; Legesse, D. Flood hazard and risk assessment using GIS and remote sensing in Fogera Woreda, Northwest Ethiopia. In Nile River Basin; Springer: Berlin/Heidelberg, Germany, 2011; pp. 179–206. [Google Scholar]
- Khosravi, K.; Pham, B.T.; Chapi, K.; Shirzadi, A.; Shahabi, H.; Revhaug, I.; Prakash, I.; Bui, D.T. A comparative assessment of decision trees algorithms for flash flood susceptibility modeling at Haraz watershed, northern Iran. Sci. Total Environ. 2018, 627, 744–755. [Google Scholar] [CrossRef] [PubMed]
- Sarhadi, A.; Soltani, S.; Modarres, R. Probabilistic flood inundation mapping of ungauged rivers: Linking GIS techniques and frequency analysis. J. Hydrol. 2012, 458, 68–86. [Google Scholar] [CrossRef]
- Cao, C.; Xu, P.; Wang, Y.; Chen, J.; Zheng, L.; Niu, C. Flash flood hazard susceptibility mapping using frequency ratio and statistical index methods in coalmine subsidence areas. Sustainability 2016, 8, 948. [Google Scholar] [CrossRef] [Green Version]
- Casale, R.; Margottini, C. Floods and Landslides: Integrated Risk Assessment: Integrated Risk Assessment; with 30 Tables; Springer Science & Business Media: Berlin, Germany, 1999; ISBN 3-540-64981-6. [Google Scholar]
- Youssef, A.M.; Pradhan, B.; Hassan, A.M. Flash flood risk estimation along the St. Katherine road, southern Sinai, Egypt using GIS based morphometry and satellite imagery. Environ. Earth Sci. 2011, 62, 611–623. [Google Scholar] [CrossRef]
- Bubeck, P.; Botzen, W.J.; Aerts, J.C. A review of risk perceptions and other factors that influence flood mitigation behavior. Risk Anal. Int. J. 2012, 32, 1481–1495. [Google Scholar] [CrossRef] [PubMed] [Green Version]
- Chapi, K.; Singh, V.P.; Shirzadi, A.; Shahabi, H.; Bui, D.T.; Pham, B.T.; Khosravi, K. A novel hybrid artificial intelligence approach for flood susceptibility assessment. Environ. Model. Softw. 2017, 95, 229–245. [Google Scholar] [CrossRef]
- Li, W.; Lin, K.; Zhao, T.; Lan, T.; Chen, X.; Du, H.; Chen, H. Risk assessment and sensitivity analysis of flash floods in ungauged basins using coupled hydrologic and hydrodynamic models. J. Hydrol. 2019, 572, 108–120. [Google Scholar] [CrossRef]
- Smith, G. Flash flood potential: Determining the hydrologic response of FFMP basins to heavy rain by analyzing their physiographic characteristics. In White Pap. Available NWS Colo. Basin River Forecast Cent. Web Site Httpwww Cbrfc Noaa Govpapersffpwpap Pdf; 2003. Available online: http://www.cbrfc.noaa.gov/papers/ffp_wpap.pdf (accessed on 31 October 2019).
- Brewster, J. Development of the Flash Flood Potential Index (FFPI) for Central NY & Northeast PA. 2010, pp. 2–4. Available online: https://documents.pub/document/development-of-the-flash-flood-potential-ffpi-the-flash-flood-potential-index.html (accessed on 3 November 2019).
- Kruzdlo, R.; Ceru, J. Flash Flood Potential Index for WFO Mount Holly/Philadelphia. 2010, pp. 2–4. Available online: http://bgmresearch.eas.cornell.edu/research/ERFFW/posters/kruzdlo_FlashFloodPotentialIndexforMountHollyHSA.pdf (accessed on 5 November 2019).
- Zogg, J.; Deitsch, K. The Flash Flood Potential Index at WFO Des Moines, Iowa; National Weather Service Working Paper; 2013. Available online: http://www.crh.noaa.gov/images (accessed on 8 November 2019).
- Minea, G. Assessment of the flash flood potential of Bâsca River Catchment (Romania) based on physiographic factors. Open Geosci. 2013, 5, 344–353. [Google Scholar] [CrossRef] [Green Version]
- Zaharia, L.; Minea, G.; Ioana-Toroimac, G.; Barbu, R.; Sârbu, I. Estimation of the areas with accelerated surface runoff in the upper Prahova watershed (Romanian Carpathians). In Proceedings of the International Conference on Water, Climate and Environment, Ohrid, Macedonia, 28 May 2012; pp. 1–10. [Google Scholar]
- Zaharia, L.; Costache, R.; Prăvălie, R.; Ioana-Toroimac, G. Mapping flood and flooding potential indices: A methodological approach to identifying areas susceptible to flood and flooding risk. Case study: The Prahova catchment (Romania). Front. Earth Sci. 2017, 11, 229–247. [Google Scholar] [CrossRef]
- Tincu, R.; Lazar, G.; Lazar, I. Modified flash flood potential index in order to estimate areas with predisposition to water accumulation. Open Geosci. 2018, 10, 593–606. [Google Scholar] [CrossRef]
- Romulus, C.; Iulia, F.; Ema, C. Assessment of surface runoff depth changes in Sǎrǎţel River basin, Romania using GIS techniques. Open Geosci. 2014, 6, 363–372. [Google Scholar] [CrossRef]
- Costache, R.; Zaharia, L. Flash-flood potential assessment and mapping by integrating the weights-of-evidence and frequency ratio statistical methods in GIS environment–case study: Bâsca Chiojdului River catchment (Romania). J. Earth Syst. Sci. 2017, 126, 59. [Google Scholar] [CrossRef]
- Tehrany, M.S.; Pradhan, B.; Jebur, M.N. Flood susceptibility mapping using a novel ensemble weights-of-evidence and support vector machine models in GIS. J. Hydrol. 2014, 512, 332–343. [Google Scholar] [CrossRef]
- Hong, H.; Tsangaratos, P.; Ilia, I.; Liu, J.; Zhu, A.-X.; Chen, W. Application of fuzzy weight of evidence and data mining techniques in construction of flood susceptibility map of Poyang County, China. Sci. Total Environ. 2018, 625, 575–588. [Google Scholar] [CrossRef]
- Costache, R. Flood Susceptibility Assessment by Using Bivariate Statistics and Machine Learning Models-A Useful Tool for Flood Risk Management. Water Resour. Manag. 2019, 33, 3239–3256. [Google Scholar] [CrossRef]
- Costache, R. Flash-Flood Potential assessment in the upper and middle sector of Prahova river catchment (Romania). A comparative approach between four hybrid models. Sci. Total Environ. 2019, 659, 1115–1134. [Google Scholar] [CrossRef]
- Costache, R. Flash-flood Potential Index mapping using weights of evidence, decision Trees models and their novel hybrid integration. Stoch. Environ. Res. Risk Assess. 2019, 33, 1375–1402. [Google Scholar] [CrossRef]
- Costache, R.; Bui, D.T. Spatial prediction of flood potential using new ensembles of bivariate statistics and artificial intelligence: A case study at the Putna river catchment of Romania. Sci. Total Environ. 2019, 691, 1098–1118. [Google Scholar] [CrossRef]
- Costache, R.; Hong, H.; Wang, Y. Identification of torrential valleys using GIS and a novel hybrid integration of artificial intelligence, machine learning and bivariate statistics. Catena 2019, 183, 104179. [Google Scholar] [CrossRef]
- Rahman, M.; Ningsheng, C.; Islam, M.M.; Dewan, A.; Iqbal, J.; Washakh, R.M.A.; Shufeng, T. Flood Susceptibility Assessment in Bangladesh Using Machine Learning and Multi-criteria Decision Analysis. Earth Syst. Environ. 2019, 3, 585–601. [Google Scholar] [CrossRef]
- Althuwaynee, O.F.; Pradhan, B.; Park, H.-J.; Lee, J.H. A novel ensemble bivariate statistical evidential belief function with knowledge-based analytical hierarchy process and multivariate statistical logistic regression for landslide susceptibility mapping. Catena 2014, 114, 21–36. [Google Scholar] [CrossRef]
- Dahri, N.; Abida, H. Monte Carlo simulation-aided analytical hierarchy process (AHP) for flood susceptibility mapping in Gabes Basin (southeastern Tunisia). Environ. Earth Sci. 2017, 76, 302. [Google Scholar] [CrossRef]
- Papaioannou, G.; Vasiliades, L.; Loukas, A. Multi-criteria analysis framework for potential flood prone areas mapping. Water Resour. Manag. 2015, 29, 399–418. [Google Scholar] [CrossRef]
- Nielsen, M.A. Neural Networks and Deep Learning; Determination Press: San Francisco, CA, USA, 2015; Volume 25. [Google Scholar]
- Schmidhuber, J. Deep learning in neural networks: An overview. Neural Netw. 2015, 61, 85–117. [Google Scholar] [CrossRef] [Green Version]
- Kim, P. Matlab deep learning. Mach. Learn. Neural Netw. Artif. Intell. 2017, 130. [Google Scholar] [CrossRef]
- Goodfellow, I.; Bengio, Y.; Courville, A. Deep leArning; MIT Press: Cambridge, MA, USA, 2016; ISBN 0-262-33737-1. [Google Scholar]
- Petersen, P.; Voigtlaender, F. Optimal approximation of piecewise smooth functions using deep ReLU neural networks. Neural Netw. 2018, 108, 296–330. [Google Scholar] [CrossRef] [Green Version]
- Yarotsky, D. Error bounds for approximations with deep ReLU networks. Neural Netw. 2017, 94, 103–114. [Google Scholar] [CrossRef] [Green Version]
- Huang, Z.; Li, J.; Weng, C.; Lee, C.-H. Beyond Cross-Entropy: Towards Better Frame-Level Objective Functions for Deep Neural Network Training in Automatic Speech Recognition; ISCA Speech: Singapore, 2014. [Google Scholar]
- Kingma, D.P.; Ba, J. Adam: A method for stochastic optimization. arXiv 2014, arXiv:14126980. [Google Scholar]
- Saaty, T.L. The Analytic Hierarchy Process: Planning, Priority Setting, Resource Allocation; RWS Publications: Pittsburgh, PA, USA, 1980. [Google Scholar]
- Shahabi, H.; Khezri, S.; Ahmad, B.B.; Hashim, M. Landslide susceptibility mapping at central Zab basin, Iran: A comparison between analytical hierarchy process, frequency ratio and logistic regression models. Catena 2014, 115, 55–70. [Google Scholar] [CrossRef]
- Chen, W.; Li, W.; Chai, H.; Hou, E.; Li, X.; Ding, X. GIS-based landslide susceptibility mapping using analytical hierarchy process (AHP) and certainty factor (CF) models for the Baozhong region of Baoji City, China. Environ. Earth Sci. 2016, 75, 63. [Google Scholar] [CrossRef]
- Hung, L.Q.; Van, N.T.H.; Van Son, P.; Khanh, N.H.; Binh, L.T. Landslide susceptibility mapping by combining the analytical hierarchy process and weighted linear combination methods: A case study in the upper Lo River catchment (Vietnam). Landslides 2016, 13, 1285–1301. [Google Scholar] [CrossRef]
- Patriche, C.V.; Pirnau, R.; Grozavu, A.; Rosca, B. A comparative analysis of binary logistic regression and analytical hierarchy process for landslide susceptibility assessment in the Dobrov River Basin, Romania. Pedosphere 2016, 26, 335–350. [Google Scholar] [CrossRef]
- Ghosh, A.; Kar, S.K. Application of analytical hierarchy process (AHP) for flood risk assessment: A case study in Malda district of West Bengal, India. Nat. Hazards 2018, 94, 349–368. [Google Scholar] [CrossRef]
- Razandi, Y.; Pourghasemi, H.R.; Neisani, N.S.; Rahmati, O. Application of analytical hierarchy process, frequency ratio, and certainty factor models for groundwater potential mapping using GIS. Earth Sci. Inform. 2015, 8, 867–883. [Google Scholar] [CrossRef]
- Costache, R.; Tien Bui, D. Identification of areas prone to flash-flood phenomena using multiple-criteria decision-making, bivariate statistics, machine learning and their ensembles. Sci. Total Environ. 2020, 712C, 136492. [Google Scholar] [CrossRef]
- Pradhan, B.; Lee, S. Delineation of landslide hazard areas on Penang Island, Malaysia, by using frequency ratio, logistic regression, and artificial neural network models. Environ. Earth Sci. 2010, 60, 1037–1054. [Google Scholar] [CrossRef]
- Tehrany, M.S.; Pradhan, B.; Mansor, S.; Ahmad, N. Flood susceptibility assessment using GIS-based support vector machine model with different kernel types. Catena 2015, 125, 91–101. [Google Scholar] [CrossRef]
- Ahmed, M.R.; Rahaman, K.R.; Kok, A.; Hassan, Q.K. Remote sensing-based quantification of the impact of flash flooding on the rice production: A case study over Northeastern Bangladesh. Sensors 2017, 17, 2347. [Google Scholar] [CrossRef] [Green Version]
- Zerbini, A.; Fradley, M. Higher Resolution Satellite Imagery of Israel and Palestine: Reassessing the Kyl-Bingaman Amendment. Space Policy 2018, 44, 14–28. [Google Scholar] [CrossRef]
- Seyedzadeh, A.; Panahi, A.; Maroufpoor, E.; Singh, V.P. Development of an analytical method for estimating Manning’s coefficient of roughness for border irrigation. Irrig. Sci. 2019, 37, 523–531. [Google Scholar] [CrossRef]
- Costache, R. Using GIS techniques for assessing lag time and concentration time in small river basins. Case study: Pecineaga river basin, Romania. Geogr. Tech. 2014, 9, 31–38. [Google Scholar]
- Costache, R. Estimating multiannual average runoff depth in the middle and upper sectors of Buzău River Basin. Geogr. Tech. 2014, 9, 21–29. [Google Scholar]
- Costache, R.D. Assessing monthly average runoff depth in Sărățel river basin, Romania. Analele Stiintifice Ale Univ. Alexandru Ioan Cuza Din Iasi-Ser. Geogr. 2014, 60, 97–110. [Google Scholar]
- Corrao, M.V.; Link, T.E.; Heinse, R.; Eitel, J.U. Modeling of terracette-hillslope soil moisture as a function of aspect, slope and vegetation in a semi-arid environment. Earth Surf. Process. Landf. 2017, 42, 1560–1572. [Google Scholar] [CrossRef]
- Vaezi, A.R.; Zarrinabadi, E.; Auerswald, K. Interaction of land use, slope gradient and rain sequence on runoff and soil loss from weakly aggregated semi-arid soils. Soil Tillage Res. 2017, 172, 22–31. [Google Scholar] [CrossRef]
- Costache, R. Assessment of building infrastructure vulnerability to flash-floods in pănătău river basin, romania. Ann. Univ. Oradea Geogr. Ser. 2017, 27, 26–36. [Google Scholar]
- Costache, R.; Prăvălie, R. The use of GIS techniques in the evaluation of the susceptibility of the floods genesis in the hydrographical basin of Bâsca Chiojdului river. Analele Univ. Din Oradea Ser. Geogr. 2012, 22, 284–293. [Google Scholar]
- Monteiro, E.S.; Fonte, C.C.; de Lima, J.L. Analysing the potential of openstreetmap data to improve the accuracy of SRTM 30 DEM on derived basin delineation, slope, and drainage networks. Hydrology 2018, 5, 34. [Google Scholar] [CrossRef] [Green Version]
- Zaharia, L.; Costache, R.; Prăvălie, R.; Minea, G. Assessment and mapping of flood potential in the Slănic catchment in Romania. J. Earth Syst. Sci. 2015, 124, 1311–1324. [Google Scholar] [CrossRef] [Green Version]
- Jenness, J.S. The Effects of Fire on Mexican Spotted Owls in Arizona and New Mexico. Master’s Thesis, Northern Arizona University, San Francisco, AZ, USA, 2000. [Google Scholar]
- De Reu, J.; Bourgeois, J.; Bats, M.; Zwertvaegher, A.; Gelorini, V.; De Smedt, P.; Chu, W.; Antrop, M.; De Maeyer, P.; Finke, P. Application of the topographic position index to heterogeneous landscapes. Geomorphology 2013, 186, 39–49. [Google Scholar] [CrossRef]
- Pei, T.; Qin, C.-Z.; Zhu, A.-X.; Yang, L.; Luo, M.; Li, B.; Zhou, C. Mapping soil organic matter using the topographic wetness index: A comparative study based on different flow-direction algorithms and kriging methods. Ecol. Indic. 2010, 10, 610–619. [Google Scholar] [CrossRef]
- De Risi, R.; Jalayer, F.; De Paola, F.; Giugni, M. Probabilistic delineation of flood-prone areas based on a digital elevation model and the extent of historical flooding: The case of Ouagadougou. Bol. Geol. Min. 2014, 125, 329–340. [Google Scholar]
- Kirkby, M.; Beven, K. A physically based, variable contributing area model of basin hydrology. Hydrol. Sci. J. 1979, 24, 43–69. [Google Scholar]
- Kumar, R.; Anbalagan, R. Landslide susceptibility mapping using analytical hierarchy process (AHP) in Tehri reservoir rim region, Uttarakhand. J. Geol. Soc. India 2016, 87, 271–286. [Google Scholar] [CrossRef]
- Bui, D.T.; Tsangaratos, P.; Ngo, P.-T.T.; Pham, T.D.; Pham, B.T. Flash flood susceptibility modeling using an optimized fuzzy rule based feature selection technique and tree based ensemble methods. Sci. Total Environ. 2019, 668, 1038–1054. [Google Scholar] [CrossRef]
- Chen, W.; Peng, J.; Hong, H.; Shahabi, H.; Pradhan, B.; Liu, J.; Zhu, A.-X.; Pei, X.; Duan, Z. Landslide susceptibility modelling using GIS-based machine learning techniques for Chongren County, Jiangxi Province, China. Sci. Total Environ. 2018, 626, 1121–1135. [Google Scholar] [CrossRef]
- Gioia, A.; Totaro, V.; Bonelli, R.; Esposito, A.A.; Balacco, G.; Iacobellis, V. Flood Susceptibility Evaluation on Ephemeral Streams of Southern Italy: A Case Study of Lama Balice; Springer: Berlin/Heidelberg, Germany, 2018; pp. 334–348. [Google Scholar]
- Samela, C.; Troy, T.J.; Manfreda, S. Geomorphic classifiers for flood-prone areas delineation for data-scarce environments. Adv. Water Resour. 2017, 102, 13–28. [Google Scholar] [CrossRef]
- Costache, R.; Pham, Q.B.; Sharifi, E.; Linh, N.T.T.; Abba, S.; Vojtek, M.; Vojteková, J.; Nhi, P.T.T.; Khoi, D.N. Flash-Flood Susceptibility Assessment Using Multi-Criteria Decision Making and Machine Learning Supported by Remote Sensing and GIS Techniques. Remote Sens. 2020, 12, 106. [Google Scholar] [CrossRef] [Green Version]
- Bui, D.T.; Hoang, N.-D.; Martínez-Álvarez, F.; Ngo, P.-T.T.; Hoa, P.V.; Pham, T.D.; Samui, P.; Costache, R. A novel deep learning neural network approach for predicting flash flood susceptibility: A case study at a high frequency tropical storm area. Sci. Total Environ. 2020, 701, 134413. [Google Scholar]
- Das, S. Geospatial mapping of flood susceptibility and hydro-geomorphic response to the floods in Ulhas basin, India. Remote Sens. Appl. Soc. Environ. 2019, 14, 60–74. [Google Scholar] [CrossRef]


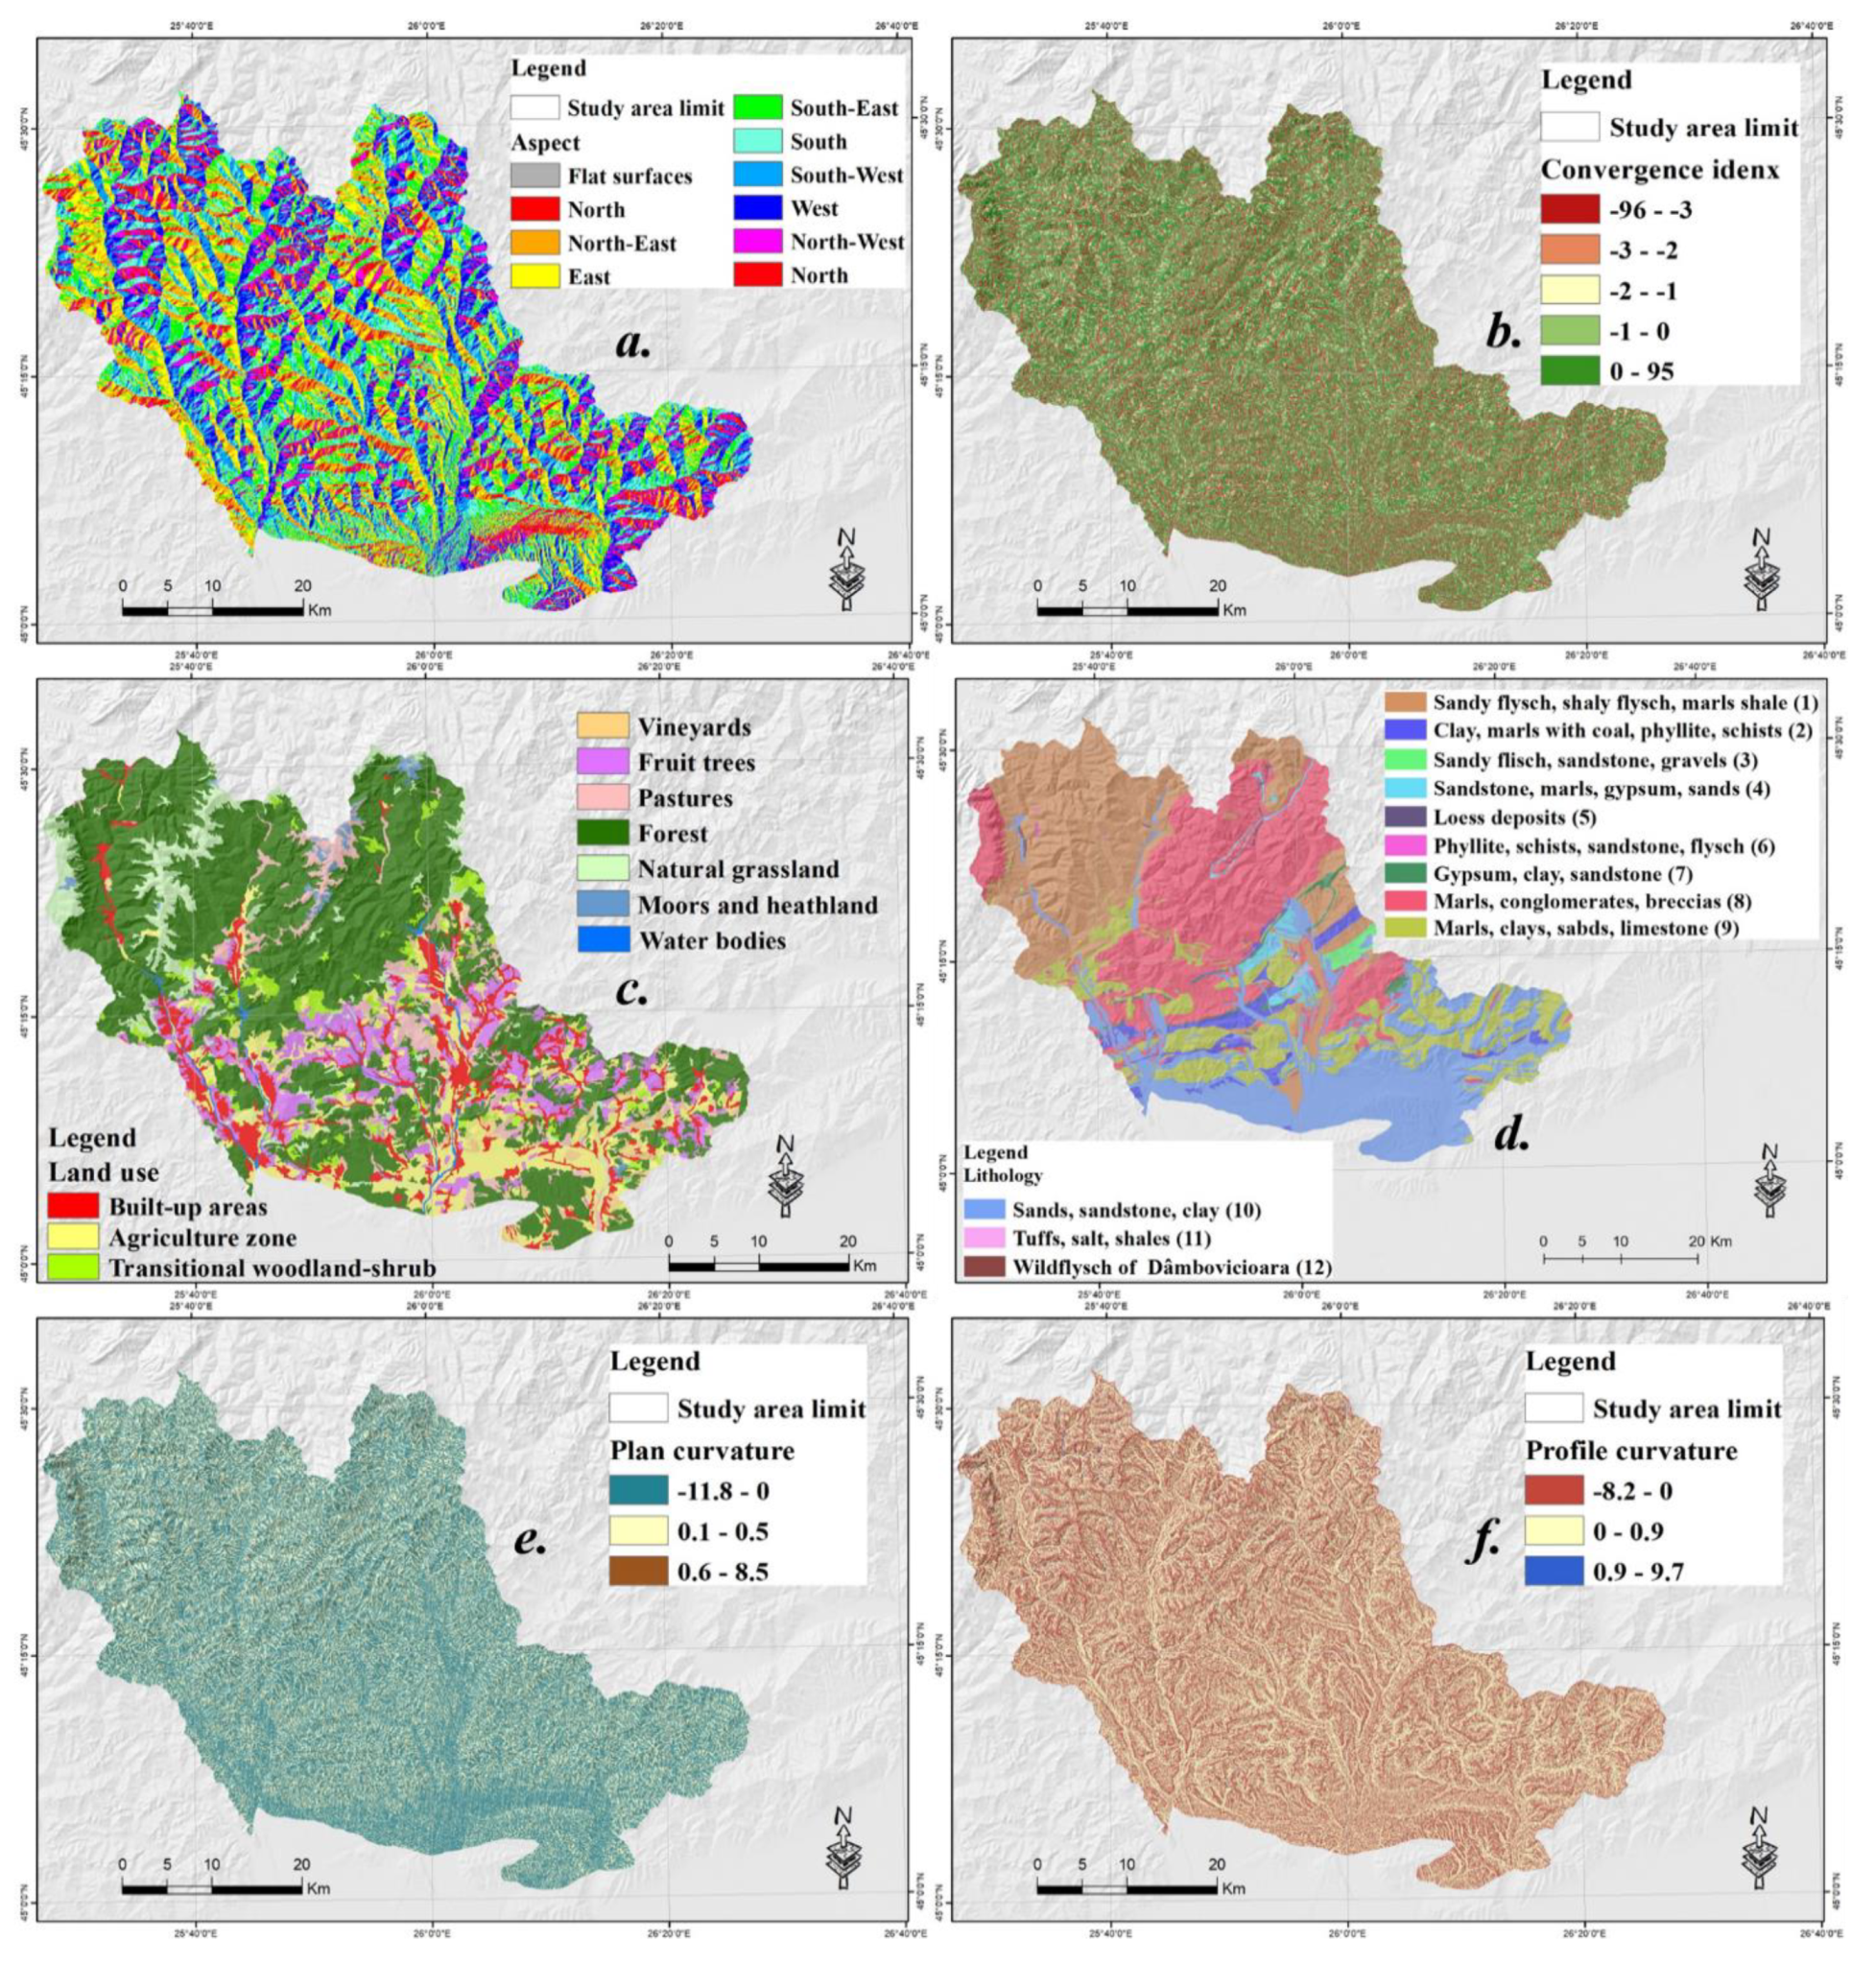
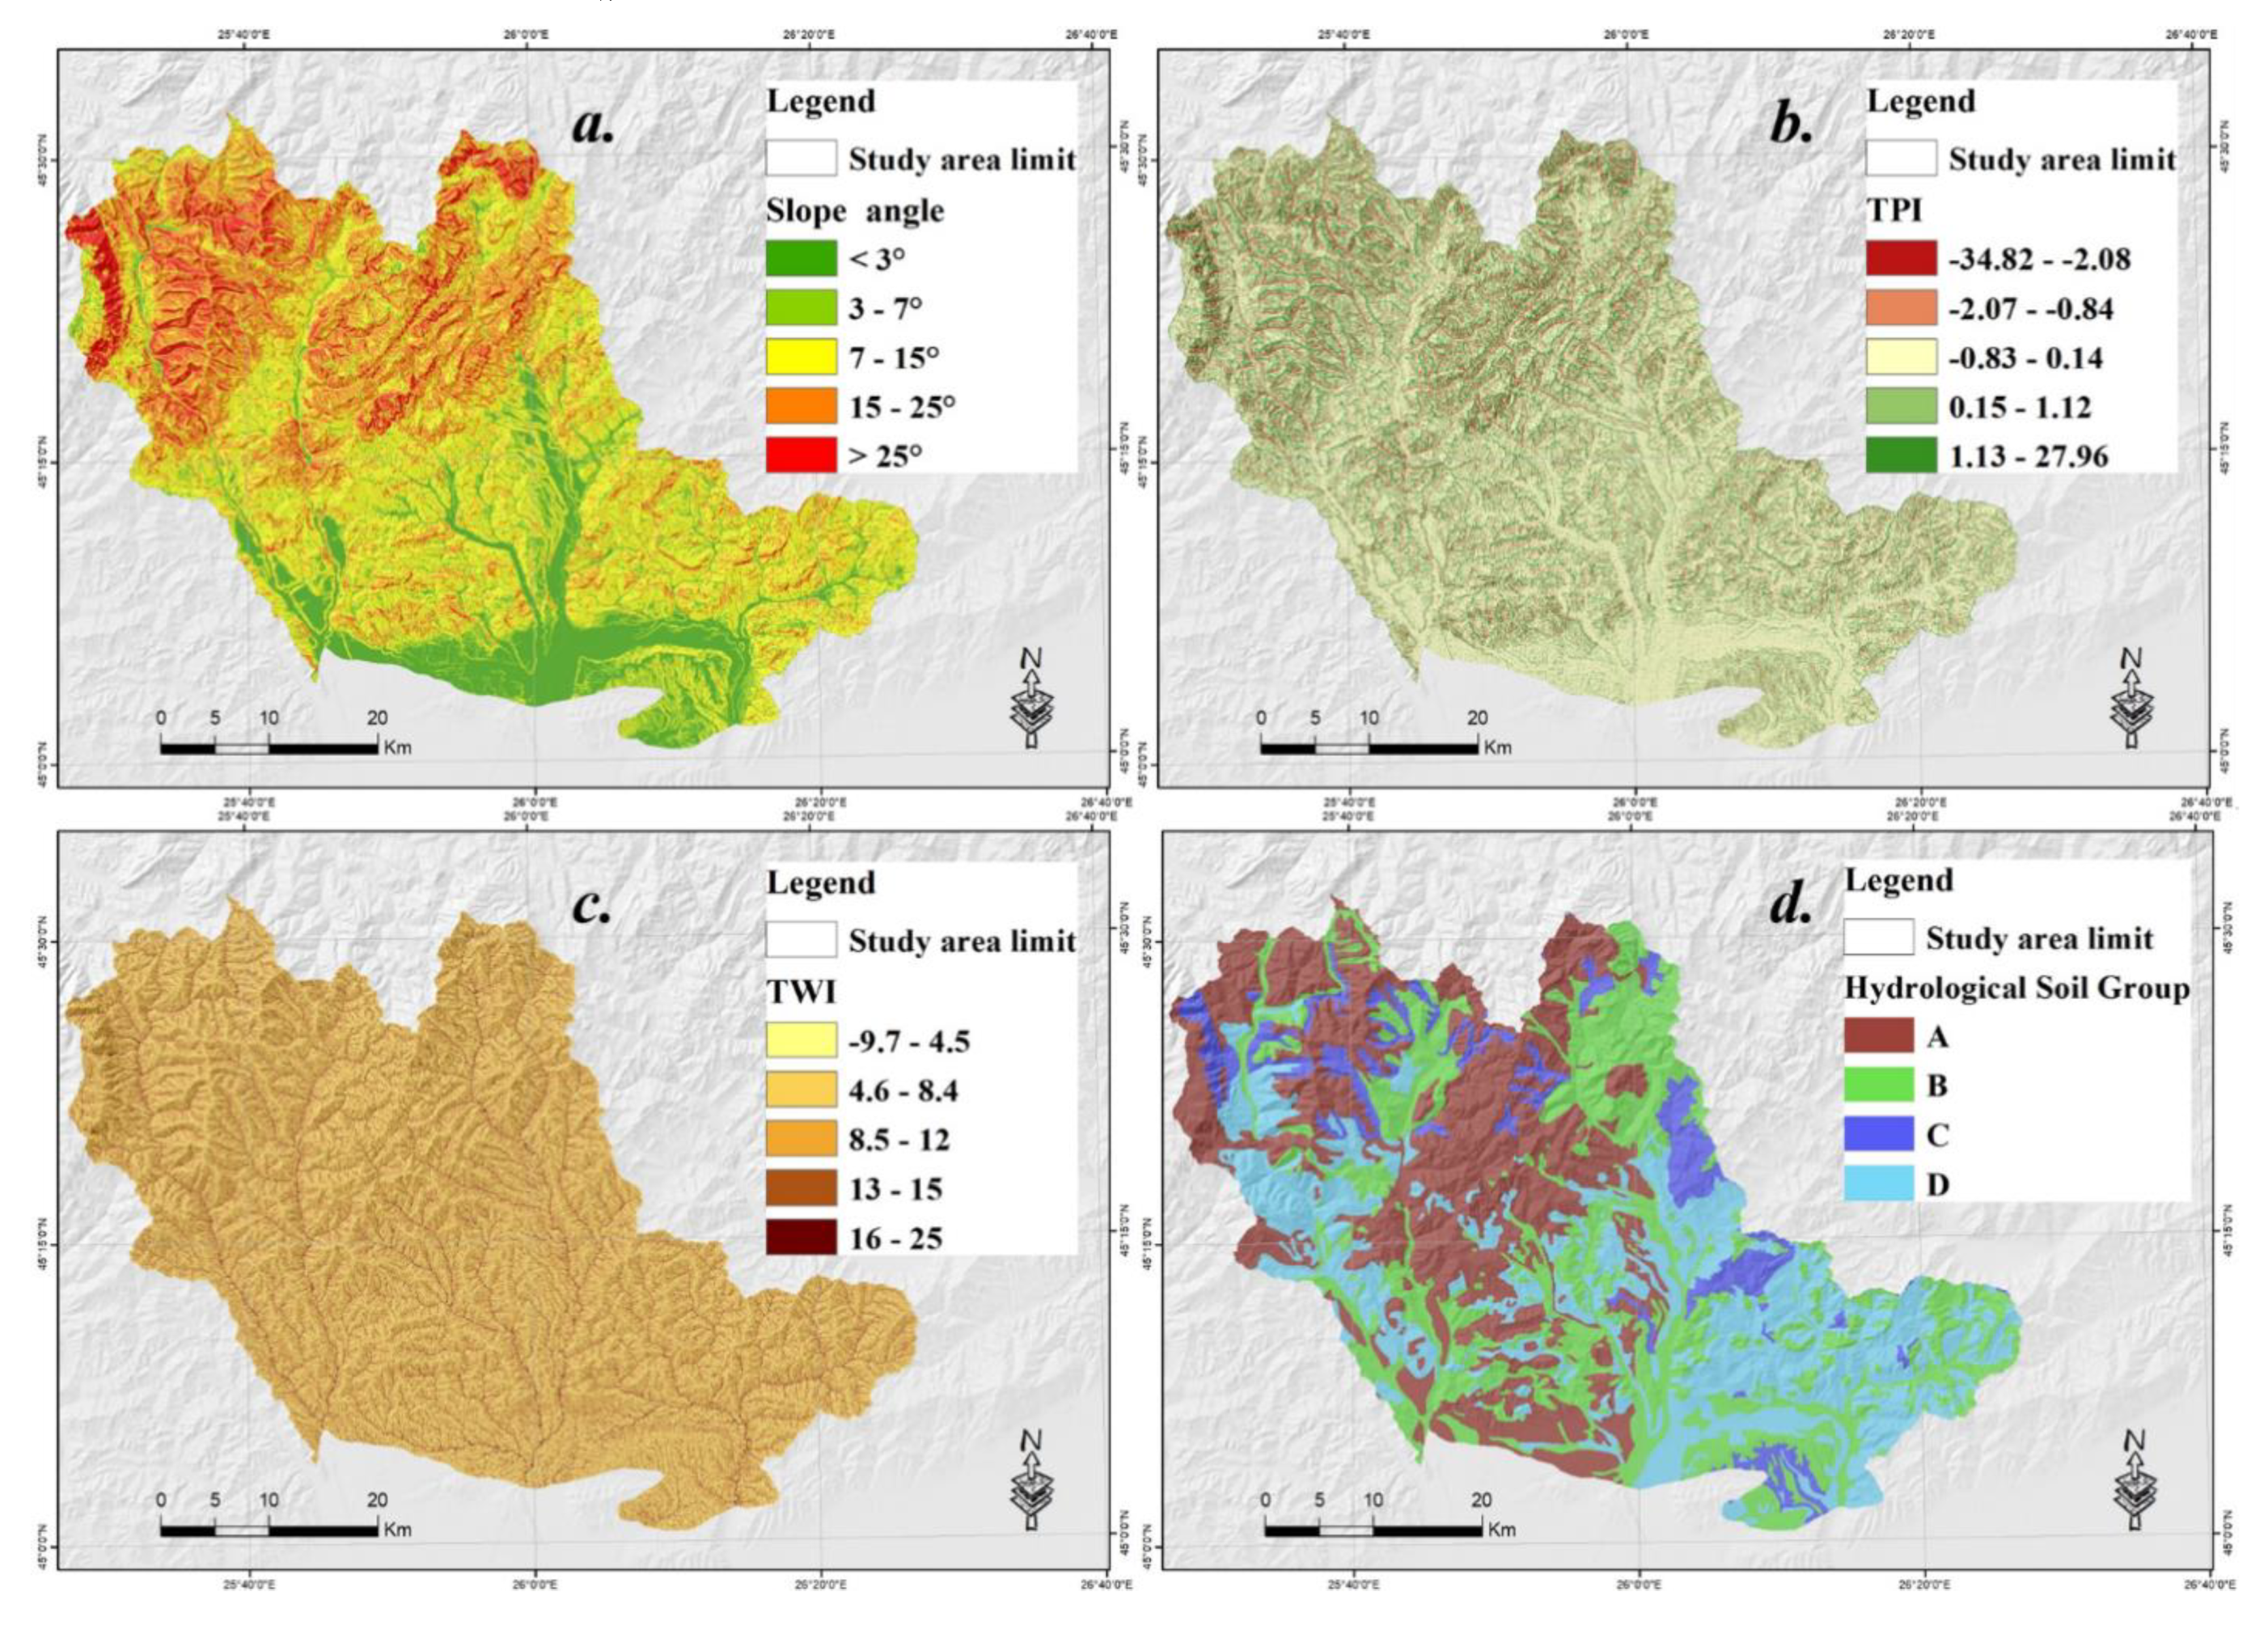


| Factor and Classes/Categories | Pair-Wise Comparison Matrix | Ahp Weights | Frn | |||||||||||
|---|---|---|---|---|---|---|---|---|---|---|---|---|---|---|
| (1) | (2) | (3) | (4) | (5) | (6) | (7) | (8) | (9) | (10) | (11) | (12) | |||
| Slope angle | ||||||||||||||
| (1) <3° | 1 | 0.035 | 0.10 | |||||||||||
| (2) 3–7° | 3 | 1 | 0.072 | 0.46 | ||||||||||
| (3) 7–15° | 5 | 2 | 1 | 0.123 | 0.55 | |||||||||
| (4) 15–25° | 7 | 5 | 3 | 1 | 0.263 | 0.71 | ||||||||
| (5) >25° | 9 | 7 | 5 | 3 | 1 | 0.507 | 0.90 | |||||||
| TPI | ||||||||||||||
| (1) (−20)–(−3.8) | 1 | 0.442 | 0.90 | |||||||||||
| (2) (−3.7)–(−1.1) | 1/2 | 1 | 0.257 | 0.48 | ||||||||||
| (3) (−1)–1.3 | 1/3 | 1/2 | 1 | 0.149 | 0.10 | |||||||||
| (4) 1.4–4.5 | 1/5 | 1/3 | 2/3 | 1 | 0.089 | 0.38 | ||||||||
| (5) 4.6–20 | 1/6 | 1/4 | 1/3 | 3/4 | 1 | 0.063 | 0.87 | |||||||
| TWI | ||||||||||||||
| (1)−9.7–4.5 | 1 | 0.460 | 0.90 | |||||||||||
| (2) 4.6–8.4 | 1/2 | 1 | 0.237 | 0.83 | ||||||||||
| (3) 8.5–12 | 1/4 | 2/3 | 1 | 0.155 | 0.90 | |||||||||
| (4) 13–15 | 1/5 | 1/3 | 1/2 | 1 | 0.091 | 0.76 | ||||||||
| (5) 16–25 | 1/6 | 1/4 | 1/3 | 1/2 | 1 | 0.058 | 0.10 | |||||||
| Land use | ||||||||||||||
| (1) Built-up areas | 1 | 0.226 | 0.29 | |||||||||||
| (2) Agriculture zone | 2/5 | 1 | 0.131 | 0.36 | ||||||||||
| (3) Vineyards | 1/3 | 1/2 | 1 | 0.103 | 0.48 | |||||||||
| (4) Fruit trees | 1/3 | 2/5 | 2/3 | 1 | 0.079 | 0.48 | ||||||||
| (5) Pastures | 2/3 | 2 | 2 | 2 | 1 | 0.169 | 0.68 | |||||||
| (6) Forest | 1/9 | 1/7 | 1/6 | 1/5 | 1/8 | 1 | 0.017 | 0.10 | ||||||
| (7) Grassland | 1/3 | 4/3 | 4/3 | 2 | 1 | 8 | 1 | 0.152 | 0.90 | |||||
| (8) Heatland | 1/4 | 1/3 | 1/3 | 1/2 | 1/3 | 5 | 1/4 | 1 | 0.057 | 0.87 | ||||
| (9) Shrubs | 1/7 | 1/5 | 1/3 | 1/3 | 1/6 | 3 | 1/5 | 1/2 | 1 | 0.039 | 0.76 | |||
| (10) Water bodies | 1/6 | 2/7 | 1/5 | 1/3 | 1/6 | 2 | 1/4 | 1/4 | 1/4 | 1 | 0.027 | 0.23 | ||
| Lithology | ||||||||||||||
| (1) 1 | 1 | 0.222 | 0.90 | |||||||||||
| (2) 2 | 1/2 | 1 | 0.064 | 0.40 | ||||||||||
| (3) 3 | 1 | 1/3 | 1 | 0.044 | 0.10 | |||||||||
| (4) 4 | 1/4 | 2 | 3 | 1 | 0.066 | 0.81 | ||||||||
| (5) 5 | 1/8 | 1/4 | 1 | 1/4 | 1 | 0.020 | 0.78 | |||||||
| (6) 6 | 1/7 | 1/4 | 1 | 1/3 | 2 | 1 | 0.030 | 0.68 | ||||||
| (7) 7 | 1/6 | 1 | 2 | 1/2 | 3 | 1 | 1 | 0.045 | 0.56 | |||||
| (8) 8 | 1/2 | 6 | 8 | 6 | 9 | 8 | 6 | 1 | 0.244 | 0.88 | ||||
| (9) 9 | 1/3 | 3 | 5 | 4 | 8 | 6 | 4 | 1/3 | 1 | 0.144 | 0.68 | |||
| (10) 10 | 1/6 | 2 | 3 | 2 | 4 | 4 | 3 | 1/5 | 1/2 | 1 | 0.084 | 0.28 | ||
| (11) 11 | 1/7 | 1/3 | 1/2 | 1/3 | 1 | 1/2 | 1/3 | 1/9 | 1/7 | 1/4 | 1 | 0.019 | 0.78 | |
| (12) 12 | 1/9 | 1/ | 1/2 | 1/3 | 1 | 1/2 | 1/3 | 1/9 | 1/7 | 1/4 | 1 | 1 | 0.019 | 0.78 |
| Profile curvature | ||||||||||||||
| (1) −8.2–0 | 1 | 0.106 | 0.36 | |||||||||||
| (2) 0–0.9 | 3 | 1 | 0.260 | 0.1 | ||||||||||
| (3) 0.9–9.7 | 5 | 3 | 1 | 0.633 | 0.9 | |||||||||
| Plan curvature | ||||||||||||||
| (1) −11.8–0 | 1 | 0.128 | 0.36 | |||||||||||
| (2) 0.1–0.5 | 3 | 1 | 0.512 | 0.1 | ||||||||||
| (3) 0.6–8.5 | 4 | 1/2 | 1 | 0.360 | 0.9 | |||||||||
| Slope aspect | ||||||||||||||
| (1) Flat surfaces | 1 | 0.034 | 0.10 | |||||||||||
| (2) North | 3 | 1 | 0.088 | 0.76 | ||||||||||
| (3) North-East | 4 | 2 | 1 | 0.109 | 0.84 | |||||||||
| (4) East | 5 | 3/2 | 4 | 1 | 0.202 | 0.90 | ||||||||
| (5) South-East | 4 | 3/2 | 2 | 3/4 | 1 | 0.157 | 0.88 | |||||||
| (6) South | 4 | 3/2 | 3/2 | 2/3 | 2/3 | 1 | 0.134 | 0.85 | ||||||
| (7) South-West | 3 | 4/3 | 4/3 | 2/3 | 2/3 | 4/5 | 1 | 0.116 | 0.82 | |||||
| (8) West | 3 | 5/4 | 2/3 | 1/2 | 3/5 | 3/5 | 4/5 | 1 | 0.093 | 0.72 | ||||
| (9) North-East | 2 | 1 | 1/2 | 1/3 | 1/2 | 1/2 | 1/2 | 2/3 | 1 | 0.067 | 0.70 | |||
| Convergence index | ||||||||||||||
| (1) 0–95 | 1 | 0.057 | 0.10 | |||||||||||
| (2) (−1)–0 | 2 | 1 | 0.089 | 0.90 | ||||||||||
| (3) (−2)–(−1) | 3 | 2 | 1 | 0.143 | 0.90 | |||||||||
| (4) (−3)–(−2) | 4 | 3 | 2 | 1 | 0.227 | 0.67 | ||||||||
| (5) (−96)–(−3) | 6 | 5 | 4 | 3 | 1 | 0.485 | 0.48 | |||||||
| HGS | ||||||||||||||
| (1) A | 1 | 0.088 | 0.58 | |||||||||||
| (2) B | 2 | 1 | 0.158 | 0.90 | ||||||||||
| (3) C | 3 | 2 | 1 | 0.272 | 0.10 | |||||||||
| (4) D | 5 | 3 | 2 | 1 | 0.482 | 0.36 | ||||||||
| Factors | N | λmax | CI | RI | CR |
|---|---|---|---|---|---|
| Slope angle | 5 | 5.196 | 0.049 | 1.12 | 0.040 |
| TPI | 5 | 5.029 | 0.007 | 1.12 | 0.010 |
| TWI | 5 | 5.058 | 0.014 | 1.12 | 0.010 |
| Land use | 10 | 1.490 | 0.001 | 1.49 | 0.000 |
| Lithology | 12 | 13.12 | 0.101 | 1.53 | 0.066 |
| Profile curvature | 3 | 3.039 | 0.019 | 0.58 | 0.030 |
| Plan curvature | 3 | 3.109 | 0.054 | 0.58 | 0.090 |
| Slope aspect | 9 | 9.200 | 0.025 | 1.45 | 0.020 |
| Convergence index | 5 | 5.099 | 0.025 | 1.12 | 0.020 |
| HGS | 4 | 4.015 | 0.005 | 0.90 | 0.010 |
| Performance Metrics | Training Phase | Validation Phase | ||
|---|---|---|---|---|
| DNN-AHP | DNN-FR | DNN-AHP | DNN-FR | |
| TP | 119 | 125 | 49 | 53 |
| TN | 125 | 124 | 53 | 51 |
| FP | 6 | 0 | 4 | 0 |
| FN | 0 | 1 | 0 | 1 |
| PPV (%) | 95.2 | 100 | 92.5 | 100 |
| NPV (%) | 100 | 99.20 | 100 | 98.08 |
| Sensitivity (%) | 100 | 99.21 | 100 | 98.15 |
| Specificity (%) | 95.42 | 100 | 93.0 | 100 |
| Accuracy (%) | 97.60 | 99.60 | 96.23 | 99.05 |
| Kappa | 0.952 | 0.992 | 0.925 | 0.981 |
© 2020 by the authors. Licensee MDPI, Basel, Switzerland. This article is an open access article distributed under the terms and conditions of the Creative Commons Attribution (CC BY) license (http://creativecommons.org/licenses/by/4.0/).
Share and Cite
Costache, R.; Ngo, P.T.T.; Bui, D.T. Novel Ensembles of Deep Learning Neural Network and Statistical Learning for Flash-Flood Susceptibility Mapping. Water 2020, 12, 1549. https://doi.org/10.3390/w12061549
Costache R, Ngo PTT, Bui DT. Novel Ensembles of Deep Learning Neural Network and Statistical Learning for Flash-Flood Susceptibility Mapping. Water. 2020; 12(6):1549. https://doi.org/10.3390/w12061549
Chicago/Turabian StyleCostache, Romulus, Phuong Thao Thi Ngo, and Dieu Tien Bui. 2020. "Novel Ensembles of Deep Learning Neural Network and Statistical Learning for Flash-Flood Susceptibility Mapping" Water 12, no. 6: 1549. https://doi.org/10.3390/w12061549
APA StyleCostache, R., Ngo, P. T. T., & Bui, D. T. (2020). Novel Ensembles of Deep Learning Neural Network and Statistical Learning for Flash-Flood Susceptibility Mapping. Water, 12(6), 1549. https://doi.org/10.3390/w12061549


