Article

Changes in Precipitation Extremes across Vietnam and Its Relationships with Teleconnection Patterns of the Northern Hemisphere

1
Faculty of Economic and Management, Thuyloi University, Hanoi 100000, Vietnam
2
School for Environment and Sustainability, University of Michigan, Ann Arbor, MI 48109, USA
3
Faculty of Environment and Natural Resources, Nong Lam University, Ho Chi Minh City 700000, Vietnam
4
School of Civil, environmental and Mining Engineering, University of Adelaide, Adelaide 5005, Australia
5
Faculty of Water Resources Engineering, Thuyloi University, Hanoi 100000, Vietnam
*
Author to whom correspondence should be addressed.
Water 2020, 12(6), 1646; https://doi.org/10.3390/w12061646
Submission received: 22 May 2020 / Revised: 4 June 2020 / Accepted: 5 June 2020 / Published: 8 June 2020
(This article belongs to the Section Hydrology)

Abstract

:
Understanding changes in precipitation extremes is critical for designing mitigation measures for the potential implications of a warming climate. This study assessed changes in the magnitude and frequency of precipitation extremes over Vietnam using high-quality gridded daily precipitation observations from 1980 to 2010. The annual maxima precipitation was analyzed to detect historical changes in the magnitude of precipitation extremes, while the number of heavy precipitation events, defined using the peak-over-threshold approach, was used to assess changes in the frequency of precipitation extremes. We found a strong signal of changes in the frequency of heavy precipitation, with 28.3% of Vietnam’s landmass exhibiting significant increasing trends. The magnitude of annual maxima precipitation shows a mixed pattern of changes, with less than 10% of Vietnam’s landmass exhibiting significant (both increasing and decreasing) trends. To identify possible mechanisms driving changes in precipitation, we assessed the relationship between inter-annual variations in precipitation extremes and climate variability represented by the teleconnection patterns of the Northern Hemisphere. Using five climate indices, we found that teleconnections across the Indian and Pacific Oceans have implied large control over the characteristics of precipitation extremes across Vietnam, with up to 30% of Vietnam’s landmass exhibiting a significant relationship.

1. Introduction

Amongst the implications of climate change, the intensification of precipitation extremes is one of the most concerning components [1,2]. The key mechanism driving the intensifying precipitation extremes is the Clausius–Clapeyron relation [3]. This relation suggests that more moisture is held in the atmosphere in a warming climate, leading to a potentially higher magnitude of precipitation when atmospheric moisture is released [4,5], although the rate of changes may vary substantially depending on strategies for selecting stations, assessment techniques, and reference periods [6,7,8]. The potential changes in precipitation extremes are of significant importance, as precipitation extremes have a broad range of implications to natural and human systems, from increasing flood risks [9,10,11] to altering ecological systems [12,13,14], and degradation of water and air quality [15,16]. As a result, detecting and attributing changes in precipitation extremes is essential for decision-makers to design mitigation strategies for the potential impacts of climate change.
Changes in precipitation extremes at the regional scale, however, are not necessarily consistent with that observed at the global scale, owing to the influence of other factors that may impose a significant effect on regional precipitation patterns: land-use changes may alter surface moisture and energy distribution that are important in the formation of mesoscale convection [17]; and increasing aerosol due to air pollution can alter cloud microphysics and modulate precipitation patterns [18,19]. As a result, precipitation extremes can be characterized by a downward trend, or a mix of both upward and downward trends at the regional scale [20,21,22,23]. For instance, the western contiguous United States is associated with a tendency toward decreasing changes in precipitation extremes, while an increasing trend is more apparent over the eastern side [24]; southern-central Australia has a more negative trend, relative to northern Australia [5]; and precipitation extremes generally exhibit increasing trends in northeastern Pakistan, whereas southwestern Pakistan is characterized by decreasing trends [25]. Regional and national assessments, therefore, are important to provide a holistic understanding of changes in precipitation extremes in response to a warming climate, especially for regions of which precipitation extremes have a significant impact on natural and human systems.
In Vietnam, the easternmost country of Southeast Asia, precipitation extremes have influenced many aspects of life. Having a long coastal line, Vietnam is characterized by strong activities of tropical cyclones and abundant rainfall concentrated over the rainy season [26]. There has been intensive research documenting the multifaceted challenge facing Vietnam in a changing climate [27,28], including problems closely related to precipitation extremes, such as increasing risks of flooding [29,30], crop damage [31], and landslides [32,33]. Despite the significance of precipitation extremes, only a handful of studies have examined changes in precipitation extremes across Vietnam [34,35], and related these changes to potential large-scale mechanisms [36]. To date, Phan-Van et al. [34] has provided the most comprehensive assessment of historical changes in precipitation extremes, and have found a mix of increasing and decreasing trends across 170 rain gauges. Subsequently, there has been a substantial improvement in precipitation observations across the country [37,38,39,40], providing new opportunities to assess changes in precipitation extremes in finer detail and to relate these changes to possible driving mechanisms, such as large-scale atmospheric circulations that have a strong influence on Vietnam’s climate [28,38,41].
This study aims to complement the state of understanding of changes in precipitation extremes across Vietnam. We used the Vietnam Gridded Precipitation (VnGP) dataset [37], a high-quality gridded data product of daily precipitation, to derive two precipitation indices representing the magnitude and frequency of precipitation extremes. The significance of changes in precipitation extremes was then assessed at both regional and national scales. To identify possible mechanisms modulating precipitation extremes in Vietnam, we furthermore evaluated the relationships between variations of precipitation extremes and five climate indices representing teleconnections of climate variability of the Northern Hemisphere.

2. Data and Methodology

Within this study, the VnGP dataset [37] is used as the basis for precipitation observation. VnGP is a 31-year-long (from 1980 to 2010) daily gridded precipitation dataset with a 0.1-degree × 01-degree longitude–latitude resolution. VnGP was developed using the Spheremap interpolation technique [42] from daily precipitation records of 481 rain gauges across Vietnam, and has been used as the observation basis to evaluate global precipitation data products over Vietnam [39,43,44]. As the country has a spatially heterogeneous climate, owing to the combined influences of the complex geographical and climatological gradients [38], we adopted an established approach [28,45,46] and conducted a regional assessment across seven climate regions: the Northwest region (denoted as R1), the Northeast region (denoted as R2), the Red River Delta region (denoted as R3), the North Central region (denoted as R4), the South Central region (denoted as R5), the Central Highland region (denoted as R6), and the South region (denoted as R7). Figure 1 shows the topography of Vietnam, based on hydroSHEDS elevation data [47], and maps of seven climate regions determined by the Vietnam Hydrometeorological Atlas [46].

2.1. Precipitation Extremes and Climate Indices Representing Large-Scale Climate Variability

We processed the VnGP data at each grid cell to obtain two variables representing the magnitude and frequency of precipitation extremes. In particular, we used the block maxima approach and derived the annual maxima precipitation time series (denoted as the PMAX variable) to represent the magnitude of precipitation extremes. To identify the frequency of heavy precipitation days, the peak-over-threshold approach was applied. Within this approach, we first calculated the 95th percentile of the empirical distribution of daily precipitation. The number of days with a precipitation above the threshold per calendar year were subsequently counted to obtain the frequency of heavy precipitation time series (denoted as a N95 variable). Figure 2 shows an example of deriving PMAX and N95 time series from daily precipitation.
We used five climate indices to represent the teleconnections of climate anomalies in the Northern Hemisphere. These indices were downloaded from the NOAA Global Climate Observing System website (https://psl.noaa.gov/gcos_wgsp/Timeseries; last access: 10 May 2020), and are described as follows:
  • The nino3.4 sea surface temperature (SST) index. The nino3.4 index is one of the most prominent SST-based indices that are used to monitor the El Niño–Southern Oscillation (ENSO). This index was calculated as the average anomaly of SST (relative to the base period from 1961 to 1990) over the region 5° N to 5° S and 170° W to 120° W [48].
  • The Southern Oscillation Index (SOI). The SOI is an indication that has been used extensively to represent the phase and intensity of ENSO. The values of SOI are calculated as the difference of sea level pressure measured at Tahiti and that measured at Darwin [49].
  • The Pacific Decadal Oscillation (PDO) index. The PDO Index represents a concise description of large-scale patterns of inter-decadal climate variability over the Pacific. The index is defined as the average of the monthly sea surface temperature (SST) for 20° N–70° N over the North Pacific. The global average anomaly is then subtracted to account for global changes in temperature [50].
  • The Pacific North American (PNA) Index. The PNA index is an indicator of low-frequency variability in the Northern Hemisphere mid-latitudes [51]. The PNA index is identified as geopotential height fluctuations, of which the positive phase features above-average heights in the vicinity of Hawaii and over Alberta, Canada, coinciding with below-average heights centered over the southern Aleutian Islands and the Gulf Coast region of the United States [52].
  • The Dipole Mode Index (DMI). The DMI is used to represent the Indian Ocean Dipole (also known as the Indian Niño) events. The DMI is calculated as the difference of spatially averaged SST between the tropical western and eastern Indian Ocean [53].

2.2. Analysing Changes in Precipitation Extremes

In trend detection studies, it is important to determine the statistical test that fits the characteristics of the examined variables [54,55]. To quantify the monotonic trend in the PMAX index at a specific grid cell, we used the normalised Theil–Sen slope [56,57] given by:
τ g = m e d i a n ( P M A X j P M A X i j i )
T g = τ g × 10 y e a r s P M A X ¯ g × 100
where τ g is the Theil-Sen slope estimator for grid cell g, which is defined as the median of the average annual difference in PMAX between all possible pairs of years i and j (where i , j (1980, 2010), and i < j ); T g is the normalized trend, expressed in a percentage of changes per decade relative to the mean of all PMAX values of that grid cell ( P M A X ¯ g ). The significance of local trends was then assessed using a Mann–Kendall test at the 5% significance level [58,59]. The ‘Kendall’ package [60] within the R statistical software environment [61] was used for this purpose.
We used the Poisson regression to model the frequency of heavy precipitation (N95 variable), which was assumed to follow a Poisson distribution [62,63]. Specifically, the number of heavy precipitation days for year i (N95i) at a specific grid cell has a Poisson probability distribution of mean μ as follows:
N 95 i ~ P o i s s o n ( μ i )
where i = 1 , ,   31 , corresponding to the reference period from 1980 to 2010.
Parameter μ i is modelled as a log-linear function of the calendar year Ci ∈ (1980, 2010)), expressed as:
log ( μ i ) = β 0 + β 1 C i
where β 1 is the Poisson coefficient for predictor C, and is estimated using a maximum likelihood. The built-in ‘glm’ function within the R statistical software environment [61] was used to estimate β 1 .
In the Poisson regression model (i.e., Equation (4)), exp ( β 0 ) equals to the mean μ of all N95 values for a specific grid cell, and represents the expected value of N95 when C = 0. The regression coefficient β 1 is used to infer changes in the frequency of heavy precipitation, as follows:
-
If β 1 = 0 : the expected N95 equals to exp ( β 0 ) , and N95 does not have any relationship to C;
-
If β 1 > 0 : when C increases by one, the expected N95 increases by a factor of exp ( β 1 ) > 1 ;
-
If β 1 < 0 : when C increases by one, the expected N95 decreases by a factor of exp ( β 1 ) < 1 .
The significance of temporal changes in the frequency of heavy precipitation was evaluated using a null hypothesis test approach. Specifically, a grid cell was determined to be associated with a significant change in the frequency of heavy precipitation if the Poisson coefficient β 1 is statistically different from zero at the 5% two-sided levels (i.e., p-value < 0.05). The sign of β 1 was then used to determine whether the local trend is significantly increasing ( β 1 > 0 ) or significantly decreasing ( β 1 < 0 ).
To determine whether the proportion of grid cells showing significant trends over a specific spatial domain (e.g., Vietnam) is produced by random chance, a field significance test [59] was conducted. Specifically, we used a block bootstrapping resampling technique with replacement [58] to derive the distribution of the null hypothesis that the percentage of significant trends occur due to random chance. The null hypothesis would be rejected when the true percentage is outside the 95% confidence interval of the resampled distribution, that is, the true percentage is higher than the 97.5th percentile of the resampled distribution. More details on the field significance test are presented in Do et al. [58] and Do et al. [57].

2.3. Assessing the Relationship between the Characteristics of Precipitation Extremes and Teleconnection Patterns

We used the Mann-Kendall test to investigate the relationship between the magnitude of precipitation extremes and the climate indices representing large-scale teleconnections of climate anomalies. Here, the null hypothesis H0 is defined as there is no relationship between a specific climate index and PMAX variable. The null hypothesis is rejected at the 5% two-sided level if the p-value of the test statistic (Kendall’s τ ) is lower than 0.05. Depending on the value of τ (i.e., positive or negative), we can infer if there is a positive or negative relationship between PMAX and the corresponding climate index. Field significance over a specific spatial domain is also assessed using a resampling technique (similar to that described in Section 2.2).
The relationship between the frequency of heavy precipitation and climate indices was assessed by the Poisson regression of N95 values against each of the climate indices, which follows a similar approach described in Equation (4). For the statistical significance of the relationship, we compared the p-value of the Poisson coefficient β 1 to the significance level. The frequency of heavy precipitation is significantly related to climate indices at the 5% two-sided level if the p-value is lower than 0.05. The sign of β 1 was then used to infer whether the frequency of heavy precipitation at a specific grid cell is significantly increasing ( β 1 > 0 ) or decreasing ( β 1 < 0 ). Field significance over a specific spatial domain is also assessed using the resampling technique previously described in Section 2.2.
It is informative to note that the climate indices are available only at the monthly time-step, while the precipitation extreme variables (either PMAX or N95) have a yearly time-step. Therefore, we derived yearly values of each climate indices as the averages over the period in which most of the heavy precipitation events occurred [62,64]. Figure 3 shows the fraction of PMAX events classified into each calendar month, confirming the strong seasonality of precipitation extremes across Vietnam [39,41,65,66]. Of all PMAX events, 66% are concentrated over the July–October period. As a result, yearly climate indices were aggregated using monthly values of climate indices from July to October.

3. Results and Discussion

3.1. Spatial Pattern of Precipitation Across Vietnam

Figure 4 shows the spatial variation of annual and extreme precipitation across seven climate regions of Vietnam. The annual precipitation varies substantially across these regions and is higher than 1000 mm over the vast majority of Vietnam’s landmass (more than 99% of all grid cells). Central Vietnam has the highest amount of annual precipitation, with the average annual precipitation gets above 3000 mm over many locations (Figure 4a). The average annual maxima precipitation (PMAX) also has a wide range, from less than 50 mm to above 200 mm (Figure 4b). The spatial pattern of average PMAX is similar to that of average annual precipitation, with the majority of grid cells over central Vietnam having an average value of PMAX of above 200 mm. The 95th percentile of daily rainfall has a smaller range (from 12 mm to 56 mm) relative to the range of the average PMAX and also shares a similar spatial variation (Figure 4c) to that of PMAX and annual precipitation.

3.2. Changes in the Magnitude and Frequency of Precipitation Extremes Across Vietnam

Figure 5 shows trends of annual maxima precipitation across the country mainland, over which approximately 52% grid cells exhibits an increasing trend (Figure 5a). At regional scales, Red River Delta (R3) and North Central (R4) are dominated by a decreasing trend, while increasing trends appear more notably over the Northeast (R2), Central Highland (R6) and South (R7) regions. In addition, a mixture of both increasing and decreasing trends is apparent over the Northwest (R1) and the South Central (R5), indicating the spatially heterogeneity of changes in the magnitude of precipitation extremes. These results are generally consistent with a previous investigation using gauged rainfall from 1979 to 2012 [34], indicating the robustness of PMAX trends detected using different datasets. More importantly, more than 90% of Vietnam’s landmass is not associated with a significant trend (Figure 5b). Of all grid cells, only 5.0% (3.6%) exhibits significant increasing (decreasing) trends at the 5% level and this result is not field significant (Figure 5c,d).
The frequency of precipitation extremes has an overall increasing trend over Vietnam, with 67% of all grid cells characterized by a positive Poisson coefficient β 1 (Figure 6a). This increasing trend is particularly notable over South Central and South Vietnam, notwithstanding how a similar pattern is also observed across other regions. Note that these results are only partially consistent with Phan-Van et al. [34], which found an apparent decreasing trend in the number of heavy precipitation days over the Northwest and Northeast regions. The inconsistent pattern found between this study and Phan-Van et al. [34] is likely due to the methodological choices, as the Sen slope estimator was used in Phan-Van et al. [34]. Figure 6b shows the significance of trends detected from the N95 variable across Vietnam, which further confirms the dominant increasing trend across Vietnam. Of all grid cells, 28.3% exhibits significant increasing trends, while only 3.8% exhibits significant decreasing trends. The percentage of grid cells showing statistically significant increasing trends was field-significant (Figure 6c), whereas the percentage of grid cells showing statistically significant decreasing trends was not field-significant (Figure 6d).
Table 1 shows the percentage of cells showing significant trends (either increasing or decreasing) of PMAX and N95 over each of the regions, which were used to assess whether changes in precipitation extremes had a strong regional signal. Considering trends of PMAX, there are four regions (Northwest, Northeast, Central Highland and South) showing more grid cells with significant increasing trends than significant decreasing trends, and three regions (Red River Delta, North Central and South Central) showing the opposite pattern (more grid cells with significant increasing trends). The percentage of significant trends is only field significant over the Southern (for increasing trend) and Red River Delta (for decreasing trend). As a result, the hypothesis that there is a significant increase in the magnitude of precipitation extremes is not supported by this analysis for the majority of regions (six out of seven).
Across all regions, the signal of increasing trends of the frequency of precipitation extremes is substantially strong, with the percentage of grid cells showing significant increasing trends ranging from 5.8% (Red River Delta) to 70.7% (South Central). The percentage of grid cells exhibiting significant decreasing trends is substantially low, less than 10% across all regions. Interestingly, field significance was only found for increasing trends over the Northwest and South regions, indicating that a large percentage of grid cells showing significant increasing trends may occur due to random chance. For instance, the null-hypothesis of the field significance test was not rejected over the South Central region, despite the fact that more than 70% of all grid cells in this region shows significant increasing trends. Nevertheless, the assessment at the regional scale confirms the dominant upward change in the frequency of heavy precipitation across Vietnam.

3.3. Relationship between Precipitation Extremes and Climate Indices Representing Teleconnections

The previous section indicates that precipitation extremes have changed substantially during the reference period over many regions, especially for the frequency of precipitation extremes. To explore the possible large-scale mechanisms driving these changes, this section assesses the relationship between precipitation extremes and five climate indices representing teleconnections of climate anomalies over the Northern Hemisphere.
The spatial variations of the relationships between PMAX and the five climate indices are shown in Figure 7. At the national scale, less than 10% of Vietnam’s mainland is associated with significant (either positive or negative) relationships between PMAX and each of the five climate indices. Of all indices, DMI has the most notable negative relationships with PMAX (Figure 7e); having 7.3% of all grid cells shows a significant negative relationship, and this number is field-significant (Table 2). Among the other four climate indices, the SOI index shows an overall positive relationship with PMAX (Figure 7b), while a mixture between local negative and positive relationships is apparent across the other three indices (Figure 7a,c,d).
The percentage of grid cells showing significant (either positive or negative) relationships between climate indices and PMAX varies substantially across regions. However, there is limited evidence to reject the null hypothesis that the regional relationship was found due to random chance, especially over the Northeast and Central Highland regions. Specifically, the field significance of positive relationships with PMAX is only detected in the Northwest for nino3.4, and the Red River Delta for SOI. On the other hand, the field significance of negative relationships with PMAX is found in the North Central region for nino3.4, the South Central region for DMI, and the South region for PDO.
Figure 8 shows the statistical significance of the relationship between the frequency of heavy precipitation and each of the five climate indices. In addition, the percentages of grid cells associated with significant relationships are shown in Table 3. Compared to the relationship with PMAX, climate indices have stronger relationships with N95, although the signal is less apparent for PNA (Figure 8d) relative to the other four indices (Figure 8a–c,e). Field significance at the national scale is detected for three climate indices: positive relationships for SOI (25.3% of cells showing significant positive relationships), and a negative relationship for nino3.4 and PDO (21.7% and 30.0% of cells showing significant positive relationships, respectively).
The relationships between N95 and each of the climate indices, when disaggregated across seven regions, are generally consistent with the results obtained at the national scale. There is no evidence to reject the null hypothesis (i.e., the percentage of grid cells showing significant relationships is introduced by random chance) for the relationship between PNA and N95 across all regions. In addition, field significance was not detected over three northern regions (the Northwest, Northeast, and Red River Delta) and one southern region (Central Highland) regardless of the climate index used. The South Central region was the one exhibiting the strongest evidence of a significant relationship between N95 and climate indices. Specifically, field significance was detected for the positive relationship between N95 and SOI (97.3% of all grid cells showing significant positive relationships), and for a negative relationship between N95 and nino3.4, PDO, and DMI (the percentage of grid cells showing significant negative relationships is 92.7%, 83.5%, and 85.7%, respectively). Finally, positive (negative) relationships between N95 and SOI (PDO) are also field-significant over the South region, of which 28.3% (34.5%) grid cells show significant positive (negative) relationships.

4. Conclusions

This paper evaluated changes in precipitation extremes across Vietnam using a high-quality gridded precipitation dataset available from 1980 to 2010. The study also used five climate indices (nino3.4, SOI, PDO, PNA, and DMI) to examine the range of the relationships between precipitation extremes and teleconnection patterns of the Northern Hemisphere across Vietnam. The results are summarized as the following:
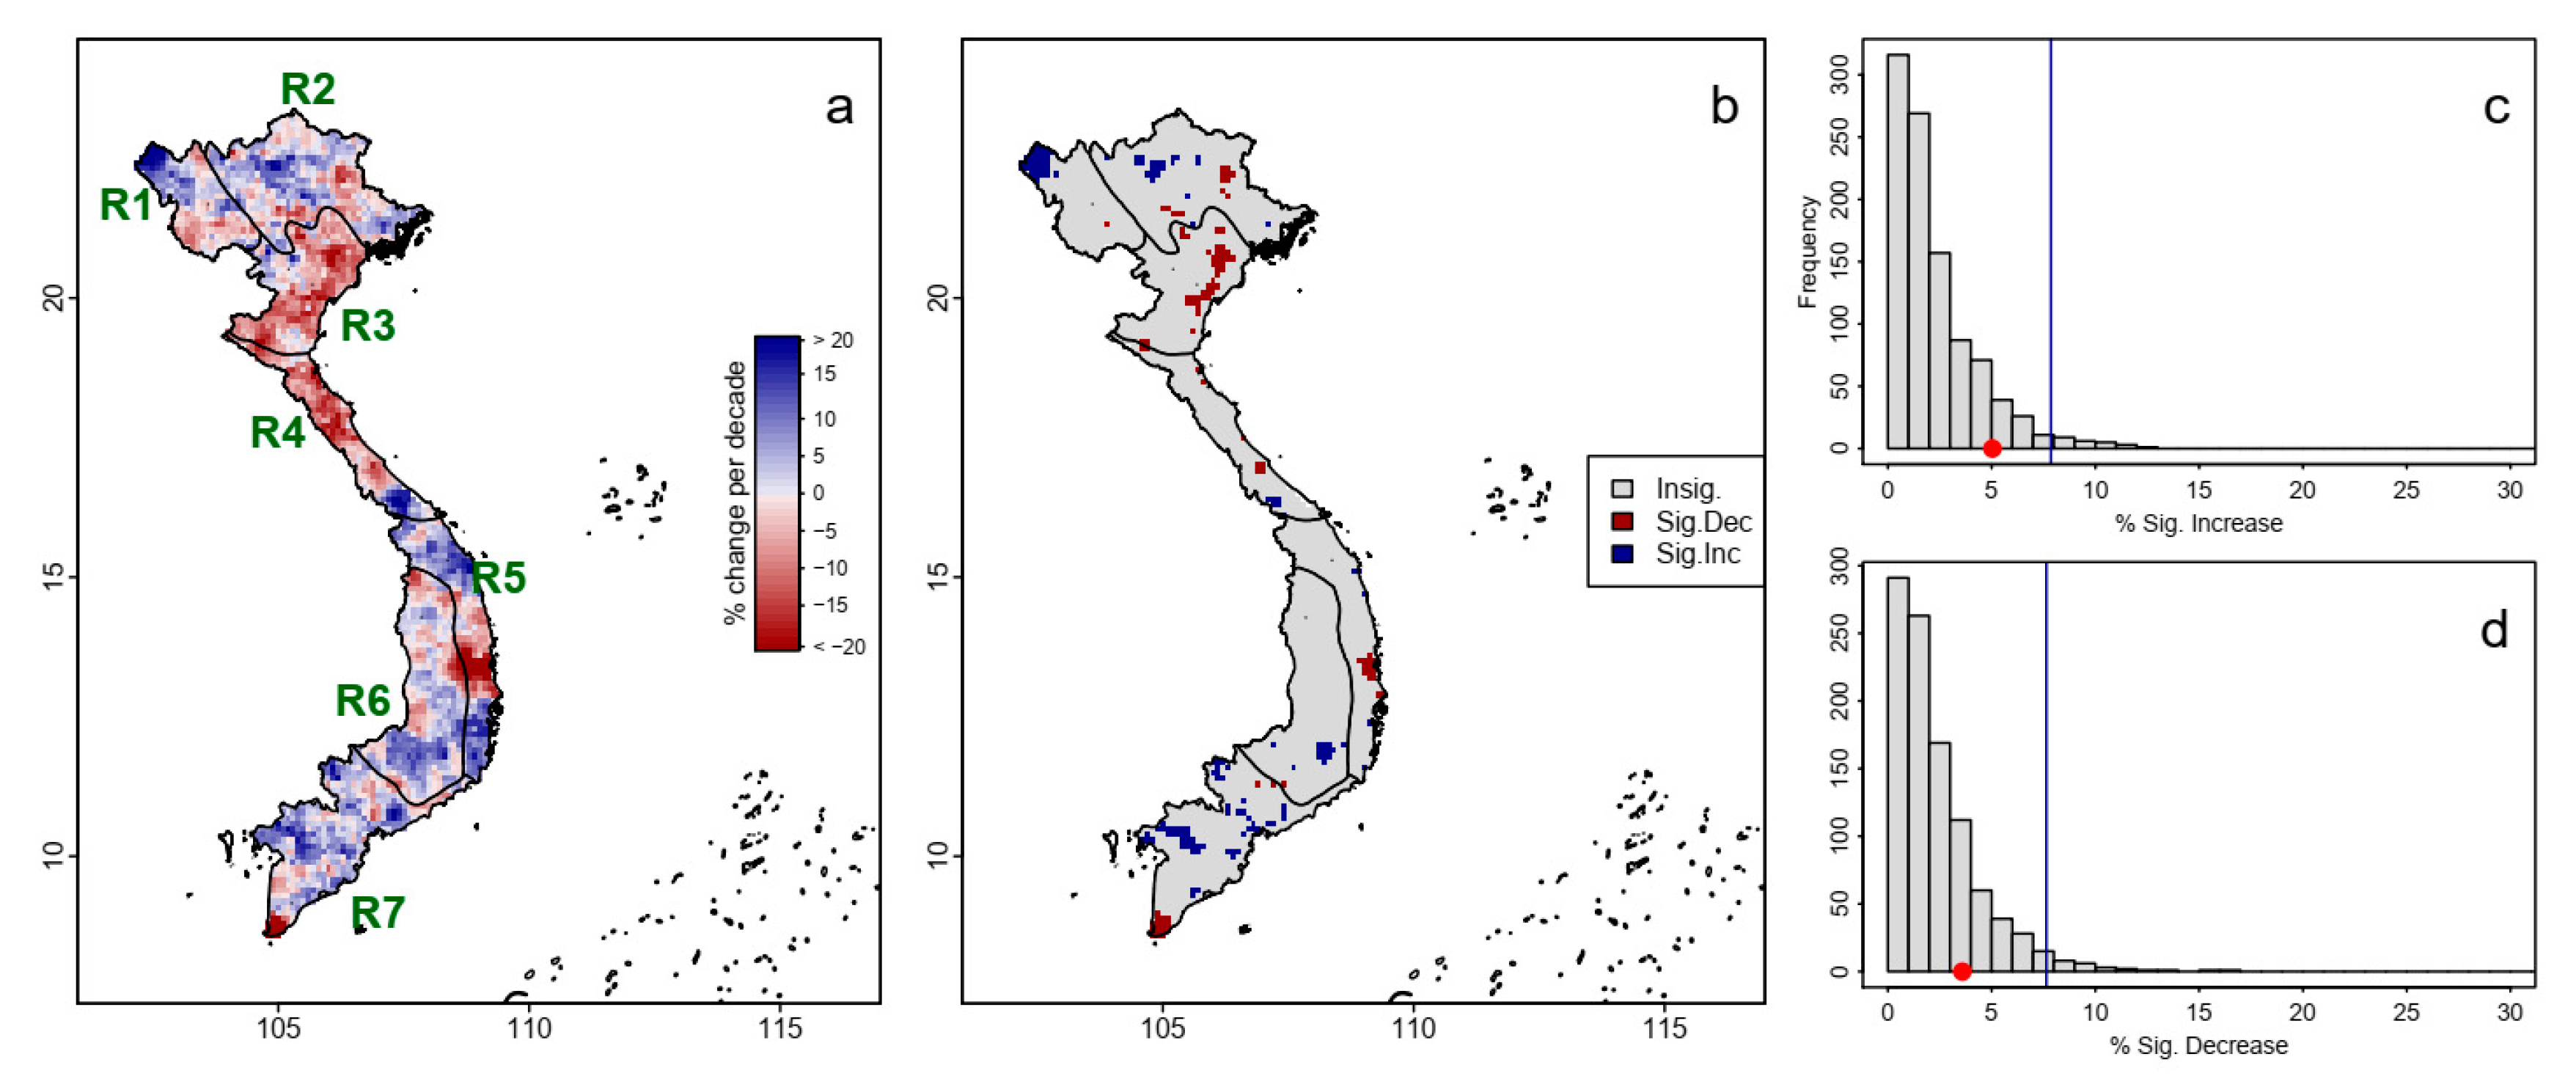
  • Annual maxima precipitations have a mixed pattern of changes over the reference period, with less than 10% of the total landmass exhibiting significant trends. A field significance assessment was conducted at the national and regional scales, which found evidence of an increasing trend only for the South region.
  • The frequency of heavy precipitation shows an apparent upward change, with 28.3% of Vietnam’s landmass exhibiting significant increasing trends, and this number is field-significant. A similar pattern was also found across the regions, and field significance was found for increasing trends over the Northwest and South regions.
  • There is limited evidence for a significant relationship between teleconnections and the magnitude of precipitation extremes at the national scale. Specifically, less than 10% of Vietnam’s landmass is associated with a significant relationship (either positive or negative) between the PMAX variable and the climate indices, of which only the negative relationship between DMI and PMAX was field-significant. At the regional scale, the magnitude of precipitation extremes had significant relationships with nino3.4 over the Northwest and North Central regions; with SOI over the Red River Delta region; with DMI over the South Central region; and with PDO over the South region.
  • The signal of the relationships between teleconnections of climate variability and the frequency of precipitation extremes is significantly strong from the national to the regional scales. At the national scale, the frequency of precipitation extremes has an overall positive relationship with SOI (field-significant), and an overall negative relationship for the other climate indices (field significance was found for nino3.4 and PDO). At the regional scale, the relationships between the frequency of precipitation extremes and climate indices are not field-significant over the Northwest, Northeast, Red River Delta, and Central Highland regions. For the other three regions, the relationships between the frequency of precipitation extremes and climate indices follow similar patterns to that detected at the national scale.
This study complements previous findings of changes in precipitation extremes in Vietnam [34,36,40], suggesting the presence of a strong regional signal for an increase in the frequency of precipitation extremes. The strong influence of teleconnections of climate anomalies on the characteristics of precipitation extremes also suggests a potentially higher magnitude of changes as a response to rising temperature. To better understand these changes, future research should focus on quantifying the scaling relationships between temperature and precipitation extremes, as well as on how large-scale climate variability will modulate precipitation extremes in the future. The effects of changes in aerosol and land management across the country on precipitation extremes should also be assessed, as these factors can impose a greater impact on regional patterns of precipitation relative to global warming or teleconnections climate variability. In addition, attention should also be paid to investigating the implication of changes in precipitation extremes on streamflow regimes, which is of significant importance to design mitigation measures for hydrological extremes, such as flash floods and landslides.

Author Contributions

Conceptualization, all authors; methodology, H.X.D., Q.V.D. and N.C.D.; formal analysis, Q.V.D. and H.X.D; investigation, Q.V.D. and H.X.D.; data curation, A.L.N.; writing—original draft preparation, Q.V.D. and H.X.D.; writing—review and editing, N.C.D. and A.L.N. All authors have read and agreed to the published version of the manuscript.

Funding

This research received no external funding.

Acknowledgments

We thank Roger A. Pielke and an anonymous reviewer for providing us with constructive comments to improve the quality of the manuscript.

Conflicts of Interest

The authors declare no conflict of interest.

References

  1. Westra, S.; Fowler, H.J.; Evans, J.P.; Alexander, L.V.; Berg, P.; Johnson, F.; Kendon, E.J.; Lenderink, G.; Roberts, N.M. Future changes to the intensity and frequency of short-duration extreme rainfall. Rev. Geophys. 2014, 52, 522–555. [Google Scholar] [CrossRef]
  2. Donat, M.G.; Lowry, A.L.; Alexander, L.V.; O’Gorman, P.A.; Maher, N. More extreme precipitation in the world’s dry and wet regions. Nat. Clim. Chang. 2016, 6, 508–513. [Google Scholar] [CrossRef]
  3. Clausius, R. Über die bewegende Kraft der Wärme und die Gesetze, welche sich daraus für die Wärmelehre selbst ableiten lassen. Ann. Phys. 1850, 155, 368–397. [Google Scholar] [CrossRef]
  4. Alexander, L.; Zhang, X.; Peterson, T.; Caesar, J.; Gleason, B.; Klein Tank, A.; Haylock, M.; Collins, D.; Trewin, B.; Rahimzadeh, F. Global observed changes in daily climate extremes of temperature and precipitation. J. Geophys. Res. Atmos. 2006, 111, 1–22. [Google Scholar] [CrossRef] [Green Version]
  5. Papalexiou, S.M.; Montanari, A. Global and Regional Increase of Precipitation Extremes Under Global Warming. Water Resour. Res. 2019, 55, 4901–4914. [Google Scholar] [CrossRef]
  6. Koutsoyiannis, D. Revisiting global hydrological cycle: Is it intensifying? Hydrol. Earth Syst. Sci. Discuss. 2020, 2020, 1–49. [Google Scholar] [CrossRef] [Green Version]
  7. Kleidon, A.; Renner, M. A simple explanation for the sensitivity of the hydrologic cycle to surface temperature and solar radiation and its implications for global climate change. Earth Syst. Dyn. 2013, 4, 455–465. [Google Scholar] [CrossRef] [Green Version]
  8. Westra, S.; Alexander, L.A.; Zwiers, F.W. Global Increasing Trends in Annual Maximum Daily Precipitation. J. Clim. 2013, 26, 15. [Google Scholar] [CrossRef] [Green Version]
  9. Nilsen, V.; Lier, J.A.; Bjerkholt, J.T.; Lindholm, O.G. Analysing urban floods and combined sewer overflows in a changing climate. J. Water Clim. Chang. 2011, 2, 260–271. [Google Scholar] [CrossRef]
  10. Kundzewicz, Z.W.; Kanae, S.; Seneviratne, S.I.; Handmer, J.; Nicholls, N.; Peduzzi, P.; Mechler, R.; Bouwer, L.M.; Arnell, N.W.; Mach, K.; et al. Flood risk and climate change: global and regional perspectives. Hydrol. Sci. J. 2013, 59, 1–28. [Google Scholar] [CrossRef] [Green Version]
  11. Le, P.D.; Davison, A.C.; Engelke, S.; Leonard, M.; Westra, S. Dependence properties of spatial rainfall extremes and areal reduction factors. J. Hydrol. 2018, 565, 711–719. [Google Scholar] [CrossRef]
  12. Buckland, S.M.; Hodgson, J.G.; Grime, J.P. Grassland invasions: effects of manipulations of climate and management. J. Appl. Ecol. 2001, 38, 301–309. [Google Scholar]
  13. Knapp, A.K.; Beier, C.; Briske, D.D.; Classen, A.T.; Luo, Y.; Reichstein, M.; Smith, M.D.; Smith, S.D.; Bell, J.E.; Fay, P.A.; et al. Consequences of More Extreme Precipitation Regimes for Terrestrial Ecosystems. BioScience 2008, 58, 811–821. [Google Scholar] [CrossRef]
  14. Zhang, W.; Brandt, M.; Penuelas, J.; Guichard, F.; Tong, X.; Tian, F.; Fensholt, R. Ecosystem structural changes controlled by altered rainfall climatology in tropical savannas. Nat. Commun. 2019, 10, 671. [Google Scholar] [CrossRef]
  15. Peterson, T.C.; Karl, T.R.; Kossin, J.P.; Kunkel, K.E.; Lawrimore, J.H.; McMahon, J.R.; Vose, R.S.; Yin, X. Changes in weather and climate extremes: State of knowledge relevant to air and water quality in the United States. J. Air Waste Manag. Assoc. 2014, 64, 184–197. [Google Scholar] [CrossRef] [Green Version]
  16. Bell, J.E.; Brown, C.L.; Conlon, K.; Herring, S.; Kunkel, K.E.; Lawrimore, J.; Luber, G.; Schreck, C.; Smith, A.; Uejio, C. Changes in extreme events and the potential impacts on human health. J. Air Waste Manag. Assoc. 2018, 68, 265–287. [Google Scholar] [CrossRef] [Green Version]
  17. Pielke, R.A., Sr.; Adegoke, J.; BeltraáN-Przekurat, A.; Hiemstra, C.A.; Lin, J.; Nair, U.S.; Niyogi, D.; Nobis, T.E. An overview of regional land-use and land-cover impacts on rainfall. Tellus B Chem. Phys. Meteorol. 2007, 59, 587–601. [Google Scholar] [CrossRef]
  18. Khain, A.P. Notes on state-of-the-art investigations of aerosol effects on precipitation: A critical review. Environ. Res. Lett. 2009, 4, 015004. [Google Scholar] [CrossRef]
  19. Niyogi, D.; Chang, H.; Chen, F.; Gu, L.; Kumar, A.; Menon, S.; Pielke, R., Sr. A. Potential impacts of aerosol–land–atmosphere interactions on the Indian monsoonal rainfall characteristics. Nat. Hazards 2007, 42, 345–359. [Google Scholar] [CrossRef]
  20. Maeda, E.E.; Utsumi, N.; Oki, T. Decreasing precipitation extremes at higher temperatures in tropical regions. Nat. Hazards 2012, 64, 935–941. [Google Scholar] [CrossRef]
  21. Ali, H.; Mishra, V. Contrasting response of rainfall extremes to increase in surface air and dewpoint temperatures at urban locations in India. Sci. Rep. 2017, 7, 1228. [Google Scholar] [CrossRef] [Green Version]
  22. Liang, K. Spatio-temporal variations in precipitation extremes in the endorheic hongjian lake basin in the ordos plateau, China. Water 2019, 11, 1981. [Google Scholar] [CrossRef] [Green Version]
  23. Yuan, F.; Liu, J.; Berndtsson, R.; Hao, Z.; Cao, Q.; Wang, H.; Du, Y.; An, D. Changes in Precipitation Extremes over the Source Region of the Yellow River and Its Relationship with Teleconnection Patterns. Water 2020, 12, 978. [Google Scholar] [CrossRef] [Green Version]
  24. Mallakpour, I.; Villarini, G. Analysis of changes in the magnitude, frequency, and seasonality of heavy precipitation over the contiguous USA. Theor. Appl. Climatol. 2017, 130, 345–363. [Google Scholar] [CrossRef]
  25. Hussain, M.S.; Lee, S. The regional and the seasonal variability of extreme precipitation trends in Pakistan. Asia-Pacific J. Atmos. Sci. 2013, 49, 421–441. [Google Scholar] [CrossRef]
  26. Adger, W.N. Social vulnerability to climate change and extremes in coastal Vietnam. World Dev. 1999, 27, 249–269. [Google Scholar] [CrossRef]
  27. Schmidt-Thomé, P.; Nguyen, T.H.; Pham, T.L.; Jarva, J.; Nuottimäki, K. Climate Change Adaptation Measures in Vietnam: Development and Implementation; Springer: New York, NY, USA, 2014. [Google Scholar]
  28. Phan-Van, T.; Ngo-Duc, T.; Ho, T.M.H. Seasonal and interannual variations of surface climate elements over Vietnam. Clim. Res. 2009, 40, 49–60. [Google Scholar] [CrossRef] [Green Version]
  29. Huong, H.T.L.; Pathirana, A. Urbanization and climate change impacts on future urban flooding in Can Tho city, Vietnam. Hydrol. Earth Syst. Sci. 2013, 17, 379. [Google Scholar] [CrossRef] [Green Version]
  30. Hallegatte, S.; Green, C.; Nicholls, R.J.; Corfee-Morlot, J. Future flood losses in major coastal cities. Nat. Clim. Chang. 2013, 3, 802–806. [Google Scholar] [CrossRef]
  31. Trinh, T.A. The impact of climate change on agriculture: Findings from households in Vietnam. Environ. Resour. Econ. 2018, 71, 897–921. [Google Scholar] [CrossRef]
  32. Bui, T.D.; Pradhan, B.; Lofman, O.; Revhaug, I. Landslide susceptibility assessment in vietnam using support vector machines, decision tree, and Naive Bayes Models. Math. Probl. Eng. 2012, 2012. [Google Scholar] [CrossRef] [Green Version]
  33. Le, T.T.T.; Kawagoe, S. Impact of the landslide for a Relationship between Rainfall Condition and Land Cover in North Vietnam. J. Geol. Resour. Eng. 2018, 6, 239–250. [Google Scholar]
  34. Phan-Van, T.; Fink, A.H.; Ngo-Duc, T.; Trinh, T.L.; Pinto, J.; van der Linden, R.; Schubert, D. Observed Climate Variations and Change in Vietnam. Available online: http://centaur.reading.ac.uk/39160/ (accessed on 2 May 2020).
  35. Raghavan, S.V.; Vu, T.M.; Liong, S.Y. Ensemble climate projections of mean and extreme rainfall over Vietnam. Glob. Planet. Chang. 2017, 148, 96–104. [Google Scholar] [CrossRef]
  36. Trinh-Tuan, L.; Konduru, R.T.; Inoue, T.; Ngo-Duc, T.; Matsumoto, J. Autumn Rainfall Increasing Trend in Central-Southern Vietnam and Its Association with Changes in Vietnam’s East Sea Surface Temperature; Tokyo Metropolitan University: Tokyo, Japan, 2019; Volume 54, pp. 11–12. [Google Scholar]
  37. Nguyen-Xuan, T.; Ngo-Duc, T.; Kamimera, H.; Trinh-Tuan, L.; Matsumoto, J.; Inoue, T.; Phan-Van, T. The Vietnam gridded precipitation (VnGP) dataset: Construction and validation. SOLA 2016, 12, 291–296. [Google Scholar] [CrossRef] [Green Version]
  38. Le, V.V.P.; Phan-Van, T.; Mai, K.V.; Tran, D.Q. Space–time variability of drought over Vietnam. Int. J. Clim. 2019, 39, 5437–5451. [Google Scholar] [CrossRef]
  39. Trinh-Tuan, L.; Matsumoto, J.; Ngo-Duc, T.; Nodzu, M.I.; Inoue, T. Evaluation of satellite precipitation products over Central Vietnam. Prog. Earth Planet. Sci. 2019, 6, 54. [Google Scholar] [CrossRef] [Green Version]
  40. Singh, V.; Qin, X. Study of rainfall variabilities in Southeast Asia using long-term gridded rainfall and its substantiation through global climate indices. J. Hydrol. 2019, 585, 124320. [Google Scholar] [CrossRef]
  41. Pham-Thanh, H.; van der Linden, R.; Ngo-Duc, T.; Nguyen-Dang, Q.; Fink, A.H.; Phan-Van, T. Predictability of the rainy season onset date in Central Highlands of Vietnam. Int. J. Clim. 2019. [Google Scholar] [CrossRef]
  42. Willmott, C.J.; Rowe, C.M.; Philpot, W.D. Small-scale climate maps: A sensitivity analysis of some common assumptions associated with grid-point interpolation and contouring. Am. Cartogr. 1985, 12, 5–16. [Google Scholar] [CrossRef]
  43. Nodzu, M.I.; Matsumoto, J.; Trinh-Tuan, L.; Ngo-Duc, T. Precipitation estimation performance by Global Satellite Mapping and its dependence on wind over northern Vietnam. Prog. Earth Planet. Sci. 2019, 6, 58. [Google Scholar] [CrossRef] [Green Version]
  44. Vu, T.M.; Raghavan, S.V.; Liong, S.Y.; Mishra, A.K. Uncertainties of gridded precipitation observations in characterizing spatio-temporal drought and wetness over Vietnam. Int. J. Clim. 2018, 38, 2067–2081. [Google Scholar] [CrossRef]
  45. Mai, V.K.; Redmond, G.; McSweeney, C.; Tran, T. Evaluation of dynamically downscaled ensemble climate simulations for Vietnam. Int. J. Clim. 2014, 34, 2450–2463. [Google Scholar]
  46. Nguyen, T.H.; Tran, T.X.; Nguyen, N.T. Vietnam Hydrometeoro-Logical Atlas; Hydrometeorological Service, State Programme of Scientific Technical Progress: Hanoi, Vietnam, 1994. [Google Scholar]
  47. Lehner, B.; Verdin, K.; Jarvis, A. HydroSHEDS Technical Documentation, Version 1.0; World Wildlife Fund US: Washington, DC, USA, 2006; pp. 1–27. [Google Scholar]
  48. Trenberth, K.E. The definition of el nino. Bull. Am. Meteorol. Soc. 1997, 78, 2771–2778. [Google Scholar] [CrossRef] [Green Version]
  49. Allan, R.J.; Nicholls, N.; Jones, P.D.; Butterworth, I.J. A further extension of the Tahiti-Darwin SOI, early ENSO events and Darwin pressure. J. Clim. 1991, 4, 743–749. [Google Scholar] [CrossRef]
  50. Mantua, N.J.; Hare, S.R.; Zhang, Y.; Wallace, J.M.; Francis, R.C. A Pacific interdecadal climate oscillation with impacts on salmon production. Bull. Am. Meteorol. Soc. 1997, 78, 1069–1080. [Google Scholar] [CrossRef]
  51. Barnston, A.G.; Livezey, R.E. Classification, seasonality and persistence of low-frequency atmospheric circulation patterns. Mon. Weather Rev. 1987, 115, 1083–1126. [Google Scholar] [CrossRef]
  52. Wallace, J.M.; Gutzler, D.S. Teleconnections in the geopotential height field during the Northern Hemisphere winter. Mon. Weather Rev. 1981, 109, 784–812. [Google Scholar] [CrossRef]
  53. Saji, N.H.; Goswami, B.N.; Vinayachandran, P.N.; Yamagata, T. A dipole mode in the tropical Indian Ocean. Nature 1999, 401, 360–363. [Google Scholar] [CrossRef]
  54. Salas, J.D.; Obeysekera, J. Revisiting the concepts of return period and risk for nonstationary hydrologic extreme events. J. Hydrol. Eng. 2014, 19, 554–568. [Google Scholar] [CrossRef] [Green Version]
  55. Totaro, V.; Gioia, A.; Iacobellis, V. Numerical investigation on the power of parametric and nonparametric tests for trend detection in annual maximum series. Hydrol. Earth Syst. Sci. 2020, 24, 473–488. [Google Scholar] [CrossRef] [Green Version]
  56. Gudmundsson, L.; Leonard, M.; Do, H.X.; Westra, S.; Seneviratne, S.I. Observed trends in global indicators of mean and extreme streamflow. Geophys. Res. Lett. 2019, 46, 756–766. [Google Scholar] [CrossRef] [Green Version]
  57. Do, H.X.; Zhao, F.; Westra, S.; Leonard, M.; Gudmundsson, L.; Boulange, J.E.S.; Chang, J.; Ciais, P.; Gerten, D.; Gosling, S.N.; et al. Historical and future changes in global flood magnitude—Evidence from a model–observation investigation. Hydrol. Earth Syst. Sci. 2020, 24, 1543–1564. [Google Scholar] [CrossRef] [Green Version]
  58. Do, H.X.; Westra, S.; Michael, L. A global-scale investigation of trends in annual maximum streamflow. J. Hydrol. 2017. [Google Scholar] [CrossRef]
  59. Wilks, D.S. Statistical Methods in the Atmospheric Sciences; Academic Press: Cambridge, MA, USA, 2011; Volume 100. [Google Scholar]
  60. McLeod, A.I. Kendall: 2.2; 2011. Available online: https://cran.r-project.org/web/packages/Kendall/Kendall.pdf (accessed on 8 June 2020).
  61. R Core Team. R: A Language and Environment for Statistical Computing. Available online: https://www.R-project.org (accessed on 8 June 2020).
  62. Villarini, G.; Smith, J.A.; Baeck, M.L.; Vitolo, R.; Stephenson, D.B.; Krajewski, W.F. On the frequency of heavy rainfall for the Midwest of the United States. J. Hydrol. 2011, 400, 103–120. [Google Scholar] [CrossRef]
  63. Smith, J.A.; Karr, A.F. Statistical Inference for Point Process Models of Rainfall. Water Resour. Res. 1985, 21, 73–79. [Google Scholar] [CrossRef]
  64. Vitolo, R.; Stephenson, D.B.; Cook, I.M.; Mitchell-Wallace, K. Serial clustering of intense European storms. Meteorol. Z. 2009, 18, 411–424. [Google Scholar] [CrossRef] [Green Version]
  65. Do, H.X.; Westra, S.; Leonard, M.; Gudmundsson, L. Global-Scale Prediction of Flood Timing Using Atmospheric Reanalysis. Water Resour. Res. 2020, 56, e2019WR024945. [Google Scholar] [CrossRef]
  66. Bui-Minh, T. Extratropical Forcing of Submonthly Variations of Rainfall in Vietnam. J. Clim. 2019, 32, 2329–2348. [Google Scholar]
Figure 1. The seven climate regions of Vietnam (polygons bounded by black lines) as defined in the Vietnam Hydrometeorological Atlas. The elevation across these regions is also shown for reference.
Water 12 01646 g001
Figure 2. An example of deriving the annual maxima precipitation (PMAX) and heavy precipitation days (N95) time series from daily precipitation. (a) Daily time series (black histogram) and the PMAX events (red dots). (b) Daily time series (black histogram) and the peak-over-threshold events (blue dots); the horizontal dashed line represents the threshold (the 95th percentile of the empirical distribution). (c) The values of the N95 variable (i.e., the number of heavy precipitation days per year; heavy precipitation events were identified in Figure 2b).
Water 12 01646 g002
Figure 3. Fraction of annual maxima precipitation events across Vietnam classified into each calendar month. The period from July to October, in which about two-third of annual maxima precipitation events are concentrated, was used to derive yearly time series of climate indices.
Water 12 01646 g003
Figure 4. Characteristics of precipitation across Vietnam: (a) average annual precipitation, (b) average annual maxima precipitation, and (c) the 95th percentile threshold. Seven climate regions are also shown as polygons bounded by black lines.
Water 12 01646 g004
Figure 5. Changes in annual maxima precipitation across Vietnam from 1980 to 2010. (a) Normalized Thiel-Sen slope (expressed in % change per decade) of annual maxima precipitation across seven climate regions (polygons bounded by black lines). (b) The significance of trends: blue (red) cells indicate locations associated with statistically significant increasing (decreasing) trends at the 5% level. (c) The null-hypothesis distribution (grey histogram) and the observed value (red dot) of the percentage of grid cells showing significant increasing trends. (d) Similar to (c), but for significant decreasing trends. The blue lines in (c) and (d) represent the 97.5th percentile of the null-hypothesis distribution.
Water 12 01646 g005
Figure 6. Changes in the frequency of heavy precipitation across Vietnam from 1980 to 2010. (a) Poisson regression coefficient β 1 across seven climate regions (polygons bounded by black lines). (b) The significance of changes: blue (red) cells indicate locations associated with statistically significant increasing (decreasing) trends at the 5% level. (c) The null-hypothesis distribution (grey histogram) and the observed value (red dot) of the percentage of stations showing significant increasing trends. (d) Similar to (c), but for significant decreasing trends. The blue lines in (c,d) represent the 97.5th percentile of the null-hypothesis distribution.
Water 12 01646 g006
Figure 7. Maps showing the significant relationships between annual maxima precipitation and climate indices representing teleconnections: (a) nino34, (b) the Southern Oscillation Index (SOI), (c) the Pacific Decadal Oscillation (PDO) index, (d) the Pacific North American (PNA) Index, and (e) the Dipole Mode Index (DMI). Blue (red) pixels indicate a significant positive (negative) relationship at the 5% level. Seven climate regions are also shown (polygons bounded by black lines).
Water 12 01646 g007
Figure 8. Maps showing the significant relationships between the frequency of heavy precipitation days and climate indices representing teleconnections: (a) nino34, (b) the Southern Oscillation Index (SOI), (c) the Pacific Decadal Oscillation (PDO) index, (d) the Pacific North American (PNA) Index, and (e) the Dipole Mode Index (DMI). Blue (red) pixels indicate a significant positive (negative) relationship at the 5% level. Seven climate regions are also shown (polygons bounded by black lines).
Water 12 01646 g008
Table 1. The percentage of grid cells showing significant changes (at the 5% level) in the magnitude (PMAX variable) and the frequency (N95 variable) of precipitation extremes across seven climate regions. The results at the national scale are also shown (the last row). The field significance of increasing and decreasing trends is highlighted in bold.
RegionTrends of PMAX VariableTrends of N95 Variable
% Sig. Increase% Sig. Decrease% Sig. Increase% Sig. Decrease
Northwest (R1)11.50.432.30.4
Northeast (R2)4.32.612.64.3
Red River Delta (R3)0.011.05.82.4
North Central (R4)2.03.614.12.0
South Central (R5)1.84.670.70.3
Central Highland (R6)2.80.229.88.1
South (R7)12.33.438.04.8
Vietnam5.03.628.33.8
Table 2. The percentage of grid cells showing a significant relationship (at the 5% level) between the magnitude of precipitation extremes and the five climate indices across the national and regional scale. Field significance of the relationship has been highlighted in bold.
Region% of Grid Cells Showing Significant Positive Relationship% of Grid Cells Showing Significant Negative Relationship
nino3.4SOIPDOPNADMInino3.4SOIPDOPNADMI
Northwest (R1)20.40.40.83.100.41.21.50.81.9
Northeast (R2)2.61.11.50.60.40.20.22.40.60.6
Red River Delta (R3)2.113.91.0009.71.30.52.611.3
North Central (R4)04.81.20014.102.413.712.5
South Central (R5)010.13.74.002.4011.62.418.6
Central Highland (R6)0.83.21.403.80.40.61.64.69.9
South (R7)0.21.60.20.85.40.80.29.02.61.8
Vietnam2.94.71.31.01.73.20.54.23.47.3
Table 3. The percentage of grid cells showing a significant relationship (at the 5% level) between the frequency of precipitation extremes and the five climate indices across the national and regional scale. The field significance of the relationship is highlighted in bold.
Region% of Grid Cells Showing Significant Positive Relationship% of Grid Cells Showing Significant Negative Relationship
nino3.4SOIPDOPNADMInino3.4SOIPDOPNADMI
Northwestern (R1)5.40.81.29.24.2011.516.52.70
Northeastern (R2)5.012.00.23.71.85.23.919.42.60.2
Red River Delta (R3)8.90.5002.12.69.219.92.10.5
Central-Northern (R4)026.200020.6025.01.243.1
Central-Southern (R5)097.300092.7083.519.585.7
Central Highland (R6)2.420.61.613.311.117.73.019.24.828.6
Southern (R7)028.33.85.02.223.3034.52.22.0
Vietnam3.225.31.14.93.521.73.730.04.719.7

