Article

Impacts of the Sanmenxia Dam on the Interaction between Surface Water and Groundwater in the Lower Weihe River of Yellow River Watershed

1
Key Laboratory of Water Cycle and Related Land Surface Processes, Institute of Geographic Sciences and Natural Resources Research, Chinese Academy of Sciences, 11 A, Datun Road, Chaoyang District, Beijing 100101, China
2
College of Resources and Environment, University of Chinese Academy of Sciences, Beijing 100049, China
*
Author to whom correspondence should be addressed.
Water 2020, 12(6), 1671; https://doi.org/10.3390/w12061671
Submission received: 8 May 2020 / Revised: 8 June 2020 / Accepted: 9 June 2020 / Published: 11 June 2020
(This article belongs to the Section Hydrology)

Abstract

:
Sanmenxia Dam, one of the most controversial water conservancy projects in China, has seriously impacted the lower Weihe River of the Yellow River Watershed since its operation. At the Huaxian Station, the dam operation controls the surface water level and leads to the variation of the surface water–groundwater interaction relationship. The river channel switched from a losing reach during the early stage (1959) to a gaining reach in 2010 eventually. The comparison of tracer (Cl, δ18O and δ2H) characteristics of surface water in successive reaches with that of ambient groundwater shows that the general interaction condition is obviously affected by the dam operation and the impact area can be tracked back to Weinan City, around 65 km upstream of the estuary of the Weihe River. The anthropogenic inputs (i.e., agricultural fertilizer application, wastewater discharge, and rural industrial sewage) could be responsible for the deterioration of hydro-environment during the investigation periods of 2015 and 2016, as the population and fertilizer consumption escalated in the last 60 years. The use of contaminated river water for irrigation, along with the dissolved fertilizer inputs, can affect the groundwater quality, in particular resulting in the NO3 concentrations ranging from 139.4 to 374.1 mg/L. The unregulated industrial inputs in some rural areas may increase the Cl contents in groundwater ranging from 298.4 to 472.9 mg/L. The findings are helpful for the improved comprehensive understanding of impacts of the Sanmenxia Dam on the interaction between surface water and groundwater, and for improving local water resources management.

1. Introduction

Surface water (SW) and ambient groundwater (GW) are always interacting in the hydrologic cycle [1]. Understanding the interactions between SW and GW is critical for purposes like water resources utilization and management [2,3], water quality assessment [4,5], and ecohydrology analysis [6,7]. One of the main factors controlling the SW–GW interaction is the hydraulic gradient [8], which is variable since levels of SW and GW are persistently affected by various natural and anthropic conditions.
Dams provide many benefits while also disturb the river systems and produce some unexpected hydrologic impacts on discharge, sedimentation, and aquatic vegetation, etc. [9,10,11,12]. The SW level can be directly affected by the storing and releasing process of dams, which may change the hydraulic gradients of SW–GW interactions [5,13,14]. SW and GW can also be polluted by many anthropogenic sources, such as agricultural non-point pollutants, domestic sewage, industrial wastewater [15,16,17]. In different river reaches, water quality may respond differently to the SW–GW interaction changes [18,19]. In losing river reaches, pollutants from upstream may migrate to ambient GW [20], while, in gaining river reaches, pollutants in GW may also transport to SW [21]. Therefore, understanding the SW–GW interaction variation is important for water resources management.
The Sanmenxia Dam is the first large-scale water conservancy project built on the Yellow River. The purposes of the dam were to control flooding, hydroelectric power, agricultural irrigation, and navigation. However, the dam soon suffered from the severe sedimentation problems caused after its operation [22]. The sedimentation problem is not only confined to the reservoir but also extended upstream to the Weihe River, which is the largest tributary of the Yellow River. The riverbed elevation in the lower Weihe River has risen sharply due to the serious sedimentation problem, which makes the river water level with the same discharge ascend significantly [23]. This may lead to variations of the SW–GW interaction along the Weihe River, especially in its lower reach. The lower Weihe River Basin has been a major agricultural area in China since the 3rd century B.C. Increasing use of fertilizers in these farmlands during recent decades is likely to affect the SW and GW which support the rural and urban communities with millions of people in this region [24]. Other anthropogenic sources like domestic sewage and industrial wastewater may also deteriorate the water quality [25]. It is crucial to improve the understanding of the impact of the Sanmenxia Dam on SW–GW interaction and their potential consequences on the water quality for further water resources management. However, insufficient attention has been paid to these issues in previous studies.
Since hydraulic gradients between SW and GW are the major factors controlling their interaction process, analysis of the water level data is helpful for the investigation of SW–GW interaction [26,27,28]. Statistical methods like Mann–Kendall test are often used to support the analysis [29,30]. Hydrochemical and stable isotopes methods are also widely used to understand the SW–GW interaction in many related studies [31,32,33,34,35]. The general interaction condition can be acquired by separating a river into different segments by the SW sampling sites and comparing the values of these tracers in each segment with the values in the ambient GW samples [34].
This study investigates the impacts of the Sanmenxia Dam on the SW–GW interaction in the lower Weihe River Basin. The objectives of this study are (i) to identify the variations of SW–GW interaction under the impact of the Sanmenxia Dam, (ii) to reveal hydrochemical variations after the dam operation and anthropogenic inputs, and (iii) to obtain a reliable conceptual model of the SW–GW interaction at a typical cross-section.

2. Study Area

2.1. The Lower Weihe River

The Weihe River flowing across the southern part of the Loess Plateau is the largest tributary of the Yellow River in terms of the mainstream length (818 km) and the average annual runoff (6.8 billion m3). The Weihe River is also the main sediment source of the Yellow River, which delivers 44.7% of the total sediment load of the Yellow River. The Weihe River Basin with an area of 134,800 km2 is a water-deficient region in the belt of transition between semi-arid and sub-humid zones in China. The average annual temperature of the Weihe River Basin ranges from 6 to 14 °C, and the average annual precipitation is about 545 mm.
This study focuses on the lower Weihe River Basin, with coordinates between 109°12′ E and 110°13′ E and 34°22′ N to 34°50′ N (Figure 1). According to meteorological data from 1950 to 2015 collected from the China Meteorological Data Service Center, the average monthly temperature ranged from −7.0 °C in January to 26.4 °C in July. The average annual precipitation was 617 mm, and the rainfall from June to September accounted for about 64.4% of the annual precipitation. The average annual potential evapotranspiration was 941 mm. The elevations of the study area range from 243 to 2450 m above sea level and the topography of the south side is obviously higher than the north side. The Luohe River, one major tributary of the Weihe River (annual runoff of 0.9 billion m3), flows into the Weihe River in the Huayin County. The general geomorphic types in the research area are alluvial plain, diluvium-alluvial plain, and loess platform (Figure 1b). The alluvial plain is mainly distributed along the Weihe River. The phreatic aquifer in the alluvial plain is composed of Quaternary unconsolidated sediments with the thickness ranging from 10.5 to 63.5 m.

2.2. Sanmenxia Dam

The Sanmenxia Dam is located on the middle reach of the Yellow River (Figure 1b). The catchment area above the dam is about 690,000 km2, which accounts for 92% of the whole Yellow River Basin. The construction and water impoundment of the dam were initiated in 1957 and 1960, respectively. The designed normal water level of the dam is 350 m, and due to the estimate on the influence scope of the dam, over 187,000 people in the Weinan City, Dali County, Huayin County, and Huaxian County (Figure 1a) migrated from their original residences. After impoundment of the Sanmenxia Dam, a severe sedimentation problem became evident, especially in the lower Weihe River. The highest operation water level on record is about 333 m and the direct backwater boundary reached upstream to the Huaxian Station. In order to solve the sedimentation problem, the operation scheme of the dam had been changed twice, which also made the dam never meet the initial impounding expectation since its operation. The three operation modes were as follows: (i) storing water mode (Mode A), from September 1960 to March 1962, the reservoir maintained a high water storage level, (ii) detaining flood water and sluicing sediment mode (Mode B), from March 1962 to October 1973, the reservoir kept a low storage level, while detaining floods only during flood seasons (November to June) and sluicing sediment with relatively large discharges, and (iii) storing clear water and releasing muddy water mode (Mode C), from November 1973 to the present, the reservoir was operated at a high level to store relatively clear water in the non-flood seasons and at a low level to release high sediment concentrations in the flood seasons.
Time series data of the pool level of the Sanmenxia Dam during the flood and non-flood seasons and the whole year present a similar change process (Figure 2). It shows different variation character corresponding to each operation mode. The pool levels in Mode A increased and reached the highest. The pool levels in Mode B show an obvious downward trend. However, the pool levels in Mode C remain relatively stable after a rise that ends in 1980 (Figure 2). Thus, the impacts from the Sanmenxia Dam that were imposed on the lower Weihe River can be assumed generally unchanged since 1980.

3. Materials and Methods

3.1. Data Collection

The hydrochemical data in 1959 (Table S1 in Supplementary Materials) were collected from the results of a hydrogeological survey conducted by the Yellow River Conservancy Commission [36]. SW and GW samples form three campaigns in May, August, and November. A total of 19 SW samples (five sites from the Weihe River and two sites from the Luohe River) and 55 GW samples taken from phreatic wells (19 sites) which were adjacent to the Weihe and Luohe Rivers were chosen for this study (Figure 1a). The gridded meteorological data were from the China Meteorological Data Service Center. The discharge and water level of the Weihe River were measured daily at the Huaxian Station. The ambient GW levels were measured at least every five days at three monitoring wells (B18, B561, and B562). The population, fertilizer consumption, and groundwater exploitation data were gathered from the China’s economic and social big data research platform (http://data.cnki.net/) which collected statistical yearbooks of the Weinan City.

3.2. Water Sampling

Three field campaigns were conducted in October 2015, June 2016, and September 2016. A total of 22 SW samples (eight sites from the Weihe River, two sites from the Luohe River) and 41 GW samples taken from domestic and agricultural wells (21 sites, phreatic water) adjacent to the Weihe and Luohe Rivers were collected (Figure 1a and Table S1 in Supplementary Materials). The GW samples were taken after purging the wells for a few minutes at each site. The polyethylene bottles (50 and 100 mL) used as sample containers were pre-rinsed three times before sample collection and sealed with adhesive tape. All the water samples were store in the refrigerator at 4 °C after collection.

3.3. Analytical Techniques

Major ion compositions for each sample collected in 2015–2016 were measured at the Center for Physical and Chemical Analysis, the Institute of Geographic Sciences and Natural Resources Research (IGSNRR), Chinese Academy of Sciences (CAS). Major cations (Na+, K+, Ca2+, Mg2+) were measured on an inductively coupled plasma optical emission spectrometer (ICP-OES) (Perkin-Elmer Optima 5300DV, Waltham, MA, USA). Cl, SO42−, and NO3 were determined by an ion chromatography system (ICS1000). HCO3 was measured by the diluted vitriol-methylic titration method using 0.016 M H2SO4. The normalized inorganic charge balance (NICB) was applied to ensure the charge-balance error of the water sample was in a reasonable scope [37,38]. The results of the major ion compositions analysis were accepted when the charge-balance error was within ±10%.
Stable isotopes (δ2H and δ18O) of the water samples were measured at the Key Laboratory of Water Cycle and Related Land Surface Processes of IGSNRR, using a liquid water isotope analyzer (Model DLT-100, LosGatos Research Inc., San Jose, CA, USA) with measurement accuracies of ±1‰ and ±0.15‰ for δ2H and δ18O, respectively. All results were normalized to internal laboratory water standards (LRG3A, δ2H = −96.4‰, δ18O = −13.10‰; LRG4A, δ2H = −51.0‰, δ18O = −7.69‰; LRG5A, δ2H = −9.5‰, δ18O = −2.80‰) that were previously calibrated relative to the (VSMOW, 0‰). δ2H and δ18O values were reported in conventional per thousand deviations referred to the Vienna Standard Mean Ocean Water (V-SMOW, 0‰). Table S2 in Supplementary Materials shows the hydrochemical and stable isotopes data.

3.4. Statistical Method

The Mann–Kendall test (M-K test) is one of the widely used methods to detect trends of different time series [39]. The statistic S in the Mann–Kendall test is calculated as follow:
S = i = 1 n 1 j = i + 1 n s g n ( x j x i )   where   s g n = { + 1 , i f x j > x i 0 ,    i f x j = x i 1 , i f x j < x i
where x is the variable, n is the length of time series. If n is larger than 8, S will approximately follow a normal distribution [40]. The mean and variance of S can be acquired by Equations (2) and (3) below.
E ( S ) = 0
V a r ( S ) = n ( n 1 ) ( 2 n + 5 ) 18
The Z statistics for evaluating the trend is calculated by Equation (4):
Z = { S 1 V a r ( S ) i f S > 0 0      i f S = 0 S + 1 V a r ( S ) i f S < 0
A positive (negative) Z-value indicates an increasing (decreasing) trend. Z-value also can be used to check if the trend is significant at the selected significance level α. The null hypothesis that there is no significant trend will be rejected when |Z| > Z1−α/2.

4. Results

4.1. Water Level Variations

The Huaxian Station is a representative station with relatively continuous data for the study area. Moreover, most of the sediment deposition caused by the Sanmenxia Dam was in the downstream channel of the Huaxian Station [23], which may enhance the variation of SW–GW interaction. The temporal variations of the annual average SW level, ambient GW level, and precipitation can be seen in Figure 3a.
The trend of the annual average SW level and runoff were analyzed by the M-K test. Statistic Z of the SW level is 3.99 indicating a significant upward trend, while statistic Z of the runoff is −1.89 showing a downward trend. When the riverbed is stable, the river water level with given discharge is almost the same and the trends of river water level and runoff should be consistent. The inconsistent trends of the SW level and runoff at the Huaxian Station indicate that the riverbed has risen after the operation of the Sanmenxia Dam. The riverbed elevation at the Huaxian Station rose only 3 m during 2500 years from 540 BC to 1960 AD [41]. In 1959 (before the dam operation), the annual average SW level and runoff at the Huaxian Station are 333.4 m and 61.9 × 10⁸ m3, respectively. However, after 50 years of the dam operation (in 2010), the annual average SW level rose 3 m to 336.4 m with the annual average runoff of 60.2 × 10⁸ m3. It indicates that the dam operation might be responsible for the elevation of the SW level at the Huaxian Station.
The M-K test was also applied for the annual average GW level series. Statistic Z of the annual average GW at B18 from 1959 to 1985 is 1.56. The statistic Z of the annual average GW at B561 and B561 from 1976 to 2010 is −1.82 and −2.20. The different trends of the GW levels in different periods indicate that the controlling factor of the GW level has changed from 1959 to 2010. In order to seek the reason why the GW levels change, the correlation coefficients among the GW levels, SW level, and the precipitation were calculated and shown in Table 1. The GW levels at B18, B561, and B562 are highly correlated with each other. The GW level at B18 is from 1959 to 1985. The GW levels at B561 and B562 is from 1976 to 2010. The correlation coefficient of the GW level at B18 is significantly correlated to the SW level (0.01 level) and the precipitation (0.05 level). It demonstrates that the SW level and precipitation are the driving factors of the GW level from 1959 to 1985. However, the GW levels at B561 and B562 cannot present a significant correlation with the SW level or the precipitation. The GW exploitation data in the study area increased from 1980 to 2010 (Figure 4). The correlation coefficient between the GW levels and GW exploitation are −0.72 (B561) and −0.75 (B562), both negatively correlated at a significance level of 0.01, indicating that the driving factor of the GW level is groundwater exploitation after the 1980s across this region.
Figure 3b–e shows the relationship between the SW and GW levels. Before the dam operation, in 1959, the GW level at B18 is above the river stage at the Huaxian station (Figure 3b), which means the reach around the Huaxian Station is a gaining reach. After the dam operation, in 1981, the GW levels at B18, B561, and B562 are above the SW level in non-flood season and below the SW level in flood season (Figure 3c). In 2002 and 2010, the GW levels at B561 and B562 are below the SW level indicating a losing reach around the Huaxian Station (Figure 3d,e). The average GW at B18 is 335.34 m in 1981 and 335.60 m in 1959, while the average SW level at the Huaxian Station is 335.2 m in 1981 and 333.36 m in 1959, as shown in Table 2. It is obvious that the rising SW level is the main reason for the change of SW–GW interaction pattern from 1959 to 1981 near the Huaxian Station. The GW levels at B561 and B562 have dropped from 1981 to 2010, while the SW level is still ascending. Therefore, the rising SW level participated in the two shifts of the interaction pattern, which makes the upward SW level the primary cause for the interaction variations at the Huaxian Station.

4.2. Hydrochemical Characteristic in Waters

4.2.1. Hydrochemical Characteristics before the Dam Operation

In 1959, the TDS values of the SW samples vary from 159.1 (W1 in May) to 363.0 mg/L (W5 in May) in the Weihe River and from 330.0 (L1 in August) to 674.2 mg/L (L1 in May) in the Luohe River. The TDS values decrease along the flow direction in the Weihe River and stay almost the same in the Luohe River. The temporal variations of TDS in the Weihe and Luohe Rivers are also different. The former changes a little and the latter shows a sharp difference in three campaigns. The TDS values of the GW samples vary from 118.9 (B47 in May) to 2002.5 mg/L (B269 in November). The TDS values of GW in the southeast (including B144, B47, B50, B282, B41, and B245) are much lower than those in the rest part of the investigated area.
Na+ and HCO3 are the dominant ions of the SW samples, with concentrations varying from 17.3 to 143.0 mg/L and from 118.9 to 251.0 mg/L, respectively. The dominant cation in groundwater is Ca2+ in the southeast with concentrations varying from 20.2 to 77.8 mg/L a+ in the remaining part with concentrations ranging from 38.8 to 73.9 mg/L. The dominant anion in the GW samples is HCO3, which varies from 119.0 to 1296.7 mg/L and accounts for 69.3% of the anions on average.
The piper diagram can be used to distinguish different water types of the SW and GW samples in 1959 (Figure 5). The SW has a narrower range than the GW, plotting within Area 1 and Area 5, while the GW scatters in Areas 1, 4, and 5. Some GW samples plot adjacent to the SW on the diamond diagram, while others do not, indicating that the different patterns of SW–GW interaction may exist in the research area. Cl behaves relatively conservatively and is commonly used as a tracer [42,43]. In 1959, the rivers in the research can be separated into different segments by the SW sampling sites shown in Figure 6a,b. The tributaries of the lower Weihe River in the research area have little impact on the tracer values since the discharge of them is quite small. The ambient GW samples are also listed in Figure 6a,b. There are some river segments along which the concentrations of Cl increase (decrease) with much higher (lower) Cl values in the ambient GW (e.g., the segments L2-L1 in May, W2-W1 in August). It may imply that these river segments are gaining reaches. The remaining segments that have not shown such relationships may indicate losing reaches. The Huaxian Station is in the river segment W2-W1. In May, the Cl values decrease from 25.2 (W2) to 20.6 mg/L (W1) while the average Cl values in the ambient GW (B41 and B282) is 12.5 mg/L, which means that the segment is a gaining reach. It also occurs in August for the river segment W2-W1. The SW–GW interaction condition is consistent with the results obtained from the water level data before the dam operation.

4.2.2. Current Hydrochemical Characteristics

Na+ and HCO3 are the predominant ions of the SW, with concentrations ranging from 17.3 to 143.0 mg/L and 118.9 to 251.0 mg/L, respectively. The dominant cations of the GW are Ca2+ in the southeast with concentrations varying from 20.2 to 77.8 mg/L and Na+ in the remaining part with concentrations ranging from 38.8 to 73.9 mg/L. The dominant anion in GW is HCO3, which varies from 119.0 to 1296.7 mg/L and account 69.3% of the anions on average.
In 2015–2016, the TDS values of the SW samples vary from 479.3 (WP2 in June 2016) to 829.1 mg/L (WP6 in September 2016) in the Weihe River and from 871.3 (LP2 in May 2016) to 1194.1 mg/L (LP2 in September 2016) in the Luohe River. WP6 located in the lower reaches of the Weinan City shows higher TDS values than the remaining sites in the Weihe River, which may result from the untreated anthropogenic pollution. The TDS values of the GW samples vary from 159.3 (S4 in September 2016) to 3152.0 mg/L (S20 in June 2016). The TDS values of some GW samples in the southeast (including S3, S4, S6, S7, S8, S14, S15, and S16) are lower than in the remaining part of the research area.
Na+ is the predominant cation in the Weihe and Luohe Rivers, with concentrations ranging from 84.9 to 245.4 mg/L. None of the anions show obvious predominance in the Weihe and Luohe Rivers since HCO3, SO4, Cl accounts for average values of 29.5%, 36.0%, and 29.8% of the total anions, respectively. In general, the southeastern GW samples mentioned above have Ca2+ as the dominant cation and HCO3 as the dominant anion, while the remaining samples of GW have Na+ as the dominant cation and HCO3 as the dominant anion.
The piper plot can be used to show the variation in hydrochemistry of SW and GW sampled in 2015–2016 (Figure 5). The SW samples center in Areas 3 and 5, while the GW samples scatter in Areas 1, 3, and 5 with the exception of S5 and S12 located in Area 2. There are some GW samples plotting adjacent to the surface water, while the rest are not, indicating that different patterns of SW–GW interaction exist in the research area. Generally, the water samples in 2015–2016 move towards the apex of Cl + SO4 + NO3 compared to water samples of 1959 in Figure 5, which may suggest increased anthropogenic inputs in this region. Both Cl and NO3 are related to anthropogenic inputs and can be regarded as two indicator ions for human activity. The average concentration of NO3 in SW samples is 5.1 mg/L before the dam operation and 36.2 mg/L in current status, respectively. The average NO3 concentration in GW samples is 6.7 mg/L before the dam operation and 52.1 mg/L in current status, respectively. The average Cl concentration of in SW samples is 56.7 mg/L before the dam operation and 140.6 mg/L in current status, respectively. The average Cl concentration of in GW samples is 78.9 mg/L before the dam operation and 85.6 mg/L in current status, respectively. Furthermore, the extra Cl resulted from the anthropogenic inputs may disturb the SW–GW interaction deduced from the relationship between Cl values of SW and GW. Therefore, it might be more reliable to use other tracers like stable isotopes to obtain the SW–GW interaction pattern in 2015–2016.

4.3. Stable Isotope Characteristic in Water

The values of δ18O and δ2H in the Weihe River range from −8.6‰ to −7.8‰ and −64‰ to −51‰, respectively. The values of the Luohe River vary from −8.2‰ to −6.5‰ for δ18O and from −61‰ to −52‰ for δ2H, respectively. The compositions of groundwater range from −11.3‰ to −7.4 for δ18O and −80‰ to 53‰ for δ2H. The δ18O and δ2H values of SW and GW are plots in Figure 6. The global meteoric water line (GMWL, δ2H = 8δ18O + 10) [30], and the local meteoric water line (LMWL, δ2H = 7.49δ18O + 6.13, precipitation in the Xi’an Station, IAEA) are also shown in Figure 7. The water samples are scattered along the GWML and the LWML, indicating that both the SW and GW most likely come from modern precipitation.
The SW samples show a narrow range in Figure 7. The Luohe River water samples are more enriched in heavier isotopes than the Weihe River, probably resulting from the different evaporation rate of these two rivers. The GW samples show a broader range of stable isotopes than SW. Some GW samples are adjacent to the SW, possibly indicating the close interaction of the SW and GW. The average deuterium excess of the Weihe River (5.6‰) is close to the intercept of the local meteoric water line (6.13‰), so it can be assumed that the evaporation is not obvious. The average deuterium excess of the Luo River is only 0.1‰, which may imply that the evaporation in the Luohe River is significant. As Figure 6c,d shows, in 2016, there are also some river segments along which δ18O or δ2H enrich (deplete) with much higher (lower) tracer values in the ambient GW. It suggests these river segments are gaining reach, e.g., the segments LP2-LP1 in June, WP4-WP3 in August. The remaining segments that have not shown such relationships may indicate losing reaches. In June, the Huaxian Station is in the river segment WP5-WP3. δ18O enriches from −8.6‰ (WP5) to −7.8‰ (WP3) while the average δ18O value of the ambient GW (B41 and B282) is −7.8‰, indicating the segment is not a gaining reach. In September, the Huaxian Station is in the river segment WP6-WP4. δ18O enriches from −8.5‰ (WP6) to −8.1‰ (WP4) while the average δ18O value of the ambient GW (B41 and B282) is −8.8‰, showing that the segment is not a gaining reach. The SW–GW interaction is also consistent with the results deduced from the water level data in current status.

5. Discussion

5.1. Surface Water and Groundwater Interaction Variations

The Cl concentrations of the SW and GW alongside the rivers from two campaigns in May 1959 and August 1959 were selected to obtain the condition of the SW–GW interaction before the dam operation (Figure 6a,b). δ18O and δ2H values of surface water and groundwater alongside the rivers from two campaigns in June 2016 and September 2016 were selected to obtain the condition of the SW–GW interaction in the current status, as shown in Figure 6c,d. The variations of the SW–GW interaction along the Weihe and Luohe Rivers can be seen from Figure 6.
By comparing the interaction conditions before the dam operation and in current status (comparing May 1959 with June 2016; August 1959 with September 2016), several variations of the SW–GW interaction can be found. Before the dam operation, the channels upstream W3 are losing reaches, whereas the channels downstream W3 are gaining reaches. In current status, some channels downstream W3 are losing reaches, which may result from the rising SW level. As indicated by the relationship between SW level and ambient GW level at the Huaxian Station, an assumption can be made that the interaction pattern of SW–GW under the predominant impacts of the dam may shift from gaining reaches before the dam operation to losing condition after the dam operation. The shifting direction consistent with the assumption can be found along the reach from near WP5 to WP3 and the reach from near WP6 to WP5, indicating that the impact of Sanmenxia Dam on the interaction of SW–GW can affect as far as to WP6. The interaction pattern shifting from losing condition to gaining condition along the reach from WP8 to WP6 in August–September and the reach from LP2 to LP1 in May–June may result from the obvious decline of runoff in the Weihe and Luohe Rivers with the minor influence of the Sanmenxia Dam. In the current status, the reach WP2-WP1 nearest the Sanmenxia Dam is a losing reach in two campaigns, indicating the reach is under stronger influence of the dam than other river segments.

5.2. Anthropogenic Sources and Impacts on Surface Water and Groundwater

Human activity is one important factor influencing water quality. The general increase of the Cl and NO3 ions may result from the rapid growth of the population and the fertilizer consumption in this area from 1959 to 2020 [44,45]. The population and the fertilizer consumption increase from 158.4 to 325.9 million tons and from 0.1 to 12.4 million tons, respectively (shown in Figure 8). There are serval kinds of anthropogenic inputs including agricultural activities, domestic wastewater, and untreated industrial or urban sewage that may affect the SW and GW. The threshold values of Cl and NO3 that can be used to distinguish whether water samples are potentially affected by anthropogenic inputs can be estimated by cumulative probability plots [46,47] (Figure 9). By referring to the national standard of Cl (250 mg/L) and NO3 (10 mg/L), the background levels of Cl and NO3 (shown in Figure 10) are determined as 203.6 and 24.5 mg/L, respectively. Based on the background levels, four water types are identified among the water samples taken from sampling sites shown in Figure 1a for the research area. A detailed water type classification is provided as Figure 10a, the spatial distribution of the dominant anthropogenic input types for each sampling site are shown in Figure 10b,c. The percentages of each water type in different water bodies and periods are estimated and shown in Table 3.
All the SW samples in 1959 are below the threshold values of Cl and NO3 (Type A area) that can be identified as no obvious anthropogenic input. 72.7% of the SW samples in 2015–2016 are in Type B area. Since there is little application of chemical fertilizer in 1959, while chemical nitrogen fertilizer has been excessively used in China nowadays. Moreover, the SW samples in September 2016 have higher concentrations of NO3 than the samples in June 2016, showing the precipitation or irrigation during June to September has a positive influence on the concentrations of NO3 (e.g., the NO3 of WP2 is 28.2 mg/L in June and 40.8 mg/L in September). Therefore, the increased NO3 in SW may result from the polluted surface runoff flow through the agricultural areas [19]. A total of 12.7% of GW samples in 1959 are in Type B area. These GW samples are only distributed along the Luohe River and have not shown higher NO3 in August 1959 than that in May 1959, indicating that they are more likely affected by domestic sewage, which could have a minor relationship with precipitation or irrigation. A total of 34.1% of groundwater samples in 2015–2016 are in Type B area. The water samples BP5 and BP12 (Figure 10c), classified as Type B, have much greater NO3 (average value 224.5 mg/L) than that in the rest of the groundwater samples in Type B area (average value 49.9 mg/L). Since most of the cropland is in the northern Weihe River area, the agricultural activities may be responsible for the higher NO3 in BP5 and BP12. A well-established canal irrigation system is located in the northern Weihe River area and the main irrigation source is the river water already characterized as high NO3. The irrigation water with high NO3 and the return flow carrying nitrate from agricultural fertilizer together make S5 and BP12 heavily concentrate NO3. Most of the population gathers in the southern Weihe river area, so that BP9 and BP10 are more likely affected by domestic sewage. The GW samples of BP2, BP11, and BP17 are in Type C (Figure 10c) characterized as high Cl and low NO3. Anthropogenic sources of Cl such as fertilizers, wastewater, sewage, and manure can lead to higher NO3 values in GW. Since BP2, BP11, BP17 have little spatial connection and other samples near these sites are in Type B or Type A both having relatively low Cl concentrations, it is improbable that BP2, BP11, BP17 are obviously under the impact of saline water. These sites are in rural regions and relatively far from cities and counties. Therefore, there may be unregulated industrial waste discharge in BP2, BP11, and BP17 which is not rare in the rural areas of China [48]. There are no SW samples in Type C area, indicating no untreated industrial sewage directly draining into the Weihe and Luohe Rivers.
The different anthropogenic inputs into one part of the SW and GW may impact the other part through the SW–GW interaction. The industrial input in BP17 increases Cl in the Weihe River from WP6 to WP5 by the SW–GW interaction of GW recharging surface water in June 2016. The agricultural input from upstream area in WP1 may increase NO3 in BP2 by the SW–GW interaction of surface water recharging groundwater since the NO3 in BP2 has an upward trend in three campaigns from 2015 to 2016.

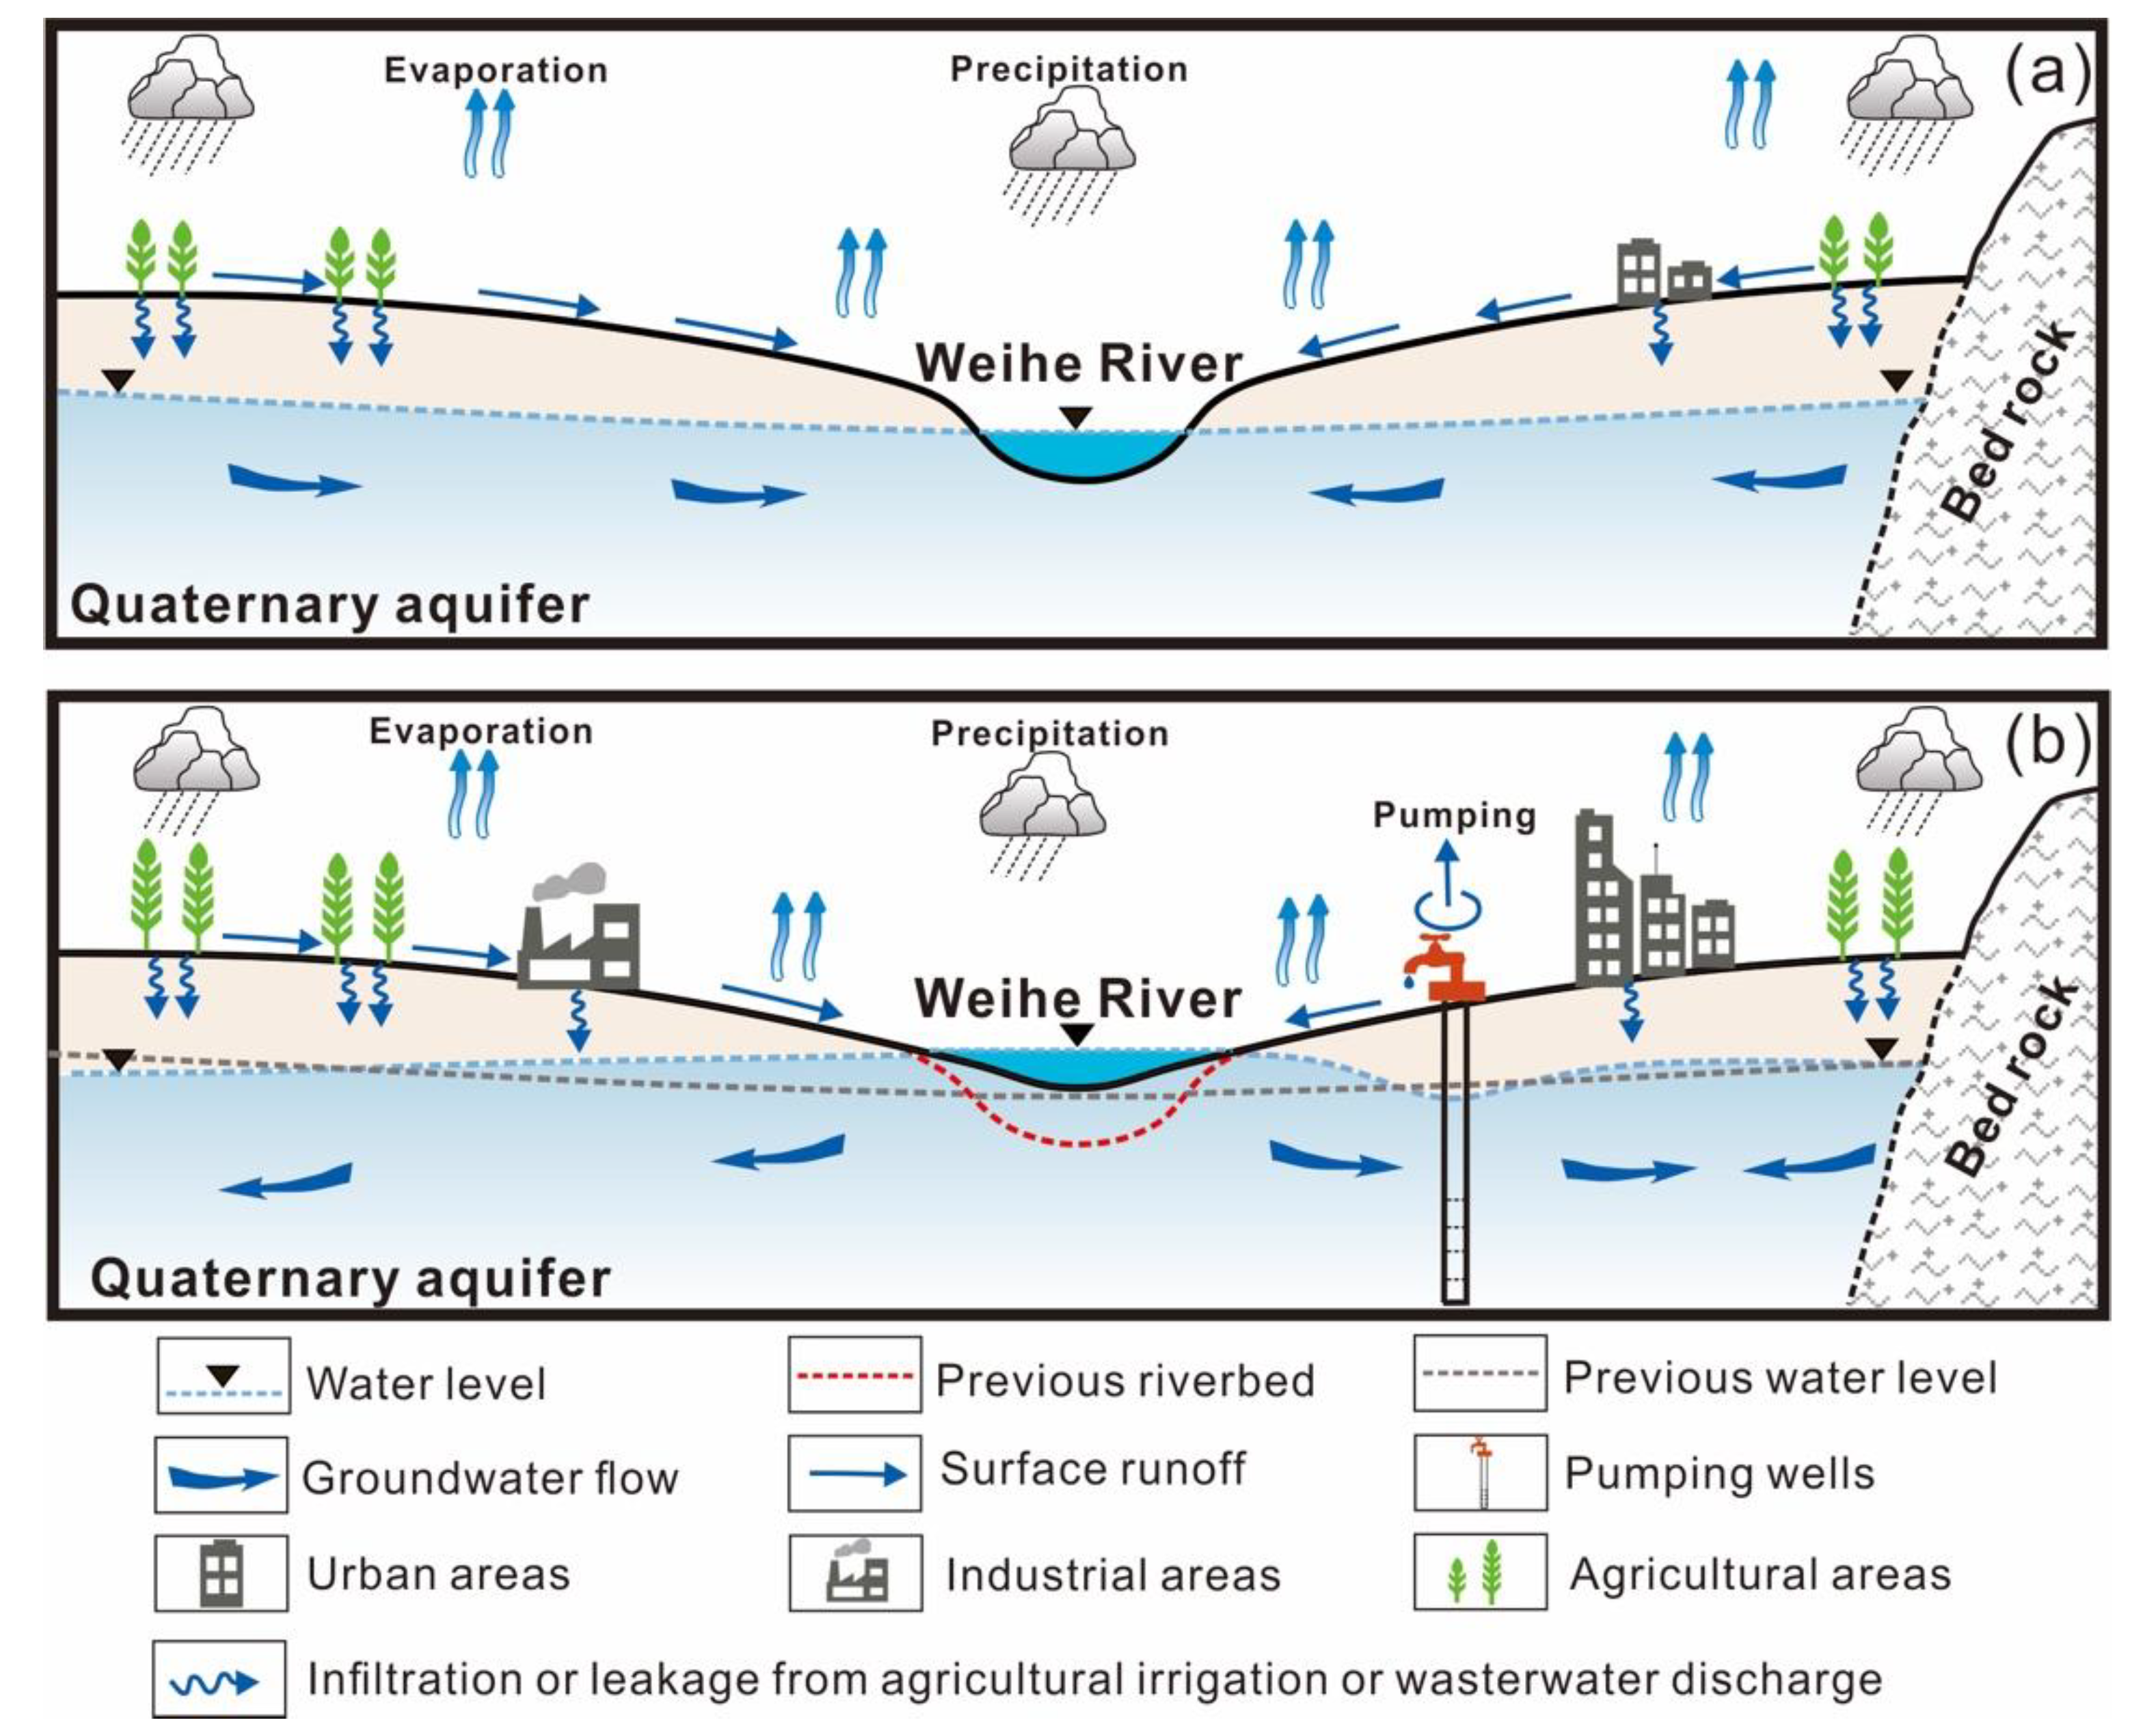
5.3. Conceptual Model and Environmental Implications

Previous studies have not paid much attention to the SW–GW interaction under the impact of the Sanmenxia Dam. However, the SW–GW interaction has changed since the Sanmenxia Dam operation. A conceptual model of the SW–GW interaction at a representative section (the Huaxian Station) is presented as Figure 11. In order to give some environmental implications, several components like unregulated rural industrial input and domestic input that are not found around the Huaxian Station at current status but appear in the whole research area are also integrated into this model. Thus, this model helps to draw a more comprehensive picture of the SW–GW interaction and the potential aquatic environment problems. The uplifted riverbed caused by the Sanmenxia Dam makes the river water level higher in the current status and eventually induces the variation of SW–GW interaction. Anthropogenic sources like industrial wastewater, domestic sewage, irrigation return flow, and surface runoff both affected by agricultural activities are also influencing the water quality.
The SW and GW are not two isolated parts but an interconnected system. The pollutants discharging into SW may migrate to GW, of which the inverse process can also happen in the lower Weihe River Basin, through the SW–GW interactions. Since the dam has an obvious impact on the interaction, it is essential to take the dam operation into account when coping with the serious water environment in this area.

6. Conclusions

The Sanmenxia Dam has dramatically increased the water level in the lower Weihe River since 1959. The SW level rise has inevitably affected the SW–GW interaction that plays a vital role in hydro-environment. Meanwhile, the lower Weihe River area is being faced with hydro-environment pressures. Therefore, it is crucial to assess the impact of the dam on the SW–GW interaction. The main conclusions of the study are as follows:
(1)
At the Huaxian Station, the dam operation plays a key role in raising the SW level. After the 1980s, the GW level decreased because of the increased groundwater exploitation. The variations of SW and GW levels induced the shift of SW–GW interaction. Three different patterns of the SW–GW interaction can be identified in the past 60 years including (i) gaining reach during the early stage (i.e., in 1959), (ii) gaining reach in non-flood season and losing reach in flood season (i.e., in 1981), and (iii) losing reach in 2002 and 2010.
(2)
Detailed SW–GW interaction patterns along the lower Weihe River are first examined from the multi-environmental tracers (Cl, δ18O, and δ2H) of the water samples. Before the dam operation, the channels upstream W3 are losing reaches, while downstream W3 are gaining reaches. In the current status, the distribution of SW–GW interaction along the Weihe River is more complex. Some channels downstream W3 are losing reaches, which may result from the rising SW level induced by the dam operation. Gaining reaches also appeared upstream W3, indicating the impact of the dam lessens as the distance increase. The impact of the dam on the SW–GW interaction can reach to W3 (65 km from the estuary of the Weihe River).
(3)
In general, the hydro-environment deteriorates in 2015–2016 especially for the NO3 and Cl concentrations as the population and fertilizer consumption escalated during the last 60 years. Four water types can be distinguished in the lower Weihe River Basin. No SW samples showed obvious anthropogenic input in 1959, but, in 2015–2016, 72.7% of SW samples (mean nitrate concentration of 34.7 mg/L) were affected by agricultural input. A total of 78.2% of the GW samples in 1959 show no obvious anthropogenic input, while 34.1% of GW samples (mean nitrate concentration of 124.7 mg/L) in 2015–2016 are affected by agricultural or domestic inputs. GW sampling sites of BP2, BP11, and BP17 (mean Cl concentration of 372.2 mg/L) might be affected by industrial input in the rural area.
(4)
Evidence has also shown that different SW–GW interaction patterns may produce different influences on the water system. The impacts of the dam which change the SW–GW interaction patterns and make the water system more variable present a challenge to water resource management in this area. Further research may focus on how the different SW–GW interaction patterns affect the pollutant migration and make a suitable operation mode of the dam to improve the local water resources management.

Supplementary Materials

The following are available online at https://www.mdpi.com/2073-4441/12/6/1671/s1, Table S1: Major ions and stable isotope concentrations in surface water and groundwater in 1959, Table S2: Major ions and stable isotope concentrations in surface water and groundwater in 2015–2016.

Author Contributions

Data curation, D.Z.; Formal analysis, D.Z.; Methodology, D.Z.; Supervision, D.H. and X.S.; Visualization, D.Z.; Writing—original draft, D.Z.; Writing—review and editing, D.H. and X.S. All authors have read and agreed to the published version of the manuscript.

Funding

This work is funded by Chinese Academy of Sciences (KJZD-EW-TZ-G10).

Conflicts of Interest

The authors declare no conflict of interest.

References

  1. Sophocleous, M. Interactions between groundwater and surface water: The state of the science. Hydrogeol. J. 2002, 10, 52–67. [Google Scholar] [CrossRef]
  2. Winter, T.C. Ground Water and Surface Water: A Single Resource; DIANE Publishing Inc.: Darby, PA, USA, 1998; Volume 1139. [Google Scholar]
  3. Essaid, H.I.; Caldwell, R.R. Evaluating the impact of irrigation on surface water—Groundwater interaction and stream temperature in an agricultural watershed. Sci. Total Environ. 2017, 599–600, 581–596. [Google Scholar] [CrossRef]
  4. Fernald, A.G.; Guldan, S.J. Surface Water–Groundwater Interactions Between Irrigation Ditches, Alluvial Aquifers, and Streams. Rev. Fish. Sci. 2007, 14, 79–89. [Google Scholar] [CrossRef] [Green Version]
  5. Dun, Y.; Tang, C.; Shen, Y. Identifying interactions between river water and groundwater in the North China Plain using multiple tracers. Environ. Earth Sci. 2013, 72, 99–110. [Google Scholar] [CrossRef]
  6. Jolly, I.D.; McEwan, K.L.; Holland, K.L. A review of groundwater-surface water interactions in arid/semi-arid wetlands and the consequences of salinity for wetland ecology. Ecohydrology 2008, 1, 43–58. [Google Scholar] [CrossRef]
  7. Woessner, W.W. Stream and fluvial plain ground water interactions: Rescaling hydrogeologic thought. Groundwater 2000, 38, 423–429. [Google Scholar] [CrossRef]
  8. Epting, J.; Huggenberger, P.; Radny, D.; Hammes, F.; Hollender, J.; Page, R.M.; Weber, S.; Banninger, D.; Auckenthaler, A. Spatiotemporal scales of river-groundwater interaction—The role of local interaction processes and regional groundwater regimes. Sci. Total Environ. 2018, 618, 1224–1243. [Google Scholar] [CrossRef]
  9. Graf, W.L. Dam nation: A geographic census of American dams and their large-scale hydrologic impacts. Water Resour. Res. 1999, 35, 1305–1311. [Google Scholar] [CrossRef]
  10. Lu, X.X.; Siew, R.Y. Water discharge and sediment flux changes over the past decades in the Lower Mekong River: Possible impacts of the Chinese dams. Hydrol. Earth Syst. Sci. 2006, 10, 181–195. [Google Scholar] [CrossRef] [Green Version]
  11. Kondolf, G.M.; Rubin, Z.K.; Minear, J.T. Dams on the Mekong: Cumulative sediment starvation. Water Resour. Res. 2014, 50, 5158–5169. [Google Scholar] [CrossRef]
  12. New, T.; Xie, Z.J.B. Impacts of large dams on riparian vegetation: Applying global experience to the case of China’s Three Gorges Dam. Biodivers Conserv 2008, 17, 3149–3163. [Google Scholar] [CrossRef]
  13. Francis, B.A.; Francis, L.K.; Cardenas, M.B. Water table dynamics and groundwater-surface water interaction during filling and draining of a large fluvial island due to dam-induced river stage fluctuations. Water Resour. Res. 2010, 46. [Google Scholar] [CrossRef]
  14. Arntzen, E.V.; Geist, D.R.; Dresel, P.E. Effects of fluctuating river flow on groundwater/surface water mixing in the hyporheic zone of a regulated, large cobble bed river. River Rese. Appl. 2006, 22, 937–946. [Google Scholar] [CrossRef]
  15. Gu, B.; Ge, Y.; Chang, S.X.; Luo, W.; Chang, J. Nitrate in groundwater of China: Sources and driving forces. Glob. Environ. Chang. 2013, 23, 1112–1121. [Google Scholar] [CrossRef]
  16. Yadav, R.K.; Goyal, B.; Sharma, R.K.; Dubey, S.K.; Minhas, P.S. Post-irrigation impact of domestic sewage effluent on composition of soils, crops and ground water—A case study. Environ. Int. 2002, 28, 481–486. [Google Scholar] [CrossRef]
  17. Sun, B.; Zhang, L.; Yang, L.; Zhang, F.; Norse, D.; Zhu, Z. Agricultural Non-Point Source Pollution in China: Causes and Mitigation Measures. AMBIO 2012, 41, 370–379. [Google Scholar] [CrossRef] [PubMed] [Green Version]
  18. Leschik, S.; Musolff, A.; Krieg, R.; Martienssen, M.; Bayer-Raich, M.; Reinstorf, F.; Strauch, G.; Schirmer, M. Application of integral pumping tests to investigate the influence of a losing stream on groundwater quality. Hydrol. Earth Syst. Sci. 2009, 13, 1765–1774. [Google Scholar] [CrossRef] [Green Version]
  19. Teng, Y.; Hu, B.; Zheng, J.; Wang, J.; Zhai, Y.; Zhu, C. Water quality responses to the interaction between surface water and groundwater along the Songhua River, NE China. Hydrogeol. J. 2018, 26, 1591–1607. [Google Scholar] [CrossRef]
  20. Weng, H.; Chen, X. Impact of polluted canal water on adjacent soil and groundwater systems. Environ. Geol. 2000, 39, 945–950. [Google Scholar] [CrossRef]
  21. Squillace, P.J.; Thurman, E.M.; Furlong, E.T. Groundwater as a nonpoint source of atrazine and deethylatrazine in a river during base flow conditions. Water Resour. Res. 1993, 29, 1719–1729. [Google Scholar] [CrossRef]
  22. Wang, G.; Wu, B.; Wang, Z.-Y. Sedimentation problems and management strategies of Sanmenxia Reservoir, Yellow River, China. Water Resour. Res. 2005, 41. [Google Scholar] [CrossRef] [Green Version]
  23. Wang, Z.Y.; Wu, B.; Wang, G. Fluvial processes and morphological response in the Yellow and Weihe Rivers to closure and operation of Sanmenxia Dam. Geomorphology 2007, 91, 65–79. [Google Scholar] [CrossRef]
  24. Li, J.; Li, H.; Shen, B.; Li, Y. Effect of non-point source pollution on water quality of the Weihe River. Int. J. Sediment Res. 2011, 26, 50–61. [Google Scholar] [CrossRef]
  25. Zhang, Z.M.; Wang, X.Y.; Zhang, Y.; Nan, Z.; Shen, B.G. The Over Polluted Water Quality Assessment of Weihe River Based on Kernel Density Estimation. Proced. Environ. Sci. 2012, 13, 1271–1282. [Google Scholar] [CrossRef]
  26. Oh, Y.-Y.; Hamm, S.-Y.; Yoon, H.; Kim, G.-B. Analytical and statistical approach for evaluating the effects of a river barrage on river-aquifer interactions. Hydrol. Process. 2016, 30, 3932–3948. [Google Scholar] [CrossRef]
  27. Kalbus, E.; Reinstorf, F.; Schirmer, M. Measuring methods for groundwater? surface water interactions: A review. Hydrol. Earth Syst. Sci. Discuss. 2006, 10, 873–887. [Google Scholar] [CrossRef] [Green Version]
  28. Lewandowski, J.; Lischeid, G.; Nützmann, G. Drivers of water level fluctuations and hydrological exchange between groundwater and surface water at the lowland River Spree (Germany): Field study and statistical analyses. Hydrol. Process. 2009, 23, 2117–2128. [Google Scholar] [CrossRef]
  29. de Brito Neto, R.T.; Santos, C.A.G.; Mulligan, K.; Barbato, L. Spatial and temporal water-level variations in the Texas portion of the Ogallala Aquifer. Nat. Hazards 2016, 80, 351–365. [Google Scholar] [CrossRef]
  30. Han, Q.; Zhang, S.; Huang, G.; Zhang, R. Analysis of Long-Term Water Level Variation in Dongting Lake, China. Water 2016, 8, 306. [Google Scholar] [CrossRef] [Green Version]
  31. Oyarzún, R.; Jofré, E.; Morales, P.; Maturana, H.; Oyarzún, J.; Kretschmer, N.; Aguirre, E.; Gallardo, P.; Toro, L.E.; Muñoz, J.F.; et al. A hydrogeochemistry and isotopic approach for the assessment of surface water–groundwater dynamics in an arid basin: The Limarí watershed, North-Central Chile. Environ. Earth Sci. 2014, 73, 39–55. [Google Scholar] [CrossRef]
  32. Yang, L.; Song, X.; Zhang, Y.; Han, D.; Zhang, B.; Long, D. Characterizing interactions between surface water and groundwater in the Jialu River basin using major ion chemistry and stable isotopes. Hydrol. Earth Syst. Sci. 2012, 16, 4265–4277. [Google Scholar] [CrossRef] [Green Version]
  33. Menció, A.; Mas-Pla, J. Assessment by multivariate analysis of groundwater–surface water interactions in urbanized Mediterranean streams. J. Hydrol. 2008, 352, 355–366. [Google Scholar] [CrossRef]
  34. Négrel, P.; Petelet-Giraud, E.; Barbier, J.; Gautier, E. Surface water–groundwater interactions in an alluvial plain: Chemical and isotopic systematics. J. Hydrol. 2003, 277, 248–267. [Google Scholar] [CrossRef]
  35. Zhu, M.; Wang, S.; Kong, X.; Zheng, W.; Feng, W.; Zhang, X.; Yuan, R.; Song, X.; Sprenger, M. Interaction of Surface Water and Groundwater Influenced by Groundwater Over-Extraction, Waste Water Discharge and Water Transfer in Xiong’an New Area, China. Water 2019, 11, 539. [Google Scholar] [CrossRef] [Green Version]
  36. National Earth System Science Data Center, National Science & Technology Infrastructure of China. Available online: http://www.geodata.cn (accessed on 8 February 2020).
  37. Huh, Y.; Tsoi, M.-Y.; Zaitsev, A.; Edmond, J.M. The fluvial geochemistry of the rivers of Eastern Siberia: I. tributaries of the Lena River draining the sedimentary platform of the Siberian Craton. Geochim. Cosmochim. Acta 1998, 62, 1657–1676. [Google Scholar] [CrossRef]
  38. Edmond, J.M.; Palmer, M.R.; Measures, C.I.; Grant, B.; Stallard, R.F. The fluvial geochemistry and denudation rate of the Guayana Shield in Venezuela, Colombia, and Brazil. Geochim. Cosmochim. Acta 1995, 59, 3301–3325. [Google Scholar] [CrossRef]
  39. Mann, H.B. Nonparametric test against trend. Econometrica 1945, 13, 245–259. [Google Scholar] [CrossRef]
  40. Zhang, Q.; Li, J.; David Chen, Y.; Chen, X. Observed changes of temperature extremes during 1960–2005 in China: Natural or human-induced variations? Theor. Appl. Climatol. 2011, 106, 417–431. [Google Scholar] [CrossRef]
  41. Zhang, G. Mechanism of Riverbed Aggradation at Tongguan Reach and Channel Shrinkage at Lower Weihe River. Master’s Dissertation, Xi’an University of Technology, Xi’an, China, 2002. [Google Scholar]
  42. Han, D.; Song, X.; Currell, M.J.; Cao, G.; Zhang, Y.; Kang, Y. A survey of groundwater levels and hydrogeochemistry in irrigated fields in the Karamay Agricultural Development Area, northwest China: Implications for soil and groundwater salinity resulting from surface water transfer for irrigation. J. Hydrol. 2011, 405, 217–234. [Google Scholar] [CrossRef]
  43. Solomon, D.K.; Cook, P.G. Environmental Tracers in Subsurface Hydrology; Springer: New York, NY, USA, 2000. [Google Scholar]
  44. Scanlon, B.R.; Jolly, I.; Sophocleous, M.; Zhang, L. Global impacts of conversions from natural to agricultural ecosystems on water resources: Quantity versus quality. Water Resour. Res. 2007, 43. [Google Scholar] [CrossRef] [Green Version]
  45. Ramakrishnaiah, C.R.; Sadashivaiah, C.; Ranganna, G. Assessment of Water Quality Index for the Groundwater in Tumkur Taluk, Karnataka State, India. E-J. Chem. 2009, 6, 757424. [Google Scholar] [CrossRef] [Green Version]
  46. Kumar, P.S. Evolution of groundwater chemistry in and around Vaniyambadi industrial area: Differentiating the natural and anthropogenic sources of contamination. Chem. Erde-Geochem. 2014, 74, 641–651. [Google Scholar] [CrossRef]
  47. Park, S.-C.; Yun, S.-T.; Chae, G.-T.; Yoo, I.-S.; Shin, K.-S.; Heo, C.-H.; Lee, S.-K.J.J.O.H. Regional hydrochemical study on salinization of coastal aquifers, western coastal area of South Korea. J. Hydrol. 2005, 313, 182–194. [Google Scholar] [CrossRef]
  48. Wang, M.; Webber, M.; Finlayson, B.; Barnett, J. Rural industries and water pollution in China. J. Environ. Manag. 2008, 86, 648–659. [Google Scholar] [CrossRef] [PubMed]
Figure 1. (a) Study area and relevant sampling sites; (b) locations of the study area and the Sanmenxia Dam; (c) geomorphic types in the study area.
Water 12 01671 g001
Figure 2. Pool level (water level in reservoir) of the Sanmenxia Dam from 1960 to 2015.
Water 12 01671 g002
Figure 3. Comparison of surface water (SW) level, groundwater (GW) level, runoff, and precipitation: (a) annual average SW level at Huaxian Station, GW level at B18, B561, B562, precipitation, runoff at Huaxian Station from 1959–2010; (be) SW level at Huaxian Station, GW level at B18, B561, B562 in 1959, 1981, 2002, 2010.
Water 12 01671 g003
Figure 4. Groundwater exploitation from 1980 to 2010.
Water 12 01671 g004
Figure 5. Piper plot for the SW and GW samples.
Water 12 01671 g005
Figure 6. Spatial distribution of the tracers and sketch map of SW–GW interaction patterns along the Weihe and Luohe Rivers, before the dam: (a) in May 1959, (b) in August 1959; in current status (c) in June 2016, (d) in September 2016. The segments of the rivers are separated by the surface water sampling sites named with the prefix of WP or LP.
Water 12 01671 g006
Figure 7. Relation between δ18O and δ2H of the SW and GW in 2015–2016.
Water 12 01671 g007
Figure 8. Variations of population and fertilizer consumption in the study area from 1959 to 2016.
Water 12 01671 g008
Figure 9. Plots of cumulative probability to determining the threshold values of (a) NO3 and (b) Cl.
Water 12 01671 g009
Figure 10. (a) Bivariate plot of Cl vs. NO3 for distinguishing water types (points below 1 mg/L are not shown); dominant water types in each sampling site: (b) before the dam operation, (c) present status.
Water 12 01671 g010
Figure 11. Conceptual diagram of the SW–GW interaction integrated with potential anthropogenic inputs: (a) before the dam operation, (b) at current status.
Water 12 01671 g011
Table 1. Correlation coefficient of the SW level, GW levels, and precipitation.
B18B561B562SWPrecipitation
B181
B5610.99 **1
B5620.97 **0.98 **1
SW0.85 **−0.32−0.351
Precipitation0.29 *0.200.210.291
** significant at 0.01 level, * significant at 0.05 level.
Table 2. Annual average water level at the Huaxian Station and groundwater level at B18, B561, and B562 in 1959, 1981, 2002, and 2010.
YearHuaxian Station (m)B18 (m)B561 (m)B562 (m)
1959333.36335.60--
1981335.21335.34335.15335.01
2002336.61-332.35331.10
2010336.44-334.29333.88
Table 3. Results of water type classification.
TypeRelative AbundancePeriodPercentage of Different Water Types
SWGW
ALow Cl–low NO3Pre 1100.0%78.2%
BLow Cl–High NO3Pre0.0%12.7%
CHigh Cl–low NO3Pre0.0%7.3%
DHigh Cl–High NO3Pre0.0%1.8%
ALow Cl–low NO3Post 213.6%43.9%
BLow Cl–high NO3Post72.7%34.1%
CHigh Cl–low NO3Post0.0%19.5%
DHigh Cl–high NO3Post13.6%2.4%
1 Pre means before operation, 2 Post means current status.

