Abstract
Macrophytes play a major role in the structuring of aquatic environments and may influence the distribution and feeding habits of fish species. We explored the microhabitat characteristics influencing the spatial distribution of newly discovered Coreoperca kawamebari (Temminck & Schlegel, 1843) in the upstream reaches of the Geum River. Out of 21 study sites, C. kawamebari was found in 10 sites, and its abundance was strongly positively correlated with “vegetated” microhabitats, especially those covered by elodeids (e.g., Ceratophyllum demersum). The utilization of elodeids by the piscivores fish, C. kawamebari, may limit the abundance of other native fishes, and stable isotope analysis also showed that C. kawamebari is likely to consume other fish species. However, the influence of other fish species on C. kawamebari is assumed to be small, considering that C. kawamebari is a latent predator. Although the abundance of other fish was low within the preferred microhabitat of C. kawamebari, other species were abundant in each site where C. kawamebari was dominant. From this finding, we conclude that the successful settlement of C. kawamebari in the upper section of the Geum River can be attributed to their habitat preferences. Although the elodeids favored by C. kawamebari generally have difficulty developing in the upstream section, the habitat creation by humans has contributed to the stable settlement of new fish species.
1. Introduction
The presence of well-distributed patches of favorable habitats is recognized as an essential factor in the creation of properly structured and stable fish communities. A spatially complex habitat may comprise a variety of microhabitats and can therefore support a diverse fish community with different habitat preferences [1,2]. However, spatial complexity may restrict access to preferred habitats and thereby limit species distribution [3]. Therefore, the costs and benefits of life-history strategies and behaviors in the fish community can depend on habitat heterogeneity [4,5]. Empirical studies have suggested that the predator–prey interaction significantly influences the patchiness of complex habitats [6,7,8].
Moreover, ecosystem processes that affect community structure and stability (e.g., disturbance, primary production, and bioenergetics) may also be influenced by habitat heterogeneity [9,10]. Fishes have evolved effective defense strategies to survive interactions, such as competition and predation, and actively adapt to new habitats [11,12]. In some cases, the effort to adapt to new habitats may be lower than the cost of competing with other animals. However, because most habitat adaptations require substantial energy expenditures, they are supported by small populations during the initial settlement phase. Nevertheless, many fish species choose to adapt to new habitats to reduce survival costs. This change occurs because the constant competition between diverse fish species within a habitat is too costly; thus, the higher the variety of habitats, the more fish species can be supported. Therefore, the examination of the spatial heterogeneity or patchiness may enable a deeper understanding of the patterns in the community structure and interactions between fishes.
Aquatic macrophytes are important in determining the spatial heterogeneity and dynamics of freshwater ecosystems, affecting both abiotic and biotic processes [13,14,15]. Distribution patterns of macrophyte species can lead to considerable structural variation within the aquatic ecosystems [16], and the vegetation provides refuge to prey communities (e.g., cladocerans and juvenile fish [17,18]) by hindering the foraging activity of carnivorous fishes [19,20]. Moreover, Choi et al. [21] suggested that the surfaces of macrophyte leaves and stems provide the optimal habitats for epiphytic species, providing an abundant food source in macrophyte-rich environments. This contrasts with the paucity of food in lakes and rivers with few aquatic macrophytes. Thus, the presence of plants means that the environment can support more abundant and biodiverse fish communities. Numerous studies [21,22,23,24,25] have investigated the influence of aquatic plants on predator–prey interactions to assess the role of habitat complexity. Moreover, the majority of studies focusing on interactions between plants and fish have emphasized the role of elodeids. These macrophytes increase the physical complexity in the water and reportedly provide suitable habitats for various fish species [26,27,28]. Previous studies have argued that elodeids contribute significantly to spatial distribution and interaction between fish communities by creating unique spaces in the waterbody.
This phenomenon means that the habitat space covered by aquatic macrophytes can support the introduction and settlement of various aquatic animals. However, for these benefits to be realized, there should be a relatively low level of predation and competition. For example, in stable environments such as wetlands, characterized by a high density of fish per unit area, fish distribution is determined by vertical or horizontal division [29,30]. Most of the animals newly introduced into these habitats will have difficulty in settling. Thus, not only physical factors, such as habitat complexity, but also the proper adjustment of interactions, such as competition and predation, can determine the successful settlement of new fish species. Recently, the transformation of freshwater ecosystems by humans has contributed to the creation of new habitats. A water channel cut off by a weir can lead to the introduction of new species by creating a lentic section in the downstream area [31,32], and aquatic macrophyte vegetation deliberately planted along the reservoir waterfront can shelter prey species from predators [33]. However, the introduction of new species can lead to the decline or emigration of native species because it induces habitat relocation and causes new interactions within the freshwater food web. Therefore, it is necessary to investigate the pattern of spread of the introduced species as well as the native species distribution through continuous monitoring—an exercise that is also required when introducing exotic species in an ecosystem.
In this study, it was noted that the upper parts of the Geum River in Korea were transformed by the River Refurbishment Project in 2012. In the past, the upper parts of the Geum River had fast-flowing water and sediment types such as boulders and pebbles, but now the river is substantially different. The main channel has been divided to create several small streams, and diverse macrophyte species, such as Paspalum distichum, Typha orientalis, and Ceratophyllum demersum, have been planted in the littoral area. In this study, taking advantage of this habitat change, the effect of a patchy habitat distribution on the abundance of Coreoperca kawamebari was evaluated. Coreoperca kawamebari was first found in the upper reaches of the Geum River during this study, and it was assumed that the introduction and settlement of this species was due to the aforementioned habitat changes. C. kawamebari is recognized as an endangered species in South Korea, and its habitat range is likely to decrease further due to environmental changes (e.g., water pollution) and habitat damage caused by human interference. However, only a few studies have been conducted on the morphological characteristics [34,35] and molecular systematics [36] of C. kawamebari, and their distribution and habitat preferences have been insufficiently investigated.
The primary objective of our study was to investigate the distribution pattern of C. kawamebari in relation to the potential drivers of their distribution; for example, the different microhabitat patches produced by aquatic macrophytes, sediment, and water flow. To characterize the structural complexity of the habitat, the local, fine-scale patch structure and the wide variation in plant abundance were considered. The spatial distribution of C. kawamebari was strongly related to changes in the river habitats brought about by the River Refurbishment Project. This study aimed to elucidate (1) changes in fish community structure and density concerning environmental variations and microhabitat patch types, (2) the influence of C. kawamebari distribution on microhabitat structure, and (3) the interaction between C. kawamebari and other fish species. It was predicted that the habitat patch change related to macrophytes would affect C. kawamebari distribution. To test this hypothesis, the upper parts of the Geum River in South Korea, which supports diverse microhabitat types and environmental variables, were surveyed. Furthermore, the significance of habitat management for the continuous preservation of C. kawamebari in the upper part of the Geum River was assessed.
2. Materials and Methods
2.1. Study Description
South Korea, located in East Asia, has a temperate climate. Four distinct seasons result in a dynamic succession of biological communities in the freshwater ecosystems of South Korea. The annual mean rainfall is approximately 1150 mm, more than 60% of which occurs from June to early September [37,38]. Our study sites were located in western South Korea, along the upper section of the Geum River (Figure 1). Although this area is located below the Yongdam Dam, which was completed in 2001, the river environment maintains a high diversity of water flow due to frequent dam discharge and a high gradient. The riversides were reorganized by the River Refurbishment Project in 2012, and the main river channel was divided to create various streams (Ministry of Land, Transport and Maritime Affairs, 2014). The most notable change is that the sediment types have increased silt or clay ratios, and diverse aquatic macrophytes have been planted.
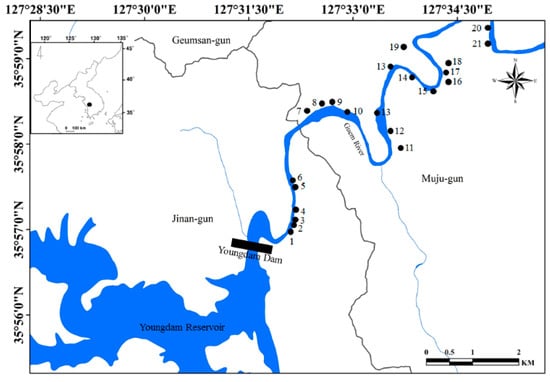
Figure 1.
Map of the study sites located upstream of the Geum River. The study sites are indicated by solid circles (●). The small map in the upper left corner shows the Korean peninsula.
A total of 21 study sites located in the upper parts (approximately 20 km) of the Geum River (Figure 1) were evaluated. Table 1 summarizes some of the main morphometric and limnological features of the study sites. The study site was on a small scale compared to natural streams, and the length and width of the study sites ranged from 157.3 to 564.3 m and 1.8 to 6.2 m, respectively. The study sites had relatively shallow depths, and the mean depth of each site ranged from 0.7 to 2.5 m. The water velocity and discharge of each study site were similar to that of the main river; thus, each study site had a proper gradient and water flow function of the inlet and outlet. Each wetland was characterized by a shallow littoral zone and a deeper limnetic zone, resulting in a clear separation of microhabitats. Macrophytes are abundant in and limited to the littoral zone. In the study site, the following eight macrophyte species were identified: Phragmites communis, Paspalum distichum, Zizania latifolia, Spirodela polyrhiza, Salvinia natans, Trapa japonica, Ceratophyllum demersum, and Hydrilla verticillate.

Table 1.
Limnological characteristics of 21 study sites located in the upper parts of the Geum River.
2.2. Monitoring Strategy
The study sites were surveyed from late May to early June 2018 (over four weeks), before the monsoon, to avoid any physical disturbance to the fish community distribution by the heavy rains. Three sampling points were randomly selected based on virtual grids constructed over the maps of each study site. At each sampling point, environmental variables and fish communities were investigated. Each sampling point was selected based on the habitat heterogeneity and length of the study site, and the points were separated by intervals of at least 50 m. Water temperature, pH, dissolved oxygen concentration (DO), conductivity, and turbidity were measured at the three sampling points in each study site. A DO meter (model 58; YSI Inc., Yellow Springs, OH, USA) was used to determine water temperature and dissolved oxygen, and conductivity and pH were recorded using a conductivity meter (model 152; Fisher Scientific, Hampton, NH, USA) and an Orion 250A pH meter (Orion Research Inc., Boston, MA, USA), respectively. Turbidity was measured using a turbidimeter (Model DRT 100B, HF Scientific, Inc., Fort Meyers, FL, USA).
The microhabitat and patch characteristics within 200 m upstream and downstream of each study site were delineated using a combination of remotely-sensed and field-collected data (see Kobayashi et al. [39]). Specifically, the area of each microhabitat patch type was measured using a geographic information system (GIS) program (ArcGIS 10.5.1) and a digital map (National Geographic Information Institute, 2016; 1:25,000). Characterized patches of the study area were obtained from satellite images (Daum Kakao Map) with a 50 cm resolution. Using this approach and guidelines adapted from Johansen et al. [40] and Holmes and Goebel [41], six patch types in the riverine habitat were identified as riffle, pool, shallow, boulder, sand/clay, and vegetated (see Table 1). Several microhabitat patches that were difficult to distinguish from satellite images were additionally identified through field surveys. Riffles were classified as areas with a steep surface and shallow depth relative to up and downstream areas, with a swift flow and usually broken surfaces (white-colored water). Pools were classified as areas with flat, smooth surfaces with greater depth relative to up and downstream areas. Shallows were classified as areas of less than 1 m depth, which could overlap with riffles and pools. The boulder classification was used to refer to patches with substrates consisting of stones larger than 256 mm. Sand/clay referred to areas with microscopic particles of 0.125–0.004 mm. Vegetated areas included those occupied by aquatic macrophytes, including helophytes, pleustophytes, and elodeids. The aquatic macrophyte species appearing at each study site were identified.
Fishes, including C. kawamebari, were also collected at three sampling points in each study site. Fishes were collected using a cast net (7 × 7 mm) and a scoop net (5 × 5 mm) along 50 m transects in each sampling point. At each sampling location, both a cast net and scoop net were used for 30 min and 20 min, respectively. Fish samples were identified at the species level, according to classification systems by Kottelat and Whitten [42] and Kim and Park [43]. However, the fish species that were difficult to identify in the field were fixed using a methanol–formaldehyde solution and then identified in the laboratory.
To understand the distribution of C. kawamebari concerning the microhabitat more clearly, two additional investigation strategies were implemented: (i) C. kawamebari distribution among four common microhabitat patch types (riffle, pool, shallow, and vegetated) in the three study sites (site numbers 2, 4, and 8) that had a high abundance of C. kawamebari, and (ii) C. kawamebari distribution in five vegetation types (namely, Phragmites communis, Paspalum distichum, Zizania latifolia, Ceratophyllum demersum, and Hydrilla verticillata). “Investigation strategy ii” was based on the results of “investigation strategy i”. Using data from “investigation strategy i”, the vegetated microhabitat types were subdivided into five vegetation categories, all of which supported a high abundance of C. kawamebari. This exercise was undertaken to identify the preference of C. kawamebari for habitat characteristics created by different aquatic macrophytes. In each habitat type (four microhabitat patch types and five vegetation types), 20 quadrats (2 m × 2 m) were established for C. kawamebari collection. The C. kawamebari distribution was investigated using the scoop net (5 mm × 5 mm) in each quadrat. Only the scoop net was used in the additional investigations, as in a previous fish survey, it was found that the cast net was not suitable for C. kawamebari collection. All the fish species collected from each vegetation type were collected to determine the relationship between C. kawamebari abundance and the abundance of fish other than C. kawamebari. The abundance of the various fish species, including C. kawamebari, was converted to the number of individuals per m2 (ind./m2).
2.3. Stable Isotope Analysis
In order to compare the trophic levels of C. kawamebari and native fish species using stable isotope analysis, we collected five fish species, including C. kawamebari, at three wetlands (sites 2, 4, and 8) in which C. kawamebari were abundant, from September to October. The four other selected fish species (Zacco platypus, Acheilognathus koreensis, Coreoleuciscus splendidus, and Pungtungia herzi) were the most dominant species in the spring survey. We captured as many fish individuals as possible in order to fulfill the minimum dry weight requirement for stable isotope analysis of at least 1.0 mg per sample.
The fish samples were rinsed with deionized distilled water to remove the acid. All samples were freeze-dried and then ground with a mortar and pestle. All powdered samples were frozen (−70 °C) until the analysis. Nitrogen isotope ratios were determined using continuous-flow isotope mass spectrometry (CF-IRMS, model-ISOPRIME 100; Micromass Isoprime, GV Instruments Ltd., Manchester, UK). Prior to the analysis, the samples were placed in a sealed CF-IRMS overnight, with a 99.999% He flow of a few mL/min. Instrument linearity (dependence of δ13C and δ15N on signal amplitude at the collectors) was tested daily and confirmed to be <0.03‰/nA over the range of 1–10 nA. We loaded 100 ± 10 μg silver-encapsulated cellulose samples (no carbon was added to the samples inside the capsules), producing a signal of approximately 4–6 nA at the collectors, in a 99-position zero-blank CF-IRMS and converted the samples to a mixture of carbon monoxide, carbon dioxide, water, and hydrogen gases over glassy carbon chips in a quartz tube at 1080 °C, within a stream of 99.999% carrier He flowing at 110 mL/min. The data were expressed as the relative per mil (‰) difference between the sample and the conventional standards of Pee Dee Belemnite carbonate for carbon and atmospheric N2 for nitrogen, according to the following equation:
where X is 15N and R is the 15N:14N ratio. A secondary standard of the known relationship to the international standard was used as a reference material. The standard deviations δ15N for 20 replicate analyses of the peptone standard (δ15N = 7.0‰, Merck, Rahway, NJ, USA) were ±0.2 (‰).
δ X (‰) = [(Rsample/Rstandard) − 1] × 1000
2.4. Data Analysis
Non-metric multidimensional scaling (NMDS) was used to examine fish distribution patterns according to variations (five environmental variables and six habitat patches). The NMDS ordination plots were generated based on Euclidean distance, and goodness of fit was assessed in terms of loss of stress. Each variation was log-transformed after being assessed for normality with the Shapiro–Wilk test. Rare fish species with a low frequency (i.e., five individuals per study site) were excluded from the ordination analysis, leaving 11 species for final analysis. The stress value for the two-dimensional solution was 0.112, which is lower than the generally accepted maximum stress value of <0.2 [44]. The significance of the fitted vectors was assessed using 3000 permutations, with P < 0.05 considered significant. NMDS ordination was conducted with the R package “vegan” (version 2.5-3; [45]).
Furthermore, one-way ANOVA was used to examine the following: (i) differences of environmental variables between study sites, and (ii) differences of C. kawamebari abundance in four microhabitat patch types and five vegetation types. Tukey’s test was used for additional post hoc comparison analysis to determine which differences were statistically significant. A regression analysis was implemented to observe the relationship between C. kawamebari abundance and the abundance of fish species other than C. kawamebari in the area covered by C. demersum, in which C. kawamebari was abundant. Linear, exponential, inverse, power, and logistic functions were tested to determine the equation generating the best curve fit. From the regression results, the curve-fitting equation that returned the highest determination coefficient was selected to explain the observed relationships. All statistical analyses were conducted using SPSS for Windows ver. 20 (IBM Corp. Released 2011. IBM SPSS Statistics for Windows, Version 20.0., Armonk, NY, USA: IBM Corp.). Differences and relationships were considered significant at P < 0.05.
3. Results
3.1. Environmental Variables, Microhabitat Patches, and Fish Distribution
Environmental variables and microhabitat patch types were different across the study sites (Table 2). Environmental variables from all study sites reflected the characteristics of a temperate river. There was little difference in the environmental variables of water, such as temperature, pH, DO, conductivity, and turbidity across the study sites (one-way ANOVA, P > 0.05). Although some study sites had exceptionally high or low values, the coefficients of variance (CV; standard deviation/mean × 100%) were lower than 100%. The DO tended to be highest in upstream parts (sites 1–12) of the investigated areas and showed a decreasing trend downstream (range 47.3–84.6%). In contrast, conductivity and turbidity values showed an increasing trend toward the downstream parts of the investigated areas. Microhabitat patch types varied across the study sites. Pool and sand/clay areas were larger toward the downstream parts of the investigated areas, whereas boulder and plant areas were larger toward the upstream regions. Areas of other microhabitat types (riffle and shallow) were randomly distributed across the study sites.
Table 2.
Environmental variables and microhabitat patch types at 21 study sites located in the upper parts of the Geum River. WT, water temperature (°C); DO, dissolved oxygen (%); Cond., conductivity (µg/L); Tur., turbidity (NTU); Veg., vegetated; SD; standard deviation; CV, coefficient of variation (%).
A total of 14 fish species were identified from 21 study sites (Table S1). Coreoperca kawamebari was the most common in the study sites (44%), followed by Zacco platypus (9.6%) and Acheilognathus koreensis (7.4%). Fishes such as Iksookimia koreensis, Odontobutis platycephala, and Pseudobagrus koreanus appeared to make up less than 1% of the communities. The abundance and numbers of fish species tended to decrease gradually from upstream to downstream. Comparing the study sites, it was found that the highest number of fish species was in sites 3 and 10 (10 species), followed by sites 2 and 5 (9 species). Sites 17, 19, 20, and 21 had the lowest number of fish species. Fish abundance was highest in sites 4 and 2, while site 17 had the lowest level of abundance.
The 11 dominant fish species were fitted to NMDS ordination axes, and we selected 11 variables (environmental variables and microhabitat patch types) that were significantly correlated with those axes (P < 0.05; Figure 2). The NMDS ordination produced two main groups based on environmental variables: microhabitat patch types and fish species. Acheilognathus lanceolata intermedia (Ali), Coreoleuciscus splendidus (Cs), Pseudopungtungia nigra (Pn), Pungtungia herzi (Ph), Zacco koreanus (Zk), Coreoperca herzi (Ch), and C. kawamebari (Ck) were frequently found in the upper sections of the study sites and were associated with higher DO, riffle, boulder, and vegetated areas (Figure 2; the area inside the green, dashed line). Notably, C. splendidus (Cs) and C. kawamebari (Ck) were more closely related to the vegetated areas than to the DO, riffle, or boulder areas. High densities of Z. platypus (Zp) and Lepomis macrochirus (Lm) were observed in the lower sections of study sites and showed strong relationships with turbidity and pool areas. However, distributions of A. koreensis (Ak) and Micropterus salmoides (Ms) were relatively irregular and were not related to environmental variables or microhabitat patch areas.
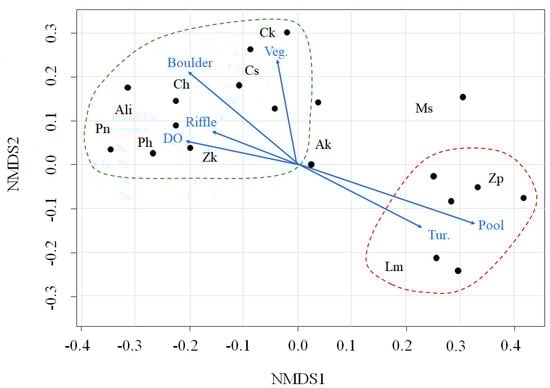
Figure 2.
Non-metric multidimensional scaling (NMDS) of 11 dominant fish species (letters) and 21 study sites (dots) located in the upper parts of the Geum River. The blue arrows represent the associations with environmental variables and microhabitat patch types. The data are divided into two groups (the dashed lines marked in green color and red color). DO, dissolved oxygen; Tur., turbidity; Veg., vegetated area; Ak, Acheilognathus koreensis; Ali, Acheilognathus lanceolata intermedia; Cs, Coreoleuciscus splendidus; Pn, Pseudopungtungia nigra; Ph, Pungtungia herzi; Zk, Zacco koreanus; Zp, Zacco platypus; Lm, Lepomis macrochirus; Ms, Micropterus salmoides; Ch, Coreoperca herzi, Ck, Coreoperca kawamebari.
3.2. Influence of Microhabitat on Coreoperca kawamebari Distribution
The target fish species, C. kawamebari, was observed at 10 of the 21 sites, and a total of 388 C. kawamebari were captured during the fish survey (Table S1, shown in Supplementary Material). Coreoperca kawamebari was present in the upper and middle parts (sites 2–12) of the investigated section. As mentioned above, they tended to be frequent in study sites with high water velocity (i.e., riffle) and dissolved oxygen (see Figure 2).
The abundance of C. kawamebari was statistically different across the four microhabitat patch types (riffle, pool, shallow, and vegetated; one-way ANOVA, P < 0.01; Figure 3). Among the four microhabitat patch types, the vegetated type had the highest abundance of C. kawamebari, followed by the pool. Although the C. kawamebari abundances between the pool and the two remaining habitat types (i.e., riffle and shallow) were statistically different (Figure 3a), they were similar to riffle and shallow in sites 4 and 8 (Figure 3b,c). The abundance of C. kawamebari also differed between the five vegetation types (one-way ANOVA, P < 0.01; Figure 4). This fish species was most abundant firstly in areas covered by C. demersum, and secondly in areas covered by H. verticillata. The remaining vegetation types (P. communis, P. distichum, and Z. latifolia) had similar abundances of C. kawamebari. These distribution patterns of C. kawamebari were found in all the study sites.
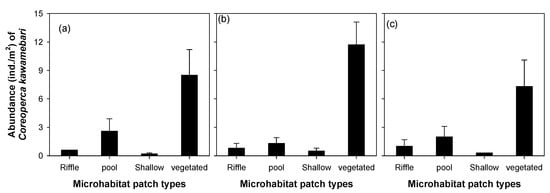
Figure 3.
Abundance of Coreoperca kawamebari according to four microhabitat patch types in three study sites (from the left, sites 2, 4, and 8) located in the upper parts of the Geum River. Means labeled with a different letter indicate statistical subgroups defined by the post hoc test (Tukey honest significant difference (HSD), P = 0.05). (a) site 2, (b) site 4, and (c) site 8.
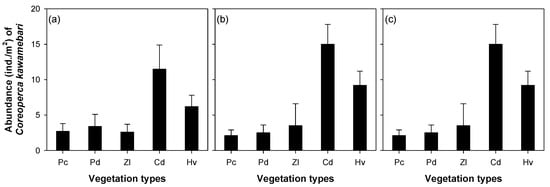
Figure 4.
Abundance of Coreoperca kawamebari according to five vegetation types in three study sites (from the left, sites 2, 4, and 8) located in the upper parts of the Geum River. Means labeled with a different letter indicate statistical subgroups defined by the post hoc test (Tukey honest significant difference (HSD), P = 0.05). Pc, Phragmites communis; Pd, Paspalum distichum; Zl, Zizania latifolia; Cd, Ceratophyllum demersum; Hv, Hydrilla verticillata. (a) site 2, (b) site 4, and (c) site 8.
Regression analysis (Figure 5) showed a clear relationship between the abundance of C. kawamebari and fish abundance, excluding C. kawamebari, in areas covered by C. demersum. A power function generated the highest coefficient of determination between the abundance of C. kawamebari and the abundance of other fish species. Although the coefficient values significantly differed between study sites, the vegetation type (i.e., the area covered by C. demersum) with a high abundance of fish species other than C. kawamebari showed a lower abundance of C. kawamebari. These relationships were found at all study sites.
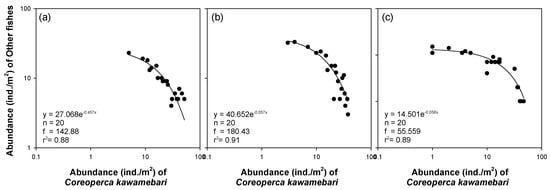
Figure 5.
Relationship between abundance of Coreoperca kawamebari and fish abundance, excluding C. kawamebari, in the area covered by Ceratophyllum demersum types in three study sites (from the left, sites 2, 4, and 8) located in the upper parts of the Geum River. (a) site 2, (b) site 4, and (c) site 8.
3.3. Stable Nitrogen Isotope Analysis between Dominant Fish Species
The δ15N value differed significantly between the five sampled fish species (one-way ANOVA, P < 0.05; Figure 6). The five species were divided into four subgroups (a group with C. kawamebari, b group with Z. platypus and A. koreensis, c group with C. splendidus, and d group with P. herzi) by the post hoc Tukey test. The δ15N value of C. kawamebari ranged from 17.2‰ to 22.8‰ and was heavier than that of the other four species. The next most substantial values were attributed to C. splendidus (17.0‰ to 18.8‰) and P. herzi (14.5‰ to 16.6‰). The δ15N values of Z. platypus and A. koreensis were the lightest (Z. platypus with 10.5‰ to 12.7‰, and A. koreensis with 11.7‰ to 13.6‰). The δ15N value of the five investigated fish species showed a similar pattern across the three sampled stream reaches.
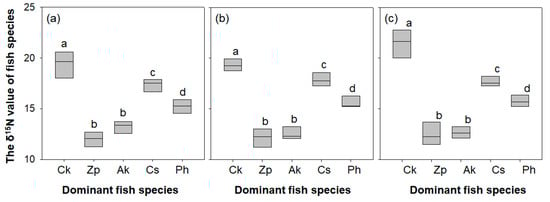
Figure 6.
The δ15N value of each fish species in three study sites (from the left, sites 2, 4, and 8) located in the upper parts of the Geum River. Ck, Coreoperca kawamebari; Zp, Zacco platypus; Ak, Acheilognathus koreensis; Cs, Coreoleuciscus splendidus; Ph, Pungtungia herzi. Means labeled with a different letter indicate statistical subgroups defined by the post hoc test (Tukey honest significant difference (HSD), P = 0.05). (a) site 2, (b) site 4, and (c) site 8.
4. Discussion
4.1. Influence of Environmental Variables and Microhabitat Patch Types on Fish Distribution
In this study, environmental variables and habitat patch types in each of the study sites strongly influenced fish communities. The NMDS ordination analysis of fishes collected in the study sites showed two distinct water flow-related main groups. The substrates of the study sites located in the upper section of the surveyed area were mainly the boulder type, which is characterized by rapid and diverse water flow, caused by the frequent merging and dividing of the currents (as a result, the study sites had many riffle areas). The environment of the upper section of study sites reflected the original environment of the upstream section of the Geum River. It provided habitats for fishes such as A. lanceolata intermedia, C. splendidus, P. nigra, P. herzi, Z. koreanus, and C. herzi. Previous studies have also suggested the presence of such fish species is frequent in the upper reaches of the Geum River [46,47]. Since the inflow section of these study sites is mostly designed to be strongly influenced by the water flow of the main Geum River, these study sites have many riffle sections with rapid water flow. However, the downstream study sites have more significant pools rather than riffles, creating environments with high turbidity. Fish species such as Z. platypus and L. macrochirus were frequently observed in the downstream study sites. Empirical studies also suggest that L. macrochirus is abundant in wetlands and shallow reservoirs with slow water flow—a pattern that is closely related to feeding habit and predator avoidance [28,48]. The wetlands and shallow reservoirs support not only diverse species of aquatic macrophytes but also create complex habitats and consequently can support a high density of food sources such as cladocerans and dragonfly larvae [49,50,51]. Although Z. platypus prefers an environment in which water flow is to some extent continuous [52,53], it is observed in a variety of environments because it has a relatively broad habitat range.
Interestingly, it was found that a large area of vegetated microhabitat exists in study sites in the upper section of the survey area. Despite the presence of many riffles, these study sites supported a substantial area of vegetated habitat. In general, the upstream sections were governed by rapid water flows and large-sized sediments and constituted an unsuitable habitat for the growth of aquatic macrophytes. It is noteworthy that aquatic macrophytes were planted in the upper reaches of the Geum River. Aquatic macrophytes are not endemic to these areas and occupied a large area, mainly around the waterfront; however, the study sites located downstream have a relatively small area occupied by vegetative microhabitat despite their slow water flow. The aquatic macrophytes planted in the study sites contribute significantly to the distribution of C. kawamebari. It was estimated that the introduction and settlement of C. kawamebari could be mainly attributed to habitat changes caused by the artificial plantation, given that the presence of C. kawamebari has not been previously reported in this area. In the upper reaches of the river, existing sheltered habitats such as stone crevices are used by native fish species; therefore, the newly settled C. kawamebari began competing with native species to secure hiding places. From this finding, it was deduced that the utilization of aquatic macrophytes by C. kawamebari is an evolutionary strategy to avoid competition with native fish species. Native fish species utilize existing habitats and are less likely to utilize new habitats because they have become adapted to this specific habitat over a long time.
4.2. Microhabitat Preference of Coreoperca kawamebari
In this study, a high abundance of C. kawamebari was found in areas with extensive aquatic macrophyte cover, whereas other microhabitat patch types (riffle, pool, and shallow) had low numbers of C. kawamebari. Centropomidae fishes, including C. kawamebari, generally prefer stone crevices or a space covered in aquatic macrophytes to open spaces and show low swimming ability [54]. Therefore, they are latent predators, hiding between aquatic macrophyte stems or in stone crevices and using a foraging strategy to capture prey in their proximity. Interestingly, of all the macrophytes, the elodeids, especially when they were abundant, tended to support a larger number of C. kawamebari. It was considered that the preference of C. kawamebari for elodeid-containing habitats developed from biological interactions, such as competition or predation. Empirical studies suggest that variations in the stem and leaf-forms between aquatic macrophyte species can lead to different water microhabitat structures and can determine the interaction between animals (particularly relationships between fish and zooplankton) [20,27]. Freshwater elodeids create a more heterogeneous water microhabitat than other plant types (e.g., emergent, free-floating, and floating-leaved macrophytes) and also provide an abundant food supply for aquatic animals and refuge from predators [55,56]. Previous studies suggest that elodeids effectively restrict the foraging activity of predators, such as piscivorous fishes [57,58]. The visual foraging activity of these predators significantly decreases in complex habitat structures, such as areas highly covered by elodeids, and can lead to a high density and diversity of prey items, such as Cladoceran and Odonatan larvae [27,59,60]. It is likely that the poor swimming abilities of C. kawamebari oblige it to exploit elodeids as a habitat, and that these macrophytes contribute to the successful survival and population growth of C. kawamebari. Our results imply that the space covered by aquatic macrophytes is more advantageous for capturing prey items than open areas.
Although a positive relationship between C. kawamebari and elodeids has been found in previous limnological studies, it is infrequent to find such a connection in the upper reaches of a river. The particular habitat (e.g., areas thickly covered by aquatic macrophytes) predilected by C. kawamebari is hard to find in the upper reaches of a river in South Korea. In most upstream ecosystems in South Korea, the river bed mainly comprises boulders or cobble and water flows rapidly. Environmental conditions such as these are not conducive to aquatic macrophyte development. Therefore, the distribution of C. kawamebari is restricted to short lengths of the Tamjin, Youngsan, and Nakdong rivers in South Korea [61], and the species is seldom, if ever, seen in other upstream reaches. Due to the unique habitat preferences of C. kawamebari, they are endangered in South Korea.
These distribution characteristics reflect the habitat preferences of C. kawamebari as compared to those of Coreoperca herzi from the same Centropomidae family [62]. As C. herzi prefers upstream regions with boulders or cobbles in the river bed, its habitat can be clearly distinguished from that of C. kawamebari [63]. Thus, C. herzi is frequently observed in most of the upstream regions in South Korea, whereas C. kawamebari restricts itself to certain areas only. Most fish species that inhabit upstream sections, such as C. herzi, crawl into cracks in boulders or lie close to the bottom of the stream [64]. Such a spatial distribution pattern might help the fish to avoid predators and withstand the rapid velocity of the stream [65]. Thus, habitat selection by fishes living in upstream reaches differs from that of fishes in the downstream reaches. The downstream sections have a low water level and gentle flow, allowing aquatic plant development, which promotes their active utilization as habitats by Carassius carassius or Erythroculter erythropterus [66,67]. However, upstream regions are almost entirely devoid of aquatic plants; therefore, fewer fish species that utilize aquatic plants as habitat are observed.
4.3. Impact of Coreoperca kawamebari in Native Fish Community
Stable nitrogen isotopes are frequently used to elucidate the interrelationships among freshwater organisms, allowing identification of not only the various prey items consumed by predators but also the trophic levels of species [68]. In general, nitrogen isotope concentrations in predators are higher (around 2‰ to 3‰) than those of prey species [69]. Thus, the δ15N values of various organisms can indicate competition or prey–predator relationships. In the present study, the trophic position of each investigated fish species was approximated based on δ15N values. It was found that the trophic position of C. kawamebari was higher than that of other native fish species, indicating that C. kawamebari is a secondary or tertiary consumer, consuming other fish species or large invertebrates. In this study, based on the difference in the δ15N value between C. kawamebari and the other four fish species, it was assumed that C. kawamebari consumed other fish species. Previous studies also argued that a latent predator consumes considerable amounts of young fish, as well as invertebrates, such as Ephemeroptera and Diptera [70]. The δ15N values for C. splendidus and P. herzi are 14‰ to 19‰, and this is consistent with the pattern of consuming aquatic insects found in previous studies [71,72]. Based on the trophic position of C. splendidus and P. herzi, which consume aquatic insects, we assume that C. kawamebari, with a relatively high value of δ15N, is a higher-level consumer than C. splendidus or P. herzi. In contrast, the δ15N values of Z. platypus and A. koreensis, which are believed to consume algae (i.e., periphyton) attached to stones or stems and leaves of aquatic macrophytes, are 10‰ to 14‰.
Interestingly, the regression analysis (Figure 5) showed that the abundance of other fish declined as C. kawamebari abundance increased in the C. demersum microhabitat it preferred. This observation indicates that the presence of C. kawamebari negatively affects other fish species and supports the results of the stable isotopes analysis, which showed that C. kawamebari tends to consume other fish species. However, the influence of other fish species on C. kawamebari was assumed to be minor, considering its poor swimming ability and foraging pattern (i.e., latent predator). Although the abundance of other fish was low within the microhabitat (i.e., the 2 × 2 m area covered by C. demersum) in which the C. kawamebari was dominant, the fish abundance (except C. kawamebari) was high in the (ca. 50 m) study site in which the C. kawamebari was dominant. Therefore, it was considered that the inverse correlation between C. kawamebari and other fishes was caused not by the foraging activity of C. kawamebari, but instead by other fishes avoiding the microhabitats where the abundance of C. kawamebari was high. The low abundance of C. kawamebari in areas covered by plant species other than C. demersum signified that there were plenty of refuges for fish preyed by C. kawamebari. Because C. kawamebari has poor swimming ability and stays in one area for a long time, it does not have a substantial impact on the density and population of other fishes. Therefore, C. kawamebari mostly inhabits areas dominated by C. demersum and has little impact on fish using habitats covered by plants other than C. demersum.
4.4. Conservation Strategy of Coreoperca kawamebari in South Korea
In this study, the first discovery of the occurrence of C. kawamebari in the upstream region of the Geum River is reported. In general, the migration of exotic species is explained by climate change effects, such as increased temperatures, or is the result of an invasion through national or regional exchanges; however, exotic species introduced into ecosystems with limited ranges, such as wetlands, are closely related to habitat change. For instance, Lepomis macrochirus spread throughout South Korean freshwater ecosystems with abundant macrophytes because the fish have access to food and refuge from predators in such habitats [23,28]. Habitat change directly encourages the spread of exotic species and leads to the formation of new interactions between organisms [73,74]. In particular, river channel transformation due to human intervention causes major disturbances and habitat changes in river ecosystems [75,76]. Physical disturbances such as the creation of dams and weirs, river channelization, and planting programs that feature in the “River Refurbishment Projects” are extremely disturbing, not only to the distribution of native animal species but also to intra and inter-species interactions. Such physical disturbances, such as the introduction of exotic species or the emergence of dominance by individual species, significantly impact biological ecosystems. In this study, it was assumed that the appearance of the newly discovered C. kawamebari occurred because of physical habitat changes in the upper reaches of the Geum River. The upper region of the Geum River, where the C. kawamebari was found, underwent a major change in the waterfront area due to the “River Refurbishment Project” in 2012. To date, several study sites have been created in the waterfront area in the upper part of the Geum River, and several aquatic macrophytes, such as P. distichum and C. demersum, have been planted. Such a favorable habitat change could explain the high abundance of C. kawamebari. In this study, C. kawamebari were abundant in study sites (sites 2, 3, 4, 6, 7, 8, and 9) in which the aquatic macrophyte covered substantial areas.
Although the stable settlement of C. kawamebari in the upper part of the Geum River was observed, it is not possible to conclude that physical habitat change (i.e., artificial plantation) is indeed a decisive factor in the upper river. As mentioned above, the upstream part of the river is not suitable for the aquatic macrophytes preferred by C. kawamebari. From this, it was deduced that C. kawamebari did not initially use aquatic macrophytes as a habitat in the upper reaches of the Geum River. However, because the C. kawamebari is relatively vulnerable to competition with other species, it survived using aquatic macrophytes as habitat. This was necessary because the stone crevices would typically be occupied by native fish species. At present, the occurrence of the endangered C. kawamebari in the upper reaches of the Geum River may be positive, but additional plantation to conserve their populations may adversely affect the native fish species. Currently, C. kawamebari is designated as an endangered species in South Korea due to a steady decline in population. It is sometimes considered to be an artificial disturbance caused by dam or weir construction. Based on this study, further investigation is needed to monitor changes in fish communities in the upper regions of rivers where physical habitats are being changed due to human intervention.
Although habitat changes caused by humans have led in this case to the stable settlement of the endangered C. kawamebari, many wetlands and streams are under serious threat due to human interference. Many study sites have suffered damage and undergone plant community change because of human disturbances, such as fishing and recreational activities. Summer recreational activities introduce pollutants and increase turbidity—essential factors that can change the growth and development of aquatic plants, including elodeids. These changes may be attributed to the deterioration of watersides (stream and wetland), both inlet and outlet, and the continuous erosion of the revetment slope. The leading cause for this phenomenon could be the high step caused by the lower water level of the main river due to the opening of the dam. This factor might negatively affect the population growth and spatial distribution of C. kawamebari in the area. Therefore, to secure the habitat of C. kawamebari, continuous maintenance of the watersides, including the streams and wetlands, is essential. The C. kawamebari distribution in the upper Geum may be considered a unique case in which an endangered species benefits from the creation of artificial watersides. In future, ecologically sound strategies based on habitat diversity are urgently required for the management and conservation of fish species.
Supplementary Materials
The following are available online at https://www.mdpi.com/2073-4441/12/6/1690/s1, Table S1: Fish species listed in 21 study sites.
Author Contributions
The design of this research was equally shared between the authors. Conceptualization, methodology, and investigation, J.-Y.C., S.-K.K., J.-C.K. and J.-H.Y.; data curation, formal analysis and writing of the original draft, J.-Y.C. and S.-K.K.; review and editing of the draft manuscript, J.-C.K., and J.-H.Y. All authors read and agreed to the published version of the manuscript.
Funding
This research was supported by the Basic Science Research Program through the National Research Foundation of Korea (NRF) funded by the Ministry of Education (grant number: NRF-2012-R1A6A3A04040793).
Conflicts of Interest
The authors declare no conflict of interest.
References
- Robinson, G.R.; Holt, R.D.; Gaines, M.S.; Hamburg, S.P.; Johnson, M.L.; Fitch, H.S.; Martinko, E.A. Diverse and contrasting effects of habitat fragmentation. Science 1992, 257, 524–526. [Google Scholar] [CrossRef] [PubMed]
- Fortuna, M.A.; Bascompte, J. Habitat loss and the structure of plant—Animal mutualistic networks. Ecol. Lett. 2006, 9, 281–286. [Google Scholar] [CrossRef] [PubMed]
- Schofield, P.J. Habitat selection of two gobies (Microgobius gulosus, Gobiosoma robustum): Influence of structural complexity, competitive interactions, and presence of a predator. J. Exp. Mar. Biol. Ecol. 2003, 288, 125–137. [Google Scholar] [CrossRef]
- Huntingford, F.A. Can cost-benefit analysis explain fish distribution patterns? J. Fish Biol. 1993, 43, 289–308. [Google Scholar] [CrossRef]
- Benard, M.F.; Mccauley, S.J. Integrating across life-history stages: Consequences of natal habitat effects on dispersal. Am. Nat. 2008, 171, 553–567. [Google Scholar] [CrossRef]
- Heck, K.L.; Crowder, L.B. Habitat structure and predator-prey interactions in vegetated aquatic systems. In Habitat Structure; Bell, S.S., Mccoy, E.D., Mushinsky, H.R., Eds.; Springer: Dordrecht, The Netherlands, 1991; pp. 281–299. [Google Scholar]
- Grabowski, J.H. Habitat complexity disrupts predator-prey interactions but not the trophic cascade on oyster reefs. Ecology 2004, 85, 995–1004. [Google Scholar] [CrossRef]
- Warfe, D.M.; Barmuta, L.A. Habitat structural complexity mediates the foraging success of multiple predator species. Oecologia 2004, 141, 171–178. [Google Scholar] [CrossRef]
- Walser, C.A.; Balt, H.L., Jr. Influence of agriculture on in-stream habitat and fish community structure in Piedmont watersheds of the Chattahoochee River system. Ecol. Freshw. Fish. 1999, 8, 237–246. [Google Scholar] [CrossRef]
- Hsieh, C.H.; Yamauchi, A.; Nakazawa, T.; Wang, W.F. Fishing effects on age and spatial structures undermine population stability of fishes. Aquat. Sci. 2010, 72, 165–178. [Google Scholar] [CrossRef]
- Koehn, J.D.; Hobday, A.J.; Pratchett, M.S.; Gillanders, B.M. Climate change and Australian marine and freshwater environments, fishes and fisheries: Synthesis and options for adaptation. Mar. Freshw. Res. 2011, 62, 1148–1164. [Google Scholar] [CrossRef]
- Bar, N.; Volkoff, H. Adaptation of the physiological, endocrine, and digestive system functions to prolonged food deprivation in fish. In Comparative physiology of Fasting, Starvation, and Food Limitation; McCue, M., Ed.; Springer: Berlin/Heidelberg, Germany, 2012; pp. 69–89. [Google Scholar]
- Benson, B.J.; Magnuson, J.J. Spatial heterogeneity of littoral fish assemblages in lakes: Relation to species diversity and habitat structure. Can. J. Fish. Aquat. Sci. 1992, 49, 1493–1500. [Google Scholar] [CrossRef]
- Jeppesen, E.; Lauridsen, T.L.; Kairesalo, T.; Perrow, M.R. Impact of submerged plants on fish-zooplankton interactions in lakes. In The Structuring Role of Submerged Plants in Lakes; Jeppesen, E., Søndergaard, M., Søndergaard, M., Christofferson, K., Eds.; Springer: New York, NY, USA, 1998; pp. 91–114. [Google Scholar]
- Thomaz, S.M.; Dibble, E.D.; Evangelista, L.R.; Higuti, J.; Bini, L.M. Influence of aquatic plant habitat complexity on invertebrate abundance and richness in tropical lagoons. Freshw. Biol. 2008, 53, 358–367. [Google Scholar]
- Weaver, M.J.; Magnuson, J.J.; Clayton, M.K. Distribution of littoral fishes in structurally complex plants. Can. J. Fish. Aquat. Sci. 1997, 54, 2277–2289. [Google Scholar]
- Santos, N.G.D.; Stephan, L.R.; Otero, A.; Iglesias, C.; Castilho-Noll, M.S.M. How free-floating macrophytes influence interactions between planktivorous fish and zooplankton in tropical environments? An in-lake mesocosm approach. Hydrobiologia 2020, 847, 1357–1370. [Google Scholar] [CrossRef]
- van Onsem, S.; de Backer, S.; Triest, L. Microhabitat-zooplankton relationship in extensive macrophyte vegetations of eutrophic clear-water ponds. Hydrobiologia. 2010, 656, 67–81. [Google Scholar] [CrossRef]
- Diehl, S. Foraging efficiency of three freshwater fishes: Effects of structural complexity and light. Oikos 1988, 53, 207–214. [Google Scholar] [CrossRef]
- Valley, R.D.; Bremigan, M.T. Effects of plant bed architecture on largemouth bass foraging: Implications of exotic plant invasions. Trans. Am. Fish. Soc. 2002, 131, 234–244. [Google Scholar] [CrossRef]
- Choi, J.Y.; Kim, S.K.; Jeong, K.S.; Joo, G.J. Distribution pattern of epiphytic microcrustaceans in relation to different macrophyte microhabitats in a shallow wetland (Upo wetlands, South Korea). Oceanol. Hydrobiol. Stud. 2015, 44, 151–163. [Google Scholar] [CrossRef]
- Dionne, M.; Folt, C.L. An experimental analysis of plant growth forms as fish foraging habitat. Can. J. Fish. Aquat. Sci. 1991, 48, 123–131. [Google Scholar] [CrossRef]
- Theel, H.J.; Dibble, E.D. An experimental simulation of an exotic aquatic plant invasion and its influence on foraging behavior of bluegill. J. Freshw. Ecol. 2008, 23, 79–89. [Google Scholar] [CrossRef]
- Gomes, L.C.; Bulla, C.K.; Agostinho, A.A.; Vasconcelos, L.P.; Miranda, L.E. Fish assemblage dynamics in a neotropical floodplain relative to aquatic plants and the homogenizing effect of a flood pulse. Hydrobiologia 2012, 685, 97–107. [Google Scholar] [CrossRef]
- Carniatto, N.; Fugi, R.; Thomaz, S.M.; Cunha, E.R. The invasive submerged plant Hydrilla verticillata as a foraging habitat for small-sized fish. Nat. Conserv. 2014, 12, 30–35. [Google Scholar] [CrossRef]
- Randall, R.G.; Minns, C.K.; Cairns, V.W.; Moore, J.E. The relationship between an index of fish production and submerged macrophytes and other habitat features at three littoral areas in the Great Lakes. Can. J. Fish. Aquat. Sci. 1996, 53, 35–44. [Google Scholar] [CrossRef]
- Manatunge, J.; Asaeda, T.; Priyadarshana, T. The influence of structural complexity on fish-zooplankton interactions: A study using artificial submerged macrophytes. Environ. Biol. Fish. 2000, 58, 425–438. [Google Scholar] [CrossRef]
- Choi, J.Y.; Kim, S.K. Effects of aquatic macrophytes on spatial distribution and feeding habits of exotic fish species Lepomis macrochirus and Micropterus salmoides in shallow reservoirs in South Korea. Sustainability 2020, 12, 1447. [Google Scholar] [CrossRef]
- Jackson, J.R.; Hightower, J.E. Reservoir striped bass movements and site fidelity in relation to seasonal patterns in habitat quality. N. Am. J. Fish. Manag. 2001, 21, 34–45. [Google Scholar] [CrossRef]
- Fernández, T.V.; D’anna, G.; Badalamenti, F.; Pérez-Ruzafa, A. Habitat connectivity as a factor affecting fish assemblages in temperate reefs. Aquat. Biol. 2008, 1, 239–248. [Google Scholar] [CrossRef]
- Maccarone, A.D.; Brzorad, J.N. Foraging behavior and energetics of great egrets and snowy egrets at interior rivers and weirs. J. Field Ornithol. 2007, 78, 411–419. [Google Scholar] [CrossRef]
- Mueller, M.; Pander, J.; Geist, J. The effects of weirs on structural stream habitat and biological communities. J. Appl. Ecol. 2011, 48, 1450–1461. [Google Scholar] [CrossRef]
- Gotceitas, V.; Colgan, P. Selection between densities of artificial vegetation by young bluegills avoiding predation. Trans. Am. Fish. Soc. 1987, 116, 40–49. [Google Scholar] [CrossRef]
- Kohda, Y.; Watanabe, M. Preference for vertical-striped backgrounds by the Oyanirami Coreoperca kawamebari, a freshwater Serranid. Ethology 1986, 72, 185–190. [Google Scholar] [CrossRef]
- Kohda, Y.; Watanabe, M. The Aggression-releasing effect of the eye-like spot of the Oyanirami Coreoperca kawamebari, a freshwater Serranid Fish. Ethology 1990, 84, 162–166. [Google Scholar] [CrossRef]
- Cao, L.; Liang, X.F.; Tang, W.; Zhao, J. Phylogeography of Coreoperca whiteheadi (Perciformes: Coreoperca) in China based on mitochondrial and nuclear gene sequences. Biochem. Syst. Ecol. 2013, 50, 223–231. [Google Scholar] [CrossRef]
- Choi, J.Y.; Jeong, K.S.; Kim, H.W.; Chang, K.H.; Joo, G.J. Inter-annual variability of a zooplankton community: The importance of summer concentrated rainfall in a regulated river ecosystem. J. Ecol. Environ. 2011, 34, 49–58. [Google Scholar] [CrossRef][Green Version]
- Jeong, K.S.; Kim, D.K.; Joo, G.J. Delayed influence of dam storage and discharge on the determination of seasonal proliferations of Microcystis aeruginosa and Stephanodiscus hantzschii in a regulated river system of the lower Nakdong River (South Korea). Water Res. 2007, 41, 1269–1279. [Google Scholar] [CrossRef]
- Kobayashi, S.; Nakanishi, S.; Akamatsu, F.; Yajima, Y.; Amano, K. Differences in amounts of pools and riffles between upper and lower reaches of a fully sedimented dam in a mountain gravel-bed river. Landsc. Ecol. Eng. 2012, 8, 145–155. [Google Scholar] [CrossRef]
- Johansen, K.; Phinn, S.; Witte, C. Mapping of riparian zone attributes using discrete return LiDAR, QuickBird and SPOT-5 imagery: Assessing accuracy and costs. Remote Sens. Environ. 2010, 114, 2679–2691. [Google Scholar] [CrossRef]
- Holmes, K.L.; Goebel, P.C. A functional approach to riparian area delineation using geospatial methods. J. For. 2011, 109, 233–241. [Google Scholar]
- Kottelat, M.; Whitten, T. Freshwater Biodiversity in Asia: With Special Reference to Fish; The World Bank: Washington, DC, USA, 1996. [Google Scholar]
- Kim, I.S.; Park, J.Y. Freshwater Fish of Korea; Kyo-Hak Publishing Co. Ltd.: Seoul, Korea, 2002. [Google Scholar]
- Clarke, K.R. Non-parametric multivariate analysis of changes in community structure. Aust. J. Ecol. 1993, 18, 117–143. [Google Scholar] [CrossRef]
- Oksanen, J.; Blanchet, F.G.; Kindt, R.; Legendre, P.; Minchin, P.R.; O’Hara, R.B.; Simpson, G.L.; Solymos, P.; Stevens, M.H.H.; Wagner, H. Package ‘Vegan’. Community Ecology Package, Version 2. Available online: http://cran.r-project.org/web/packages/vegan/index.html (accessed on 14 March 2020).
- Calderon, M.S.; An, K.G. An influence of mesohabitat structures (pool, riffle, and run) and land-use pattern on the index of biological integrity in the Geum River watershed. J. Ecol. Environ. 2016, 40, 13. [Google Scholar] [CrossRef]
- Kang, H.; Choi, B. Dominant fish and macroinvertebrate response to flow changes of the Geum River in Korea. Water 2018, 10, 942. [Google Scholar] [CrossRef]
- Stahr, K.J.; Shoup, D.E. The effects of macrophyte stem density and structural complexity on foraging return of invertivorous juvenile largemouth bass. N. Am. J. Fish. Manag. 2016, 36, 788–792. [Google Scholar] [CrossRef]
- van de Meutter, F.; Stoks, R.; de Meester, L. Behavioral linkage of pelagic prey and littoral predators: Microhabitat selection by Daphnia induced by damselfly larvae. Oikos 2004, 107, 265–272. [Google Scholar] [CrossRef]
- Estlander, S.; Nurminen, L.; Olin, M.; Vinni, M.; Horppila, J. Seasonal fluctuations in macrophyte cover and water transparency of four brown-water lakes: Implications for crustacean zooplankton in littoral and pelagic habitats. Hydrobiologia 2009, 620, 109–120. [Google Scholar] [CrossRef]
- Choi, J.Y.; Jeong, K.S.; Kim, S.K.; La, G.H.; Chang, K.H.; Joo, G.J. Role of macrophytes as microhabitats for zooplankton community in lentic freshwater ecosystems of South Korea. Ecol. Inform. 2014, 24, 177–185. [Google Scholar] [CrossRef]
- Katano, O.; Abe, S.I.; Matsuzaki, K.; Iguchi, K.I. Interspecific interactions between ayu, Plecoglossus altivelis, and pale chub, Zacco platypus, in artificial streams. Fish. Sci. 2000, 66, 452–459. [Google Scholar] [CrossRef]
- Fu, C.; Fu, S.J.; Yuan, X.Z.; Cao, Z.D. Predator-driven intra-species variation in locomotion, metabolism and water velocity preference in pale chub (Zacco platypus) along a river. J. Exp. Biol. 2015, 218, 255–264. [Google Scholar] [CrossRef]
- Nelson, J.A. Critical swimming speeds of yellow perch Perca flavescens: Comparison of populations from a naturally acidic lake and a circumneutral lake in acid and neutral water. J. Exp. Biol. 1989, 145, 239–254. [Google Scholar]
- Brönmark, C.; Vermaat, J.E. Complex fish-snail-epiphyton interactions and their effects on submerged freshwater plants. In The Structuring Role of Submerged Plants in Lakes; Jeppesen, E., Søndergaard, M., Søndergaard, M., Christoffersen, K., Eds.; Springer: New York, NY, USA, 1998; pp. 47–68. [Google Scholar]
- Blindow, I.; Hargeby, A.; Bálint, M.A.; Andersson, G. How important is the crustacean plankton for the maintenance of water clarity in shallow lakes with abundant submerged vegetation? Freshw. Biol. 2000, 44, 185–197. [Google Scholar] [CrossRef]
- Lauridsen, T.L.; Lodge, D.M. Avoidance by Daphnia magna of fish and macrophytes: Chemical cues and predator-mediated use of macrophyte habitat. Limnol. Oceanogr. 1996, 41, 794–798. [Google Scholar] [CrossRef]
- Moss, B.; Beklioglu, M.; Kornijow, R. Differential effectiveness of nymphaeids and submerged macrophytes as refuges against fish predation for herbivorous Cladocera. Int. Ver. Theor. Angew. Limnol. Verh. 1998, 26, 1863. [Google Scholar] [CrossRef]
- van Donk, E.; van de Bund, W.J. Impact of submerged plants including charophytes on phyto-and zooplankton communities: Allelopathy versus other mechanisms. Aquat. Bot. 2002, 72, 261–274. [Google Scholar] [CrossRef]
- Choi, J.Y.; Jeong, K.S.; La, G.H.; Kim, S.K.; Joo, G.J. Sustainment of epiphytic microinvertebrate assemblage in relation with different aquatic plant microhabitats in freshwater wetlands (South Korea). J. Limnol. 2014, 73, 11–16. [Google Scholar] [CrossRef]
- Kang, H.; Park, M.Y.; Jang, J.H. Effect of climate change on fish habitat in the Nakdong River watershed. J. Korea Water Resour. Assoc. 2013, 46, 1–12. [Google Scholar] [CrossRef][Green Version]
- KIM, S.H.; LEE, S.H.; LEE, W.O.; Cho, K.H. Distribution of Coreoperca kawamebari and C. herzi and fish community structure in relation to environmental differences in their sympatric area of the Boseong River, Korea. Korean J. Ecol. Environ. 2013, 46, 367–379. [Google Scholar] [CrossRef]
- Jang, M.H.; Lucas, M.C.; Joo, G.J. The fish fauna of mountain streams in South Korean national parks and its significance to conservation of regional freshwater fish biodiversity. Biol. Conserv. 2003, 114, 115–126. [Google Scholar] [CrossRef]
- Yoon, J.D.; Jang, M.H.; Joo, G.J. Effect of flooding on fish assemblages in small streams in South Korea. Limnology 2011, 12, 197–203. [Google Scholar] [CrossRef]
- Hurley, S.T.; Hubert, W.A.; Nickum, J.G. Habitats and movements of shovelnose sturgeons in the upper Mississippi River. Trans. Am. Fish. Soc. 1987, 116, 655–662. [Google Scholar] [CrossRef]
- Penttinen, O.P.; Holopainen, I.J. Seasonal feeding activity and ontogenetic dietary shifts in crucian carp, Carassius carassius. In Environmental Biology of European Cyprinids; Wieser, W., Schiemer, F., Goldschmidt, A., Kotrschal, K., Eds.; Springer: Dordrecht, The Netherlands, 1992; pp. 215–222. [Google Scholar]
- Lusardi, R.A.; Jeffres, C.A.; Moyle, P.B. Stream plants increase invertebrate production and fish habitat utilization in a California stream. River Res. Appl. 2018, 34, 1003–1012. [Google Scholar] [CrossRef]
- MacAvoy, S.E.; Macko, S.A.; Garman, G.C. Isotopic turnover in aquatic predators: Quantifying the exploitation of migratory prey. Can. J. Fish. Aquat. Sci. 2001, 58, 923–932. [Google Scholar] [CrossRef]
- DeNiro, M.J.; Epstein, S. Influence of the diet on the distribution of nitrogen isotopes in animals. Geochim. Cosmochim. Acta 1981, 45, 341–351. [Google Scholar] [CrossRef]
- Choi, J.Y.; Kim, S.K.; Kim, J.C.; Yoon, J.D. Trophic position and diet shift based on the body size of Coreoperca kawamebari (Temminck & Schlegel, 1843). J. Ecol. Environ. 2020, 44, 1–7. [Google Scholar]
- Kang, K.H.; Hur, J.W. Microhabitat assessment of three fish species to stream order in Geumgang River Basin. Ecol. Resil. Infrastruct. 2017, 4, 216–225. [Google Scholar]
- Lim, D.; Lee, Y.; Lim, D.; Lee, Y. Fish fauna and the population of a Korean endangered freshwater fish, Brachymystax lenok tsinlingensis, in Korea: Bonghwa habitat. Environ. Eng. Res. 2019, 24, 638–645. [Google Scholar] [CrossRef]
- Adams, M.J. Correlated factors in amphibian decline: Exotic species and habitat change in western Washington. J. Wildl. Manag. 1999, 63, 1162–1171. [Google Scholar] [CrossRef]
- Choi, J.Y.; Kim, S.K.; Kim, J.C.; Kwon, S.J. Habitat preferences and trophic position of Brachydiplax chalybea flavovittata Ris, 1911 (Insecta: Odonata) larvae in Youngsan River wetlands of South Korea. Insects 2020, 11, 273. [Google Scholar] [CrossRef]
- Brooks, A.P.; Brierley, G.J. Geomorphic responses of lower Bega River to catchment disturbance, 1851–1926. Geomorphology 1997, 18, 291–304. [Google Scholar] [CrossRef]
- Doering, M.; Blaurock, M.; Robinson, C.T. Landscape transformation of an Alpine floodplain influenced by humans: Historical analyses from aerial images. Hydrol. Process. 2012, 26, 3319–3326. [Google Scholar] [CrossRef]


© 2020 by the authors. Licensee MDPI, Basel, Switzerland. This article is an open access article distributed under the terms and conditions of the Creative Commons Attribution (CC BY) license (http://creativecommons.org/licenses/by/4.0/).