Article

Bioremediation of Landoltia punctata to Microcystis aeruginosa Contaminated Waters

Key Laboratory of Bio-Resource and Eco-Environment of Ministry of Education, College of Life Sciences, Sichuan University, No. 24 South Section 1, Yihuan Road, Chengdu 610065, China
*
Authors to whom correspondence should be addressed.
These authors contributed equally to this work.
Water 2020, 12(6), 1764; https://doi.org/10.3390/w12061764
Submission received: 19 May 2020 / Revised: 16 June 2020 / Accepted: 17 June 2020 / Published: 21 June 2020
(This article belongs to the Section Water Quality and Contamination)

Abstract

:
Microcystis aeruginosa is one of the dominant algae in the “phytoplankton bloom” phenomenon. A high density of microcystins (MCs) are produced when algae have explosive growth, which can damage the water environment and pose a great threat to aquatic animals, plants, and human health. Duckweed (Landoltia punctata) is a morphologically highly degraded flowering plant with a short growth cycle and wide environmental adaptability. Importantly, duckweed can grow in eutrophic water and has great potential in water remediation. The present study aims to analyze the physiological and biochemical changes of L. punctata when co-culturing with M. aeruginosa in the laboratory. Our results showed that all the biomass, chlorophyll content, antioxidant enzyme activities, and amylase activity of L. punctata increased in 2 × 10⁸ cells/L and 4 × 10⁸ cells/L for M. aeruginosa, and also significantly reduced in 1.6 × 10⁹ cells/L for M. aeruginosa, while cytotoxic substance (malondialdehyde (MDA)) content showed a completely opposite trend. After co-culturing, it was found that the MC content in L. punctata reduced to 138.87 g/g, and the MC removal rate was 29.48%. These results indicate that L. punctata can grow normally in high-density M. aeruginosa, which paves the way for L. punctata’s bioremediation of water polluted by M. aeruginosa.

1. Introduction

Over the years, the intensification of surface water eutrophication has become the most important problem of water quality worldwide [1]. One of the numerous consequences of this process is the increase of algae in their frequency and biomass. Among bloom-forming algae, M. aeruginosa is one of the most intensively studied species [2]. During the growth process of M. aeruginosa, a large amount of microcystins (MCs) is generated, which poses a serious threat to the ecological environment. Various methods are used to counteract algae blooms and their consequences, including physical repair, chemical control, and bioremediation. Due to the inexpensive and high-efficiency features on water remediation, the chemical method is prevalently utilized in practice. However, it has certain limitations and easily causes secondary pollution to the water environment. Hence, phytoremediation, a cost-effective and environmentally friendly method, is of great interest [3,4]. As a new type of environmental and energy plant, duckweed has the advantages of high biomass and significant removal of nitrogen and phosphorus from water bodies. It has the characteristics of low energy consumption, low cost, and environmental friendliness in the treatment process [5], thus proving to be a good application prospect in environmental pollution control [6].
“Phytoplankton bloom” often occurs in eutrophic water bodies, of which the main reason is the explosive growth of phytoplankton, especially algae. M. aeruginosa, a member of microcystis, is one of the dominant algae species in “phytoplankton bloom”, during which a lot of MCs are produced [7]. MCs is a class of cyclo-heptapeptide compounds with strong toxicity to liver function [8], and with their unique structure, they show high resistance to adverse conditions (e.g., pH, high temperature) [9,10]. Consequently, the removal of MCs becomes an immediate challenge ahead [11]. Studies have shown that the content of MCs deceased after co-culturing with duckweed in wastewater [6]. More importantly, the growth of duckweed was not compromised at all [12], which made the co-culturing of duckweed and M. aeruginosa a potential approach to remove MCs, and showed great research significance.
In the present work, L. punctata and M. aeruginosa were subjected for co-culturing in eutrophic water for 15 days. The biomass, chlorophyll content, antioxidant enzyme activity, malondialdehyde (MDA) content, amylase activity, and starch content of L. punctata were measured after co-cultivation. In addition, the removal efficiency of MCs and the remediation efficiency of wastewater were also estimated. Our results show that L. punctate can significantly reduce the content of MCs, total phosphorus (TP), and total nitrogen (TN) water polluted by M. aeruginosa, which could provide experimental basis for water remediation through the application of L. punctate.

2. Materials and Methods

2.1. Experimental Organisms

M. aeruginosa (FACHB-930) was purchased from the freshwater algae species bank of Wuhan Institute of Aquatic Biology, Chinese Academy of Sciences, cultured and amplified with BG11 culture medium. L. punctata (ZH0051), obtained from the Chengdu Institute of Biology, Chinese Academy of Sciences, was used with 1/5 Hoagland medium for proliferation.

2.2. Medium Formula and Culture Conditions

2.2.1. BG11 Culture Medium

NaNO3 1.5 g/L; K2HPO4 0.04 g/L; MgSO4·7H2O 0.075 g/L; CaCl2·2H2O 0.036 g/L; Citric acid 0.006 g/L; Ferric ammonium citric 0.006 g/L; EDTA·Na2 0.001 g/L; Na2CO3 0.02 g/L; A5: H3BO3 2.86 g/L, MnCl2·4H2O 1.86 g/L, ZnSO4·7H2O 0.22 g/L, Na2MoO4·2H2O 0.39 g/L, CuSO4·5H2O 0.08 g/L, Co(NO3)2·6H2O 0.05 g/L. The pH value of the culture medium was adjusted to 6.5, and reserved after sterilization. M. aeruginosa was inoculated in BG11 culture medium and culture in a light incubator with a temperature of 25 °C, light intensity of 2000 lux, and 16 h/8 h photoperiod.

2.2.2. Hoagland Culture Medium

Stock Solution I: Ca(NO3)2·4H2O 59 g/L, KNO3 75.76 g/L, KH2PO4 34 g/L, HCl 6 mol/L, MgSO4·7H2O 50 g/L; Stock Solution II: FeCl3·6H2O 5.4 g/L; Stock Solution III: EDTA 9 g/L, KOH 6 mol/L; Stock Solution IV: Tartaric acid 3 g/L; Stock Solution V: H3BO3 2.86 g/L, ZnSO4·7H2O 0.22 g/L, Na2MoO4·2H2O 0.12 g/L, CuSO4·5H2O 0.08 g/L, MnCl2·4H2O 3.62 g/L. The prepared Hoagland culture solution was diluted with distilled water five times, and then reserved. L. punctata was inoculated in Hoagland culture medium and culture in a light incubator with a temperature of 23 °C, light intensity of 2000 lux, for 16 h/8 h.

2.3. Experimental Design

Hoagland medium was used for the laboratory experiment, and the average culture temperature was 23 °C, along with a 16 h/8 h photoperiod. The experiment was performed in 17.5 cm × 12.5 cm × 5.5 cm (1 L) plastic containers, which were filled with 800 mL one fifth of Hoagland medium. M. aeruginosa was cultured in BG11 medium until the algae density reached 107 cells/mL, then M. aeruginosa was inoculated into one fifth of Hoagland medium, with the final density being 0 cells/L, 2 × 10⁸ cells/L, 4 × 10⁸ cells/L, 8 × 10⁸ cells/L, and 1.6 × 10⁹ cells/L, respectively. Except for the control group, the densities of M. aeruginosa all reached the “phytoplankton bloom” level, according to the classification criteria posed by [13]. L. punctata with good growth states were selected, cleaned with distilled water several times, then co-cultured with the above M. aeruginosa at a density of 200 mg/m2 (fresh weight). After 15 days of co-culture, the biomass, chlorophyll content, amylase activity, starch content, antioxidant enzyme activities, and malondialdehyde (MDA) content of L. punctata were determined. Besides, the MC content in both the culture medium and L. punctata were also determined. Of the Hoagland medium solution, 1/5 was supplemented during the whole experiment process, and each treatment included three replications. Each replication was measured three times, and the average value was taken.

2.4. Experimental Methods

2.4.1. Determination of Growth Status of L. punctata

The samples were harvested by collecting 75% of the container volume of L. punctata from the co-culture, followed by being rinsed with tap water many times, filled in nylon mesh bags, dehydrated for 5 min with a dehydrator, and dried on filter paper. The fresh weight of the sample was measured by using Bergmann’s method [14]. The fresh weight growth rate = final fresh weight (g)/initial fresh weight (g) [15].

2.4.2. Screening Co-Culture Density of L. punctata and M. aeruginosa

The fresh weight growth rate of L. punctata at inoculation densities of 100 g/m2, 200 g/m2, 400 g/m2, and 800 g/m2 was determined when cultured alone, and the fresh weight growth rate after co-culturing with a series of M. aeruginosa was also determined as the screening basis of experimental co-culture density. For dry weight determination, 5 g fresh-weight L. punctata was dried to constant weight in an oven at 50 °C and reweighed. The chlorophyll content was measured form 0.1 g fresh-weight L. punctata, based on the method mentioned by Arnon [16].

2.4.3. Determination of Antioxidase Activities of L. punctata

For the determination of antioxidase activities of L. punctata, 0.1 g of duckweed (fresh weight) was homogenized in 1 mL PBS on ice for extraction, the homogenate was centrifuged at 4 °C for 10 min, and the supernatant sampled for measurement. The activities of ascorbate peroxidase (APX), catalase (CAT), peroxidase (POD), and superoxide dismutase (SOD) were detected, and malondialdehyde (MDA) content was measured following the instructions of the corresponding assay kit (Keming Biotechnology Co., Ltd., Suzhou, China). Amylase activity was determined by using 3,5-dinitrosalicylic acid colorimetry, and starch content was determined by anthrone colorimetry, referring to the instructions of the amylase kit and plant starch content kit (Keming Biotechnology Co., Ltd., Suzhou, China).

2.4.4. Determination of MC Content

The MC content was determined by using the double antibody sandwich method, referring to the instructions of the ELISA kit of the Shanghai Enzyme-linked Biological Company.

2.4.5. Determination of Removal Rate of TN and TP

The content of TN was determined by using ultraviolet spectrophotometry with alkaline potassium persulfate digestion, and determination of TP content was done by ammonium molybdate spectrophotometry.

2.5. Statistical Analysis

All data shown in the figures were the mean of three replicated independent determinations and were statistically analyzed using IBM SPSS Statistics 19.0 (IBM Inc., New York, NY, USA). The figures were plotted using Graphpad Prism 7 software (Graphpad Software Inc., San Diego, CA, USA).

3. Results

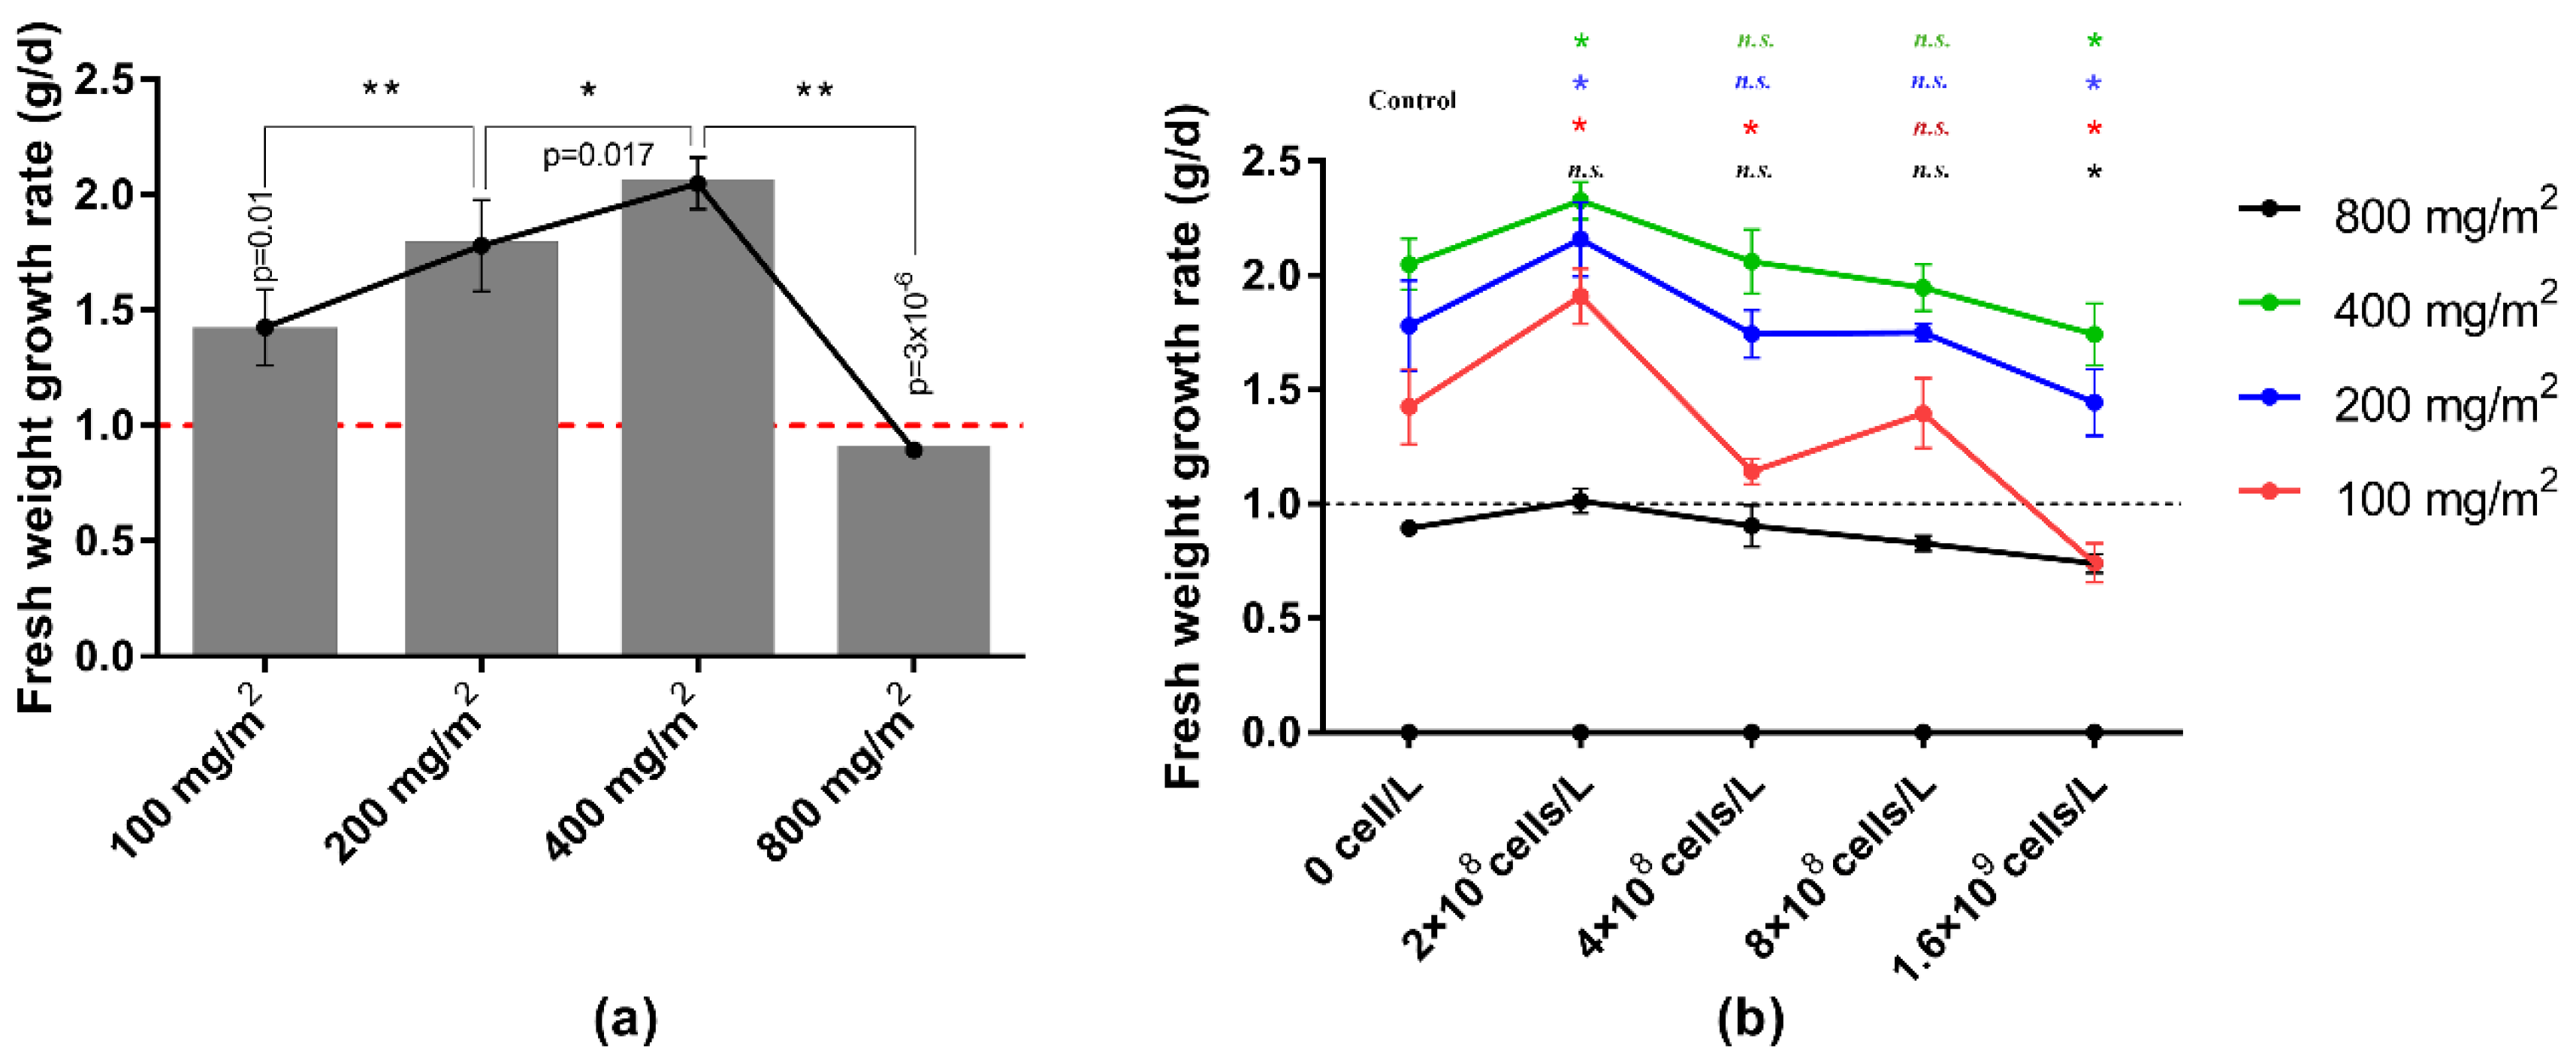
3.1. Screening Co-Culture Density of L. punctata and M. aeruginosa

Both L. punctata and M. aeruginosa are aquatic organisms, and they have overlapping ecological niches, so there is a certain competition between them when they grow in a limited water resource. A large number of experiments have shown that both biotic and abiotic stress can significantly affect the growth process of organisms and reduce the biomass of stressed organisms [17]. Based on the results of the fresh weight growth rate of L. punctata, we judged the growth states of L. punctata and screened the optimal density for co-cultivation.
After 15 days of culture alone, the fresh weight growth rate of each group of L. punctata was determined. The growth rate was highest at the inoculation density of 400 g/m2 (Figure 1a). However, when the inoculation density reached up to 800 mg/m2, the L. punctata showed negative growth, indicating that the L. punctata was under self-stress, so this density was first excluded for co-culture. The result showed that the L. punctata inoculation densities of 200 mg/m2 and 400 mg/m2 were suitable to study the stress response of M. aeruginosa to L. punctata (Figure 1b). In addition, the water surface coverage rate of each L. punctata inoculation density is shown in Table 1, and given the adverse effects of water surface coverage on the photosynthesis of M. aeruginosa, we selected 200 mg/m2 of L. punctata (50% water coverage rate) rather than 400 mg/m2 (100% water coverage rate) as the initial inoculation density for subsequent experiments.

3.2. Effects of M. aeruginosa on the Growth of L. punctata

M. aeruginosa had a significant inhibitory effect on the growth of L. punctata, and the inhibitory effect was dose-dependent. It is worth noting that the biomass of L. punctata, compared with the control, was significantly increased at 2 × 10⁸ cells/L M. aeruginosa after 15 days of co-cultivation with M. aeruginosa (Figure 2a). In addition, the fresh weight of L. punctata decreased as the M. aeruginosa density increased in the culture medium. However, all the differences together did not reach a significant level compared with the control, except for the 1.6 × 10⁹ treatment group. The change in trend of the dry weight was similar to that of fresh weight (Figure 2a).
Chlorophyll is the critical material basis for photosynthesis, and its content is the main indicator for judging the photosynthesis intensity of plants [18]. It can be seen from Figure 2b that the change in trend of chlorophyll a and b content was basically consistent with the biomass. Compared with the control, the 2 × 10⁸ cells/L M. aeruginosa treatment group was able to significantly increase the content of chlorophyll a and b in L. punctata. By contrast, the 1.6 × 10⁹ cells/L M. aeruginosa treatment group significantly reduced the content of chlorophyll a and b (Figure 2b). Secondly, the effect of M. aeruginosa on chlorophyll a was more obvious than for chlorophyll b. The total chlorophyll content in L. punctata significantly increased from 0.41 mg/g to 0.53 mg/g, and the increase rate reached 30.34% after treatment with 2 × 10⁸ cells/L M. aeruginosa. The 1.6 × 10⁹ cells/L M. aeruginosa was able to significantly reduce the total chlorophyll content of L. punctata by 8.37% compared with the control.

3.3. Effects of M. aeruginosa on Amylase and Starch Content of L. punctata

Figure 3a shows that the addition of M. aeruginosa had a significant effect on the α and β amylase activity in L. punctata. Especially under the treatment of 2 × 10⁸ cells/L M. aeruginosa, the activities of amylase α and β increased significantly. With the increasing inoculation density of M. aeruginosa, the amylase activity of L. punctata in the corresponding co-culture system began to decrease, but it was still higher than the control. When the density of M. aeruginosa in the co-culture system became 4 × 10⁸ cells/L, the enzyme activities of amylase α and β in the L. punctata began getting lower than the control, and the activity of β-amylase decreased to a significant level. When the density of M. aeruginosa reached 1.6 × 10⁹ cells/L, the activities of α and β amylase decreased to the lowest level. As shown in Figure 3b, the result of starch accumulation in L. punctata is about 10.25 mg/g (fresh weight) under normal growth conditions. When the M. aeruginosa appeared in the culture system, the starch accumulation decreased significantly. With the continuous increase of the density of M. aeruginosa in the co-culture system, the starch accumulation in L. punctata gradually decreased. When the inoculation density of M. aeruginosa reached the highest level, the starch accumulation was as low as 7.51 mg/g, and the starch accumulation decreased by 29.34%.

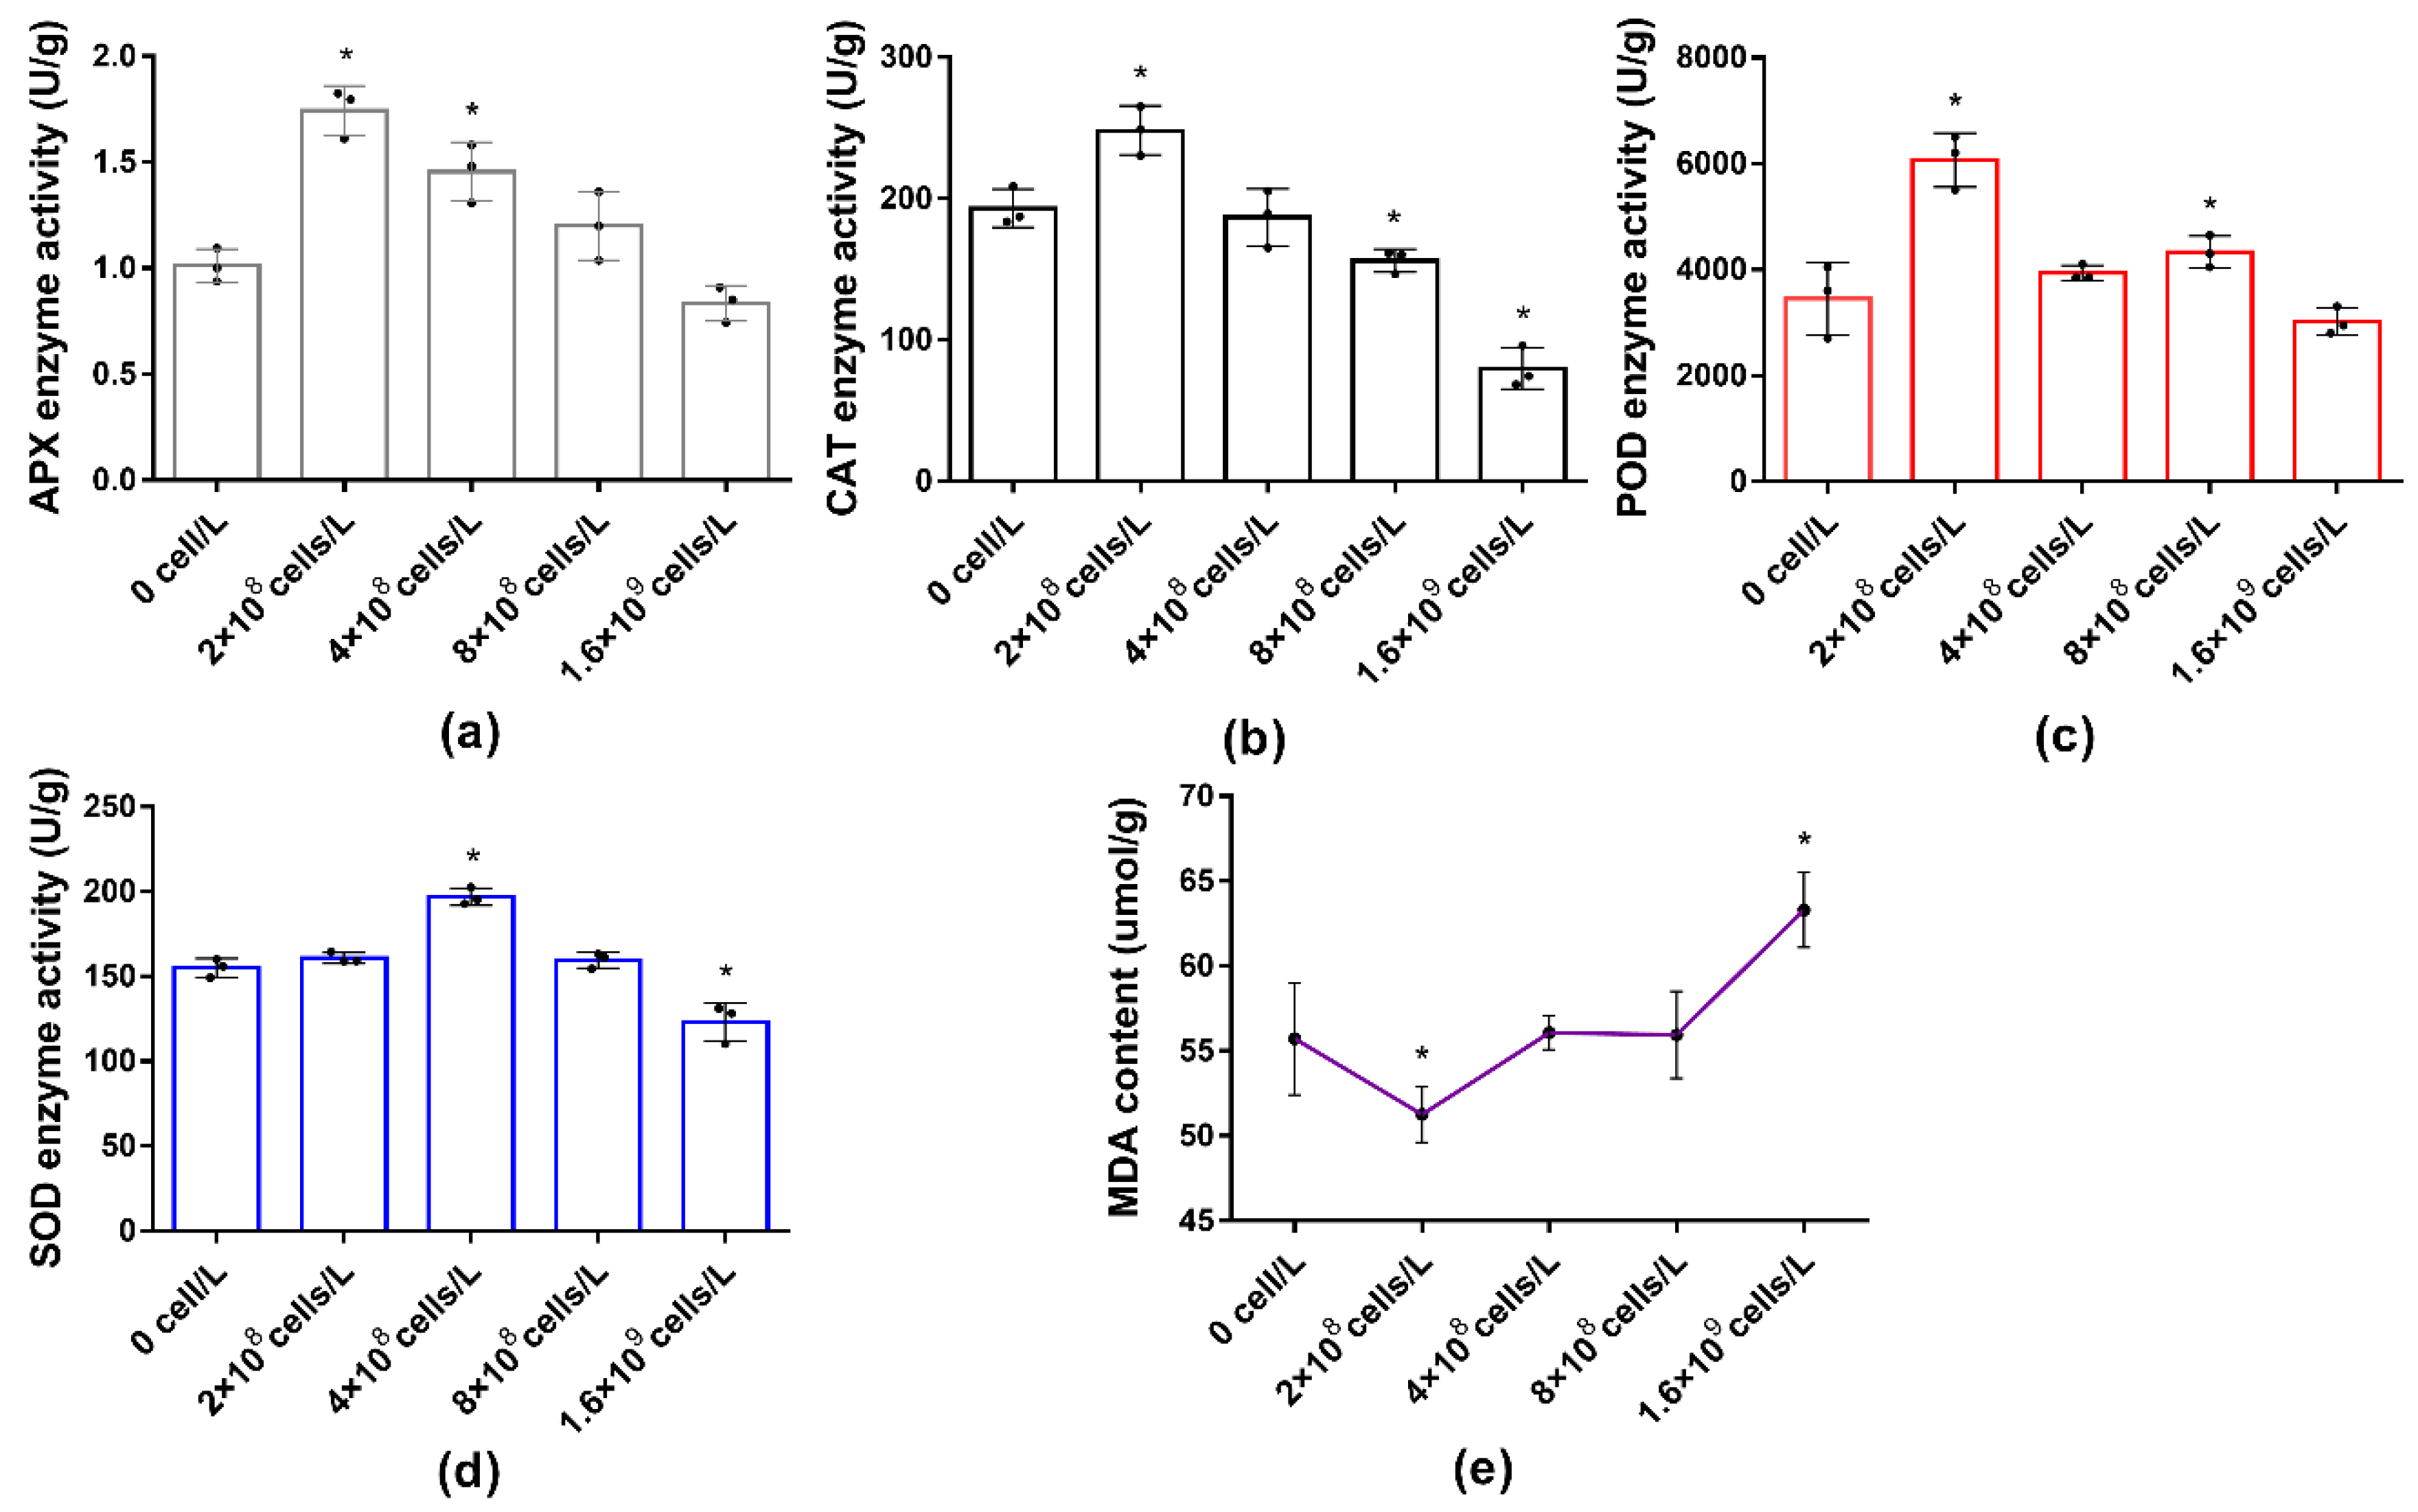
3.4. Effects of M. aeruginosa on Antioxidant System and MDA Accumulation of L. punctata

The activities of four antioxidant enzymes in the antioxidant system of L. punctata co-cultured with M. aeruginosa was determined (Figure 4). The activities of ascorbate peroxidase (APX), catalase (CAT), peroxidase (POD), and superoxide dismutase (SOD) showed a trend of increasing first and then decreasing. The activities of APX, CAT, and POD increased significantly at the density of 2 × 10⁸ cells/L of M. aeruginosa, and reached the peak values of 1.74 U/g, 248.19 U/g, and 6066.67 U/g, respectively. When the inoculation density of M. aeruginosa was 1.6 × 10⁹ cells/L, the enzyme activity reduced to the lowest points of 0.83 U/g, 79.56 U/g, and 3016.67 U/g, respectively. SOD showed a relatively hysteretic response to M. aeruginosa, while there was no significant effect on its activity in treatment of 2 × 10⁸ cells/L. Until the density of M. aeruginosa reached 4 × 10⁸ cells/L, the activity of SOD reached its peak, 196.90 U/g. At the highest density of M. aeruginosa, SOD activity decreased to the lowest value of 123.25 U/g.
In the 2 × 10⁸ cells/L treatment, the L. punctata MDA content was significantly lower than the control (Figure 4e). With the increasing density of M. aeruginosa in the co-culture system, the content of MDA in the L. punctata also increased. When the inoculation density of M. aeruginosa was 1.6 × 10⁹ cells/L, the content of MDA in L. punctata reached the highest value of 63.31 µmol/g.

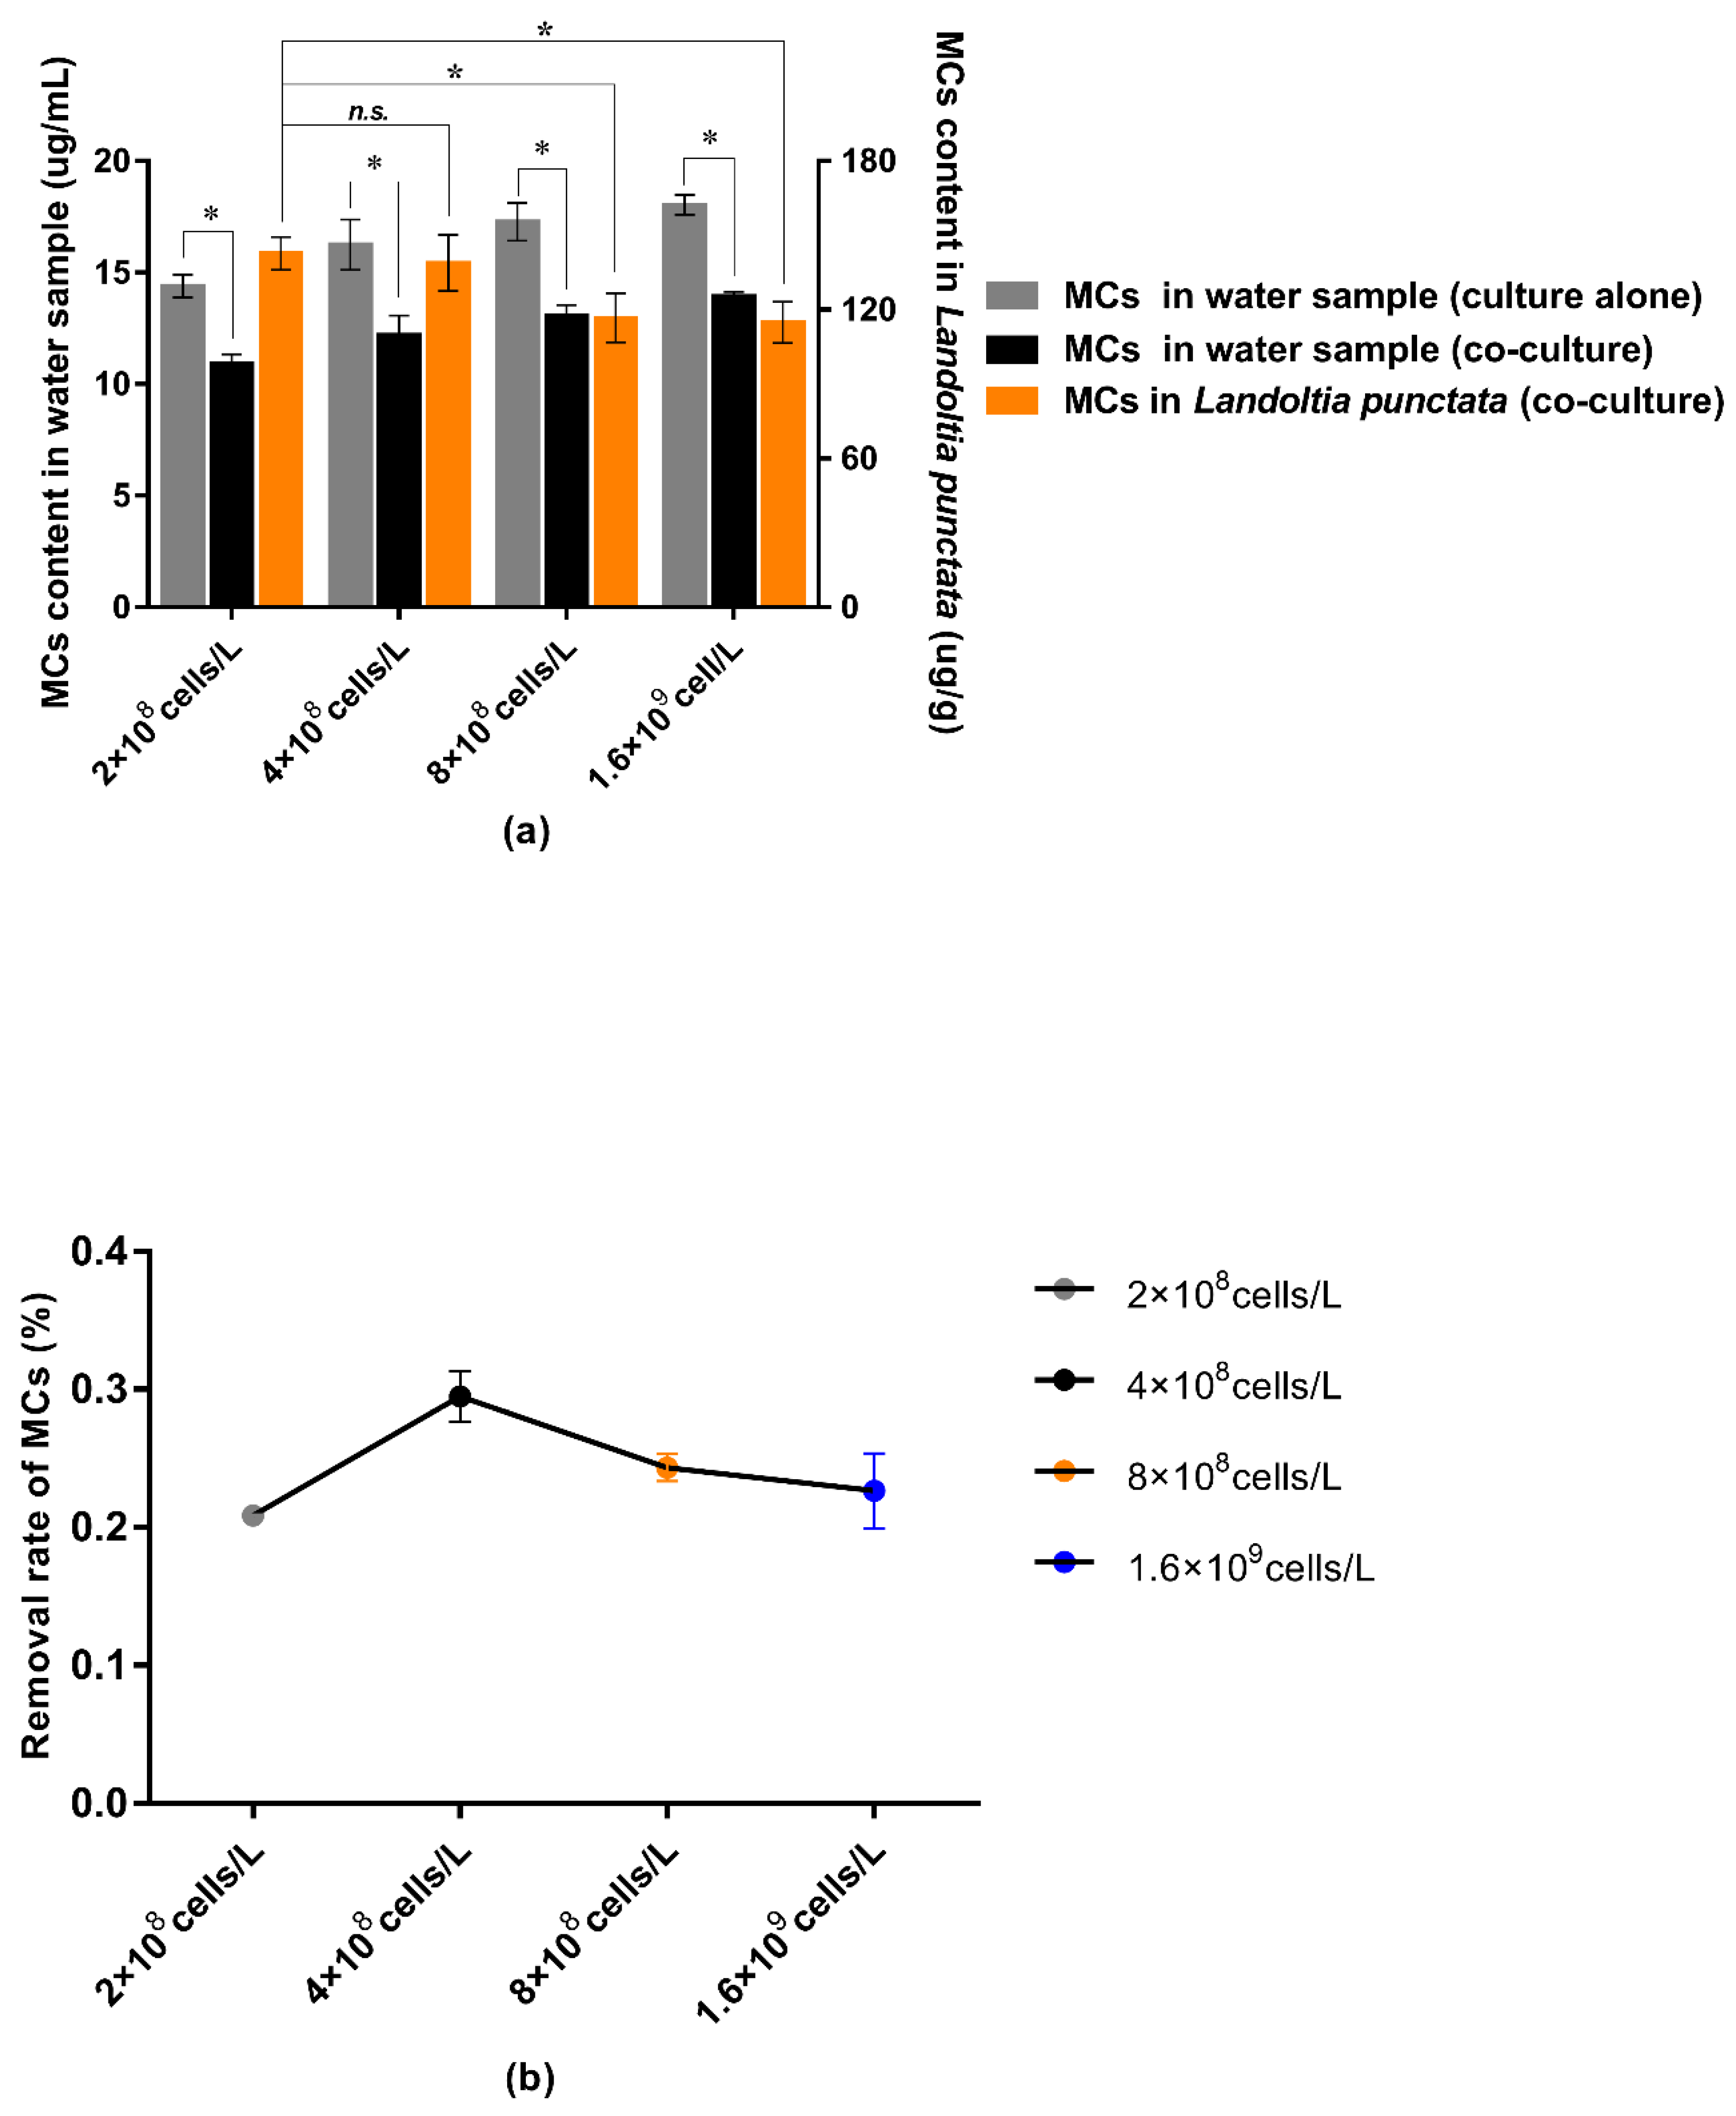
3.5. Effect of Water Purification by L. punctata

When M. aeruginosa was cultured alone, the content of MCs in the culture medium increased with the increase of M. aeruginosa. When the inoculation density was 1.6 × 10⁹ cells/L, the content of MCs in the water reached the peak of 13.94 g/mL. However, when M. aeruginosa was co-cultured with L. punctata, the content of MCs in the culture medium was less than that of M. aeruginosa cultured alone (Figure 5a). In co-culturing, the removal rate of MCs by L. punctata showed a trend of first increasing and then decreasing with the increase of the density of M. aeruginosa, and the highest removal rate was 29.48% when the inoculation density of M. aeruginosa was 4 × 10⁸ cells/L (Figure 5b).
The MCs absorbed by the L. punctata decreased gradually with the increase of the inoculation amount of M. aeruginosa. When the inoculation density was 2 × 10⁸ cells/L, the content reached the peak value of 142.73 µg/g. When the inoculum density of M. aeruginosa reached the highest point, MC accumulation in the L. punctata was reduced to a minimum of 114.84 µg/g (Figure 5a). Meanwhile, the TN removal rate in the co-culture system was determined as follows: the TN removal rate increased with the increase of the density of M. aeruginosa, and when the density of M. aeruginosa was 8 × 10⁸ cells/L, it reached the peak (36.94). When 200 mg/m2 of L. punctata was co-cultured in the culture system, the TN removal rate increased significantly, especially in the co-culture group of 2 × 10⁸ cells/L M. aeruginosa, where the removal rate increased by 20.62%. Then, with the increase of the density of M. aeruginosa, the TN removal rate gradually decreased. The trend of the TP removal rate was different with TN. In all the co-culture combinations, the TP removal rate was significantly higher than the single removal rate of M. aeruginosa (Figure 6).

4. Discussion

4.1. Effects of M. aeruginosa on the Growth of L. punctata

Although Chen et al. [19] found that L. punctata has a good repair effect on eutrophic water, little is known about the changes in the physiological and biochemical indexes of L. punctata during the repair process. In this study, we found that after 15 days of co-cultivation of L. punctata and the gradient density M. aeruginosa was higher than the “water bloom” burst level, the biomass of L. punctata showed a trend of increasing first and then decreasing. When the number of M. aeruginosa was 2 × 10⁸ cells/L in the co-culture system, it was able to stimulate L. punctata to absorb nutrients to a certain extent. At the same time, the CO2 released by the respiration of M. aeruginosa could also increase the photosynthesis efficiency of L. punctata, so the density of M. aeruginosa promoted the growth of L. punctata. When the density of M. aeruginosa reached 1.6 × 10⁹ cells/L, the stress of M. aeruginosa significantly inhibited the growth of L. punctata, and the fresh biomass and dry biomass of L. punctata decreased significantly compared with the control. Based on our results, we boldly conclude that during the process of increasing the density of M. aeruginosa in the co-culture system from 2 × 10⁸ cells/L to 1.6 × 10⁹ cells/L, the L. punctata, under the stress of M. aeruginosa, experienced the following three stages: A beneficial period (co-culturing with 2 × 10⁸ cells/L M. aeruginosa), ineffective stress period (co-culturing 4 × 10⁸ cells/L–8 × 108 cells/L M. aeruginosa), and effective stress period (co-culturing with 1.6 × 10⁹ cells/L M. aeruginosa).
M. aeruginosa not only reduces nutrient uptake by duckweeds, but also changes the water environment and reduces dissolved oxygen in water when its biomass reaches a certain level, which causes bloom. Meanwhile, M. aeruginosa can also produce MCs, which causes stress on L. punctata, reduces its chlorophyll content, and inhibits its photosynthetic efficiency [20], affecting the growth of L. punctata. The determination of physiological and biochemical indexes of L. punctata in different periods can make the stress response of L. punctata to M. aeruginosa in the co-culture system be better understood.

4.2. Effects of M. aeruginosa on Amylase and Starch Content of L. punctata

The L. punctata activities of α-amylase, β-amylase, and total amylase increased after co-culturing with M. aeruginosa at low density. α-amylase is a kind of enzyme widely existing in plants, and relevant reports have proved that α-amylase can be induced under certain stress conditions [21]. β-amylase is the key enzyme involved in starch hydrolysis in plants, and plays an indispensable role in coping with stress [22]. Studies have shown that starch hydrolysis into soluble sugar is an important way for plants to respond to stress [23,24]. More importantly, sugar itself can also act as a signaling molecule to regulate plant responses and growth under stress [25,26]. M. aeruginosa not only competes for nutrients with L. punctata, but also releases toxic substances into the water after cell breakage, which enhances the degree of stress on L. punctata, promotes initiation of the stress protection mechanism, and increases amylase activity. However, when the density of M. aeruginosa gradually increased, and the damage caused by M. aeruginosa was aggravated to the point of irreparable, it resulted in the decrease of amylase activity.
The accumulation of starch content is closely related to amylase activity. In this study, when the inoculation amount of M. aeruginosa was 2 × 10⁸ cells/L, the activity of α and β amylase increased significantly compared with the control. Both α and β amylases are hydrolytic enzymes, and an increase in their activity leads to the decrease of starch accumulation. With the increase of the inoculation quantity of M. aeruginosa, which reduced the activity of α and β amylase, it can be deduced that the activity of starch synthetase and the accumulation of starch content in L. punctata was also reduced and affected.

4.3. Effects of M. aeruginosa on Antioxidant System and MDA Accumulation of L. punctata

The co-culturing of M. aeruginosa not only has a competitive relationship of nutrients with L. punctata, but also releases microcystins (MCs) alone with cell disruption when it grows to a certain period, which causes stress to L. punctata. MCs can inhibit the activities of protein phosphatase 1 and 2A in aquatic plants [21] and participate in a series of physiological and biochemical activities, such as the phosphorylation and dephosphorylation of organisms, resulting in homeostasis imbalance and various adverse reactions, such as the production of reactive oxygen species (ROS), which can cause toxic effects on plant cell membranes, and so forth. The antioxidant enzyme system in plants can effectively remove ROS and protect plants. Research has found that MCs can increase ROS in plants and inhibit the growth of aquatic plants [27]. In our experiment, the activities of POD, CAT, and APX gradually increased, and the content of MDA decreased at 2 × 10⁸ cells/L of M. aeruginosa. When treated with 4 × 10⁸ cells/L~1.6 × 109 cells/L, the activity of POD, CAT, and APX gradually decreased, and the content of MDA increased. It indicates that the addition of 2 × 10⁸ cells/L of M. aeruginosa improved the enzymatic activity of L. punctata to resist an adverse environment. When 4 × 10⁸ cells/L~1.6 × 109 cells/L M. aeruginosa was added, the stress on L. punctata increased and exceeded its tolerance, resulting in the destruction of the antioxidant system.

4.4. Effect of Water Purification by L. punctata

When the cells of M. aeruginosa rupture, they release MCs and pollute the water. Due to the harmful effects of MCs on the natural environment and the human body, its elimination has always been a research hotspot. Many studies have shown that bioremediation is the most effective way to remove MCs. Approximately 90% of soluble MCs was degraded when treated with MC-degrading bacteria belonging to Pseudomonas. In this experiment, when M. aeruginosa was cultured alone, the content of MCs in the culture medium increased with the increase of the density of M. aeruginosa. However, L. punctata co-cultured with M. aeruginosa can significantly reduce the content of MCs in culture medium. The removal of MCs from L. punctata decreased gradually with the increase of MC content in the culture medium, indicating that the high density of MC stress exceeded the tolerance range of L. punctata. With an increasing density of dead M. aeruginosa, the MC content in water will be higher, which leads to the excessive content of MCs in L. punctata, and harvesting L. punctata at this time will be a good strategy for water purification. At the same time, the harvested L. punctata can be burned to destroy the structure of MCs and make it lose its toxicity. The burned residue can also be used as fertilizer to return to field. The high content of nitrogen and phosphorus in eutrophicated water is beneficial to the growth and reproduction of M. aeruginosa. We found that 200 mL of L. punctata can effectively reduce the content of nitrogen and phosphorus in water, especially the content of phosphorus, and improve environments which have been polluted by nitrogen and phosphorus.

5. Conclusions

In M. aeruginosa with inoculation densities of 2 × 10⁸ cells/L, 4 × 10⁸ cells/L, and 8 × 10⁸ cells/L, which are all much more abundant than in water bloom, our experiments have shown that L. punctata can grow normally. The chlorophyll content and biomass were not significantly lower than those of the control group, and the antioxidant enzyme system remained in a relatively normal state, while the removal rate of MCs fluctuated above and below 27%, which had a good remediation effect on the MC-polluted water body. Therefore, we have found that remediation of water polluted by M. aeruginosa (2 × 10⁸ cells/L, 4 × 10⁸ cells/L, and 8 × 10⁸ cells/L) with 200 g/m2 L. punctata can achieve a better effect.

Author Contributions

S.L. (Shi Li) and S.L. (Sixiu Le) designed and prepared the manuscript. S.L. (Shi Li) performed most of the experiments and wrote the draft of manuscript. G.L. and M.L. contributed to data analyses. Y.Z. and R.W. took part in interpretation of the results and manuscript preparation. All authors have read and agreed to the published version of the manuscript.

Funding

This research was funded by the Chinese National key R & D program, grant number 2018YFC1802605.

Conflicts of Interest

The authors declare no conflict of interest.

References

  1. Sinha, E.; Michalak, A.M.; Balaji, V. Eutrophication will increase during the 21st century as a result of precipitation changes. Science 2017, 357, 405–408. [Google Scholar] [CrossRef] [PubMed] [Green Version]
  2. Tanabe, Y.; Hodoki, Y.; Sano, T.; Tada, K.; Watanabe, M.M. Adaptation of the Freshwater Bloom-Forming Cyanobacterium Microcystis aeruginosa to Brackish Water Is Driven by Recent Horizontal Transfer of Sucrose Genes. Front. Microbiol. 2018, 9, 1150. [Google Scholar] [CrossRef] [PubMed] [Green Version]
  3. Yeh, T.; Kao, C.M.; Chen, W.H. Integrated phytoremediation focused on microbial investigation. RSC Adv. 2018, 8, 4680–4685. [Google Scholar] [CrossRef] [Green Version]
  4. Bassuney, D.; Tawfik, A. Baffled duck weed pond system for treatment of agricultural drainage water containing pharmaceuticals. Int. J. Phytoremediat. 2017, 19, 774–780. [Google Scholar] [CrossRef] [PubMed]
  5. Xu, Y.; Ma, S.; Huang, M.; Peng, M.; Bog, M.; Sree, K.S.; Appenroth, K.-J.; Zhang, J. Species distribution, genetic diversity and barcoding in the duckweed family (Lemnaceae). Hydrobiologia 2014, 743, 75–87. [Google Scholar] [CrossRef]
  6. Gupta, C.; Prakash, D. Duckweed: An effective tool for phyto-remediation. Toxicol. Environ. Chem. 2013, 95, 1256–1266. [Google Scholar] [CrossRef]
  7. Li, J.; Liu, Y.; Zhang, P.; Zeng, G.; Cai, X.; Liu, S.; Yin, Y.; Hu, X.; Hu, X.; Tan, X. Growth inhibition and oxidative damage of Microcystis aeruginosa induced by crude extract of Sagittaria trifolia tubers. J. Environ. Sci. 2016, 43, 40–47. [Google Scholar] [CrossRef]
  8. Massey, I.Y.; Yang, F.; Ding, Z.; Yang, S.; Guo, J.; Tezi, C.; Al-Osman, M.; Kamegni, R.B.; Zeng, W. Exposure routes and health effects of microcystins on animals and humans: A mini-review. Toxicon 2018, 151, 156–162. [Google Scholar] [CrossRef]
  9. Tsuji, K.; Watanuki, T.; Kondo, F.; Watanabe, M.F.; Suzuki, S.; Nakazawa, H.; Suzuki, M.; Uchida, H.; Harada, K.-I. Stability of microcystins from cyanobacteria—II. Effect of UV light on decomposition and isomerization. Toxicon 1995, 33, 1619–1631. [Google Scholar] [CrossRef]
  10. Rastogi, R.P.; Sinha, R.P.; Incharoensakdi, A. The cyanotoxin-microcystins: Current overview. Rev. Environ. Sci. Bio/Technol. 2014, 13, 215–249. [Google Scholar] [CrossRef]
  11. Wang, Y.; Cao, Y.; Li, H.; Gong, A.; Han, J.; Qian, Z.; Chao, W. Removal of MCs by Bi2O2CO3: Adsorption and the potential of photocatalytic degradation. Environ. Sci. Pollut. Res. 2018, 25, 11867–11874. [Google Scholar] [CrossRef] [PubMed]
  12. Su, Y.; Mennerich, A.; Urban, B. Coupled nutrient removal and biomass production with mixed algal culture: Impact of biotic and abiotic factors. Bioresour. Technol. 2012, 118, 469–476. [Google Scholar] [CrossRef] [PubMed]
  13. Ying, L.I.; Shi, Z.; Zhang, Y.X.; Zhao, Q.L.; Aijun, L.I.; Jin, Y.; Cheng, T. Evaluation Method and Application on Cyanobacteria Bloom Degree Classification With Algal Density. Environ. Sustain. Dev. 2014, 2, 67–68. [Google Scholar]
  14. Chen, Q.; Jin, Y.; Zhang, G.; Fang, Y.; Xiao, Y.; Zhao, H. Improving Production of Bioethanol from Duckweed (Landoltia punctata) by Pectinase Pretreatment. Energies 2012, 5, 3019–3032. [Google Scholar] [CrossRef] [Green Version]
  15. Silva, P.D.P.; De Nys, R.; Paul, N. Seasonal growth dynamics and resilience of the green tide alga Cladophora coelothrix in high-nutrient tropical aquaculture. Aquac. Environ. Interact. 2012, 2, 253–266. [Google Scholar] [CrossRef] [Green Version]
  16. Arnon, D.I. Copper Enzymes in Isolated Chloroplasts. Polyphenoloxidase in Beta Vulgaris. Plant Physiol. 1949, 24, 1–15. [Google Scholar] [CrossRef] [Green Version]
  17. Pavlović, I.; Pěnčík, A.; Novak, O.; Vujčić, V.; Brkanac, S.R.; Lepedus, H.; Strnad, M.; Sondi, B.S. Short-term salt stress in Brassica rapa seedlings causes alterations in auxin metabolism. Plant Physiol. Biochem. 2018, 125, 74–84. [Google Scholar] [CrossRef]
  18. Lin, Y.; Chang, Q.R.; Liu, M.Y.; Wang, S. Estimation of chlorophyll content in rice at different growth stages based on hyperspectral in yellow river irrigation zone. Agric. Res. Arid Areas 2018, 2, 45–52. [Google Scholar]
  19. Chen, G.; Fang, Y.; Huang, J.; Zhao, Y.; Li, Q.; Lai, F.; Xu, Y.; Tian, X.; He, K.; Jin, Y.; et al. Duckweed systems for eutrophic water purification through converting wastewater nutrients to high-starch biomass: Comparative evaluation of three different genera (Spirodela polyrhiza, Lemna minor and Landoltia punctata) in monoculture or polyculture. RSC Adv. 2018, 8, 17927–17937. [Google Scholar] [CrossRef] [Green Version]
  20. Hu, Z.-Q.; Liu, Y.-D.; Li, D.; Dauta, A. Growth and antioxidant system of the cyanobacterium Synechococcus elongatus in response to microcystin-RR. Hydrobiologia 2005, 534, 23–29. [Google Scholar] [CrossRef]
  21. Ziková, A.; Palíková, M.; Mareš, J.; Navrátil, S.; Kopp, R. Impacts of dietary cyanobacteria on fish. Acta Univ. Agric. Silvic. Mendel. Brun. 2010, 58, 277–284. [Google Scholar] [CrossRef] [Green Version]
  22. Monroe, J.D.; Storm, A.R. Review: The Arabidopsis β-amylase (BAM) gene family: Diversity of form and function. Plant Sci. 2018, 276, 163–170. [Google Scholar] [CrossRef] [PubMed]
  23. Lee, J.H.; Yu, D.J.; Kim, S.J.; Choi, I.; Lee, H.J. Intraspecies differences in cold hardiness, carbohydrate content and -amylase gene expression of Vaccinium corymbosum during cold acclimation and deacclimation. Tree Physiol. 2012, 32, 1533–1540. [Google Scholar] [CrossRef] [PubMed] [Green Version]
  24. Benina, M.; Obata, T.; Mehterov, N.; Ivanov, I.; Petrov, V.; Toneva, V.; Fernie, A.R.; Gechev, T.S. Comparative metabolic profiling of Haberlea rhodopensis, Thellungiella halophyla, and Arabidopsis thaliana exposed to low temperature. Front. Plant Sci. 2013, 4, 499–510. [Google Scholar] [CrossRef] [PubMed] [Green Version]
  25. Smeekens, S.; Ma, J.; Hanson, J.; Rolland, F.A. Sugar signals and molecular networks controlling plant growth. Curr. Opin. Plant Boil. 2010, 13, 273–278. [Google Scholar] [CrossRef]
  26. Meng, N.; He, M.; Bai, Y.; Xu, H.; Dandekar, A.M.; Fei, Z.; Cheng, L. Decreased sorbitol synthesis leads to abnormal stamen development and reduced pollen tube growth via an MYB transcription factor, MdMYB39L, in apple (Malus domestica). New Phytol. 2017, 217, 641–656. [Google Scholar] [CrossRef] [Green Version]
  27. Ha, M.-H.; Pflugmacher, S. Time-dependent alterations in growth, photosynthetic pigments and enzymatic defense systems of submerged Ceratophyllum demersum during exposure to the cyanobacterial neurotoxin anatoxin-a. Aquat. Toxicol. 2013, 138, 26–34. [Google Scholar] [CrossRef] [PubMed]
Figure 1. Fresh weight growth rates of L. punctata after 15 days of culture. (a) L. punctata cultured alone, and (b) L. punctata co-cultured with M. aeruginosa. Values are means ± SE from three biological replicates. Asterisks indicate statistical significance based on one-way ANOVA; * p < 0.05, ** p < 0.01.
Water 12 01764 g001
Figure 2. L. punctata growth states after co-culturing with M. aeruginosa. (a) Fresh biomass and dry biomass. (b) Chlorophyll content. (c) Rate of chlorophyll content increase. Values are means ± SE from three biological replicates. Asterisks indicate statistical significance based on one-way ANOVA; * p < 0.05.
Water 12 01764 g002
Figure 3. L. punctata amylase activity and starch content after co-culturing with M. aeruginosa. (a) α, β, and total amylase activity. (b) Starch content. Values are means ± SE from three biological replicates. Asterisks indicate statistical significance based on one-way ANOVA; * p < 0.05.
Water 12 01764 g003
Figure 4. L. punctata APX (ascorbate peroxidase), CAT (catalase), POD (peroxidase), and SOD (superoxide dismutase) activity and MDA (malondialdehyde) content after co-culturing with M. aeruginosa. (a) APX activity. (b) CAT activity. (c) POD activity. (d) SOD activity. (e) MDA content. Values are means ± SE from three biological replicates. Asterisks indicate statistical significance based on one-way ANOVA; * p < 0.05.
Water 12 01764 g004
Figure 5. MC (microcystins) content and removal rate by L. punctata. (a) MC content in water sample and L. punctata. (b) Removal rate of MCs by L. punctata. Values are means ± SE from three biological replicates. Asterisks indicate statistical significance based on Student’s t test; * p < 0.05, n.s. indicates no significance.
Water 12 01764 g005
Figure 6. Total nitrogen (TN) and total phosphorus (TP) removal rate by L. punctata. (a) TN removal rate. (b) TP removal rate. Values are means ± SE from three biological replicates. Asterisks indicate statistical significance based on Student’s t test; ** p < 0.01, n.s. indicates no significance.
Water 12 01764 g006
Table 1. The L. punctata water surface coverage rate of each inoculation density.
L. punctata density (g/m2)100200400800
Water Surface Coverage Rate (%)2550100100

