Article

Temporal Variations of Submarine Groundwater Discharge into a Tide-Dominated Coastal Wetland (Gaomei Wetland, Western Taiwan) Indicated by Radon and Radium Isotopes

1
Institute of Oceanography, National Taiwan University, Taipei 10617, Taiwan
2
Research Center for Future Earth, National Taiwan University, Taipei 10617, Taiwan
3
Ocean Center, National Taiwan University, Taipei 10617, Taiwan
4
Exploration and Development Research Institute, CPC Corporation, Miaoli 36042, Taiwan
*
Author to whom correspondence should be addressed.
Water 2020, 12(6), 1806; https://doi.org/10.3390/w12061806
Submission received: 22 May 2020 / Revised: 18 June 2020 / Accepted: 20 June 2020 / Published: 24 June 2020

Abstract

:
Submarine groundwater discharge (SGD) is evidenced around Taiwan, but the seasonal/temporal changes of SGD have not been fully examined. Here, we report a time-series investigation of SGD into a tide-dominated coastal wetland, the Gaomei Wetland, located to the south of the Da-Chia River’s mouth, western Taiwan, by using environmental tracers (222Rn, 224Raex, 228Ra, δD, and δ18O). Our results showed that regardless of dry and wet seasons, the 222Rn activities in coastal waters were high at low tide but low at high tide. It represents the continuous input of 222Rn-enriched groundwater. However, the 224Raex and 228Ra activities showed seasonal changes with tide conditions. In the dry season, the 224Raex and 228Ra activities in coastal waters were low at low tide but high at high tide; whereas in the wet season, an opposite relation was observed with quite high 224Raex and 228Ra activities in the low-tide waters. Coupled with the lower δD and δ18O values of coastal and pore waters in the dry season, in comparison to those in the wet season, it is suggested that these phenomena probably reflected a seasonal difference in the main SGD component with fresh SGD in the dry season, but saline ones in the wet season. Based on a 222Rn mass balance model, the estimated SGD fluxes into the Gaomei Wetland varied with tidal fluctuations and ranged from 0.2 to 25 cm d−1 and from 0.1 to 47 cm d−1 for the dry and wet seasons, respectively. A slightly high SGD flux occurring during the wet season at spring tide, implied a stronger tidal pumping coupled with a larger hydraulic gradient between land and sea. In this study, we demonstrated that the variation of SGD into the Gaomei Wetland is not only controlled by the seasonal changes of groundwater recharge, but also by the tidal pumping process.

1. Introduction

Although not as obvious as surface runoffs, the flow of groundwater across the seabed into the ocean, i.e., Submarine Groundwater Discharge (SGD), does occur in many coastal areas. The first SGD observation was reported by Sonrel in 1868 [1], who described a submarine freshwater spring occurring at an 8 km-offshore site in the Mediterranean Sea, which the sailors in ancient times used to recharge freshwater on boat. As the highly spatial and temporal variation made it difficult to detect and measure SGD, the impact of SGD was neglected until the first elaborated estimate of SGD was made in the South Atlantic Bight U.S.A., through a radiogeochemical-tracer method in the middle of 1990s [2]. Now, SGD is regarded as a significant process of the hydrological cycle.
SGD is defined as any flows of subsurface fluid across the water–sediment interface into the sea, with scale lengths of meters to kilometers, regardless of fluid compositions and driving forces [3,4,5]. As such, it comprises fresh and terrestrial groundwater (Submarine Fresh Groundwater Discharge, SFGD), as well as saline and recirculated seawater (Recirculated Saline Groundwater Discharge, RSGD) [3]. The former is mainly forced by terrestrial hydraulic gradient that is adjusted by groundwater recharge in the hinterland [6,7]; while the latter is induced by a variety of oceanic processes, such as wave setup and tidal pumping that force seawater to circulate through the permeable sediments [7,8,9,10]. The magnitude of SGD varies with time and space [6,7,8,9,10,11,12], in response to the changes on hydrogeological circumstances and driving forces, e.g., permeability (hydraulic conductivity) of coastal aquifer, seasonal oscillations of the water table, sea-level changes induced by tidal fluctuation, and wave pumping. For example, Taniguchi [11] reported a long-term SGD investigation over several neap-spring tide periods in the Osaka Bay, Japan, and found a significant positive correlation between the tidal range and the SGD magnitude, where the greatest discharge rate occurred during the low-tide period at/around spring tide. Further, a Fast Fourier Transfer (FFT) analysis showed that the frequencies for SGD magnitude changes corresponded to the dominant periods of 341.3 h, 24.1 h, and 12.3 h for the sea level oscillations induced by tide. The semi-monthly, diurnal, and semi-diurnal variations of SGD demonstrated that tidal pumping is a significant factor that controls the magnitude variation of SGD through ebb-flood to neap-spring oscillation [7,11,12].
SGD not only discharges water but also carries associated chemical compounds toward the ocean, including nutrients, metals, dissolved inorganic and organic carbon (DIC and DOC), even pollutants. The chemical composition of SGD usually differs from that predicted, even reveals much higher concentrations of nutrients due to the biogeochemical reactions within the coastal aquifer [5]; subsequently the quality of seawater could be modified when entering the coastal region and then could have a profound impact on the coastal ecosystems. Numerous studies showed a significant contribution of the nutrient and DIC via SGD [13,14], as well as a linkage between the SGD-derived nutrient and eutrophication, even outbreaks of harmful algae bloom [15,16,17]. Therefore, study of SGD is essential for evaluating the potential discharges of nutrients and other associated solutes.
In Taiwan, although both land subsidence in the hinterland and seawater intrusion in the coastal aquifers occurred due to groundwater overexploitation [18,19,20,21], the existence of groundwater flowing across the seabed has been proved [20,22,23,24,25,26,27,28,29]. Based on a hydraulic model with the assistance of oxygen and hydrogen stable isotopes (δ18O and δD), Peng et al. [20] indicated a surplus of groundwater moving downstream to the coastal aquifer around Taiwan. Geochemical data also showed evidences of SGD off the Ping-Tung Plain, Southwestern Taiwan [27], and even a fresh groundwater was captured at a water depth of 7.8 m [20,22,23,29]. By using environmental isotopes (δ18O, δD, and Δ87Sr), a deep-sea SGD, mainly fed by recirculated seawater with some admixture of fresh groundwater, was further found within the Gaoping Submarine Canyon (water depth of down to ~1200 m), off southwestern Taiwan [25,26]. The total SGD flux around Taiwan was estimated to be 1.07 ± 0.7 × 10¹⁰ t yr−1, as much as ~14% of the annual river outflow [23]; moreover, the annual fluxes of SGD-supplied nutrients, 1.18 ± 0.83 × 10⁹ mol yr−1 for total nitrogen (NO3 + NO2 + NH4+) and 9.3 ± 6.5 × 10⁶ mol yr−1 for phosphorus (PO43−) were comparable to those exported from rivers around Taiwan [29].
Although increasing evidences showed that SGD exists around Taiwan, studies on seasonal/temporal variations of SGD fluxes are rare. Here, we conducted a time-series investigation on SGD into a tidal-dominated coastal wetland, the Gaomei Wetland, located to the south of the mouth of the Da-Chia River, Western Taiwan. Preliminary study showed the occurrence of SGD in the Gaomei Wetland [24]. Our working hypothesis is that the Gaomei Wetland might be a potential area where the SGD rate varies with time, in response to sea-level fluctuations induced by semidiurnal tide that is characterized by a tidal range of ~3 m. In this study, we used radon (222Rn), radium (224Ra and 228Ra), oxygen, and hydrogen stable isotopes (δ18O and δD) as tracers.
Over the past decades, naturally occurring radionuclides, radon (222Rn, T1/2 = 3.82 d) and radium (223Ra, T1/2 = 11.4 d; 224Ra, T1/2 = 3.66 d; 226Ra, T1/2 = 1620 y; and 228Ra, T1/2 = 5.75 y) isotopes, have been used as tracers for detecting and quantifying local to regional scale SGDs as well as for studying their driving forces. Groundwater is greatly enriched in 222Rn as compared to surface water and seawater (typically 1000-fold or greater), as it is continuously produced by the α decay of 226Ra in the aquifers and it prefers to escape from water to an open environment like air [30]. Coupled with being chemically conservative and having a comparable half-life to residence time of coastal water, 222Rn is an ideal tool for studying dynamic systems [30,31].
Radium (Ra) isotopes are produced by the radioactive decay of thorium (Th) isotopes, which are ubiquitous in sediments and rocks, and thought to be ideal tracers for RSGD. This is due to some of their characteristics, like their tendency to attach to the surface of sediment particles/rocks in freshwater (i.e., groundwater/fluvial water) but being released to water via ion exchange, which is induced when seawater mixes with freshwater in the estuarine/coastal zone, or is triggered by saline water recirculating in the coastal aquifer [31,32,33]. Accordingly, brackish waters are enriched in Ra isotopes; and when being transported away from the source region, activities of Ra isotopes are controlled by radioactive decay and mixing of water masses due to their conservation behavior in seawater.
Oxygen and hydrogen isotopic compositions (δ18O and δD) can further distinguish freshwater from saline water, due to a clear isotopic distinction between them [20,25,26,34]. During the hydrological process, continuous isotope fractionation causes the variation in δ18O and δD values in natural waters. As a result, seawater is significantly enriched in 18O and D; while meteoric water as well as its subsequent surface runoff water and groundwater, are depleted in 18O and D. Although regional and seasonal variations of the isotopic signature in meteoric water occur due to the different evaporation–precipitation conditions, the δ18O and δD values in natural waters, including atmospheric precipitation (meteoric water), surface runoff water, groundwater, brackish water, and seawater, tend to be linearly corrected [34,35,36,37,38]. When combined with other geochemical tracers in the coastal area, δ18O and δD serve as conservative indicators of the mixing between offshore seawater and onshore meteoric groundwater and further provide an insight to the source of SGD [35,36,37,38]

2. Materials and Methods

2.1. Study Area

The Gaomei Wetland is a tidal-dominated coastal wetland with a total area of 7.01 × 10⁶ m2 (3.5 km long and 1.8 km wide), which is connected to the Da-Chia River’s estuary in the north as well as to the outlet of the Qingshui Drainage in the south (Figure 1), from where it also receives fresh fluvial waters. The Qingshui Drainage is an artificial system for supplying the agricultural water and draining the additional rainwater; while the Da-Chia River is a small mountainous river, originating from the Central Mountain Range, at an elevation of over 3500 m with a main stream length of 124 km that results in a mean relief ratio of 1/60 [39]. The drainage basin of the Da-Chia River, covering an area of 1235 km2, receives over 2000 mm of annual rainfall with more than 75% occurring during May–September; while the annual evaporation reaches up to 1200 mm [40]. All of these result in a high annual water discharge of 1.28 × 10⁹ m3 [39] into the Taiwan Strait and an annual groundwater recharge of over 500 mm into the highly permeable aquifers, hosted by unconsolidated gravelly/sandy sediments of the late Pleistocene and Holocene age [40]. In response to the topographic gradient in water tables between the recharge zone in the highland and the discharge zone in the lowland, the groundwater flows westward into the coastal plain of Taichung where the Gaomei Wetland is located, with a hydraulic gradient of ~0.007 [41].
The surficial aquifer around the Gaomei Wetland is unconfined and about 40 m thick [41], consisting of Holocene alluvial gravelly/sandy sediments, with a high hydraulic conductivity of 6.18 × 10⁻³~8.3 × 10⁻⁴ m s−1. The surficial sediments of the Gaomei Wetland also consist of very fine sand and silt originating from the Da-Chia River, resulting in a relatively high permeability (10−7~10−4 m s−1; [41]). Semidiurnal tidal fluctuations with the greatest tidal ranges of over 4 m occurring at spring tide generate not only the flushing of seawater into the Gaomei Wetland, but also a significant and temporal change on sea levels. All of these imply a possible outflow of underground water across the seabed (i.e., SGD) into the overlaying water, and its magnitude might vary with tidal fluctuations. This flow is considered to be a pathway for discharging new/recirculated nutrients and other chemical materials into this wetland.

2.2. Field Work

Two field campaigns were carried out at the Gaomei Wetland under the contrasting hydrological conditions—during the dry season (9~10 May 2014; before the monsoon rainfall started) and during the wet season (27~28 August 2014; encountered a spring tide). We conducted time-series samplings over 30 h (over 2 tidal cycles) at a small-creek site 500 m offshore (Figure 1), where is fed by the fresh fluvial water and continuously flushed by the tidal seawater exchange. Water samples were taken every two hours at low tide and every one hour at high tide, for analyses of radon (222Rn) and radium isotopes (224Raex and 228Ra), and oxygen and hydrogen isotopic compositions (δ18O and δD). In-situ temperature and salinity of water were recorded by the HORIBA U-50 series multi-parameter water quality meter. In addition, pore water samples from 35 cm below the seabed were collected by using a push-point piezometer connected to a peristaltic pump, at a flow rate of ~200 mL min−1. A simple weather station (Davis 6152C Cabled Vantage Pro2 Weather Station) with a propeller-type anemometer mounted at a height of 4 m above the water surface, was set up at an inland site for recording on-site wind speed in 5 min interval.
For characterizing the water sources discharging into our study area, groundwater from the artesian wells around the Gaomei Wetland, river water from the mouth of the Da-Chia River and the outlet of the Qingshui Drainage were sampled (Figure 1) in 2014 (August, December) and 2015 (September). They were analyzed for radon (222Rn) and radium isotopes (224Raex and 228Ra), and oxygen and hydrogen isotopic compositions (δ18O and δD). For the seaward end-members, offshore surface and near-bottom seawater samples were collected at a site 3-km offshore (Figure 1; water depth ~28 m), using multiple 20-L Go-Flo bottles mounted on a SBE911+ CTD rosette assembly on 19 March 2014. The concurrent temperature and salinity were also recorded.

2.3. Analytical Techniques

2.3.1. Measurement of 222Rn in Water

Measurement of 222Rn in water was carried out via using a RAD7-H2O system (Durridge Company, Inc., Billerica, MA, USA). Water samples were carefully taken into 250 mL glass bottles with no air bubbles occurring and sealed upon collection. After allowing 15 min for 218Po to equilibrate with its parent 222Rn, the sample bottle was connected to the RAD7-H2O system, equipped with an air-grabbing device. The 222Rn air, together with 218Po, was pumped into a closed air loop and detected through a radon-in-air detector. The RAD7 detector was calibrated using a standard prepared from a 226Ra solution (Isotopes Products Laboratories, CF, Series No. 459-21-4), following the method of Xu et al. [42]. The activity of 222Rn in water with 20% uncertainty was observable after a 30-min analysis, which was then decay-corrected to that of the sampling date and time. The limit of detection (LOD) for the RAD7-H2O system is 4 Bq m−3.

2.3.2. Extraction and Measurement of Ra Isotopes in Water

For the determination of Ra isotopes, water samples (volume ~40 L) were passed through a column packed with ~25g manganese-coated acrylic fiber (MnO2 fiber), at a flow rate of ~1 L min−1, to adsorb Ra isotopes onto the MnO2 fiber. Based on the previous studies, over 95% of dissolved Ra could be retained on the fiber under the prescribed conditions [43,44]. Upon collection, each Ra-loaded fiber was rinsed with Ra-free water to remove sea salts, partially dried with a stream of compressed air, and sealed in a plastic bag for storage prior to laboratory procedures.
Within 3 days of collection, the Ra-loaded MnO2 fiber was placed in a Radium Delayed Coincidence Counter (RaDeCC) system to count the α decays from 219Rn and 220Rn, daughter nuclides of 223Ra and 224Ra, respectively [45,46]. Afterwards the samples were recounted after being aged for 3~5 weeks, to allow the excess 224Ra to decay and the supported 224Ra to equilibrate with its parent 228Th adsorbed onto MnO2 fiber. In addition, the initial activity of the 228Ra absorbed on the MnO2 fiber was determined by measuring the sample, after being aged a least for 6 months to produce distinguishable 228Th from 228Ra decay [44]. The 224Ra efficiency of the detector was determined by using a reference source prepared from thorium ores (IEAE-RGTh-1), in which the Ra isotopes were in secular equilibrium with their progenitors. The activities of 224Ra and 228Ra in water were calculated using the methods of Garcia–Solsona et al. [47] and Moore [43], with ±10% uncertainty.

2.3.3. Analyses of δ18O and δD of Water

Water sample was passed through a 0.45 μm filter into a 2-mL vial. This vial was immediately sealed with no existing air bubbles and was maintained at a room temperature, prior to analysis. Oxygen and hydrogen isotopic compositions (δ18O and δD) were analyzed by a cavity ring-down spectrometer (CRDS, Picarro L2140-i) housed at the Exploration and Development Research Institute, CPC Corporation, Taiwan. The results are reported as per mill (‰) relative to the Vienna Standard Mean Ocean Water (VSMOW). Replicate analyses δ18O and δD of the samples and variety of Standard Reference Materials (USGS-45, 46, 47, 48, 49, 50, 53) showed an averaged 1 σ uncertainty better than 0.05‰ and 0.5‰, respectively.

3. Results

3.1. Groundwater, Fluvial Water, and Offshore Seawater

Results of 222Rn, 224Raex (which has been corrected for the ingrowth from 228Th), 228Ra, δ18O, and δD in groundwater, fluvial water, and offshore seawater are summarized in Table 1 together with its salinity. Offshore seawater sample (salinity: 34.7) showed a 222Rn activity lower than the limit of detection (LOD: 4 Bq m−3). The activities of 224Raex and 228Ra were 1.96 ± 0.33 dpm 100L−1and 1.34 ± 0.21 dpm 100L−1, respectively; while the δ18O and δD values were −0.07 ± 0.04‰ and −0.21 ± 0.19‰, respectively.
Groundwater samples from the artesian wells near the Gaomei Wetland are composed of freshwater (salinity: 0.0~0.2). These showed much lower δ18O and δD values (−10.23 ± 0.29‰ and −68.5 ± 1.3‰ on average, respectively), in comparison to offshore seawater. These were also characterized by high 222Rn activities, ranging from 4687 to 13,712 Bq m−3, with an average of 9186 ± 594 Bq m−3. However, low 224Raex and 228Ra activities were observed, ranging from 0.52 to 2.06 dpm 100L−1 with an average of 1.10 ± 0.59 dpm 100L−1 for 224Raex; and varying between 0.62 and 1.62 dpm 100L−1, with an average of 1.21 ± 0.53 dpm 100L−1 for 228Ra. These low Ra activities were expected as Ra isotopes in freshwater environment are predominantly bound to particles [32].
For fluvial waters collected from the outlet of the Qingshui Drainage (salinity: 0.2~3.3) and the estuary of the Da-Chia River (salinity: 0~0.1), activities of 222Rn were 554 ± 208 Bq m−3 and 1186 ± 305 Bq m−3 on average, respectively. These were much higher than those obtained from other rivers around Taiwan, such as the main stream of the Gaoping River in the southwest (264 ± 231 Bq m−3; [48]) and the Tanshui River in the north (271 ± 375 Bq m−3; [49]). The contribution of 222Rn-enriched groundwater to fluvial water was suspected to be responsible for this, and this might also imply a significant exchange between groundwater and surface runoff water for the Da-Chia River. The fluvial water samples from the estuary of the Da-Chia River showed similar ranges of 224Raex and 228Ra activities to those of groundwater (Table 1); whereas in the outlet of the Qingshui Drainage, 224Raex and 228Ra activities were slightly high (Table 1). All the fluvial water samples showed similar ranges of δ18O and δD values (−9.42 ± 0.27‰ and −68.5 ± 1.7‰ on average, respectively) to those of groundwater, except for the one collected at the outlet of the Qingshui drainage in December 2014 (brackish water, salinity: 3.2), which displayed a somewhat higher δ18O and δD values (−7.36 ± 0.26‰ and −50.0 ± 0.3‰, respectively). This was attributed to a slight contribution of 18O- and D-enriched offshore seawater.

3.2. Time-Series Observations of Coastal Water

Time-series observations on the coastal water at the small-creek site 500 m offshore, during the two field campaigns (9~10 May 2014 and 27~28 August 2014) are shown in Figure 2, together with the records of tidal height obtained from the tidal observatory (120°31′59″ E, 24°17′16″ N) [50] in the Port of Taichung, which is located to the south of the Gaomei Wetland.

3.2.1. Variations of Hydrographic Features

9~10 May 2014 (Dry Season). As this field campaign was conducted before the rainy season started, we considered these results to be representative for the dry season. In addition, we encountered a neap tide, thus, the tidal range during our sampling period was much less than 3 m. This implied a relatively low contribution of the offshore seawater to the Gaomei Wetland during high tide, resulting in a slightly lower salinity of surface water (salinity: 24.6, consisting of ~70% seawater); while during low tide, freshwater (salinity: ~0.35) occupied the tidal flat. The water temperature fell into a range of 21.8~29.0 °C. The wind speed ranged between 0.0~4.0 m s−1, with high ones occurring in the afternoon.
27~28 August 2014 (Wet Season). Since we encountered a spring tide during this field campaign, the tidal range was more than 4 m, which meant that more seawater intruded into the Gaomei Wetland during the flood tide. As a result, seawater (salinity: ~34.5) covered the tidal flat at high tide and a part of them remained during the low-tide period, resulting in an average salinity of ~22.0 (consisting of ~63% seawater). The water temperature ranged between 27.0~33.7 °C and the wind speed ranged between 0.0~3.6 m s−1, with higher ones prevailing during night-time.

3.2.2. Variations of 222Rn, 224Raex, 228Ra, δ18O, and δD

9~10 May 2014 (Dry Season). The temporal variations of 222Rn in coastal waters showed a close response to the tidal fluctuations with the highest values (222Rn: 495 ± 67 Bq m−3) being at low tide and the lowest one (222Rn: ~0 Bq m−3, which hereafter meant that the measured value was lower than the limit of detection) at high tide; and the 222Rn average concentration was 260 ± 102 Bq m−3. The activities of 224Raex and 228Ra in the coastal waters were low (<2 dpm 100 L−1 for 224Raex and 228Ra) at low tides but slightly higher (>7 and >5 dpm 100 L−1 for 224Raex and 228Ra, respectively) at high tides. The δ18O and δD values in the coastal waters widely ranged from −9.68 to −1.42‰ and from −63.8 to −12.7‰, respectively, showing high values at high tide and low ones at low tide.
27~28 August 2014 (Wet Season). Activities of the 222Rn in coastal waters varied from ~0 to 548 Bq m3, with an average of 181 ± 173 Bq m−3. These fluctuated with tidal cycles, displaying high activities during low-tide period but low ones during high-tide periods and reaching to peak activities about every 12 h. The activities of 224Raex ranged from 3.33 to 49.3 dpm 100 L−1 and showed a contrasting trend to those during the dry season. Coastal waters with 224Raex activities higher than 20 dpm 100 L−1 were found during the low-tide period with their salinity ranging between 19.1 and 23.4; while low 224Raex activities (<10 dpm 100 L−1) occurred during the high-tide period. The temporal variation of 228Ra activities also showed the same trend to those of 224Raex and fell into a range of 3.68~65.4 dpm 100 L−1. The δ18Oand δD values of coastal waters showed a similar temporal variation to those at dry season and ranged from −8.48 to −0.10‰ and from −59.4 to −1.1‰, respectively.

3.3. Time-Series Observations of Pore Water

Time-series sampling of pore water from 35 cm below the seabed were also carried out at the small-creek site 500 m offshore in the Gaomei Wetland, during the two field campaigns (9~10 May 2014 and 27~28 August 2014), and was analyzed for salinity, 222Rn, δ18O, and δD. The results are plotted in Figure 3 along with the tidal height.
9~10 May 2014 (Dry Season). Salinity of pore water varied from 3.70 to 7.35. Activities of 222Rn in pore waters varied from ~0 to 1526 Bq m3 with an average of 558 ± 137 Bq m−3, slightly higher than those in the coastal waters. These fluctuated with tidal cycles, but displayed different patterns from those in the coastal water. Interestingly, 222Rn activities in pore waters increased during the flooding period but decreased during the ebbing period, reaching a peak activity in about 6 h after low tide. The δ18Oand δD values ranged from −6.25 to −5.16‰ and from −43.0 to −38.3‰, respectively, which were just slightly higher than those in the groundwater samples.
27~28 August 2014 (Wet Season). Salinity of pore water varied from 10.67 to 22.62, which were higher than those during dry season, displaying a 3-h delay with tidal fluctuations. Activities of 222Rn in pore water ranged from ~0 to 1323 Bq m3, with an average of 566 ± 147 Bq m−3, showing the same pattern to that of dry seasons. Although 222Rn activities increased during the flooding period but decreased during the ebbing period, they reached a peak activity in about 3 to 4 h after the low tide. The lag time between low tide and the peak of the 222Rn concentration in pore water was possibly due to the longer time required to fill the shallow aquifer with 222Rn-riched groundwater than to drain it out. The δ18O and δD values varied between −3.98 and −0.37‰ and between −27.3 and −2.3‰, respectively, was found to be relatively higher, in comparison to those at dry season, and showed the same trend in salinity. All of this indicates that seawater re-penetrating into the seabed is equilibrated in 3 h after the high tide.

4. Discussion

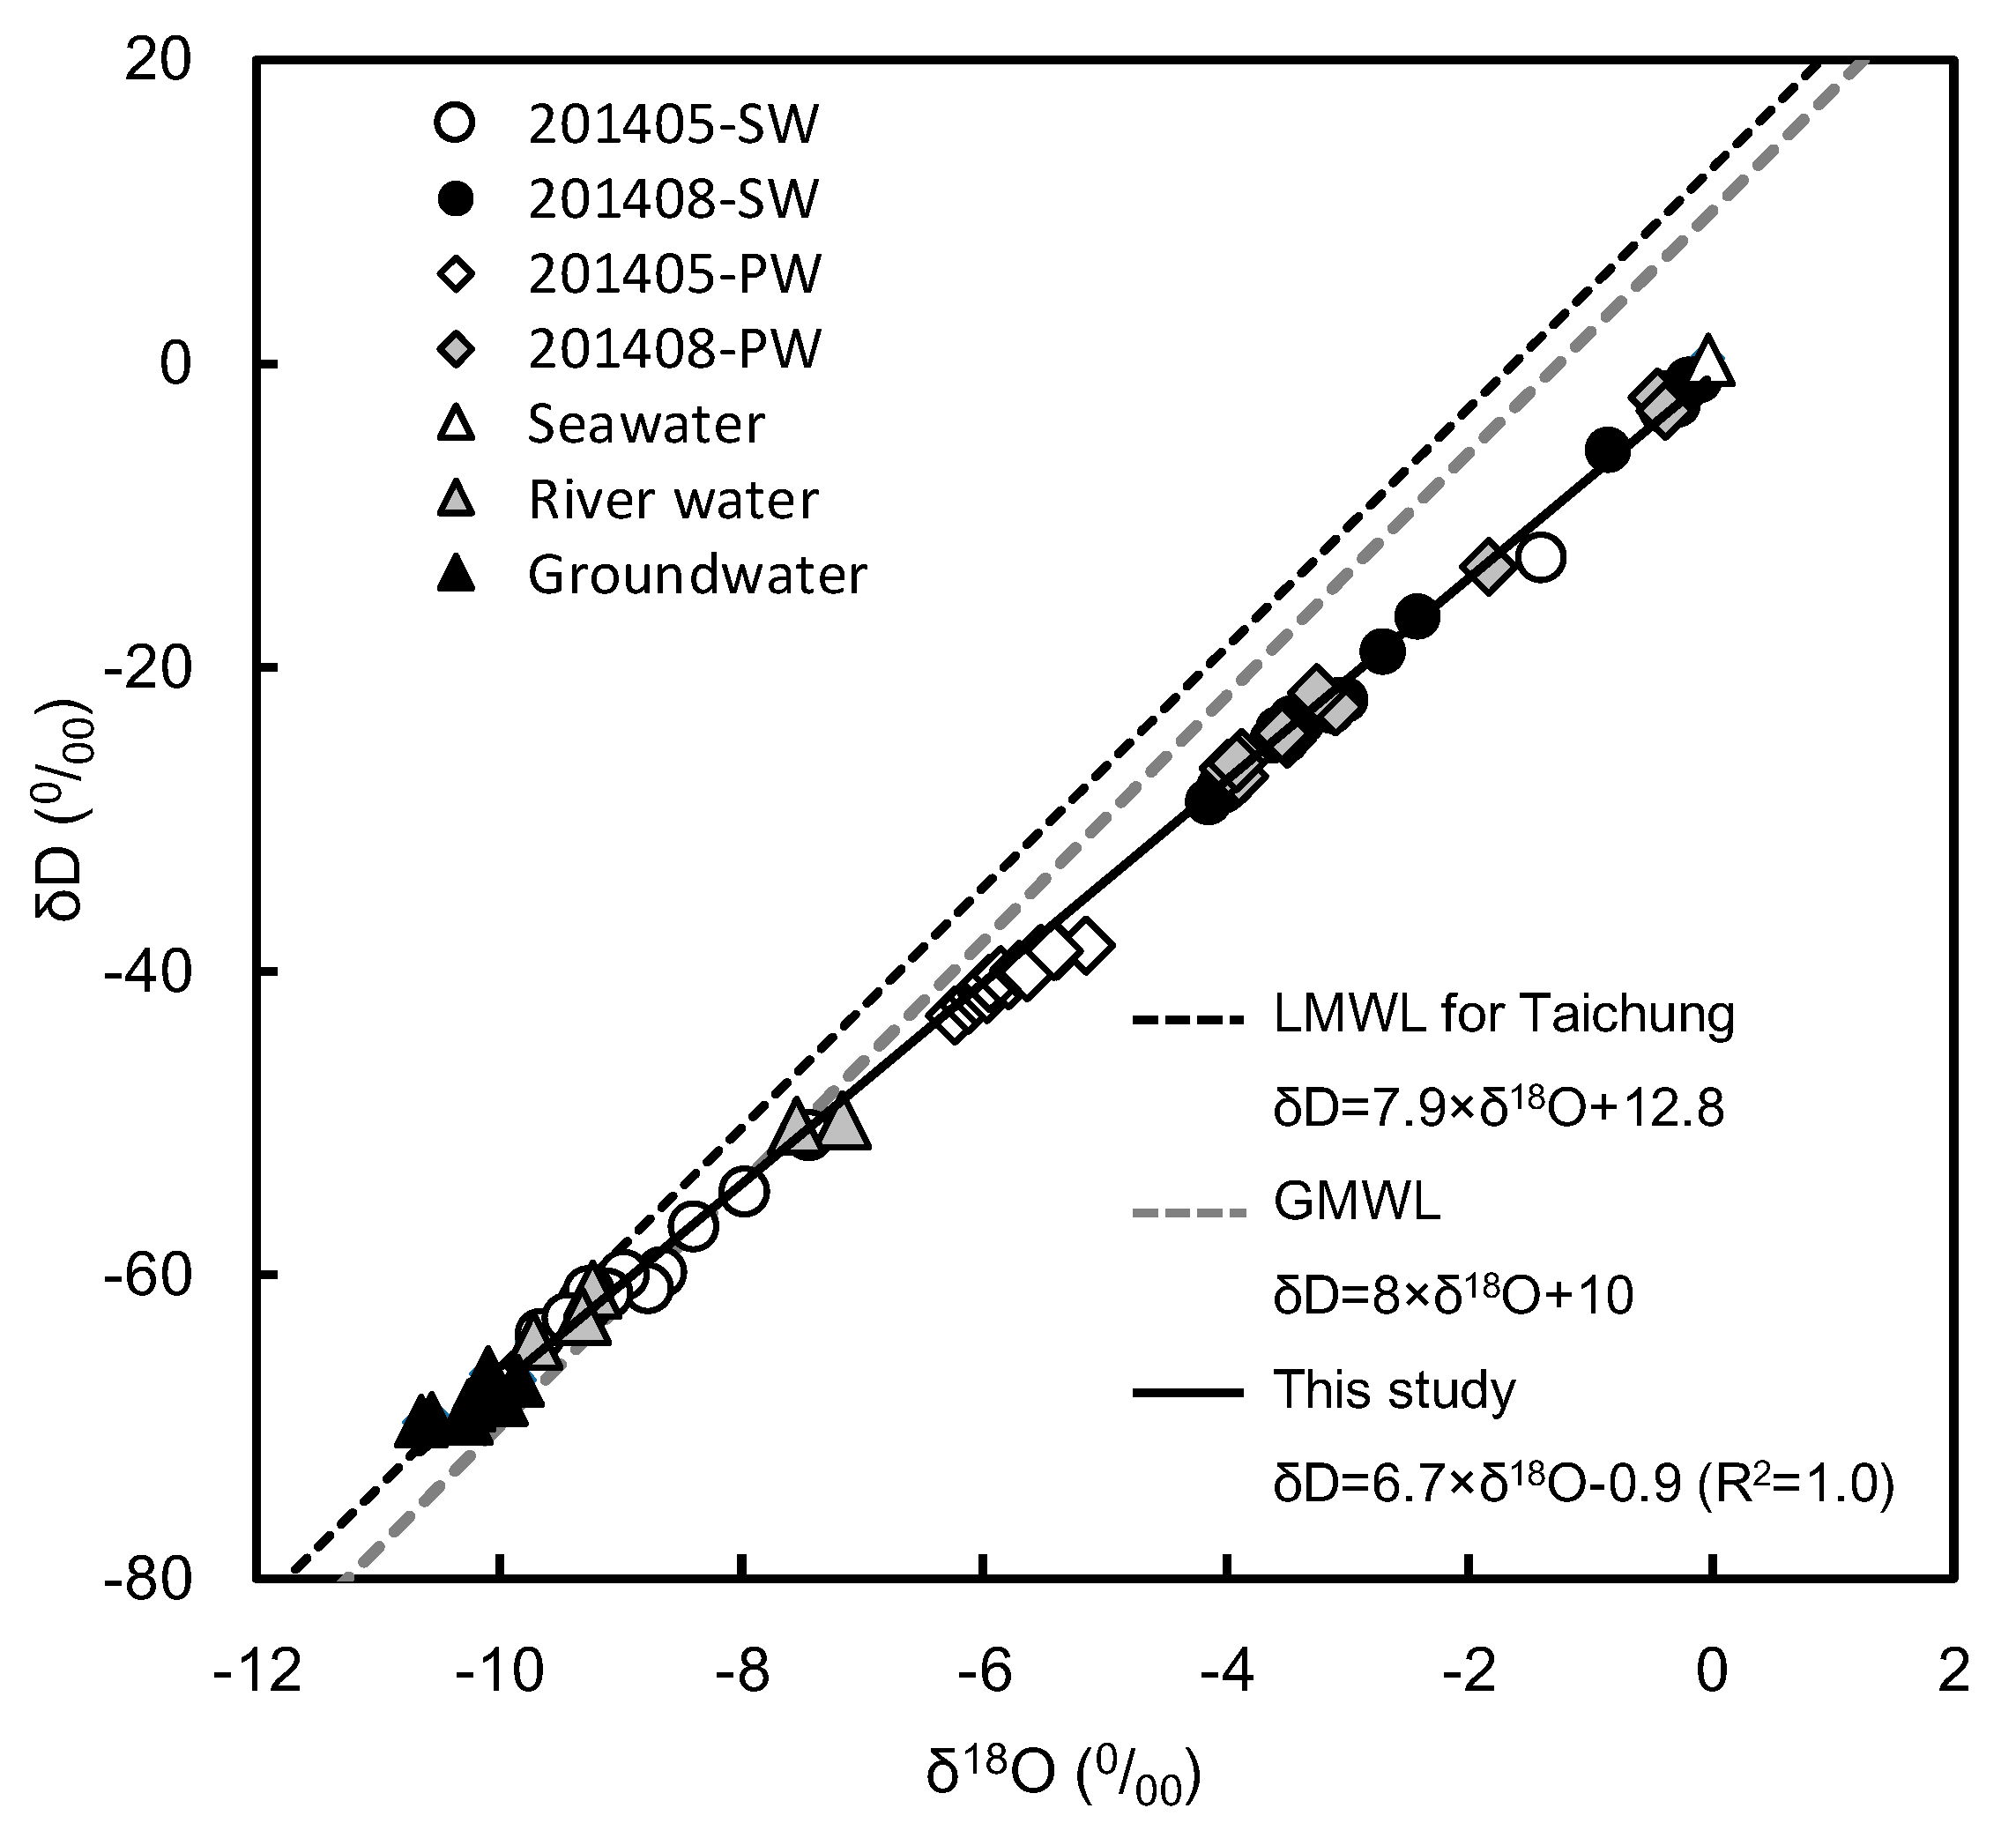
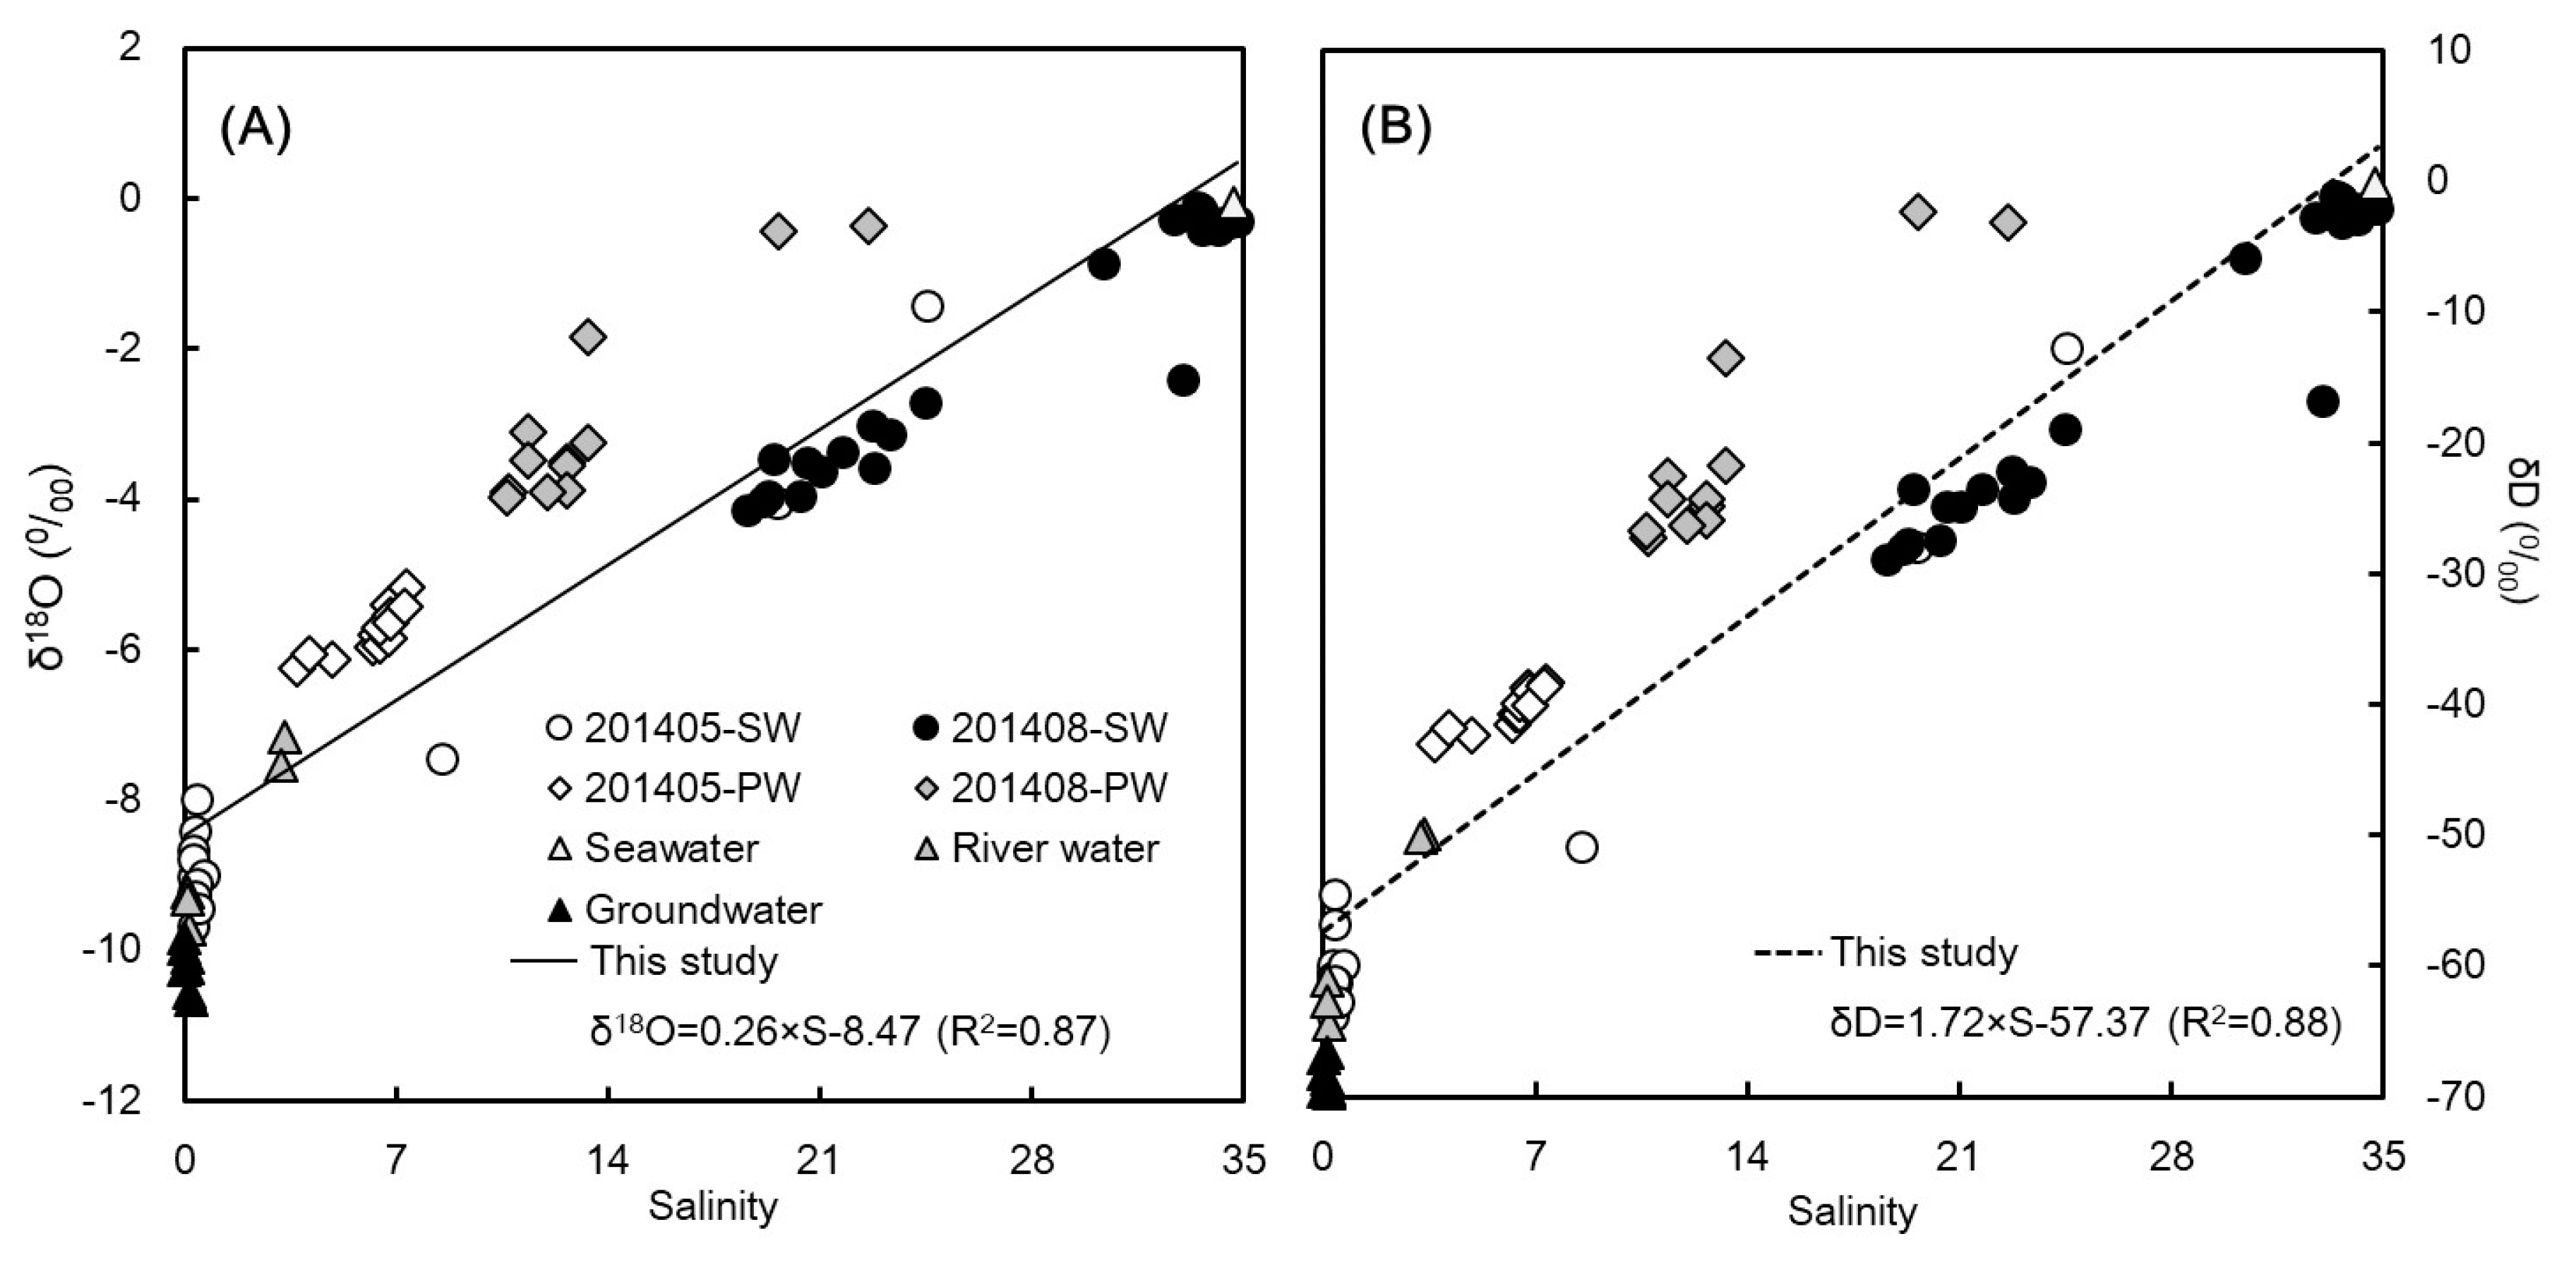
4.1. Observations of δD and δ18O

Atmospheric precipitations are the main source of groundwater recharge in the Taichung groundwater catchment (i.e., the hinterland of the Gaomei Wetland). Thus, the isotopic signatures recorded in groundwater should be obedient to those in meteoric water. The Local Meteoric Water Line (LMWL), a least-squares regression line from the stable isotopic compositions in precipitation, as recommend by the International Atomic Energy Agency (IAEA) [51], is composed of long-term isotopic signatures of the local precipitation. The calculated LMWL for Taichung is represented as follows [52]:
δD = 7.9 × δ18O + 12.8
which is parallel to the Global Meteoric Water Line (GMWL) defined by Craig [53]:
δD = 8 × δ18O + 10
In the δD versus δ18O diagram we plotted with all data determined in this study (Figure 4), the distributions of groundwater and fresh fluvial water samples fit well with the LMWL for the Taichung groundwater catchment. This indicates the following two features—(1) the stable isotopes in groundwater and fresh fluvial water were unaffected by water–rock interactions or significant evaporation and could be regarded as conservative; (2) coupled with a remarkably high 222Rn activities (1186 ± 216 Bq m−3) in fluvial water sample, we suggest there might be a contribution of groundwater to fluvial water. This further implied a significant exchange between underground water and surface runoff water for the Da-Chia River. In contrast, the isotopic compositions of brackish fluvial water, coastal water, pore water, and seawater distributed below the LMWL line, that showed a regression line (δD = 6.7 × δ18O − 0.9; R2 = 1.00) with a slightly lower slope, as compared to the LMWL. This distinguishing feature could be due to the seawater–atmospheric water vapor interactions [36]. It further indicates that the coastal and pore waters at the Gaomei Wetland originated from meteoric water and then mixed with offshore seawater.
The groundwater had low δ18O and δD values; whereas the seawater was highly enriched in 18O and D. Thus, the δ18O and δD values might well respond to salinity. In this study, the diagram of δ18O versus salinity showed a good linear relationship (δ18O = 0.26 × S − 8.47; R2 = 0.87; Figure 5A), which was similar to that observed off the coast of Southern Taiwan (δ18O = 0.24 × S − 8.33, R2 = 0.97; [26]). This confirmed that groundwater, even pore water samples, were well separated from seawater. A consistent pattern was shown in the plot of δD versus salinity (δ18O = 1.72 × S − 57.36; R2 = 0.88; Figure 5B). These further indicated that the variability in the δ18O and δD values was induced by the different fraction of seawater contributing to the collected coastal water and pore waters. The fraction of seawater in pore water could be simply calculated via two end-member mixing model of salinity. We observed about 11%~65% of seawater in the collected pore water (35 cm below the seabed), implying that the re-circulated seawater played an important role in groundwater–seawater interactions in the coastal aquifer, which meant that the re-circulated seawater mixed with fresh groundwater (i.e., brackish groundwater) might be the dominated source for SGD in the Gaomei Wetland.

4.2. Excess 224Raex and 228Ra in the Coastal Water

Figure 6 shows the diagrams of salinity versus 224Raex and 228Ra with a gray dash line representing the expected activity due to the conservative mixing between offshore seawater, and fresh fluvial water from the Da-Chia River and the Qingshui drainage. Except for the coastal water samples collected during the low-tide period of the dry season, all data points were distributed above the expected activity line, especially for the samples collected during the low-tide period of the wet season (salinity: 19.1~23.4), which were significantly higher than the expected. The excess concentrations of 224Raex and 228Ra would have originated from other sources, such as SGD, desorption the riverine suspended particles, and diffusion from benthic sediments. Here, quite low contributions (<5%) via diffusion from the benthic sediments to the total 224Ra and 228Ra budget were typically reported, thus its contribution could be ignored [54,55].
In order to calculate the excess Ra concentrations in the coastal water, the chemical mass balance for 228Ra and 224Raex could be expressed by the following equations:
E x c e s s 228 R a = 228 R a M f S 228 R a S ( 1 f S ) 228 R a R
E x c e s s 224 R a e x = 224 R a e x M f S 224 R a e x S ( 1 f S ) 224 R a e x R
where RaM, RaS, and RaR are the Ra activities in the coastal water, offshore seawater (224Raex: 1.96 ± 0.33 dpm 100L−1, 228Ra: 1.34 ± 0.21 dpm 100L−1), and fresh fluvial water (224Raex: 2.55 ± 0.47 dpm 100L−1, 228Ra: 2.85 ± 0.37 dpm 100L−1) end-members, respectively; fS is the fraction of offshore seawater, which was calculated from the ratio of the measured salinity to that of the offshore water (salinity: 34.7). According to the reported desorption experiment of Ra [56,57], the ion-exchange equilibrium was achieved within 0.5~4 h after being exposed to saline water and it reached the maximum desorption of Ra in the salinity range of 10~20. Furthermore, about 22~41% of Ra on riverine suspended sediment were available for ion-exchange [58]. In Table 2, the maximum dissolved 224Ra and 228Ra activities via desorption from riverine suspended particles were roughly calculated and the results were 12.1 ± 2.13 and 12.5 ± 2.22 dpm 100L−1, respectively. Subsequently, the excess 224Raex and 228Ra contributed by desorption from riverine suspended particles to coastal water could be subtracted by the following equation [58]:
( E x c e s s 228 R a ) = E x c e s s 228 R a ( 1 f S ) 228 R a DES ( 1 e S a l S S a l U )
( E x c e s s 224 R a e x ) = E x c e s s 224 R a e x ( 1 f S ) 224 R a DES ( 1 e S a l S S a l U )
where ( E x c e s s 228 R a ) and ( E x c e s s 224 R a e x ) are the corrected excess 228Ra and 224Raex activities in the coastal water sample; RaDES is the maximum Ra activity desorbing from riverine suspended particles (Table 2). SalS is the salinity of coastal water sample and SalU is the salinity at which the ion-exchange equilibrium is achieved. Here, we took the salinity of 20 for SalU. During the dry season, the corrected excess 228Ra and 224Raex activities in coastal water were insufficient during the low-tide period, but fell into 0.52~4.42 and 1.98~10.13 dpm 100 L−1, respectively, during the high-tide period. During the wet season, they ranged from 1.24 to 60.4 dpm 100 L−1 and from 0.17 to 44.4 dpm 100 L−1 for 228Ra and 224Raex, respectively, with significantly high values in low-tide waters. We suspected that such extremely high excess 224Raex and 228Ra activities in low-tide waters during the wet season might be caused by other 224Ra- and 228Ra-enriched inputs. Although measurements of 224Ra and 228Ra in pore water were not carried out in this study, we inferred that RSGD might be a potential source, based on the signatures of δD and δ18O in pore waters.

4.3. 222Rn mass Balance for SGD Rate Estimation

The change in the concentration of 222Rn in coastal water of the Gaomei Wetland over time is a function of (1) production from 226Ra dissolved in the seawater; (2) benthic input from sediments, including both SGD and diffusion; (3) input of 222Rn from the Da-Chia River; (4) loss of 222Rn via atmospheric evasion; (5) lowering of the 222Rn concentration by mixing with lower concentration seawater offshore; and (6) loss of 222Rn via decay. For quantifying SGD in the Gaomei Wetland via time-series 222Rn observations, a mass balance (Figure 7) was constructed as follows [30,60,61,62]:
F ( t ) = F S G D + F R a 226 + F D i f f + F R i v e r + F T i n F T o u t F A t m F d e c a y
where F(t) is the net flux of 222Rn at a specific time (t); FSGD, FRa-226, and FRiver represent the 222Rn flux attributed to SGD, supported by 226Ra in water, and discharged by the Da-Chia River, respectively. FDiff is the diffusion flux of 222Rn from the bottom sediments; Fatm is the 222Rn flux to the atmosphere, and Fdecay is the decay loss of 222Rn flux. FT-in and FT-out represent the tidal effect on 222Rn inventory, which were the fluxes entering and leaving with the incoming and outgoing tides, respectively.
If all terms are known, the FSGD can be calculated and converted to SGD flux (QSGD) by dividing by the mean 222Rn concentration in groundwater collected from artesian well, in the vicinity of the Gaomei Wetland (CGW: 9187 ± 595 Bq m−3):
Q SGD = F SGD C GW
The detailed calculation for each term in the 222Rn mass balance model are described in the following subsections.

4.3.1. The Temporal Variations of net 222Rn fluxes

To determine the 222Rn flux associated with SGD in the Gaomei Wetland, the net 222Rn flux at each time (t) was first calculated through the following equation, under the assumption of well-mixing water column [61]:
F ( t ) = I ( t ) ( 1 e λ T f ) × T f
where Tf represents the flushing time of water in the Gaomei Wetland (0.64 d; detail calculation will be described in the “Tide effect” subsection) and λ is the decay constant of 222Rn (7.56 × 10⁻³ h−1). I(t), the 222Rn inventory at each time (t), is defined as the product of the measured concentration of 222Rn (222RnM) and water depth (h) at each time (t):
I ( t ) = ( 222 R n M 226 R a S ) × h ( t )
It is regarded as 222Rn in a coastal-water column within an area of 1 m2. Here, we subtracted the activity of 222Ra in offshore water (226RaS: 0.83 Bq m−3) from the measured concentration of 222Rn (222RnM) to obtain the excess (unsupported) 222Rn. The estimates of net 222Rn flux at each time (t) were between 23.0 and 108 Bq m−2 h−1 for the dry season and between 14.0 and 192 Bq m−2 h−1 for the wet season.

4.3.2. Atmospheric loss

Gas exchange between air and water always leads to 222Rn loss to the atmosphere, and the flux could be described as follows [63]:
F a t m = k ( C w α C a )
where Fatm is the diffusion flux across the water–air interface (Bq m−2 h−1); α represents the Ostwald’s solubility coefficient, which is temperature-dependent ( α = 0.105 + 0.405 e 0.0502 T , T is the temperature of water in °C; [30]); Cw and Ca are the activity of 222Rn in water and air, respectively. Here, Cw for 222Rn was a measure of the RAD7-H2O system; while we took 5 Bq m−3 as Ca for 222Rn in Taiwan [64]. In addition, the parameter, k, represents the gas transfer velocity (m s−1), which is the key parameter for the diffusion flux across the water–air interface. An empirical equation relating k to temperature and wind speed is proposed as follows [63]:
k 600 = 0.45 U 10 1.6 ( S c / 600 ) a
where U10 is the wind speed at 10 m height above the water surface; a is a variable exponent that equals 0.6667 for U10 ≤ 3.6 m s−1 and equals 0.5, when U10 > 3.6 m s−1. Our in-situ wind speeds, which were recorded at the height of 4 m above the water surface, were converted to those at the height of 10 m, via the following equation reported by Pond [65]:
U 10 = U z [ a ln ( z / 10 ) + 1 ] 1
where z is the observation elevation (m) and a = 0.097. Moreover, the parameter, Sc, represents the Schmidt number, which is a ratio of the kinematic viscosity (ν) of water to the molecular diffusion coefficient (Dm) of gas in water, S c = v / D m , and was divided by 600 to normalize k to CO2 at 20 °C in freshwater. The molecular diffusion coefficient could be calculated via a temperature-dependent function [66,67]:
D m = 10 [ 1.59 + 980 / ( T + 273 ) ]
where T is the temperature of water in °C. The kinematic viscosity (ν) is a simple ratio of the absolute viscosity (μ) to the density (ρ) of water at a measured temperature, v = μ / ρ . In-situ density of water was recorded by the HORIBA U-50 series multi-parameter water quality meter. To calculate the absolute viscosity, we employed an empirical relationship associated to water temperature [68]:
μ = A × 10 B ( ( T + 273 ) C )
where the coefficients in the equation: A = 2.414 × 10⁻⁵ kg s−1 m−1; B = 247.8 K; C = 140 K; and T represents water temperature (°C). Based on the aforementioned method, the diffusion fluxes of 222Rn across the water–air interface ranged from 0.02 to 8.8 Bq m−2 h−1 during the wet season and from 0.01 to 14.3 Bq m−2 h−1 during dry seasons. Overall, the results showed slightly high atmospheric evasion during low tide and vice versa during high tide, because of higher concentration in water during low tide than that during high tide. This phenomenon indicated that the difference of 222Rn concentration in water and air might a dominating factor in the flux of atmospheric evasion.

4.3.3. Diffusion Flux from Bottom Sediments

Rn-222 will diffuse from the bottom sediments into the overlying water because the 222Rn concentrations in pore waters are much higher. The diffusion flux of 222Rn across the sediment–water interface could be calculated from the following equation [69]:
F s e d = ( λ ϕ D m ) 0.5 ( C e q C 0 )
where Fsed is the diffusion flux of 222Rn from the bottom sediments (Bq m−2 h−1); λ is the decay constant of 222Rn (7.56 × 10⁻³ h−1); ϕ is the porosity of sediments (0.49 for the surface sediments in our study area); Ceq and C0 are the activities of 222Rn in the pore water and the overlying seawater. Here, we took an average value of 533 Bq m−3 as the activity in pore water. Dm is the molecular diffusivity coefficient, which fell into a range between 1.22 × 10⁻⁵ and 1.64 × 10⁻⁵ cm s−1 in our study, through Equation (14). Based on Equation (16), we calculated a diffusion flux of 222Rn across the sediment–water ranging from 0.016 to 0.117 Bq m−2 h−1 in the dry season (9~10 May 2014) and from 0.003 to 0.080 Bq m−2 h−1 in the wet season (27~28 August 2014). It demonstrated that the diffusion flux from the benthic sediments was much lower, relative to the inputs of other sources.

4.3.4. Tidal Effect on Import and Export of 222Rn

Inventory of 222Rn in the Gaomei Wetland is strongly subjected to the variations of tidal height, as 222Rn form the open sea discharges with the incoming water during the flood tide; while it leaves with the outgoing water during the ebb tide. The flux of 222Rn that flows in (FT-in) and out (FT-out) of our study area could be estimated from the change of water depth (h) over each time interval (Δt), through the following equations [62]:
F T i n = h t + Δ t h t Δ t ( b C w + ( 1 b ) C s )
F T o u t = h t h t + Δ t Δ t C w
The former is for the flooding tide period; while the latter is for the ebbing tide period. Cw is the observed activity of 222Rn in the coastal water, and CS represents the 222Rn activity in the offshore seawater (0.28 Bq m−3). The term, b, is the return flow factor (i.e., the percentage of the tidal prism that returns from the offshore region during a rising tide). To calculate the return flow factor (b) in the Gaomei Wetland, we employed a tidal prism model, which is based on a mass balance of salinity [70], and obtained b = 0.39, which means offshore seawater occupies more than 60% of the total volume discharging into our study area during flood tide. We calculated the flushing time (Tf) of 0.64 days of the Gaomei Wetland using the following equation [71,72], as well:
T f = V T ( 1 b ) P
where V is the total volume of the Gaomei Wetland (1.05 × 10⁶ m3); T is the tidal period (12.5 h); P = 1.40 × 10⁶ m3 is the tidal prism, evaluated from P = Q T [71,72]. Q is the average water discharge of the Da-Chia River, which is displayed in the next section. In summary, we obtained the outflowing fluxes of 222Rn, ranging from 5.67 to 37.3 Bq m−2 h−1; while the incoming 222Rn fluxes varied between 1.98 and 16.43 Bq m−2 h−1.

4.3.5. 222Rn Input from the Da-Chia River

The Da-Chia River is one of the 222Rn sources that we have to consider for obtaining the 222Rn attributed to SGD. The averaged water discharge (QRiver) of the Da-Chia River was 31 m3 s−1 [39] and the 222Rn activity in river water was on average 1186 ± 216 Bq m−3. The resulting 222Rn-river flux from the Da-Chia River into the Gaomei Wetland was 18.9 Bq m−2 h−1.

4.3.6. SGD Rate Estimating

With all known sources and sinks of 222Rn for the Gaomei Wetland, we estimated the 222Rn flux attributed to SGD (FSGD) and then converted this flux to an SGD flux (QSGD) by dividing by the 222Rn end-member concentration in groundwater (CGW: 9187 ± 595 Bq m−3). The estimated SGD fluxes into the Gaomei Wetland over the experimental periods during both dry and wet seasons fluctuated with the tidal cycles, showing higher fluxes during the low-tide period, and lower ones during the high-tide period (Figure 8). This indicated that SGD fluxes across the seabed was not in a steady state over the time scales of tidal period, but response to the tides that reached a peak about every 12 h. For the dry season, the SGD fluxes varied between 0.2 and 25 cm d−1, with an average value of 12.9 ± 7.7 cm d−1. For the wet season, it ranged from 0.1 to 47 cm d−1, with a mean value of 19.0 ± 13.6 cm d−1 (Figure 8, Table 3). The slightly high SGD fluxes occurring at spring tide of wet season might have resulted from a much stronger tidal pumping, coupled with a large hydraulic gradient in land. It implied that the general fluctuation of SGD into the Gaomei Wetland responds to both hydraulic gradient and tidal effect. A dry season (i.e., less groundwater recharge) caused a relatively low difference of hydraulic heads between groundwater and seawater, which might result in decreasing SGD fluxes, or even seawater intruding into the coastal aquifer [73]. In the wet season, high groundwater recharge, which implies an increasing hydraulic gradient in land, conversely leading to a rising amount of freshwater from the seawards land flows; thus, fresh groundwater discharging offshore is enhanced [73]. On the other hand, due to tidal pumping, the recirculated seawater mixed with fresh groundwater, moves out through the shallow aquifer and sediments, at low tide. The difference of hydraulic heads between groundwater and seawater increases, and then causes larger SGD fluxes [11]. At high tide, the difference of hydraulic heads between groundwater and seawater decreases, so the SGD fluxes decreased as well, or even seawater flows into the shallow aquifer and sediments [11].

4.3.7. Uncertainty Analysis

It should be pointed out that the estimates of the SGD fluxes through the mass balance model of 222Rn are always subject to inherent uncertainties associated with its sources and sinks. In our calculation, the uncertainties attributed to the diffusion from sediments, the atmospheric loss, and the fluvial input are less important. A 10% change on 222Rn fluxes of diffusion from sediments, atmospheric loss, and fluvial input result in 0.5 %, 0.1%, and 5% changes of the SGD flux, respectively. Uncertainty analysis exhibited that the SGD estimates are highly sensitive to the 222Rn end-member value of groundwater, with a 10% shift in the 222Rn concentration of groundwater results in 10% change in SGD flux.
To confirm if our estimates are credible, we roughly calculated the SGD rates through Darcy’s Law:
V = i × k
where V is the flow rate of groundwater (m s−1), i is the hydraulic gradient, and k is the hydraulic conductivity (m s−1). For groundwater in the catchment of the Da-Chia River, i ranges from 0.007 to 0.01; while k varies between 2.0 × 10⁻⁵ and 1.0 × 10⁻³ m s−1 [41]. Thus, the groundwater-flowing rate falls into a range between 1.20 and 86.4 cm d−1 (Table 3). In addition, based on a seepage-meter measurement, Lin [24] reported an SGD flux into the Gaomei Wetland of 1.68 cm d−1, which consisted of 65% of fresh groundwater. All of these results show good agreements with our SGD estimates from a 222Rn mass balance model.

4.4. SGD-born DIC and Nutrient Fluxes

We used the average SGD flux estimates (12.9 ± 7.7 cm d−1 for dry season; 19.0 ± 13.6 cm d−1 for wet season) and the average DIC concentration in groundwater (1.63 ± 0.09 mM; [59]) to calculate the SGD-born DIC flux to the Gaomei Wetland. The results were 1.5 × 10⁶ and 2.2 × 10⁶ mol d−1 in the dry and wet seasons, respectively. These fluxes were ~26% of the DIC flux from the Da-Chia River (7.1 × 10⁶ mole d−1). Our SGD-born DIC flux was comparable to the result obtained in the Okatee Estuary, South Carolina, (1.5 × 10⁶ mole d−1; [72]), where is a similarly scaled estuary, as compared to our study area. Our results were much lower than those obtained in the North South China Sea (NSCS) shelf, off the Perl River (419 × 106~950 × 106 mole d−1; [14]). Here, a high DIC concentration in the groundwater led to a high SGD-born DIC flux.
Once exported to the coastal zone, the SGD-induced DIC could be consumed by biological production, which was stimulated by the nutrients supplied from underground water [14]. Lin [24] reported that the SGD-derived nutrient fluxes into the Gaomei Wetland were 53.5 × 10³ and 1.71 × 10³ mole d−1 for N and P, respectively. They were about 57% for N and 70% for P, as compared to those exported from the Da-Chia River. In addition, the N to P ratio was 31.3, well above the Redfield ratio of 16 [74], which suggests that SGD-derived nutrient inputs might drive the Gaomei Wetland to P limitation. Based on the Redfield ratio (C:N:P = 106:16:1; [74]), the SGD-derived nutrient might be responsible for a new production up to 0.18 × 10⁶ mole C d−1, which meant that ~11% of SGD-derived DIC would contribute to the new production. This was comparable to the result observed in NSCS shelf, off the estuary of the Pearl River [14]. We confirmed that SGD is an important pathway for carrying nutrients and DIC from land to the coastal ocean and plays a non-negligible role in the biogeochemical cycle.

5. Summary

We reached the following summaries based on a time-series investigation of 222Rn, 224Raex, 228Ra, δ18O and δD in coastal water, and pore water over 2 tidal cycles in both dry (9~10 May 2014) and wet (27~28 August 2014; encountering a spring tide) seasons, at a station 500 m offshore in the Gaomei Wetland, Western Taiwan.
A.
In the wet season, 224Raex and 228Ra activities in the coastal waters were high (>20 dpm 100 L−1) during the low-tide period, but relatively low (<10 dpm 100 L−1) during the high-tide one; whereas an opposite trend was displayed in the dry season. The much higher 224Raex and 228Ra activities in the low-tide water in the wet season might not have resulted from the contribution of Ra desorption from marine suspended particles; coupled with the δ18O and δD signatures of water, it indicated a source of RSGD.
B.
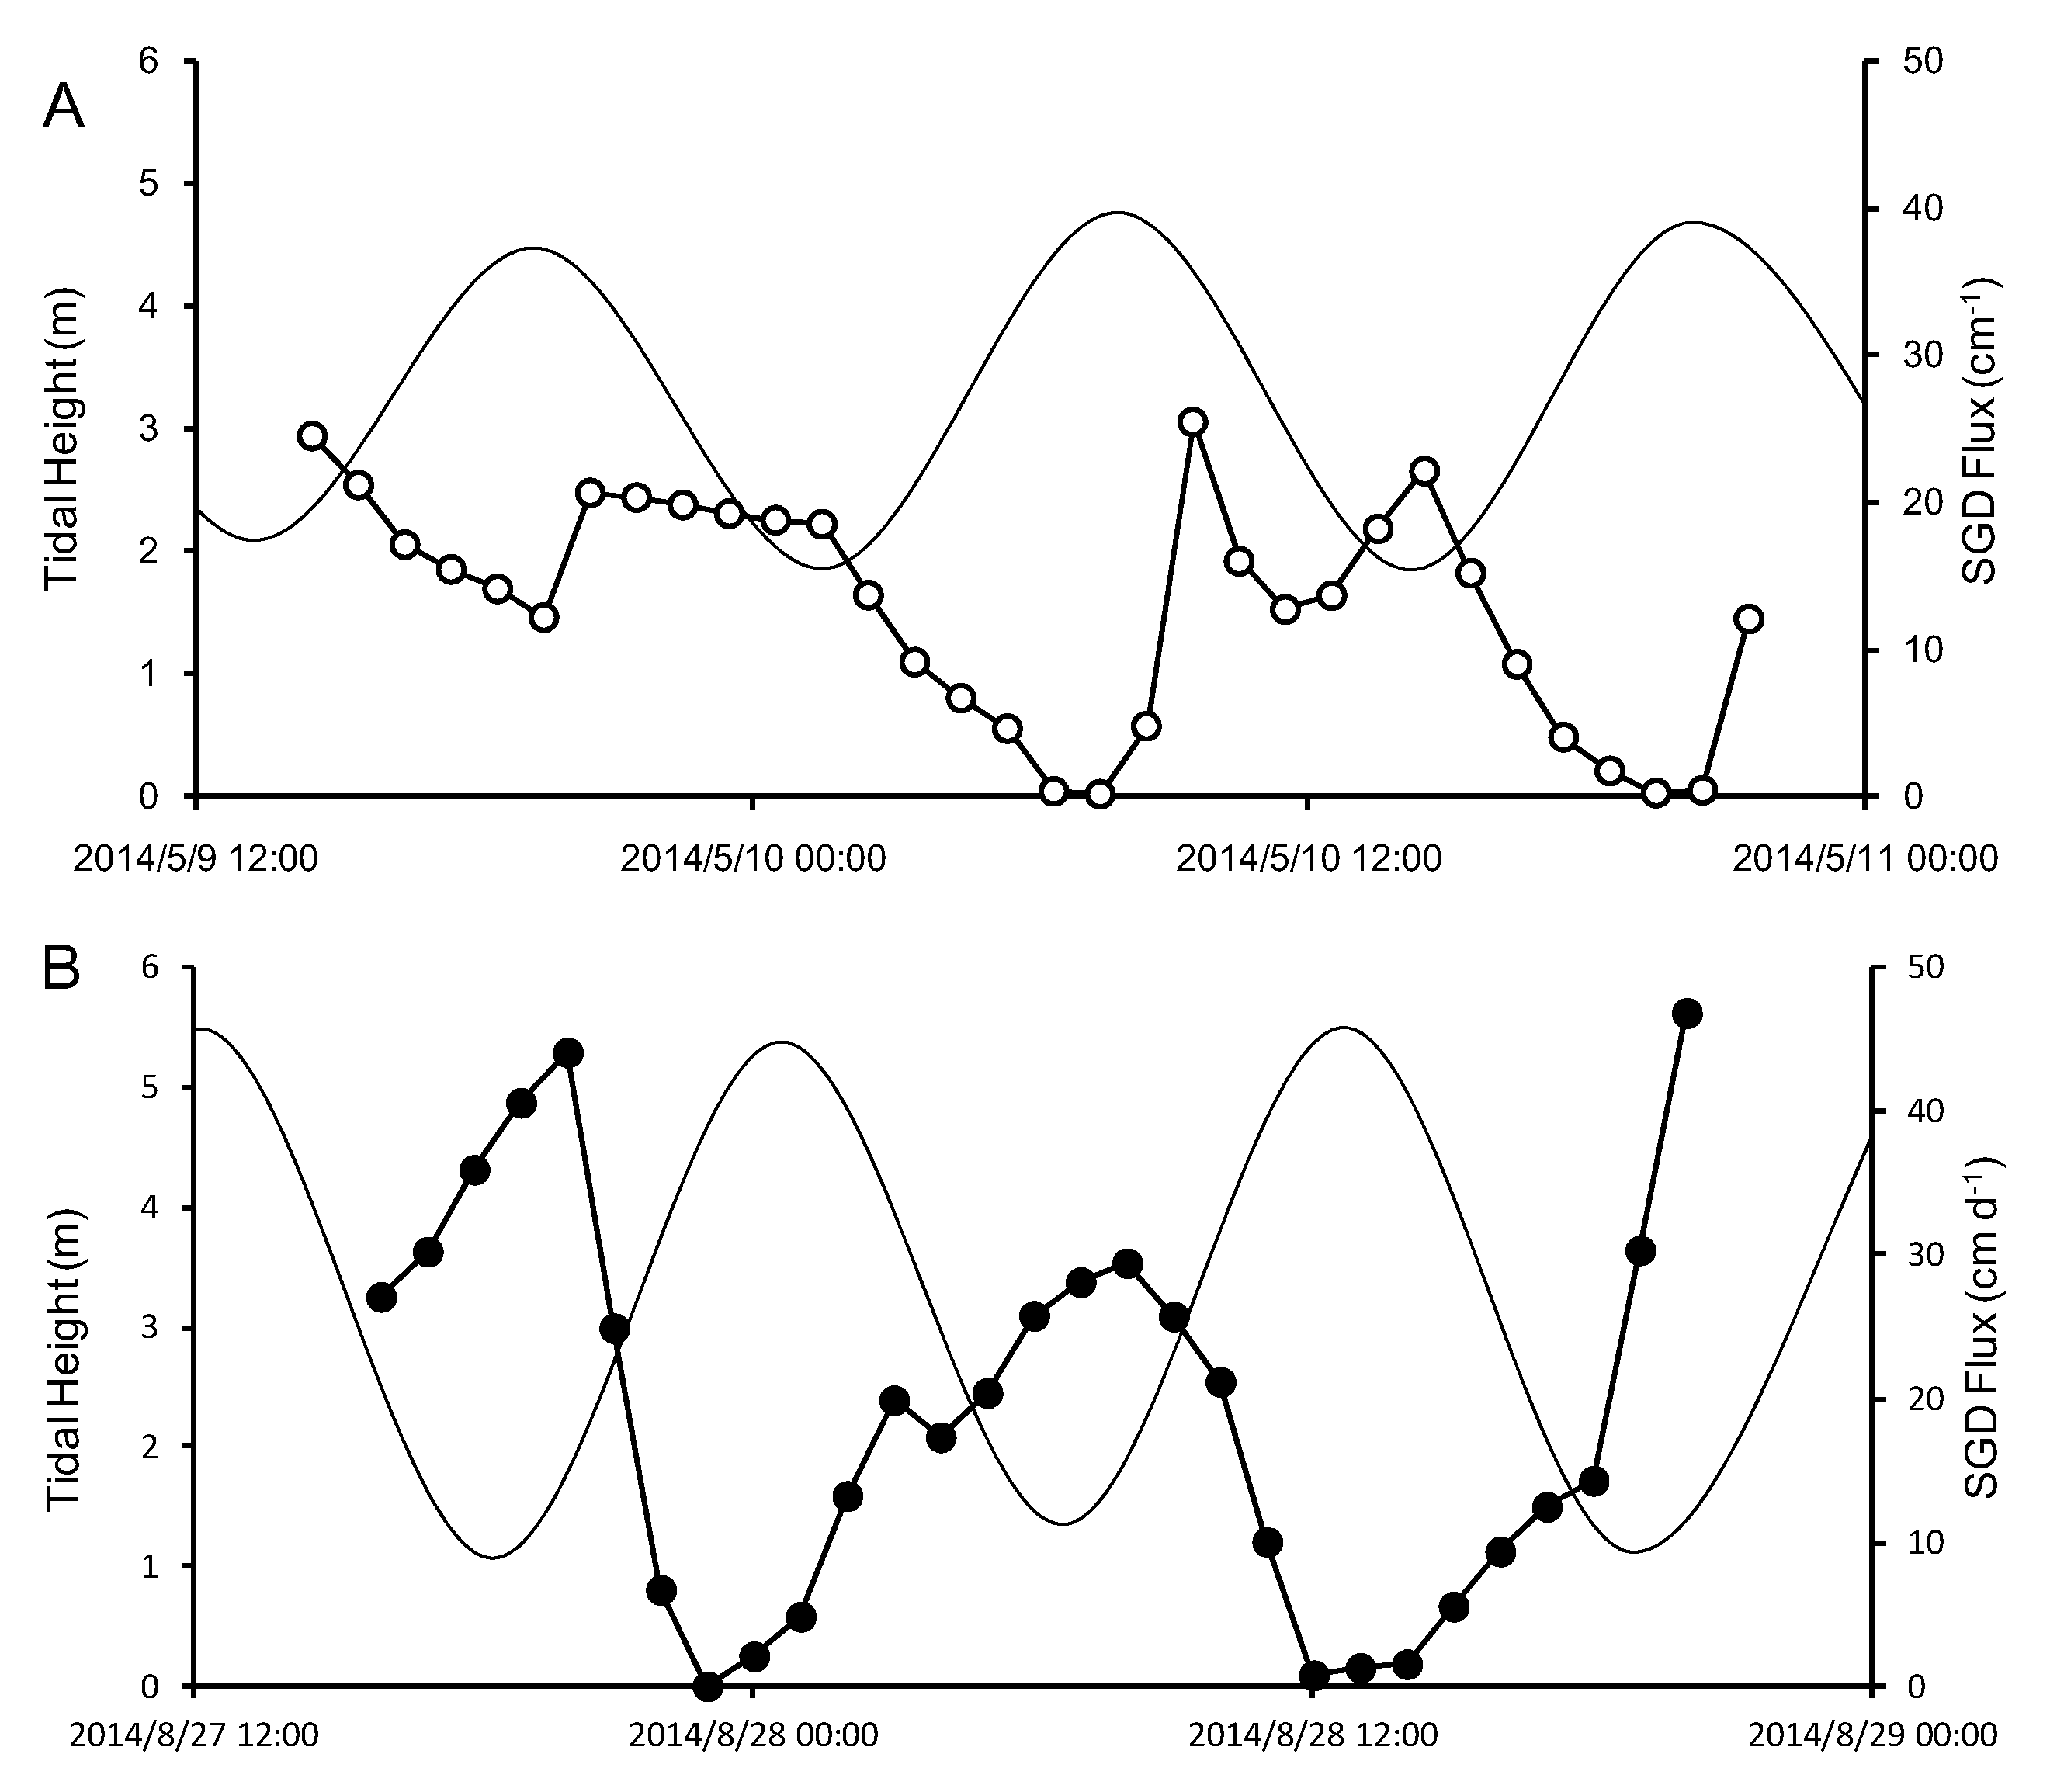
The time-series observations of 222Rn showed the same trends regardless of wet and dry seasons, with higher activities at low tides and lower ones at high tides. Based on a 222Rn mass balance model taking all sources and sinks into account, we estimated an SGD flux into the Gaomei Wetland, ranging from 0.1 to 47 cm d−1, which varied with tide fluctuation, with low rate during the high-tide period, but a high one during the low-tide period. This confirmed the importance of tidal pumping in driving SGD. The slightly higher fluxes during the wet season (average SGD flux = 19.0 ± 13.6 cm d−1) compared to the dry season (average SGD flux = 12.9 ± 7.7 cm d−1) indicated a stronger tidal pumping coupled with a large hydraulic gradient in land.
C.
The DIC fluxes via SGD into the Gaomei Wetland were estimated to be 1.5 × 10⁶ and 2.2 × 10⁶ mol d−1 in the dry and wet seasons, respectively, ~26% of the river-borne DIC flux from the Da-Chia River. In addition, the SGD-derived nutrient fluxes were 53.5 × 10³ and 1.71 × 10³ mole d−1 for N and P, respectively, which were about 57% for N and 70% for P, as compared to those exported from the Da-Chia River. Such exports of nutrients and the DIC fluxes via SGD could have had an impact on the coastal biogeochemistry in the Gaomei Wetland.

Author Contributions

Data curation, F.-H.H. and I.-T.L.; Formal analysis, F.-H.H.; Investigation, F.-H.H.; Methodology, F.-H.H., C.-C.S., P.-L.W. and I.-T.L.; Resources, C.-C.S.; Supervision, C.-C.S., P.-L.W., and I.-T.L.; Writing—original draft, F.-H.H.; Writing—review & editing, C.-C.S., P.-L.W. and I.-T.L. All authors have read and agreed to the published version of the manuscript.

Funding

This research received no external funding.

Acknowledgments

We deeply appreciate Y.-L. Chang, Y.-H. Chen, S.-T. Hsu, and C.-K. Huang for their contribution in the field works. Special thank goes to Jan C. Scholten, Institute of Geosciences, Christian-Albrechts-University of Kiel, for providing constructive comments, which greatly improved this manuscript. This work was supported by the Ministry of Science and Technology, Taiwan (MOST 104-2611-M-002-015, 105-2611-M-002-005, and 105-2917-I-002-007). Above all, this article is dedicated to our advisor, Dr. Chih-An Huh (1952~2015), Institute of Earth Sciences, Academia Sinica, Taipei, Taiwan, who is a pioneer in the field of radiogeochemistry in Taiwan.

Conflicts of Interest

The authors declare no conflict of interest.

References

  1. Sonrel, L. Le Fond de la mer. L; Hachette et Cie: Paris, France, 1868; p. 340. [Google Scholar]
  2. Moore, W.S. Large groundwater inputs to coastal waters revealed by 226Ra enrichments. Nature 1996, 380, 612–614. [Google Scholar] [CrossRef]
  3. Taniguchi, M.; Burnett, W.C.; Cable, J.E.; Turner, J.V. Investigations of submarine groundwater discharge. Hydrol. Process. 2002, 16, 2115–2129. [Google Scholar] [CrossRef]
  4. Burnett, W.C.; Bokuniewicz, H.; Huettel, M.; Moore, W.S.; Taniguchi, M. Groundwater and pore water inputs to the coastal zone. Biochemistry 2003, 66, 3–33. [Google Scholar] [CrossRef]
  5. Moore, W.S. The effect of submarine groundwater discharge on the ocean. Annu. Rev. Mar. Sci. 2010, 2, 59–88. [Google Scholar] [CrossRef] [Green Version]
  6. Michael, H.A.; Mulligan, A.E.; Harvey, C.E. Seasonal oscillations in water exchange between aquifers and the coastal ocean. Nature 2005, 436, 1145–1148. [Google Scholar] [CrossRef]
  7. Santos, I.R.; Eyre, B.D.; Huuettel, M. The driving forces of pore water and groundwater flow in permeable coastal sediments: A review. Estuar. Coast. Shelf Sci. 2012, 98, 1–15. [Google Scholar] [CrossRef]
  8. Robinson, C.; Li, L.; Barry, D.A. Effect of tidal forcing on a subterranean estuary. Adv. Water Resour. 2007, 30, 851–865. [Google Scholar] [CrossRef]
  9. Robinson, C.; Brovelli, A.; Barry, D.A.; Li, L. Tidal influence on BTEX biodegradation in sandy aquifers. Adv. Water Resour. 2009, 32, 16–28. [Google Scholar] [CrossRef]
  10. Michael, H.A.; Charette, M.A.; Harvey, C.F. Patterns and variability of groundwater flow and radium activity at the coast: A case study from Waquoit Bay, Massachusetts. Mar. Chem. 2011, 127, 100–124. [Google Scholar] [CrossRef]
  11. Taniguchi, M. Tidal effects on submarine groundwater discharge into the ocean. Geophys. Res. Lett. 2002, 29. [Google Scholar] [CrossRef]
  12. Liu, Y.; Jiao, J.-J.; Liang, W.-Z. Tidal Fluctuation Influenced Physicochemical Parameter Dynamics in Coastal Groundwater Mixing Zone. Estuaries Coasts 2018, 14, 988–1001. [Google Scholar] [CrossRef]
  13. Cai, W.-J.; Wang, C.-Y.; Krest, J.; Moore, W.S. The geochemistry of dissolved inorganic carbon in a surficial groundwater aquifer in North Inlet, South Carolina, and the carbon fluxes to the coastal ocean. Geochim. Cosmochim. Acta 2003, 67, 631–639. [Google Scholar] [CrossRef]
  14. Liu, Q.; Dai, M.; Chen, W.; Huh, C.-A.; Wang, G.; Li, Q.; Charette, M.A. How significant is submarine groundwater discharge and its associated dissolved inorganic carbon in a river-dominated shelf system? Biogeosciences 2012, 9, 1–19. [Google Scholar] [CrossRef] [Green Version]
  15. Hu, C.-M.; Muller-karger, F.E.; Swarzenski, P. Hurricanes, submarine groundwater discharge, and Florida’s red tides. J. Geophys. Res. 2006, 33, L11601. [Google Scholar] [CrossRef]
  16. Lee, Y.-W.; Kim, G. Linking groundwater-borne nutrients and dinoflagellate red-tide outbreaks in the southern sea of Korea using a Ra tracer. Estuar. Coast. Shelf Sci. 2007, 71, 309–317. [Google Scholar] [CrossRef]
  17. Su, N.; Burnett, W.C.; MacIntyre, H.L.; Liefer, J.D.; Peterson, R.N.; Viso, R. Natural radon and radium isotopes for assessing groundwater discharge into Little Lagoon, AL: Implication for harmful algal blooms. Estuaries Coasts 2014, 37, 893–910. [Google Scholar] [CrossRef]
  18. Ting, C.-S. Groundwater Resources Evaluation and Management for Pingtung Plain, Taiwan. Ph.D. Thesis, Vrije Universiteit Amsterdam, Amsterdam, The Netherlands, 1997; p. 199. [Google Scholar]
  19. Central Geological Survey (CGS). Taiwan groundwater monitoring network project phase I: Pingtung. Final Summary of Hydrogeology Investigation; Ministry of Economic Affairs: Taipei, Taiwan, 2002; p. 172. (In Chinese) [Google Scholar]
  20. Peng, T.-R.; Chen, C.-T.A.; Wang, C.-H.; Zhang, J.; Lin, Y.-J. Assessment of terrestrial factors controlling the submarine groundwater discharge in water shortage and highly deformed Island of Taiwan, Western Pacific Ocean. J. Oceanogr. 2008, 64, 323–337. [Google Scholar] [CrossRef]
  21. Chiang, H.-C.; Tong, L.-T.; Chen, K.-Y.; Lu, W.-C.; Liao, J.-W.; Tsai, M.-F.; Wu, P.-J. The spatial variation of principal chemical constituents in groundwater of Cho-Shui Chi Basin, Central Taiwan. J. Taiwan Agric. Eng. 2013, 59, 165–171, (In Chinese with English Abstract). [Google Scholar]
  22. Chen, C.-T.A.; Zhang, J.; Peng, T.R.; Hagiwara, T. Exploratory sampling of submarine groundwater discharge in Taiwan. Geochemistry 2005, 39, 165–171. [Google Scholar]
  23. Chen, C.-T.A.; Zhang, J.; Peng, T.R.; Kandasamy, S.; Wang, D.; Lin, Y.-J. Submarine groundwater discharge around Taiwan. Acta Oceanol. Sin. 2018, 37, 18–22. [Google Scholar] [CrossRef]
  24. Lin, Y.-J. Preliminary Measurement of Submarine Groundwater Discharge in Taiwan. MS Thesis, National Sun Yat-Sen University, Kaohsiung, Taiwan, 2007; p. 139, (In Chinese with English Abstract). [Google Scholar]
  25. Lin, I.-T.; Wang, C.-H.; You, C.-F.; Lin, S.; Huang, K.-F.; Chen, Y.-G. Deep submarine groundwater discharge indicated by tracers of oxygen, strontium isotopes and barium content in the Pingtung coastal zone, southern Taiwan. Mar. Chem. 2010, 122, 51–58. [Google Scholar] [CrossRef]
  26. Lin, I.-T.; Wang, C.-H.; Lin, S.; Chen, Y.-G. Groundwater -seawater interactions off the coast of southern Taiwan: Evidence from environmental isotopes. J. Asian Earth Sci. 2011, 41, 250–262. [Google Scholar] [CrossRef]
  27. Zavialov, P.O.; Kao, R.-C.; Kremenetskiy, V.V.; Peresypkin, V.I.; Ding, C.-F.; Hsu, J.-T.; Kopelevich, O.V.; Korotenko, K.A.; Wu, Y.-S.; Chen, P. Evidence for submarine groundwater discharge on the southwestern shelf of Taiwan. Cont. Shelf Res. 2012, 34, 18–25. [Google Scholar] [CrossRef]
  28. Kao, R.-C.; Zavialov, P.O.; Ding, C.-F. Investigation and assessment of submarine groundwater discharge of Ping-Tung nearshore area in southwestern Taiwan. Irrig. Drain. 2013, 62, 10–17. [Google Scholar] [CrossRef]
  29. Wang, S.-L.; Chen, C.-T.A.; Huang, T.-H.; Tseng, H.-C.; Lui, H.-K.; Peng, T.-R.; Kandasamy, S.; Zhang, J.; Yang, L.; Gao, X.; et al. Submarine groundwater discharge helps making nearshore waters heterotrophic. Sci. Rep. 2018. [Google Scholar] [CrossRef] [Green Version]
  30. Burnett, W.C.; Dulaiova, H. Estimating the dynamics of groundwater input into the coastal zone via continuous radon-222 measurements. J. Environ. Radioact. 2003, 69, 21–35. [Google Scholar] [CrossRef]
  31. Mulligan, A.E.; Charette, M.A. Intercomparison of submarine groundwater discharge estimates from a sandy unconfined aquifer. J. Hydrol. 2005, 327, 411–425. [Google Scholar] [CrossRef]
  32. Li, Y.-H.; Mathieu, G.; Biscaye, P.; Simpson, H.J. The flux of 226Ra from estuarine and continental shelf sediments. Earth Planet. Sci. Lett. 1977, 37, 237–241. [Google Scholar] [CrossRef]
  33. Li, Y.-H.; Chan, L.-H. Desorption of Ba and 226Ra from river-borne sediments in the Hudson estuary. Earth Planet. Sci. Lett. 1979, 43, 343–350. [Google Scholar] [CrossRef]
  34. Taniguchi, M.; Nakayama, T.; Tase, N.; Shimada, J. Stable isotope studies of precipitation and river water in the Lake Biwa basin, Japan. Hydrol. Process. 2000, 14, 539–556. [Google Scholar] [CrossRef]
  35. Povinec, P.P.; Bokuniewicz, H.; Burnett, W.C.; Cable, J.; Charette, M.; Comanducci, J.-F.; Kontar, E.A.; Moore, W.S.; Oberdorfer, J.A.; Oliveira, J.; et al. Isotope tracing of submarine groundwater discharge offshore Ubatuba, Brazil: Results of the IAEA-UNESCO SGD project. J. Environ. Radioact. 2008, 89, 81–101. [Google Scholar] [CrossRef] [PubMed]
  36. Povinec, P.P.; Oliveira, J.; Braga, E.S.; Comanducci, J.-F.; Gastaud, J.; Groening, M.; Levy-Palomo, I.; Morgenstern, U.; Top, Z. Isotopic, trace element and nutrient characterization of coastal waters from Ubatuba inner shelf area, southeastern Brazil. Estuar. Coast. Shelf Sci. 2008, 76, 522–542. [Google Scholar] [CrossRef]
  37. Schiavo, M.A.; Hauser, S.; Povinec, P.P. Stable isotopes of water as a tool to study groundwatereseawater interactions in coastal south-eastern Sicily. J. Hydrol. 2009, 364, 40–49. [Google Scholar] [CrossRef]
  38. Povinec, P.P.; Burnett, W.C.; Beck, A.; Bokuniewicz, H.; Charette, M.; Gonneea, M.E.; Groening, M.; Ishitobi, T.; Kontar, E.; Liong Wee Kwong, L.; et al. Isotopic, geophysical and biogeochemical investigation of submarine groundwater discharge: IAEA-UNESCO intercomparison exercise at Mauritius Island. J. Environ. Radioact. 2012, 104, 24–45. [Google Scholar] [CrossRef]
  39. Water Resources Agency (WRA). Hydrological Year Book of Taiwan, 2014: Part II-River Stage and Discharge; Water Resources Agency, Ministry of Economic Affairs: Taipei, Taiwan, 2015; p. 579. (In Chinese) [Google Scholar]
  40. Lee, C.-H.; Chen, W.-P.; Lee, R.-H. Estimation of groundwater recharge using water balance coupled with base-flow-record estimation and stable-base-flow analysis. Environ. Geol. 2006, 51, 73–82. [Google Scholar] [CrossRef]
  41. Water Resources Agency (WRA). Assessment of the Impacts on Groundwater Environment Caused by Conjunctive Use of Taan and Dajia Rivers Water Resource; Water Resources Agency, Ministry of Economic Affairs: Taipei, Taiwan, 2008; p. 257. (In Chinese) [Google Scholar]
  42. Xu, B.-C.; Burnett, W.; Lane-Smith, D.; Yu, Z.-G. A simple laboratory-based radon calibration system. J. Radioanal. Nucl. Chem. 2010, 283, 457–463. [Google Scholar] [CrossRef]
  43. Moore, W.S. Sampling 228Ra in the deep ocean. Deep Sea Res. 1976, 23, 647–651. [Google Scholar] [CrossRef]
  44. Moore, W.S. Fifteen years experience in measuring 224Ra and 223Ra by delayed-coincidence counting. Mar. Chem. 2008, 109, 188–197. [Google Scholar] [CrossRef]
  45. Giffin, C.; Kaufman, A.; Broecker, W. Delayed coincidence counter for the assay of action and thoron. J. Geophys. Res. 1963, 68, 1749–1757. [Google Scholar] [CrossRef]
  46. Moore, W.S.; Arnold, R. Measurement of 223Ra and 224Ra in coastal water using a delayed coincidence counter. J. Geophys. Res. 1996, 101, 1321–1329. [Google Scholar] [CrossRef]
  47. Garcia-Solsona, E.; Garcia-Orellana, J.; Masqué, P.; Dulaiova, H. Uncertainties associated with 223Ra and 224Ra measurements in water via a Delayed Coincidence Counter (RaDeCC). Mar. Chem. 2008, 109, 198–219. [Google Scholar] [CrossRef]
  48. Chang, Y.-L. Estimating SGD Flux in the Pingtung Plain Coastal Area Using Radon and Radium Isotopes. MS Thesis, National Taiwan University, Taipei, Taiwan, 2015; p. 68, (In Chinese with English Abstract). [Google Scholar]
  49. Lin, C.-Y. Spatial Distribution of Radon-in-Water around Taiwan: A Preliminary Result. MS Thesis, National Taiwan University, Taipei, Taiwan, 2012; p. 65, (In Chinese with English Abstract). [Google Scholar]
  50. Central Weather Bureau (CWB). Tidal Observation Data Annual Report, 2014; Central Weather Bureau, Ministry of Transportation and Communications: Taipei, Taiwan, 2015; p. 636. [Google Scholar]
  51. International Atomic Energy Agency (IAEA). Statistical Treatment of Data on Environmental Isotopes in Precipitation; Technical Report Series No. 337; International Atomic Energy Agency: Vienna, Austria, 1992; p. 781. [Google Scholar]
  52. Wang, C.-H.; Kuo, C.-H.; Peng, T.-R.; Chen, W.-F.; Liu, T.-K.; Chiang, C.-J.; Liu, W.-C.; Hung, J.-J. Isotope characteristics of Taiwan groundwaters. West. Pac. Earth Sci. 2001, 1, 415–428. [Google Scholar]
  53. Craig, H. Isotopic variations in meteoric water. Science 1961, 133, 1702–1703. [Google Scholar] [CrossRef] [PubMed]
  54. Garcia-Solsona, E.; Masqué, P.; Garcia-Orellana, J.; Rapaglia, J.; Beck, A.J.; Cochran, J.K.; Bokuniewicz, H.J.; Zaggia, L.; Collavini, F. Estimating submarine groundwater discharge around Isola La Cura, northern Venice Lagoon (Italy), by using the radium quartet. Mar. Chem. 2008, 109, 292–306. [Google Scholar] [CrossRef]
  55. Rapaglia, J.; Ferrarin, C.; Zaggia, L.; Moore, W.S.; Umgiesser, G.; Garcia-Solsona, E.; Garcia-Orellana, J.; Masqué, P. Investigation of residence time and groundwater flux in Venice Lagoon: Comparing radium isotope and hydrodynamical models. J. Environ. Radioact. 2010, 101, 571–581. [Google Scholar] [CrossRef]
  56. Hancock, G.J. The Effect of Salinity on the Concentrations of Radium and Thorium in Sediments. Master’s Thesis, Australian National University, Canberra, Australia, 1993; p. 128. [Google Scholar]
  57. Webster, I.T.; Hancock, G.J.; Murray, A.S. Modelling the effect of salinity on radium desorption from sediments. Geochimica et Cosmochimica Acta 1995, 59, 2469–2476. [Google Scholar] [CrossRef]
  58. Krest, J.M.; Moore, W.S.; Rama. 226Ra and 228Ra in the mixing zones of the Mississippi and Atchafalaya Rivers: Indicators of groundwater input. Mar. Chem. 1999, 64, 129–154. [Google Scholar] [CrossRef]
  59. Hsu, F.-H. Submarine Groundwater Discharge along the Coast of the Taiwan Strait Indicated by Source and Sink Transport of Radium. Ph.D. Thesis, National Taiwan University, Taipei, Taiwan, 2018; p. 119. (In English). [Google Scholar]
  60. Lambert, M.J.; Burnett, W.C. Submarine groundwater discharge estimates at a Florida coastal site based on continuous radon measurements. Biogeochemistry 2003, 66, 55–73. [Google Scholar] [CrossRef]
  61. Dimova, N.T.; Burnett, W.C. Evaluation of groundwater discharge into small lakes based on the temporal distribution of radon-222. Limnol. Oceanogr. 2011, 56, 486–494. [Google Scholar] [CrossRef]
  62. Zhang, Y.; Li, H.; Wang, X.; Zeng, C.; Wang, C.; Xiao, K.; Wan, L.; Wang, X.; Jiang, X.; Guo, H. Estimation of submarine groundwater discharge and associated nutrient fluxes in eastern Laizhou Bay, China using 222Rn. J. Hydrol. 2016, 533, 103–113. [Google Scholar] [CrossRef]
  63. MacIntyre, S.; Wanninkhof, R.; Chanton, J. Trace gas exchange across the air-water interface in freshwater and coastal marine environments. In Biogenic Trace Gases: Measuring Emissions from Soil and Water; Matson, P.A., Hariss, C., Eds.; Blackwell Science: New York, NY, USA, 1995; pp. 52–97. [Google Scholar]
  64. Mei, C.T.Y.; Wu, C.F.; Weng, P.S. Monitoring of environmental Radon-222 in selected areas of Taiwan province of the republic of China. In Radiation Protection: A Systematic Approach to Safety; International Radiation Protection Association: Washington, DC, USA, 1980; pp. 1119–1122. [Google Scholar]
  65. Pond, S. The exchange of momentum, heat and moisture at the ocean-atmosphere interface. Proceedings of the Symposium. In Numerical Models of Ocean Circulation; National Academy of Sciences: Washington, DC, USA, 1975; pp. 26–28. [Google Scholar]
  66. Peng, T.H.; Takatashi, T.; Broecker, W.S. Surface radon measurements in the North Pacific Ocean station Papa. J. Geophys. Res. 1974, 79, 1772–1780. [Google Scholar] [CrossRef]
  67. Ullman, W.J.; Aller, R.C. Diffusion coefficients in nearshore marine sediments. Limnol. Oceanogr. 1982, 27, 552–556. [Google Scholar] [CrossRef]
  68. Seeton, C.J. Viscosity-temperature correlation for liquids. Tribol. Lett. 2006, 22, 67–78. [Google Scholar] [CrossRef]
  69. Martens, C.S.; Kipphut, G.W.; Klump, Y.V. Sediment-Water Chemical Exchange in the Coastal Zone Traced by in situ Radon-222 Flux Measurements. Science 1980, 208, 285–288. [Google Scholar] [CrossRef]
  70. Luketina, D. Simple tidal prism models revisited. Estuar. Coast. Shelf Sci. 1998, 46, 385–393. [Google Scholar] [CrossRef]
  71. Sanford, L.; Boicourt, W.; Rives, S. Model for estimating tidal flushing of small embayments. J. Waterw. Port Coast. Ocean Eng. 1992, 118, 635–654. [Google Scholar] [CrossRef]
  72. Moore, W.S.; Blanton, J.O.; Joye, S.B. Estimates of flushing times, submarine groundwater discharge, and nutrient fluxes to Okatee Estuary, South Carolina. J. Geophys. Res. 2006, 111, C09006. [Google Scholar] [CrossRef]
  73. Burnett, W.C.; Aggarwal, P.K.; Aureli, A.; Bokuniewicz, H.; Cable, J.E.; Charette, M.A.; Kontar, E.; Krupa, S.; Kulkarni, K.M.; Loveless, A.; et al. Quantifying submarine groundwater discharge in the coastal zone via multiple methods. Sci. Total Environ. 2006, 367, 498–543. [Google Scholar] [CrossRef]
  74. Redfield, A.C. On the proportions of organic derivatives in sea water and their relation to the composition of plankton. In James Johnstone Memorial Volume; University Press of Liverpool: Liverpool, UK, 1934; Volume 176, pp. 177–192. [Google Scholar]
Figure 1. The map of the Gaomei Wetland with all sampling locations. A is the time-series station. D, E, and F show the sites of the artesian wells around the Gaomei Wetland where the groundwater samples were taken. B (the outlet of Qingshui drainage) and C (the estuary of Da-Chia River) are the locations where the fluvial waters were sampled as landward sources; whereas at station G, an offshore seawater sample was taken as a seaward source (adapted from Google Earth).
Water 12 01806 g001
Figure 2. The diagrams display the temporal variations of salinity, activities of 222Rn, 224Raex and 228Ra, δ18O, and δD in coastal water collected from the Gaomei Wetland (left: Dry season, 9~10 May 2014; right: Wet season, 27~28 August 2014) with tidal height and wind speed. All of these revealed variations with tidal fluctuations.
Water 12 01806 g002
Figure 3. The plots show the temporal variations of salinity, of 222Rn, δ18O, and δD in the pore water samples collected from 35 cm below the seabed at the Gaomei Wetland (left: dry season, 9~10 May 2014; right: wet season, 27~28 August 2014) together with the tidal height.
Water 12 01806 g003
Figure 4. The plot of δD vs. δ18O for all water samples collected from the Gaomei Wetland, including SW (surface coastal water), PW (pore water form 35 cm below the seabed), groundwater, river water (water samples from the outlet of Da-Chia River and Qingshui drainage), and offshore seawater. The solid line shows its linear regression line (δD = 6.7 × δ18O − 0.9; R2 = 1.0); while the black dotted line is the Local Meteoric Water Line (LMWL; δD = 7.9 × δ18O + 12.8; [52]) for the Taichung groundwater catchment and the gray line is the Global Meteoric Water Line (GMWL; δD = 8 × δ18O + 10; [53]).
Water 12 01806 g004
Figure 5. The diagram of (A) δ18O and (B) δD vs. salinity for all water samples collected from the Gaomei Wetland, including SW (surface coastal water), PW (pore water from 35 cm below the seabed), groundwater, river water (from the outlet of the Da-Chia River and the Qingshui drainage), and offshore seawater. They showed good linear relationships with salinity: (A) δ18O = 0.26 × S − 8.47, R2 = 0.87, and (B) δD = 1.27 × S − 57.37, R2 = 0.88.
Water 12 01806 g005
Figure 6. The plots of salinity vs. 224Raex and 228Ra activities in the coastal water. The gray dotted line represents the expected activity due to conservative mixing between fresh fluvial water and offshore seawater.
Water 12 01806 g006
Figure 7. A synoptic diagram of the 222Rn mass balance model in the Gaomei Wetland.
Water 12 01806 g007
Figure 8. The plots show the results of SGD flux into the Gaomei Wetland over the experimental periods (A) 2014/05/09 14:30~2014/5/10 21:30, dry season; (B) 2014/08/27 16:00~2014/08/28 20:00, wet season, based on an 222Rn mass balance model with a 222Rn concentration of 9187 (Bq m−3) as the groundwater end-member value. The estimated SGD flux fluctuated with tide, showing higher flux at low tide but a lower one at high tide.
Water 12 01806 g008
Table 1. Salinity, 222Rn, 224Raex, 228Ra, δ18O, and δD in the samples of groundwater, river water and offshore seawater (“-“: No data and N.D.: lower than limit of detection).
Station IDSampling TimeSalinity222Rn
(Bq m−3)
224Raex
(dpm 100L−1)
228Ra
(dpm 100L−1)
δ18O
(‰)
δD
(‰)
Groundwater
Artesian Well
D2014/08/29 15:490.06760 ± 517--−9.97 ± 0.01−68.2 ± 0.09
2014/08/29 15:540.06196 ± 493----
2014/12/18 16:470.17837 ± 5561.23 ± 0.161.62 ± 0.21−10.24 ± 0.03−68.7 ± 0.15
2015/09/09 16:350.210,974 ± 6650.84 ± 0.20-−10.65 ± 0.04−69.7 ± 0.23
E2014/08/29 15:350.013,460 ± 729--−9.84 ± 0.01−67.0 ± 0.05
2014/08/29 15:400.011,627 ± 670----
2014/12/18 16:350.113,712 ± 7440.52 ± 0.081.37 ± 0.23−10.09 ± 0.02−66.6 ± 0.03
F2014/12/18 17:100.07428 ± 5480.83 ± 0.190.62 ± 0.09−10.26 ± 0.04−69.6 ± 0.06
2015/09/09 17:000.24687 ± 4322.06 ± 0.32-−10.55 ± 0.03−69.4 ± 0.08
River water
Qingshui Drainage
B2014/12/19 11:483.2818 ± 1786.82 ± 0.934.69 ± 0.74−7.54 ± 0.02−50.2 ± 0.12
2014/12/19 11:493.3---−7.17 ± 0.05−49.9 ± 0.03
2015/09/09 16:400.2289 ± 1064.31 ± 0.79-−9.72 ± 0.03−64.4 ± 0.14
Da-Chia River
C2014/12/19 10:250.11170 ± 2141.97 ± 0.312.85 ± 0.37−9.31 ± 0.05−62.8 ± 0.18
2015/09/09 16:580.11202 ± 2171.39 ± 0.31-−9.22 ± 0.03−61.1 ± 0.11
Offshore seawater
G2014/03/19 12:1334.7N.D.1.96 ± 0.331.34 ± 0.21−0.07 ± 0.04−0.21 ± 0.19
Table 2. Calculation of the maximum desorption of 224Ra and 228Ra from riverine suspended particles.
Item224Ra228Ra
Total Ra in sediments (dpm g−1) [59]2.18 *2.30
Fraction of desorbable Ra [58]0.330.32
Desorbable Ra (dpm g−1)0.710.74
Riverine suspended particle (g 100L−1) [39]17 ± 317 ± 3
Maximum dissolved Ra by desorption from suspended particle (dpm 100L−1) **12.1 ± 2.1312.5 ± 2.22
* Total 224Ra in sediments was not measured directly, but was inferred from the 228Th. ** The calculation followed Krest et al. [58].
Table 3. The estimated submarine groundwater discharge (SGD) rates in the Gaomei Wetland through different approaches.
ApproachEstimated SGD Rate (cm d−1)
Lee-type seepage meter1.68 [24]
Darcy’s Law1.20~86.4 *
222Rn mass balance model0.2~25 (Dry season)
0.1~47 (Wet season)
* The parameter of hydraulic gradient was adopted from WRA [41].

