Abstract
Storm water drainage system in urban areas became a deterministic system, especially in light of the current climate changes. This system eliminates the excess water resulting from heavy rainfall, which leads to disruption of daily life. Irregular maintenance of the network system, problems appear, especially the blockage of the covers or network pipes, which affects the efficiency of the network. This study deals with the experimental investigation of blockage on storm network system and the relationship between efficiency of the system and blockage parameters. Many scenarios of blockage within grate and pipe were studied and its impact on storm system efficiency calculated. For the pipe system, two scenarios were studied; the first one is the blockage of end main pipe with relative blockage height (15%, 30%, 50%, 70%, and 90%). The second one is the blockage through the main pipe with relative blockage height (25%, 50%) and relative blockage length (33%, 67%, and 100%). For grate, the blockage is investigated with the blockage area ratio (12.5%, 25%, 37.5%, and 50%). In addition, the combined blockage of grate and pipe was studied. Finally, an equation has been created to estimate the system efficiency as a function of blockage ratios and system discharges. The results indicated that for surface blockage (12.5%, 25%, 37.5%, and 50%), the discharge efficiency decreased as the amount of blockage increased with different grate blockage by (17.8%, 19.3%, 21%, and 24.6%), respectively.
1. Introduction
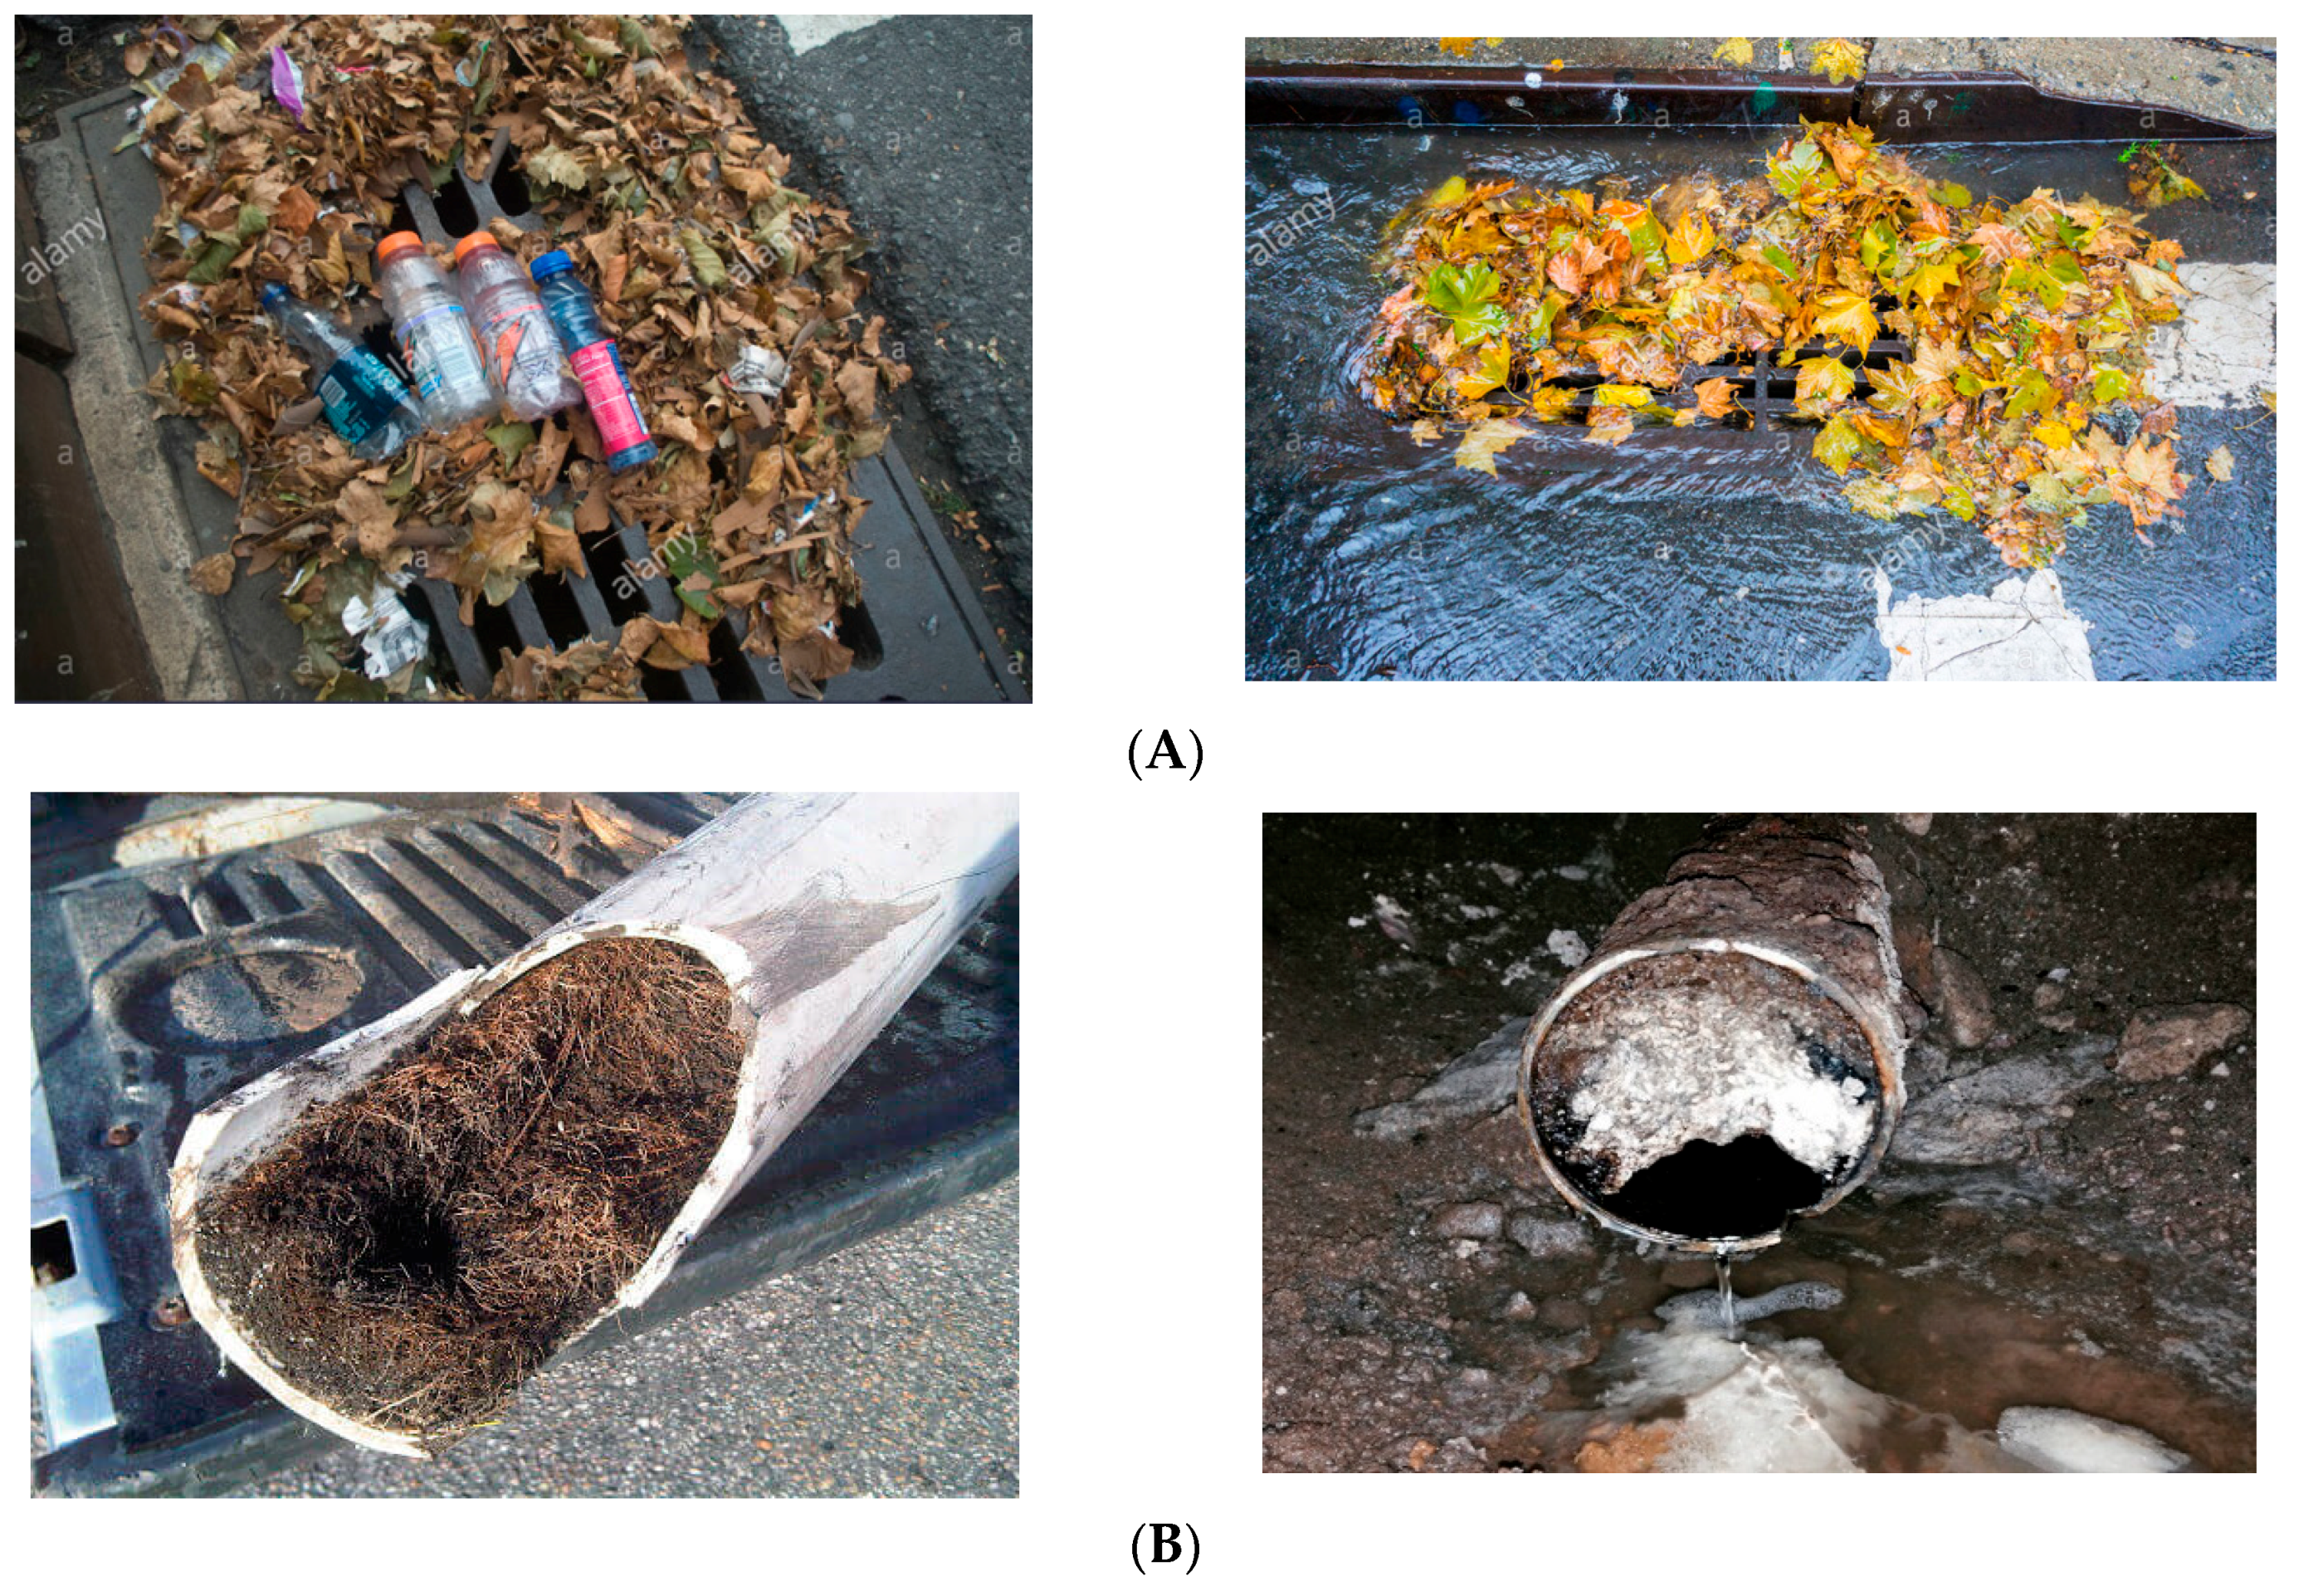
Blocked storm network is the main element that affects system overall efficiency and has a negative impact on the surrounding area. Storm network systems carry water from ranking water in grassy areas and other places in which leaves, twigs, pebbles, and soil can get washed through the grate inlets of a storm system and potentially block the outlet pipe or actually fill up the catch basin itself. Material items can appear on top of the grating and stop water flowing through the slats of grate inlet; a different blockage view can be seen in Figure 1. Thus, the efficiency of drainage system will decrease, so that storm drain checks and sometimes routine maintenance is needed on a semi-regular or annual basis. In fact, just checking and removing a foreign object from the grate is needed to keep a storm network working at 100% efficiency.
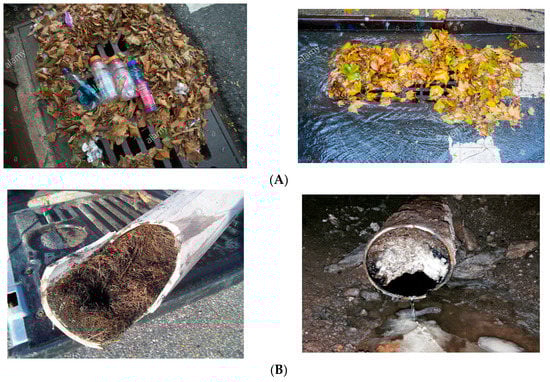
Figure 1.
Different ratios of blockage. (A) blockage through grate cover (B) blockage through storm pipes https://www.alamy.com/stock-photo/blocked-drain.html (2019).
Woo and Jones (1974) [1] carried out experiments to make suggestions on both the hydraulic capacity and safety of the inlets for bicycle riders by trying inlets with different tilting angles.
Forbes (1976) [2] presented a numerical procedure to calculate the flow into both depressed and under-pressed curb inlets. Assuming steady flow, he divided the flow field into several intermediate cross-sections and studied the flow over a succession of short intervals for which the flow conditions could be assumed to remain constant. At the end of each time step, the quantity, direction, and velocity of the flow at each cross-section were recomputed. In this way, he was able to calculate the amount of water that flowed over the inlet lip between cross-sections.
Hotchkiss (1994) [3] and Soares (1991) [4] studied the effects of altering a curb inlet’s entrance and exit transitions with the hope of improving inlet efficiency. Their experiments tested several sharp and smooth entrance and exit transitions, yet none had any significant effects on inlet efficiency or reducing the oblique standing wave. Pezzaniti et al. (1999) [5] presented an investigation on street hydraulic capacity. It was found that the street storm water capacity at a sump is in fact dictated by the storage capacity rather than the conveyance capacity.
Russo and Gómez (2009) [6] studied experimentally four types of grates found typically in Spain and differing in the alignment and distribution of the slots, under different longitudinal slopes and five approaching flows. They formulated four linear relations, one for each grating type, which link the hydraulic efficiency to some particular flow conditions (Froude number and water depth) and the grating length. The efficiency of Portuguese gullies was numerically studied by Patil and Patil (2011) [7]. Talking about effects of bad drainage on roads, they explained that the effect of poor drainage condition on roads is very adverse. It causes the failure of the road in different ways. A proper drainage system provided to the road increases its life, but an improper drainage system causes the failure of the road at its early age.
Comport and Thornton (2012) [8] examined a curb inlet and two combination inlets in accordance with the different road conditions by means of designing a one-third Froude-scale model of a two-lane road section, and they developed equations for practical applications.
Beniamino et al. (2013) [9] studied the hydraulic efficiency of continuous transverse grates, despite the importance and the general use of this type of surface drainage structure. They used flume with dimension 1.5 m wide and 5.5 m long with a platform able to simulate road lanes with transverse slopes up to 4% and a longitudinal slope up to 10%. With the available system capacity, it is possible to test inlet grates and study their hydraulic capacity for a large set of flows (0–200 L\s). Linear equations relating to hydraulic efficiency, E, and Froude number, F, were presented.
Sezenöz et al. (2014) [10] conducted a numerical study to analyze a recently planned grated inlet system for small roads. For this reason, Flow 3D software was used to model the physical conditions of the setup including a rectangular channel of 0.9 meters’ width and continuous transverse grate system, which was located based on the setup. The results obtained in this study were compared with the previous ones that had been based on the experimental data collection.
Cumhur et al. (2015) [11] observed that there is a close interdependence between the total flow rate and the grate efficiency. The results indicate that hydraulic efficiency increases when the total flow increases as well. Nevertheless, after a certain point, degradation of efficiency occurs despite the progressing increase in the total flow rate. Grate opening areas ratio is taken into consideration; the inlet having 1 cm bars and 2 cm spacing is hydraulically the most efficient grate, and it corresponds to an opening area ratio of 49.5%. Hydraulic performance of the grate systems and the corresponding grate efficiency is influenced by various configurations of the grates such as location, number of grates, and the distance between the two successive grate inlets.
Manuel et al. (2016) [12] studied grate efficiency numerically and experimentally. The results indicate that the comparison is acceptable in most cases. Therefore, inlet grates that cannot be tested in a laboratory can be studied with the 3D model, to approach its efficiency. Veerappan R. and Le (2016) [13] studied the effect of different type of grates on the hydraulic efficiencies in terms of flow interception by using a network of overhanging pipes. The results indicated that the existing grate inlet designs can intercept up to 96% of the surface run-off. Feidong et al. (2017) [14] found that drop manholes are effective energy dissipaters widely employed in urban drainage networks. The hydraulic performance of circular manholes was investigated experimentally concerning their energy dissipation in three models of different drop heights. It was concluded that the local head loss coefficient is solely dependent on the dimensionless drop parameter for free surface outflow without a downstream backwater effect. Based on experimental results, empirical equations for different outflow conditions are proposed for practical applications.
Several studies used the dimensional analysis technique to get the empirical equations that relate their studied parameters together; see Čarnogurská et al. (2016) [15], Zeleňáková et al. (2012) [16] and Zeleňáková et al. (2013) [17].
Tu and Traver (2018) [18] used ANCOVA (Analysis of Covariance) to inspect the clogging influence with flow rate plotted next to the actual pipe length times the square root of the mean pressure head and found that it was important during little or no rainfall. During larger storms, clogging had a slight effect on pipe performance because larger storms might also move the debris, thus exposing the orifices. The study concluded that the recent maintenance schedule was adequate to keep the distribution pipe at an acceptable performance even though partial clogging can exist.
Vani et al. (2019) [19] presented a plan for using flow sensor and ultrasonic sensor in pipe network system to detect leakage and overflow, respectively, with the help of Wireless Sensor Network (WSN) which is based on ZigBee technology and Internet of Things (IOT). The system problem, which can be detected by an alert, is sent through the mobile app to the authorities in the Municipal Corporation prior overflow or any blockage to avoid leakage.
Hesarkazzazi et al. (2020) [20] elaborated on the significance of owning severance (e.g., different flow paths as in loops) under simultaneous hydraulic design in storm networks. An innovative approach based on complex network properties is introduced to analytically and sequentially minimize the number of loops and, therefore, the level of redundancy, from a given grid-like (street) network. A procedure based on hydrodynamic modelling is utilized to find the ideal design costs for all shaped structures while satisfying a number of hydraulic design limitations. The results indicated that having loop and introducing extra capacity without determining suitable added pipes positions in the system (flow direction) can even worsen the efficiency of water discharge.
This paper aims to study the effect of blockage ratio on the efficiency of storm drainage systems. Three scenarios were considered through this study. The first scenario studied the effect of pipe blockage for two ratios (the first at the end of pipe and the second along the pipe). The second scenario studied the effect of surface blockage at grate inlets. The third scenario investigated the effect of combined blockage (pipe and grate blockage). Finally, an empirical equation was created to calculate system efficiency as s function of blockage ratio and system discharge.
2. Materials and Methods
2.1. Dimensional Analysis
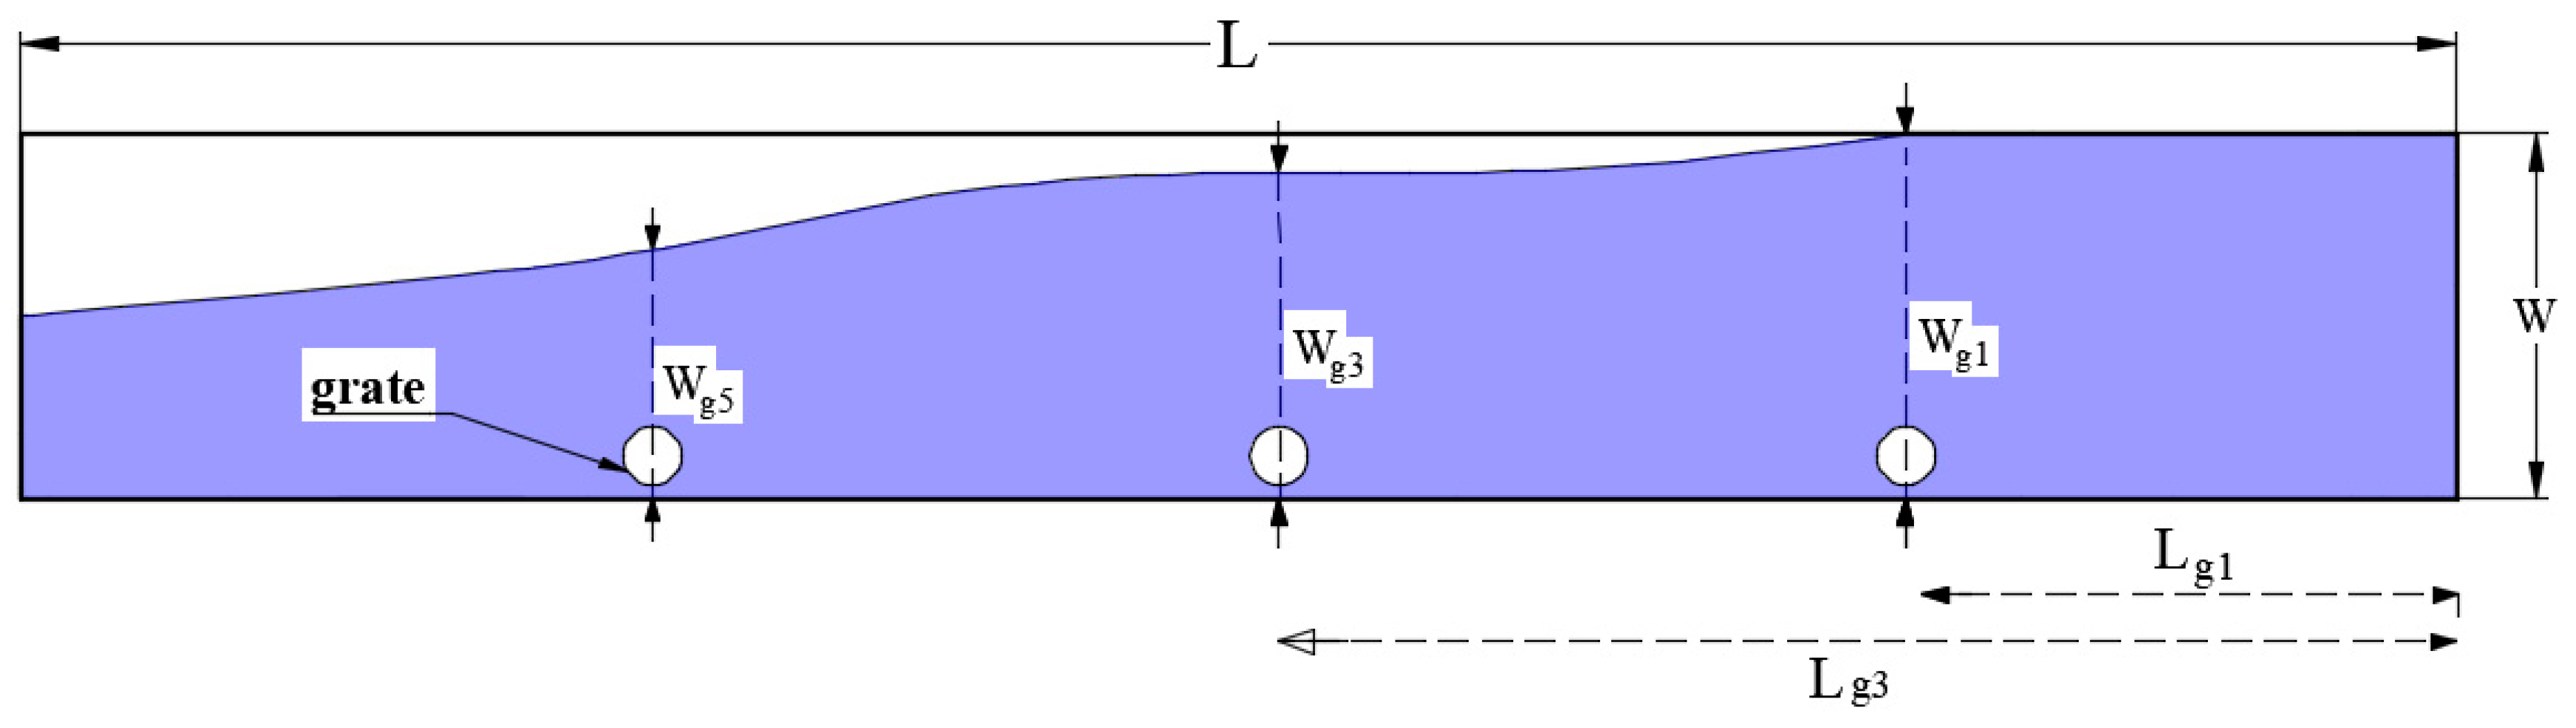
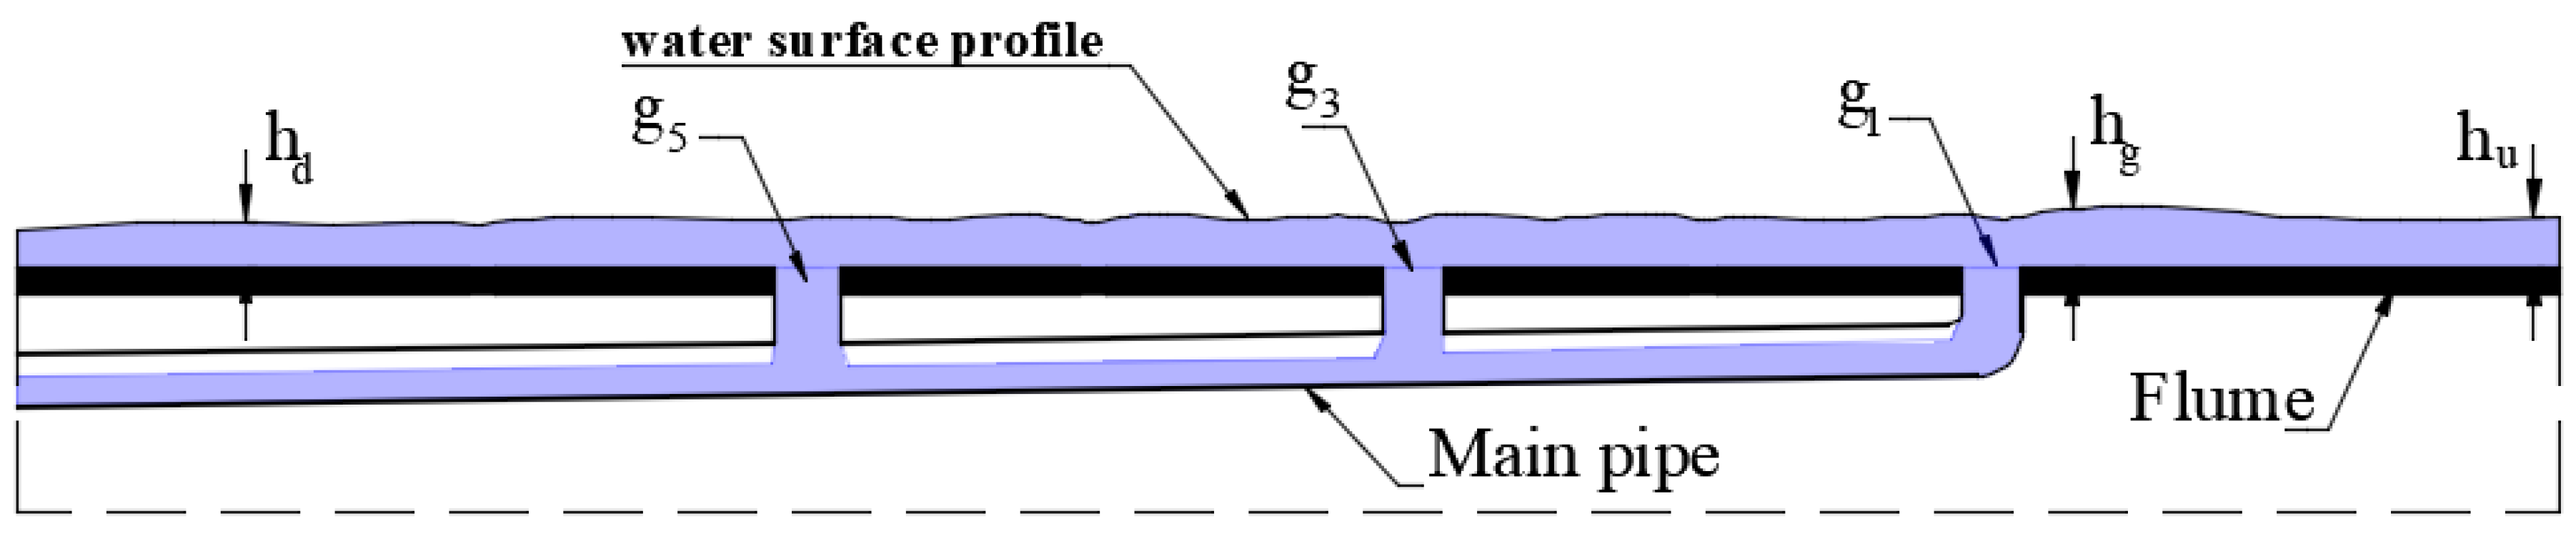
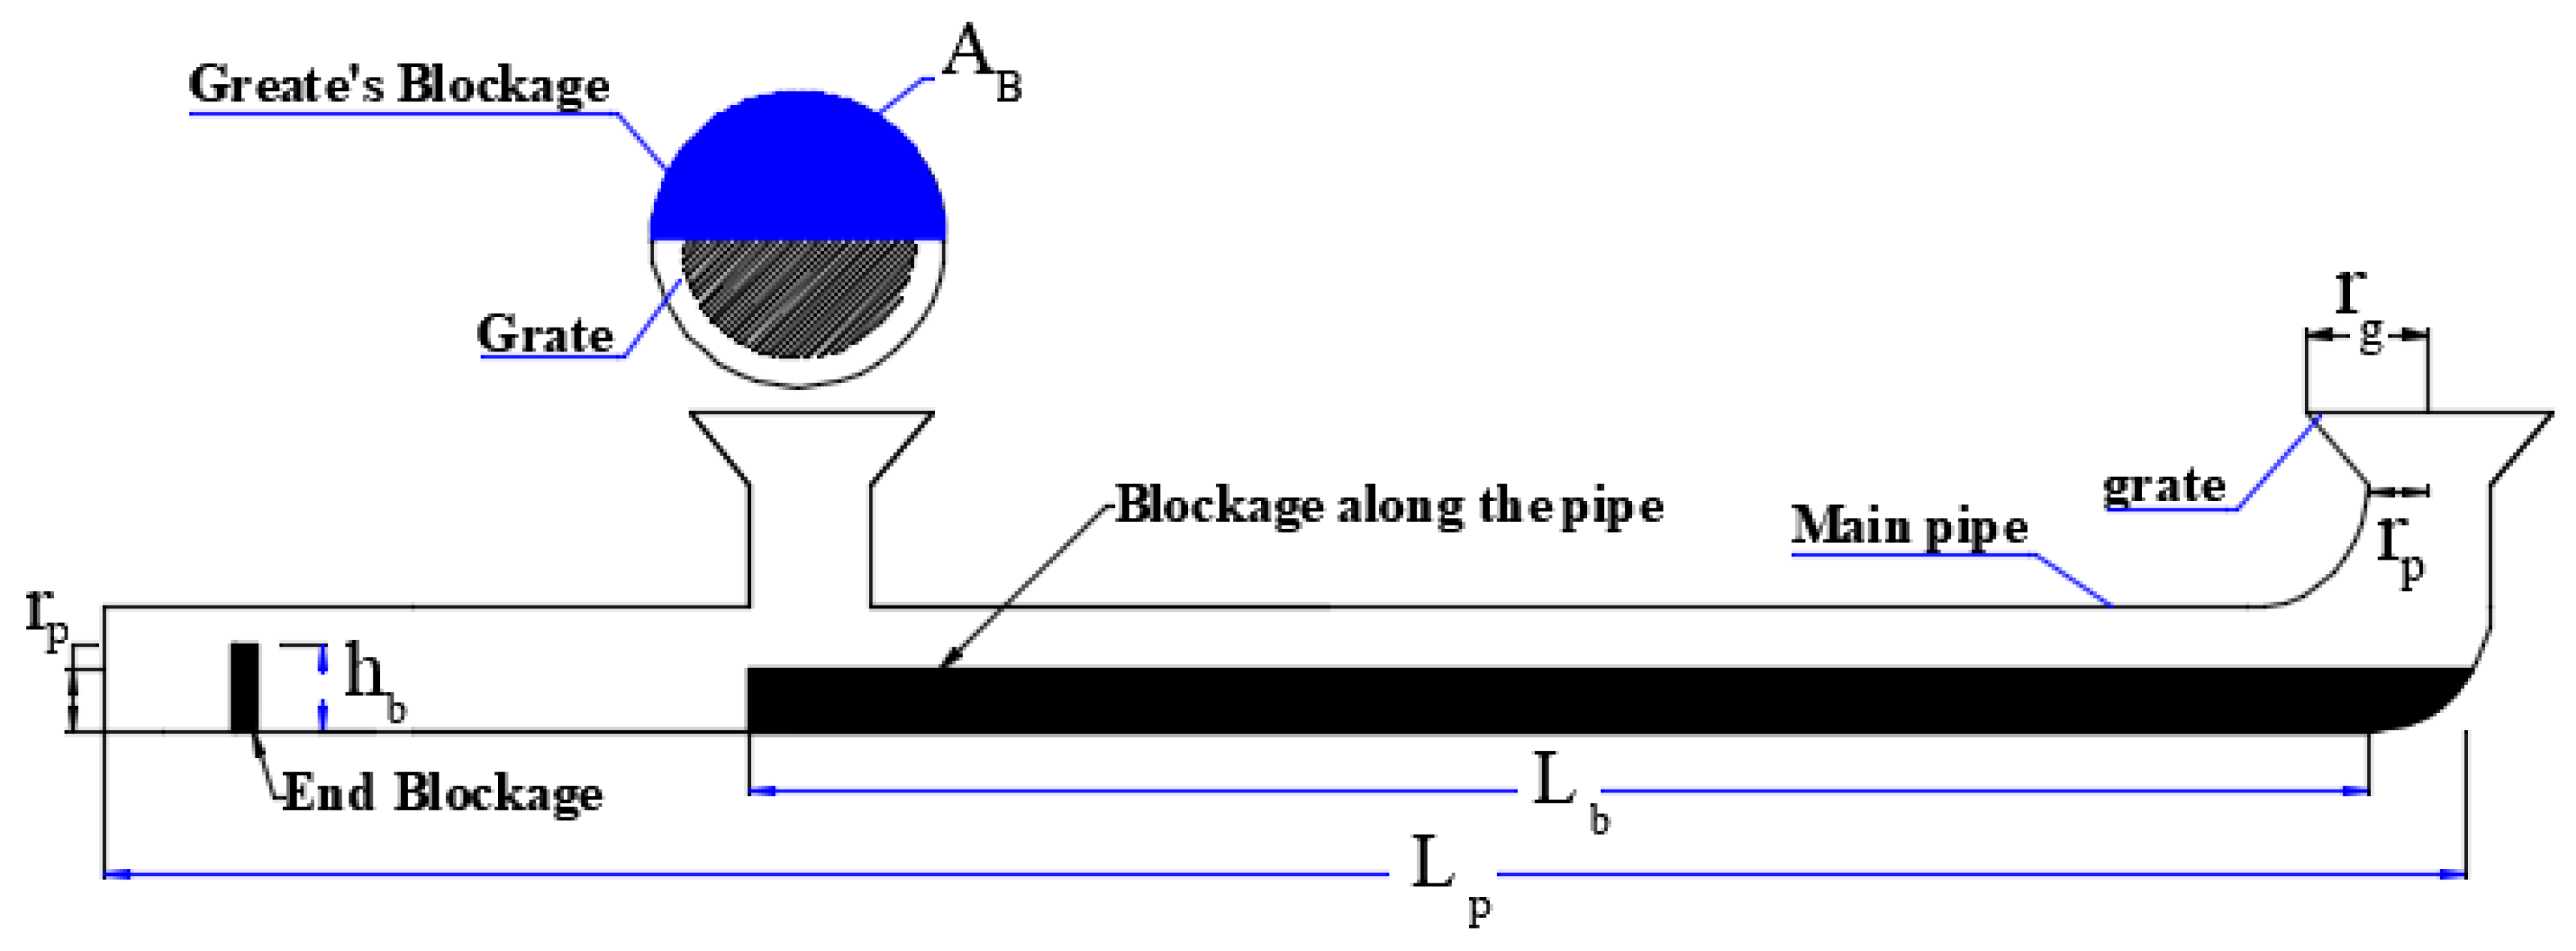
Dimensional analysis based on Buckingham (1914) [21] theory is used to develop a functional relationship between the system efficiency (£), which is the “ratio of intercepted discharge and total discharge through the flume”, and the other physics quantities involved in the phenomenon as shown in Figure 2, Figure 3 and Figure 4. Figure 2 shows the horizontal plan of the flume, arrangement of grates and spread width of water along flume length. Longitudinal section of flume and main pipe system can be seen in Figure 3. Blockages through grate and pipe (end pipe blockage and through pipe length) can be seen in Figure 4. By applying the Buckingham theory, Equation (1) can be written in dimensionless form as:
in which
£ = ƒ (Q, Lo, Wo, Hg, HB, LB, AB)
| hg: water depth at upstream grate; | Q: the total inlet discharge; |
| g1, g3, g5: refers to the grate’s number; | £: efficiency of discharge = (q/Q); |
| nag: net area of grate; | L: the length of the flume; |
| ab: blockage area of grate; | Lg: the length from the beginning of flume to the grate; |
| AB: relative blockage area (ab /nag); | Lo: relative grate length = (Lg/L); |
| hU: water depth at flume upstream; | hb: height of blockage; |
| Hg: relative water height = hg/hU; | rp: radius of main pipe; |
| Wg: the water spread beside every grate; | HB: relative blockage height within pipe (hb /2rp); |
| W: the flume width; | Lb: length of blockage; |
| Wo: relative water spread width = (Wg/W); | Lp: length of main pipe; |
| q: intercepted discharge; | LB: relative blockage length within pipe (Lb /Lp). |

Figure 2.
Plan of flume and arrangement of grates.

Figure 3.
Longitudinal cross section of flume and main pipe system.

Figure 4.
Definition sketch for blockage through pipe and grate.
2.2. Experimental Work
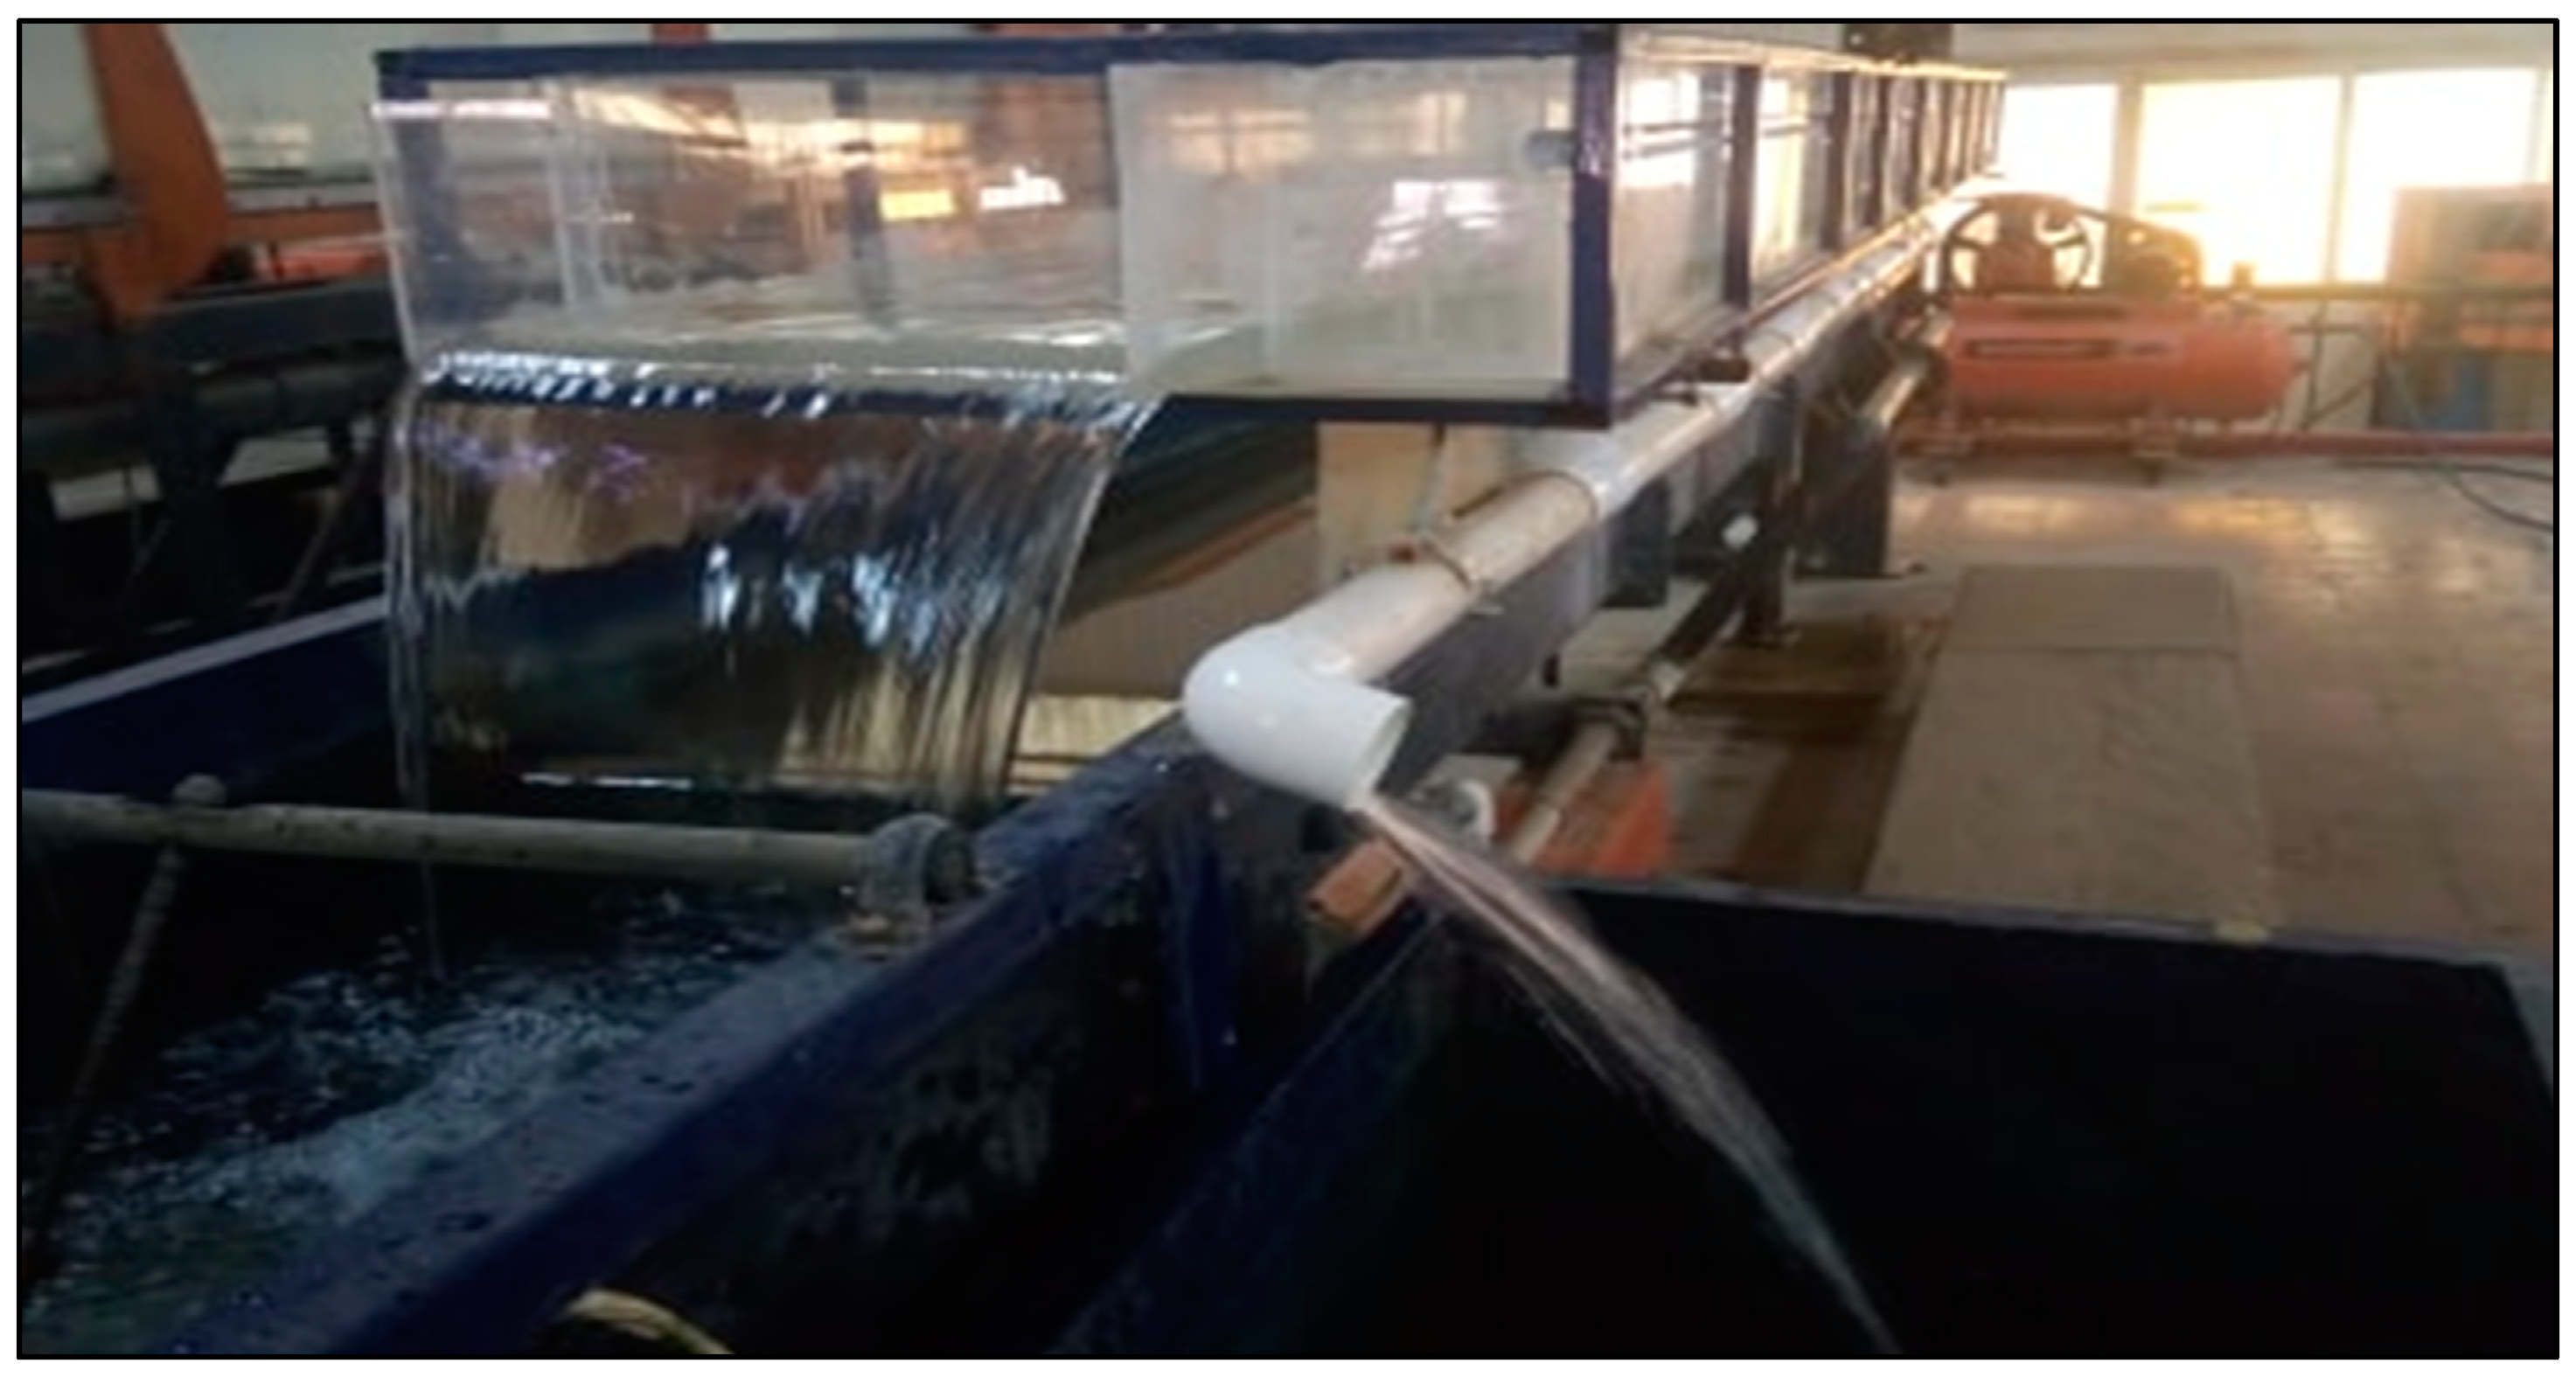
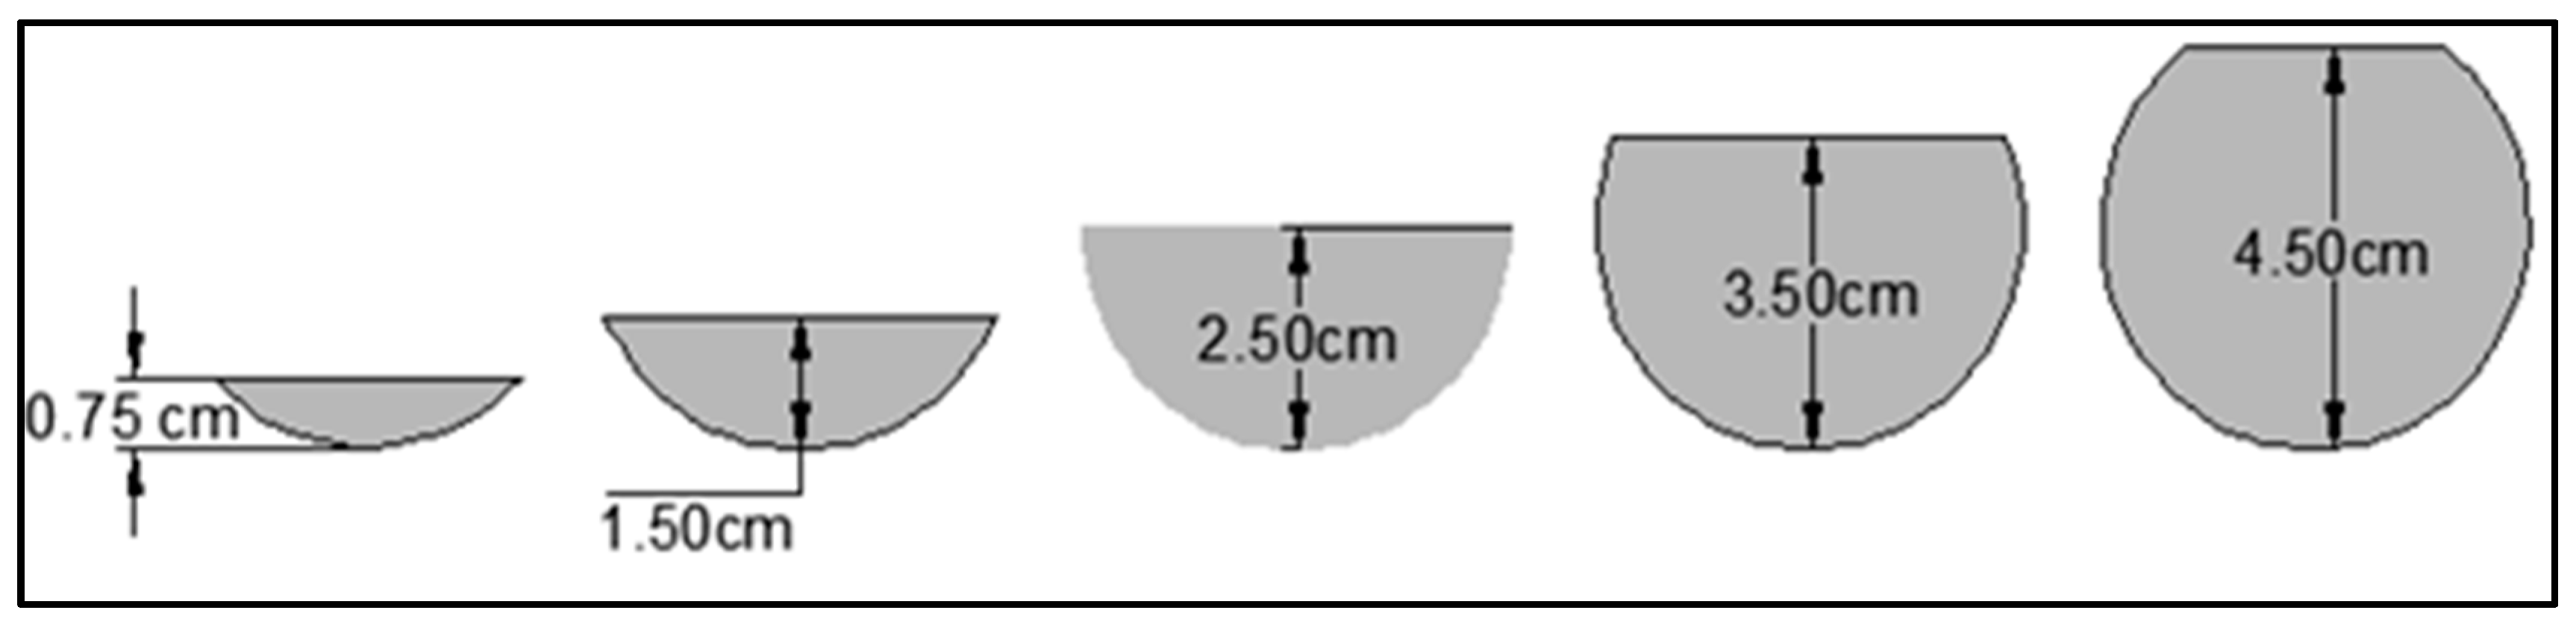
The experimental work was carried out in the hydraulics and water engineering laboratory, Faculty of Engineering, Zagazig University. The Flume was made from glass reinforced plastic. The dimension of this flume is 0.63 m width, 0.10m depth, and 6.00m length as shown in Figure 5. The longitudinal slope and cross-section slope were 0.3% and 2%, respectively. The total discharge is measured using a pre-calibrated orifice meter. The point gauge with mobile bed was used for measuring the water depths. There were three grates at the bottom of the flume through a distance of 1.08 m, which was far away from the edge of flume (2 cm). The grates are connected by a pipe with a diameter of 5 cm through which it has disposal to a large tank with dimensions 1.20, 0.60, and 0.60 m, as shown in Figure 6. In addition, the radius of grate was 5cm with net area 51%. Blockage of grates with various dimensions will be investigated. Moreover, the end of pipe blockage with height 0.75, 1.5, 2.5, 3.5, and 4.5 cm was studied as shown in Figure 7, as well as blockage along the main pipe at three lengths (108, 216, and 324 cm) with blockage height (1.25 and 2.5cm). On the other hand, surface blockage was examined for a different blockage area of grates (12.5%, 25%, 37.5%, and 50%), as shown in Figure 8. A total of of 156 runs were done; each run took 30 min time. Water surface level along the flume in two directions and the amount of water that drained from grates are measured.
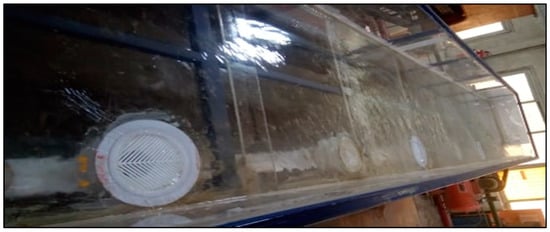
Figure 5.
The flume of experimental tests.

Figure 6.
The outfall of the experimental flume.

Figure 7.
Different blockage heights at the end of pipe.

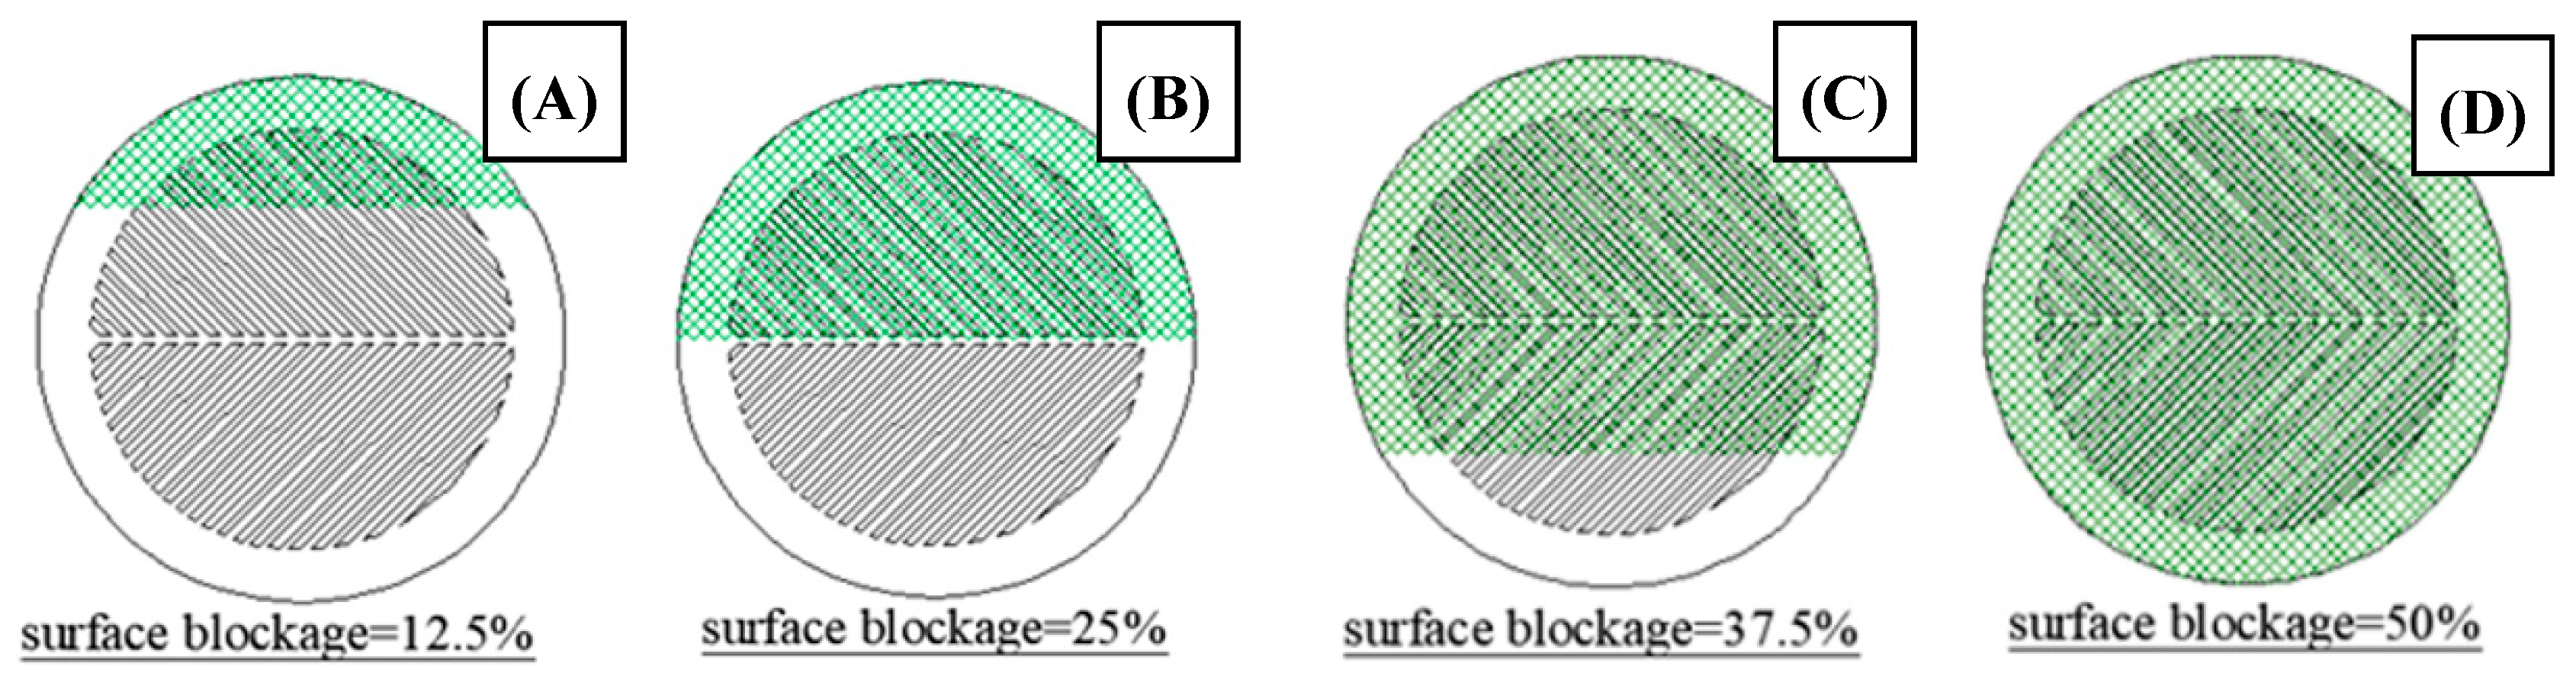
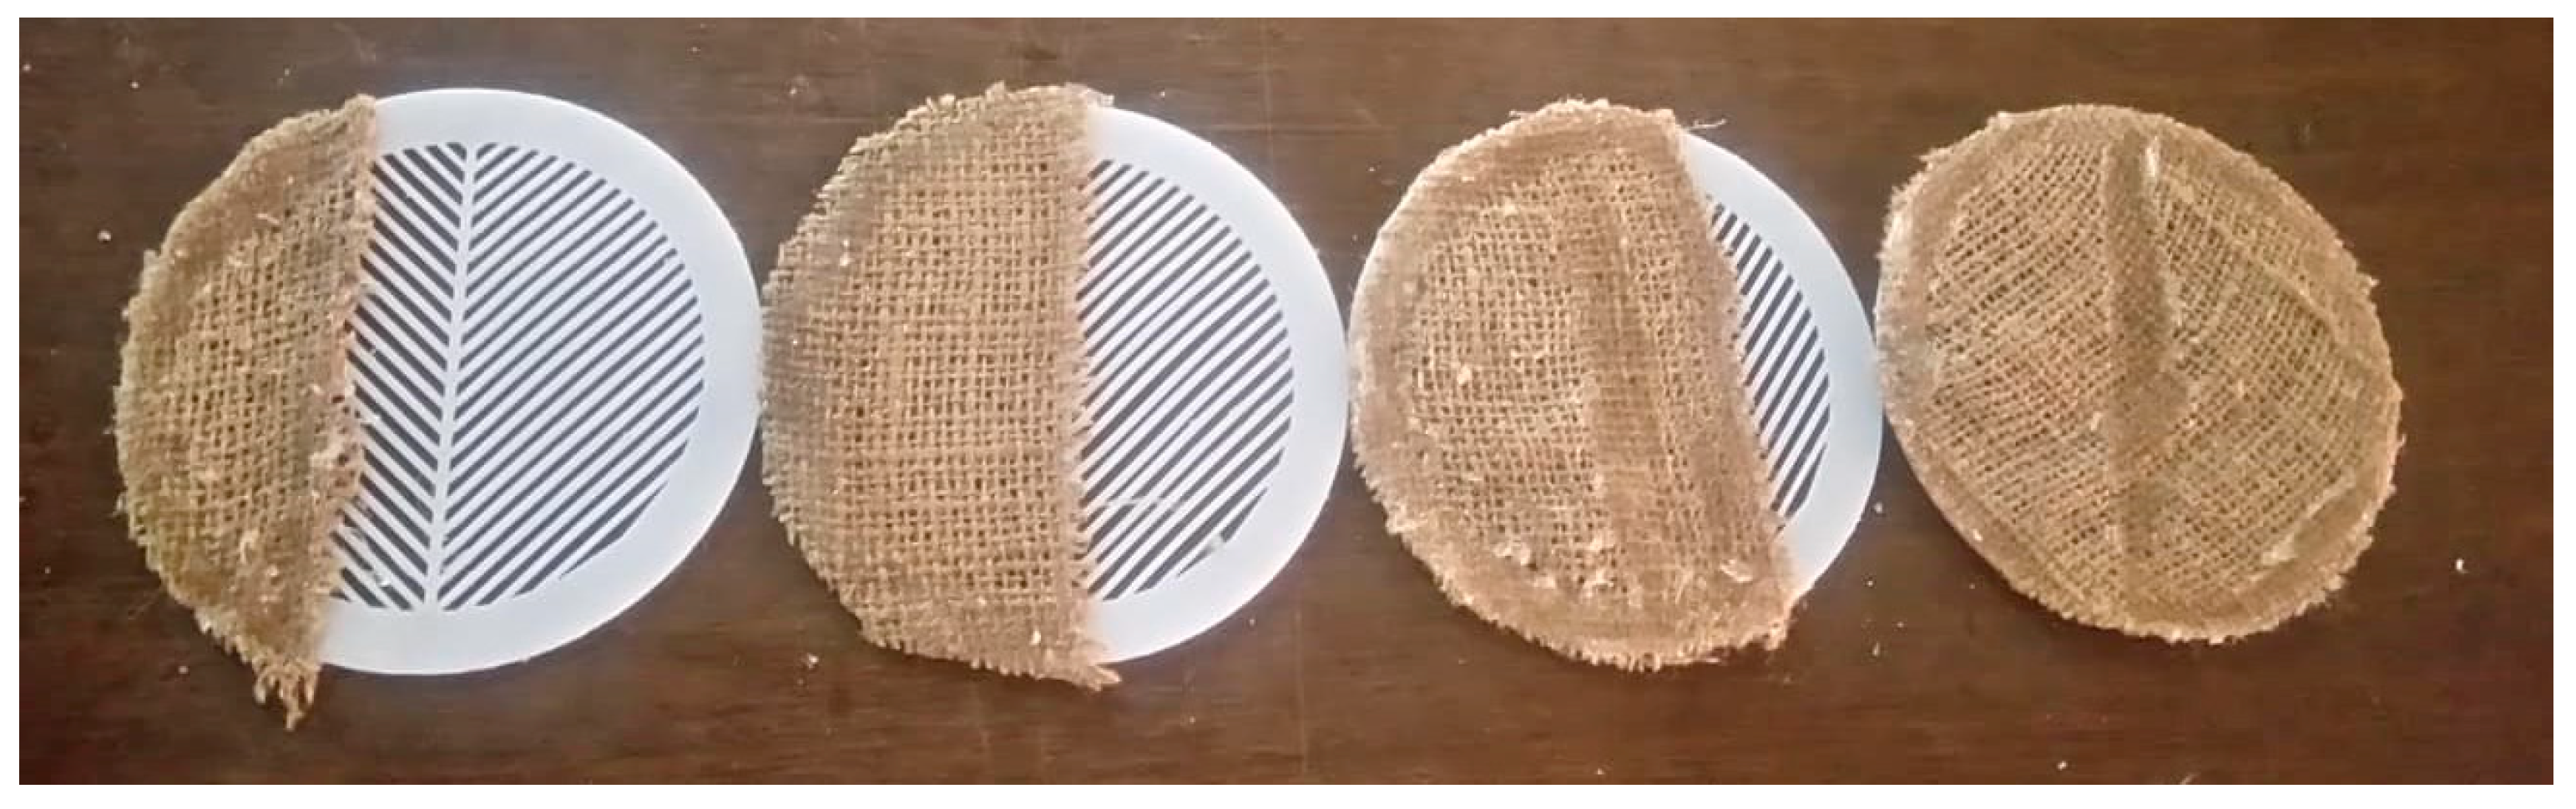
Figure 8.
Different sizes of grate blockage. (A) surface blockage 12.50%, (B) surface blockage 25%, (C) surface blockage 37.50%, (D) surface blockage 50%.
3. Results and Discussion
The experimental work studied the effect of blockage on storm water drainage system efficiency with passing discharge from (1.00 L/sec to 6.00 L/sec). The scenario of this study was divided into three groups. Each group has been studied to see its effect on storm system efficiency, relative grate water height, and relative water spread width. The first scenario studied the effect of main pipe blockage for two ratios (the first at the pipe end and the second along the pipe length with end pipe blockage). The second scenario studied the effect of surface blockage at grate. The third scenario investigated the effect of combined blockage (pipe and grate) on the efficiency of storm discharge. Finally, a comparison was made between previous blockage ratios to study their effect in reducing discharge efficiency.
3.1. First Group: Blockage in Storm Main Pipe
The effect of blockage was investigated within two ratios. The first ratio at the end of main pipe had five relative blockage heights (15%, 30%, 50%, 70%, and 90%). The second ratio was along the main pipe and had relative blockage length (33%, 67%, and 100%) with two relative blockage heights (25%, and 50%).
3.1.1. End Pipe Blockage
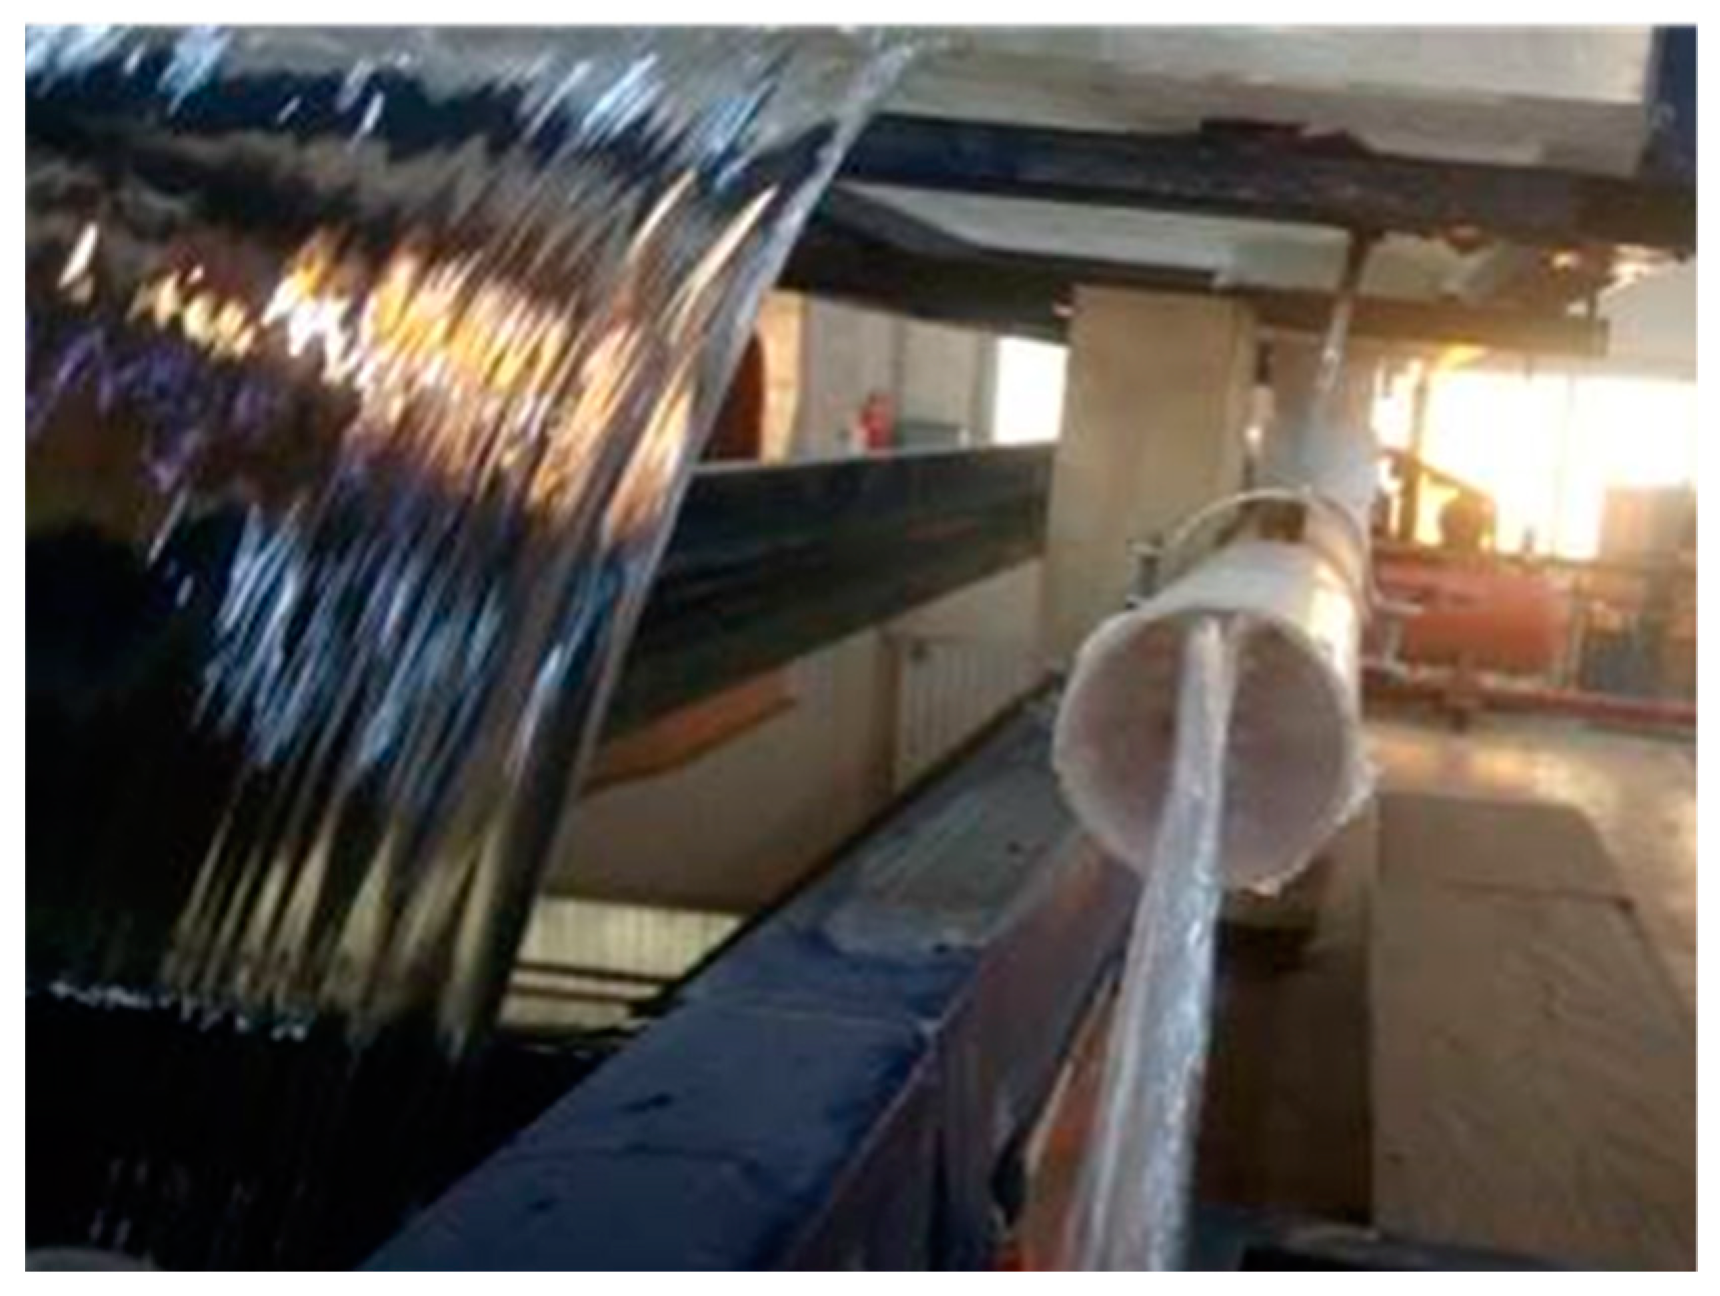
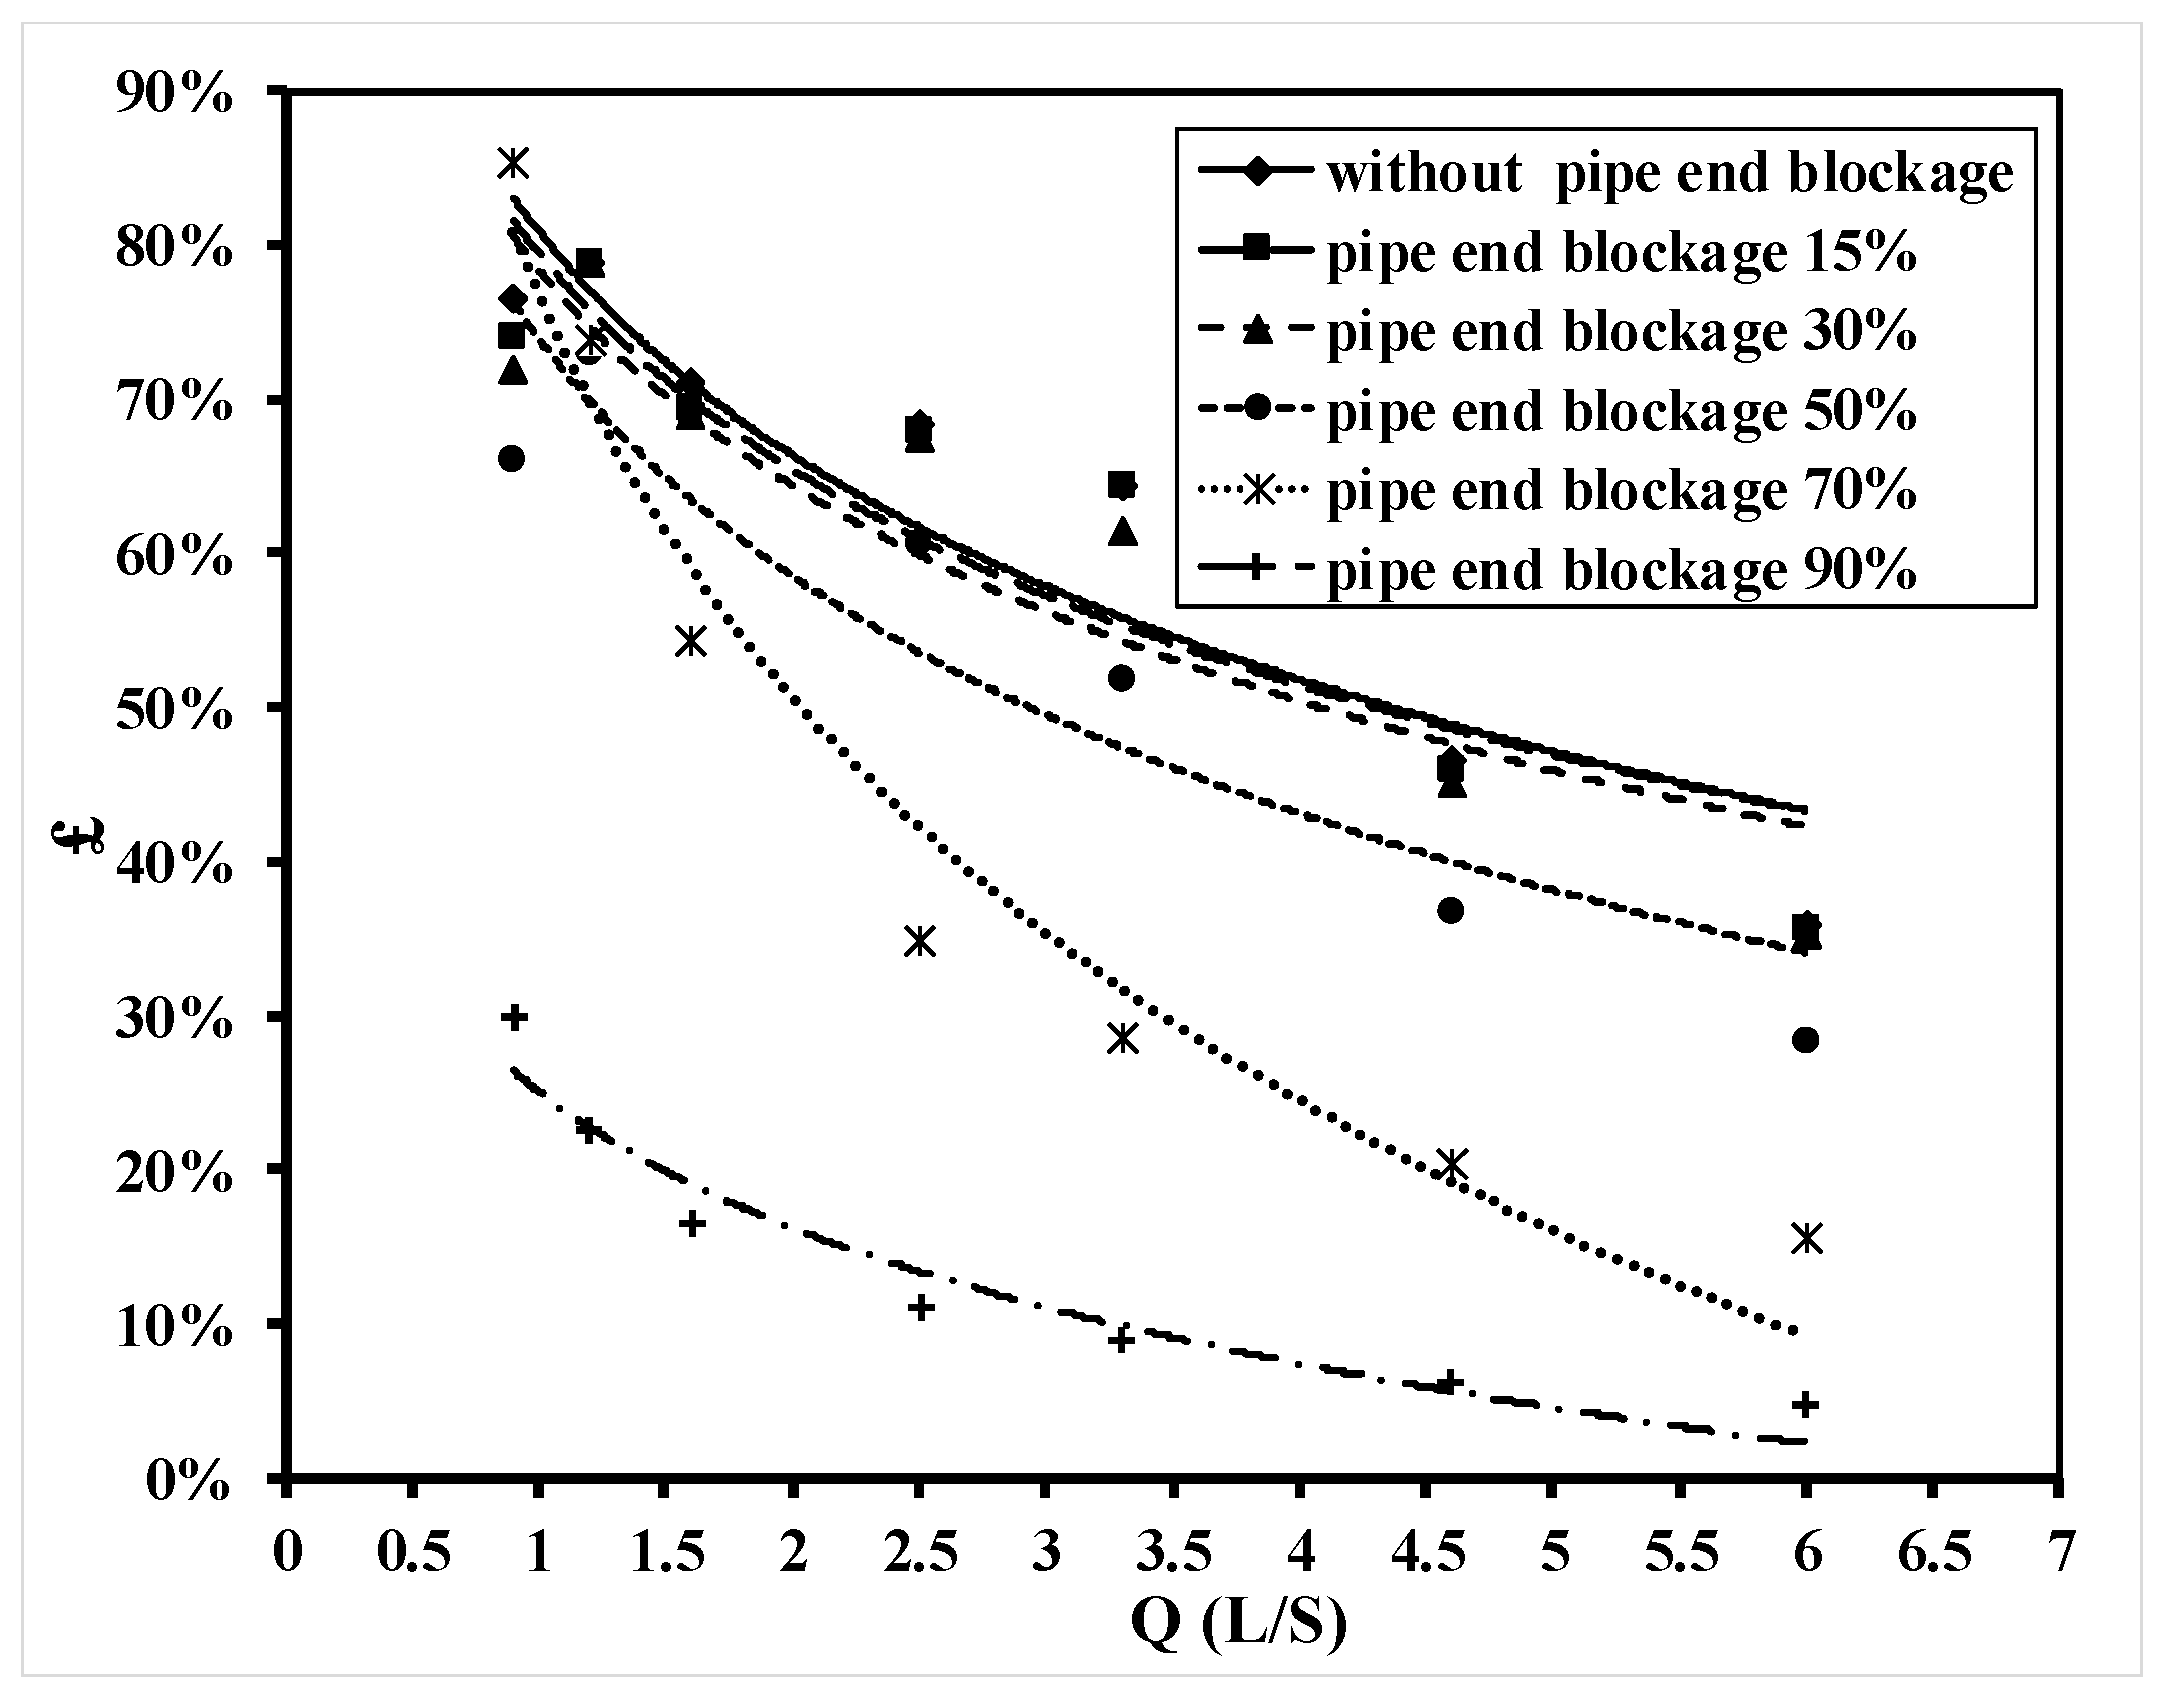
The blockage was investigated at the end of the main pipe with five different relative heights (15%, 30%, 50%, 70%, and 90%). In general, the negative effect on the efficiency of discharge increased by increasing the relative height of the blockage. This can be explained by the pre-obstruction zone becoming a dead zone once it is filled with water. Reducing the size of the pipe needed to discharge the water has an effect on drainage efficiency. Figure 9 shows the end pipe blockage in experimental work, which indicates the minimized disposal area. Figure 10 shows the relationship between efficiency of system and passing discharge, using 5 relative blockage heights. From this figure, it was concluded that as the relative blockage height increased by 90%, the efficiency of the system decreased by (46.5%). Moreover, the effect of blockage-relative heights (15%, 30%) on efficiency was not very impressive.

Figure 9.
End pipe blockage with HB = 90%.

Figure 10.
Relationship between £ and Q for different relative blockage heights.
The water depth along the flume was measured at upstream each grate to investigate the effect of end pipe blockage on water surface profile and redistribution of water along the flume. Figure 11 and Figure 12 show the relationship between relative grate water depth and relative grate length with different relative blockage heights using three grates at passing discharge (1.20 and 6.00 L/sec), respectively. These figures show that as relative blockage height increased, the water surface profile was increased along the flume due to the negative effect on the drainage efficiency. In addition, relative blockage height, 90%, was the worst one, which increased the relative grate water depth by (16% and 19%) for discharges (1.20 and 3.30 L/sec), respectively.

Figure 11.
Relationship between Hg and LO for different relative blockage heights at Q = 1.20 L/sec.

Figure 12.
Relationship between Hg and LO for different relative blockage heights at Q = 3.30 L/sec.
Moreover, the water spread width was observed along the flume according to end pipe blockage Figure 13 and Figure 14 show the relationship between relative water spread width and relative grates distance for various relative blockage heights at passing discharge 1.00 L/sec and 1.20 L/sec, respectively. The relative water spread width tends to increase at higher blockage height by about 16% and 21% at Q = 1.00 L/sec and Q = 1.20 L/sec, respectively. Based on the figures below, it can be concluded that the small relative blockage height has minimal impact on the relative water spread width.

Figure 13.
Relationship between WO and LO for different relative blockage heights at Q = 1.00 L/sec.

Figure 14.
Relationship between WO and LO for different relative blockage heights at Q = 1.20 L/sec.
3.1.2. Effect of Blockage along the Pipe Length
The effects of different blockages along the main pipe with three relative lengths (33%, 67%, and 100%) combined with two relative blockage heights (25% and 50%) was investigated. Figure 15 indicates the blockage along pipe length and end pipe blockage.

Figure 15.
(A) The blockage along main pipe length and (B) end pipe blockage.
Figure 16 and Figure 17 show the relationship between the discharge efficiency and passing discharge, using relative blockage heights (25% and 50%) with different relative blockage lengths (33%, 67%, and 100%). From these figures, it can be noted that with the increased relative blockage height, the efficiency of discharge decreases for different relative blockage lengths. From these figures, it is clear that the efficiency of discharge dropped about 4.8% to 8.1% with relative blockage heights of 25% and 50% respectively, due to the volume’s reduction of the main pipe. It is a matter of fact that increasing the blockage length will automatically decrease the efficiency of discharge; the reduction in efficiency is equal to about 1.6%, 3.1%, and 5.1%, for three relative lengths, respectively.

Figure 16.
Relationship between £ and Q for different LB with HB 25%.

Figure 17.
Relationship between £ and Q for different LB with HB 50%.
The effect of pipe blockage on water surface profile was studied, as shown in Figure 18 and Figure 19. In general, as relative blockage ratio increased, the water surface profile increased within 5.50 % and 6.20% at Q = 6.00 L/sec, for relative blockage heights 25% and 50%, respectively.

Figure 18.
Relationship between Hg and LO for different LB at HB 25% at Q = 6.00 L/sec.

Figure 19.
Relationship between Hg and LO for different LB at HB 50% at Q = 6.00 L/sec.
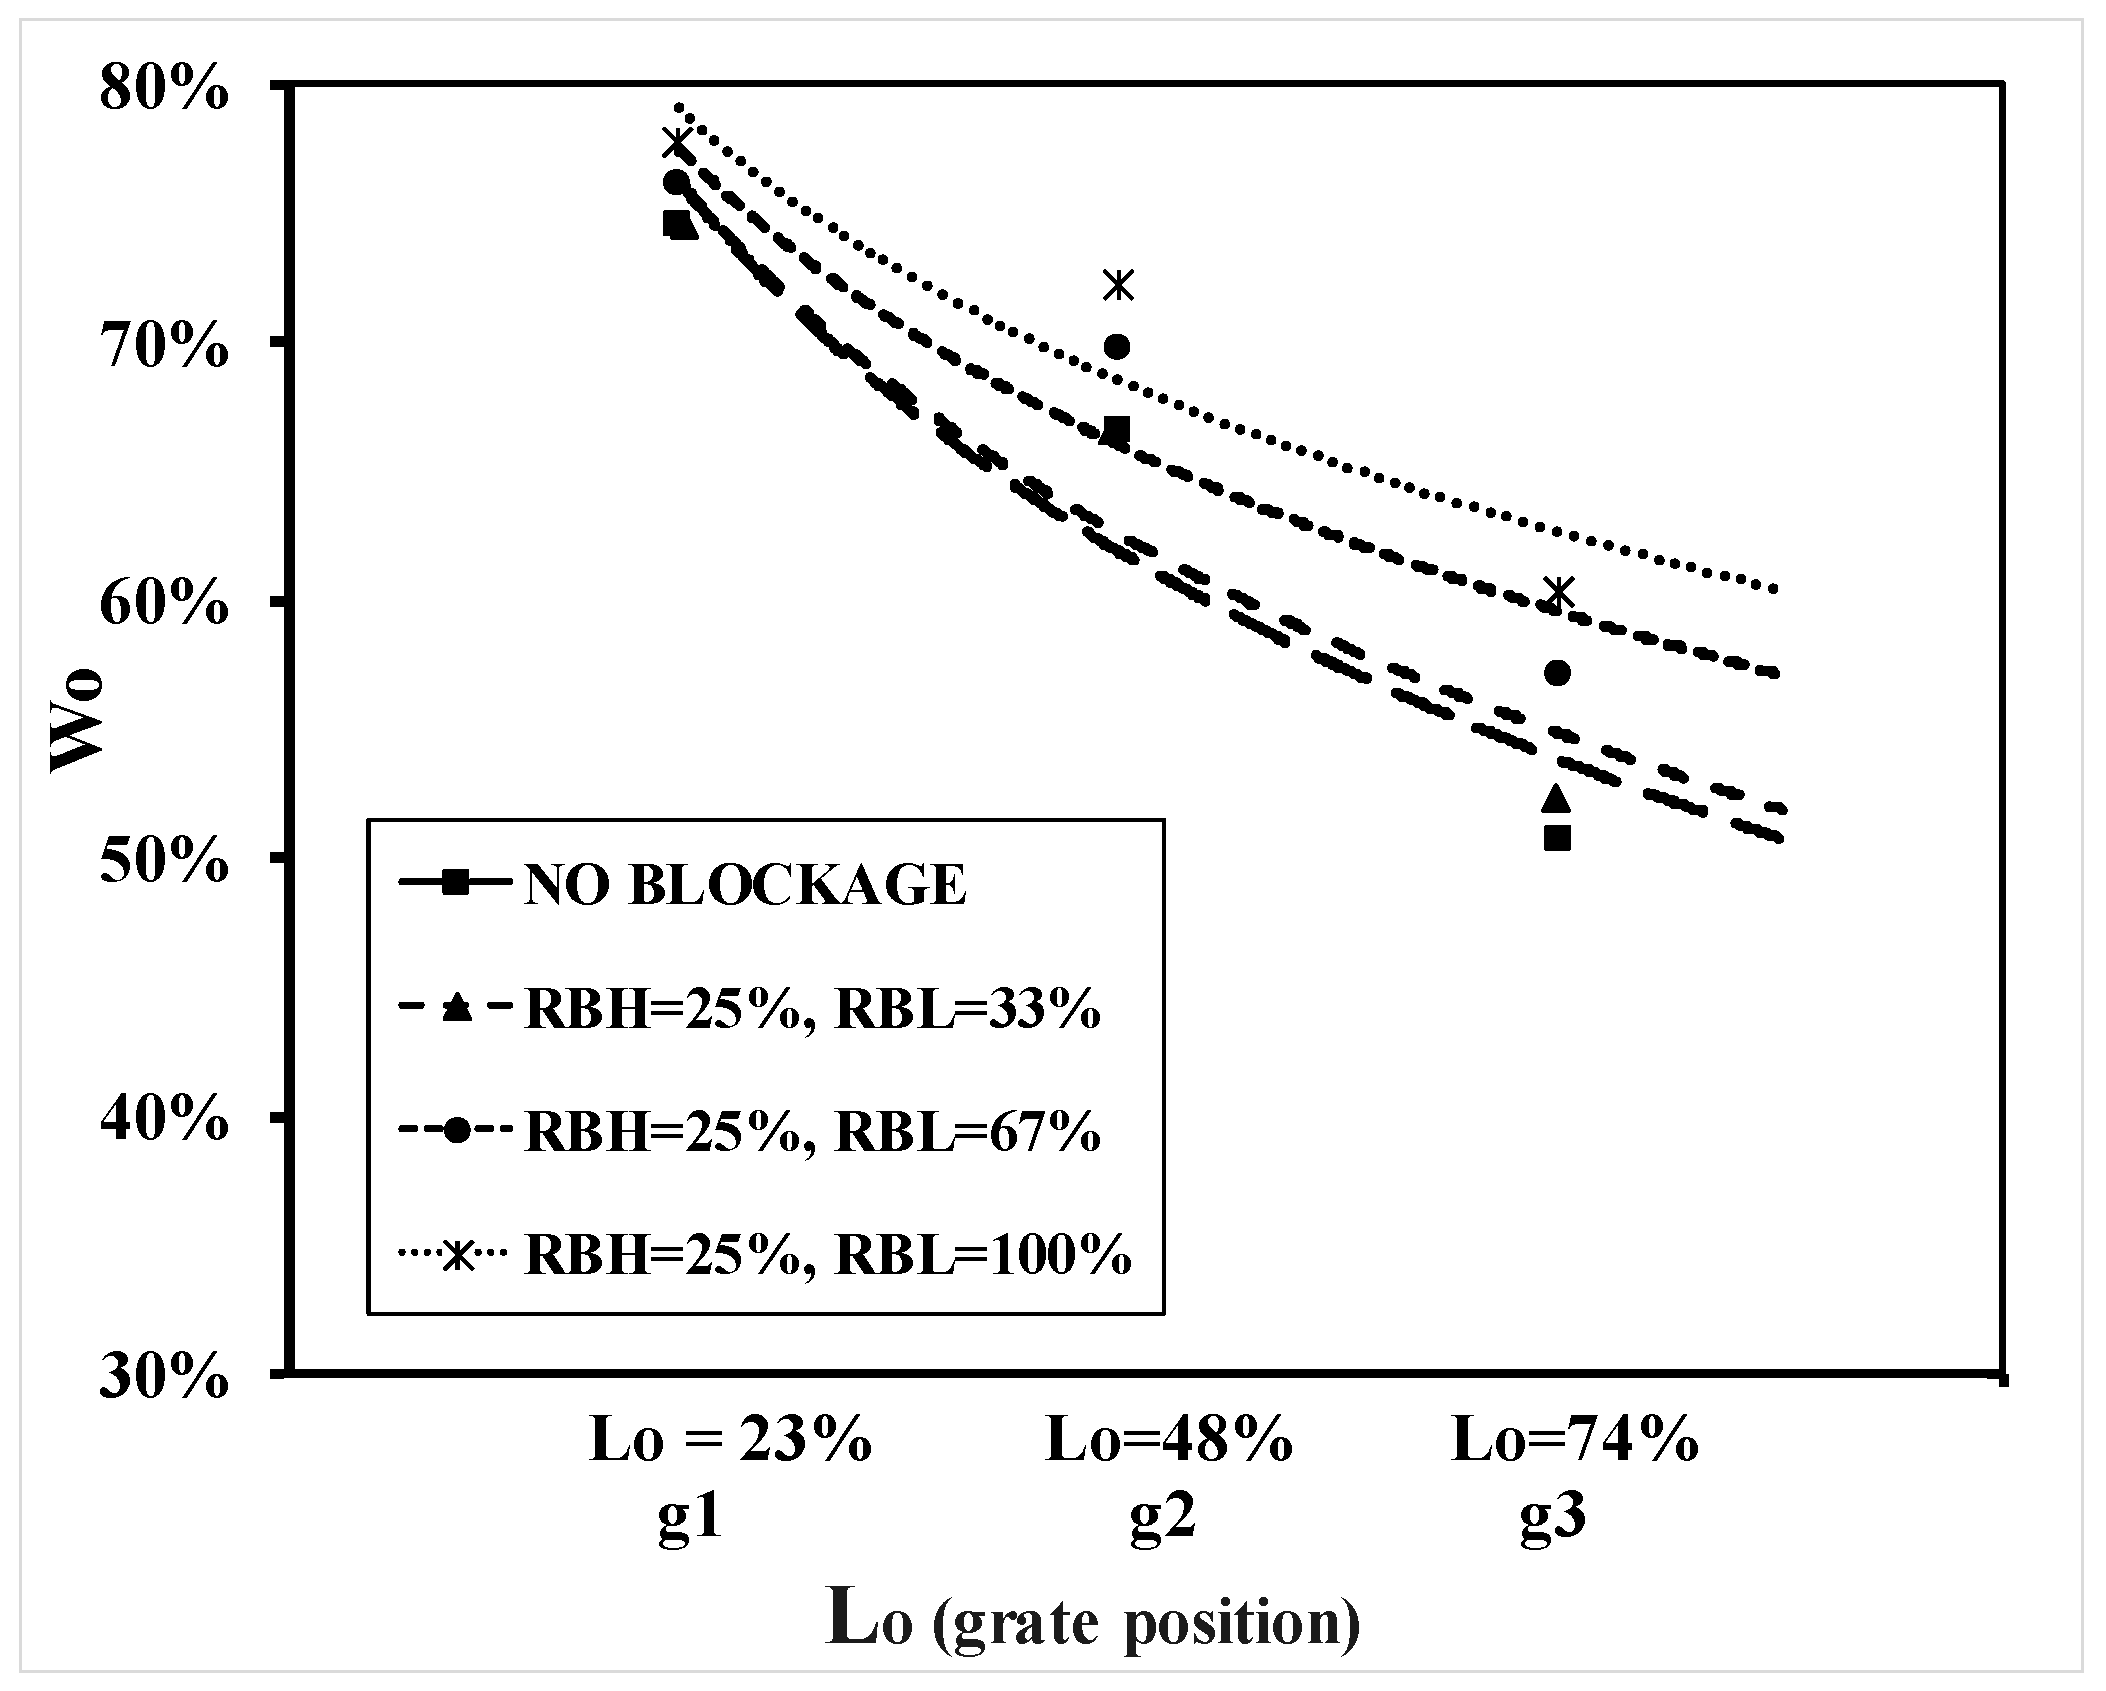
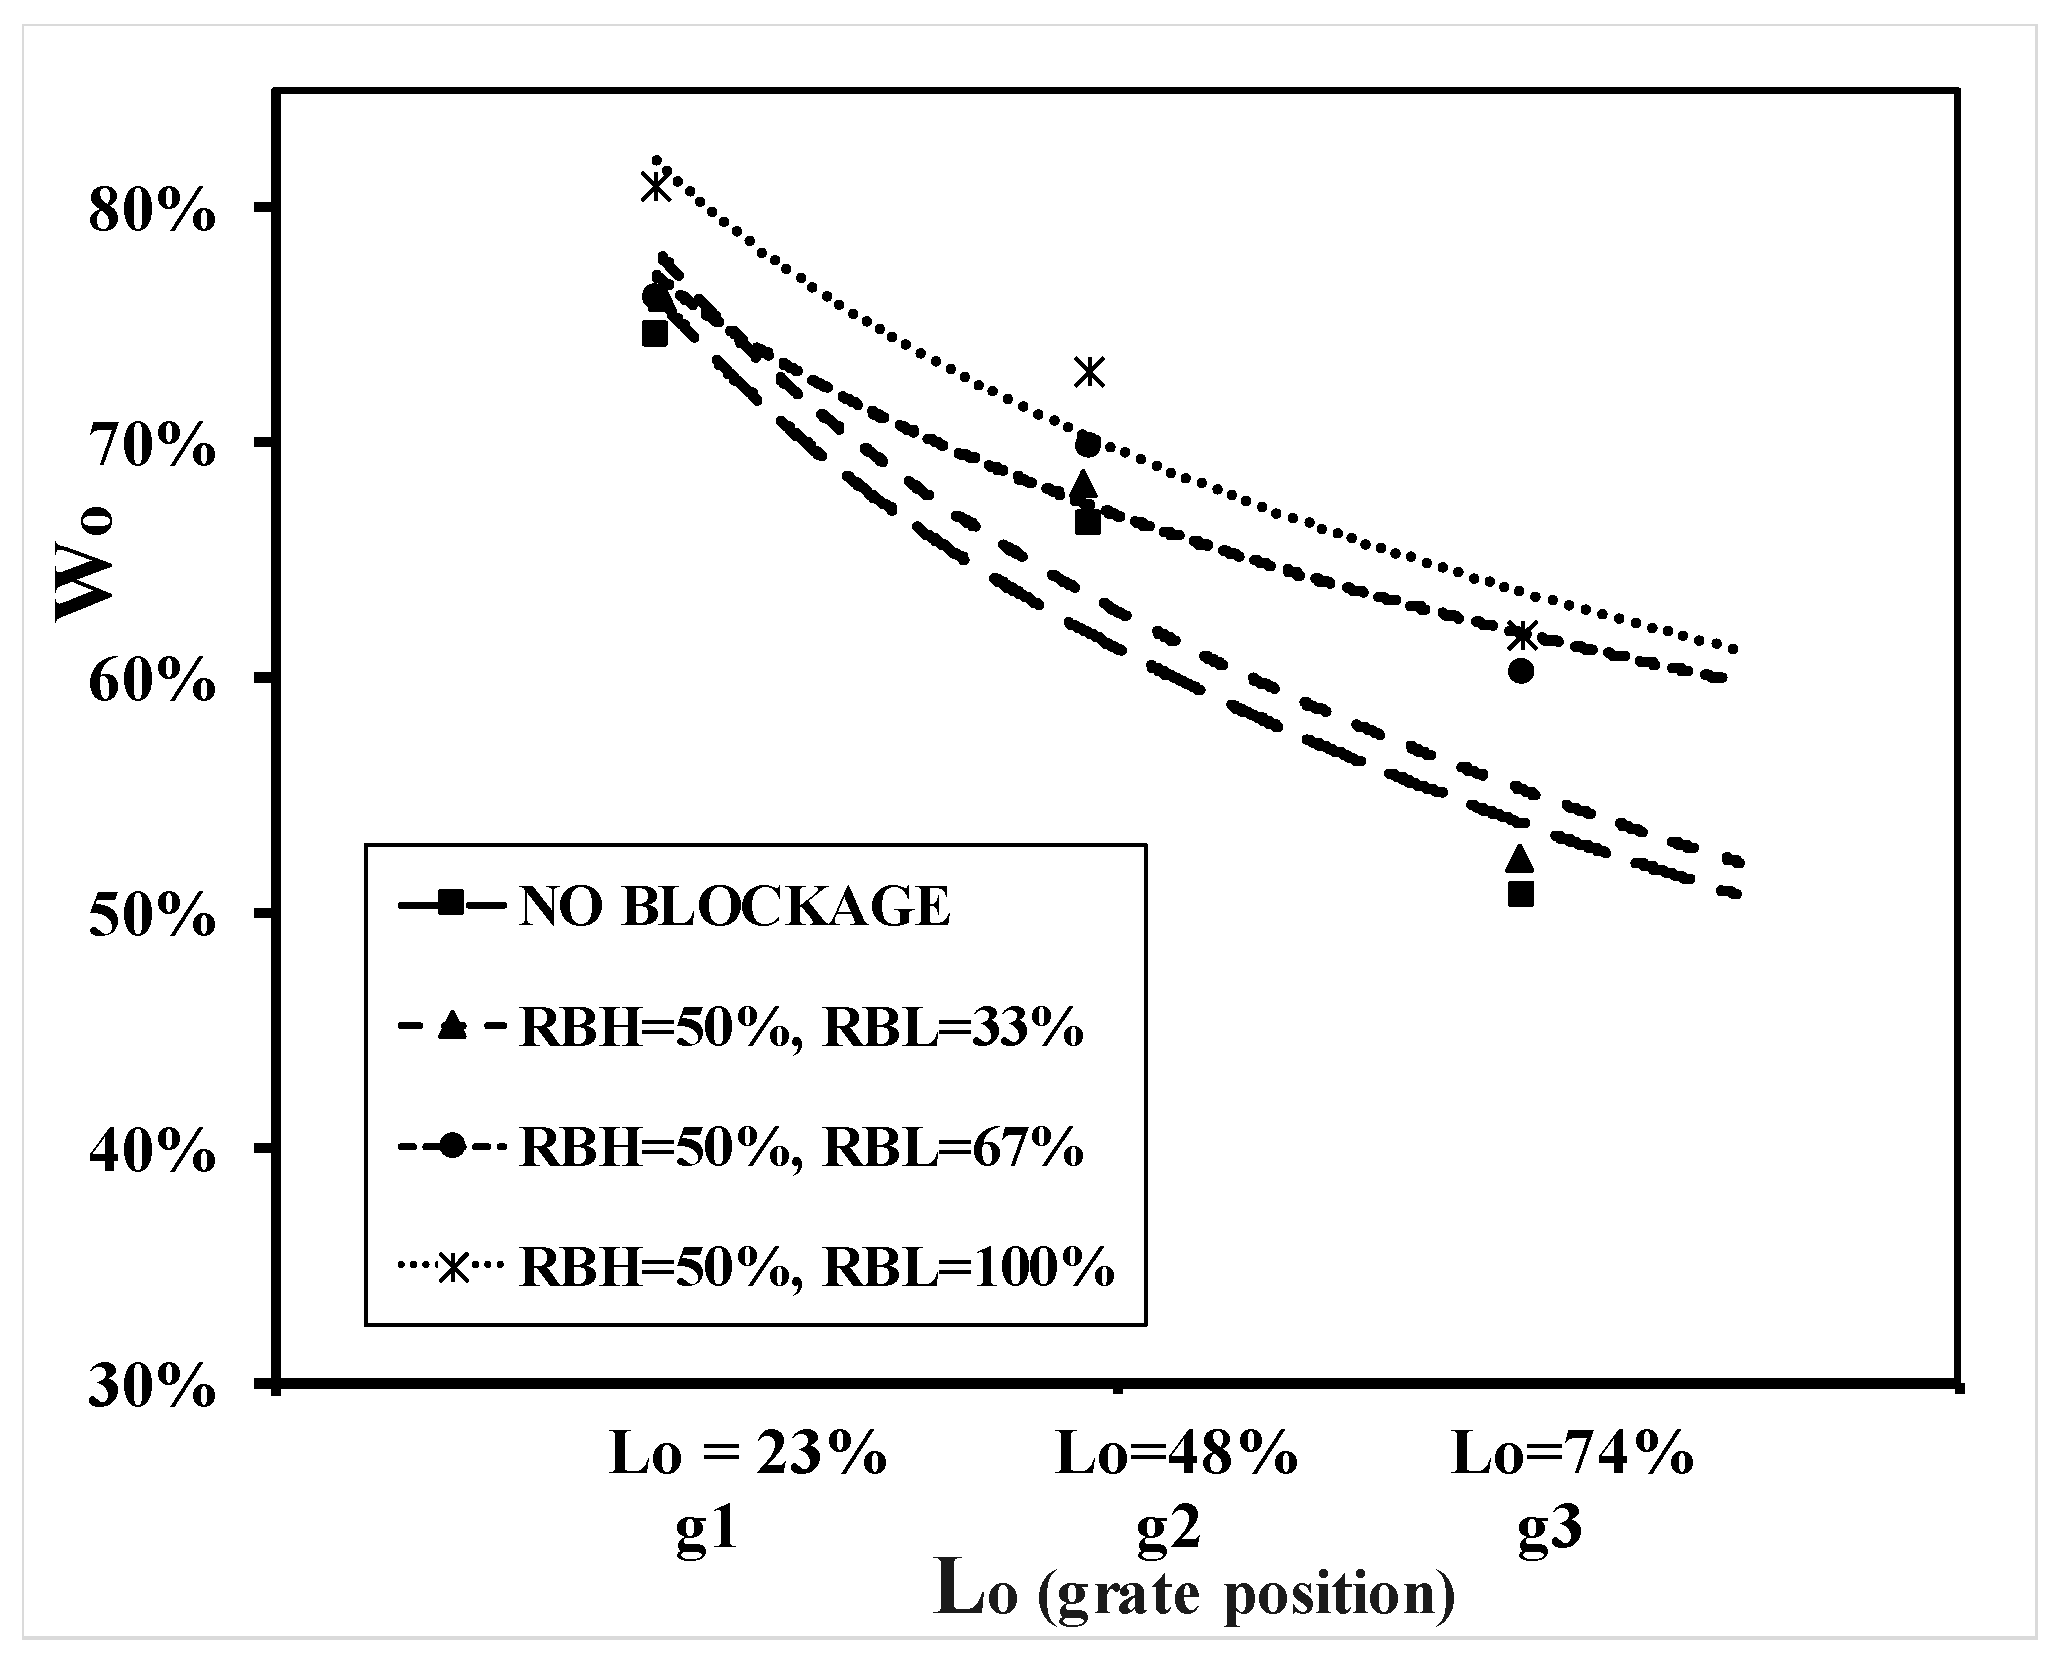
On the other hand, Figure 20 and Figure 21 show the relationship between relative water spread width and relative grate distance, using different relative blockage heights (33%, 67%, and 100%) for relative blockage heights (25% and 50%), respectively. The results indicated that as relative blockage height increased, the relative width increased within 7.3% to 9.8% at Q = 1.00 L/sec.

Figure 20.
Relationship between WO and LO for different LB at HB 25% at Q = 1.00 L/sec.

Figure 21.
Relationship between WO and LO for different LB at HB 50% at Q = 1.00 L/sec.
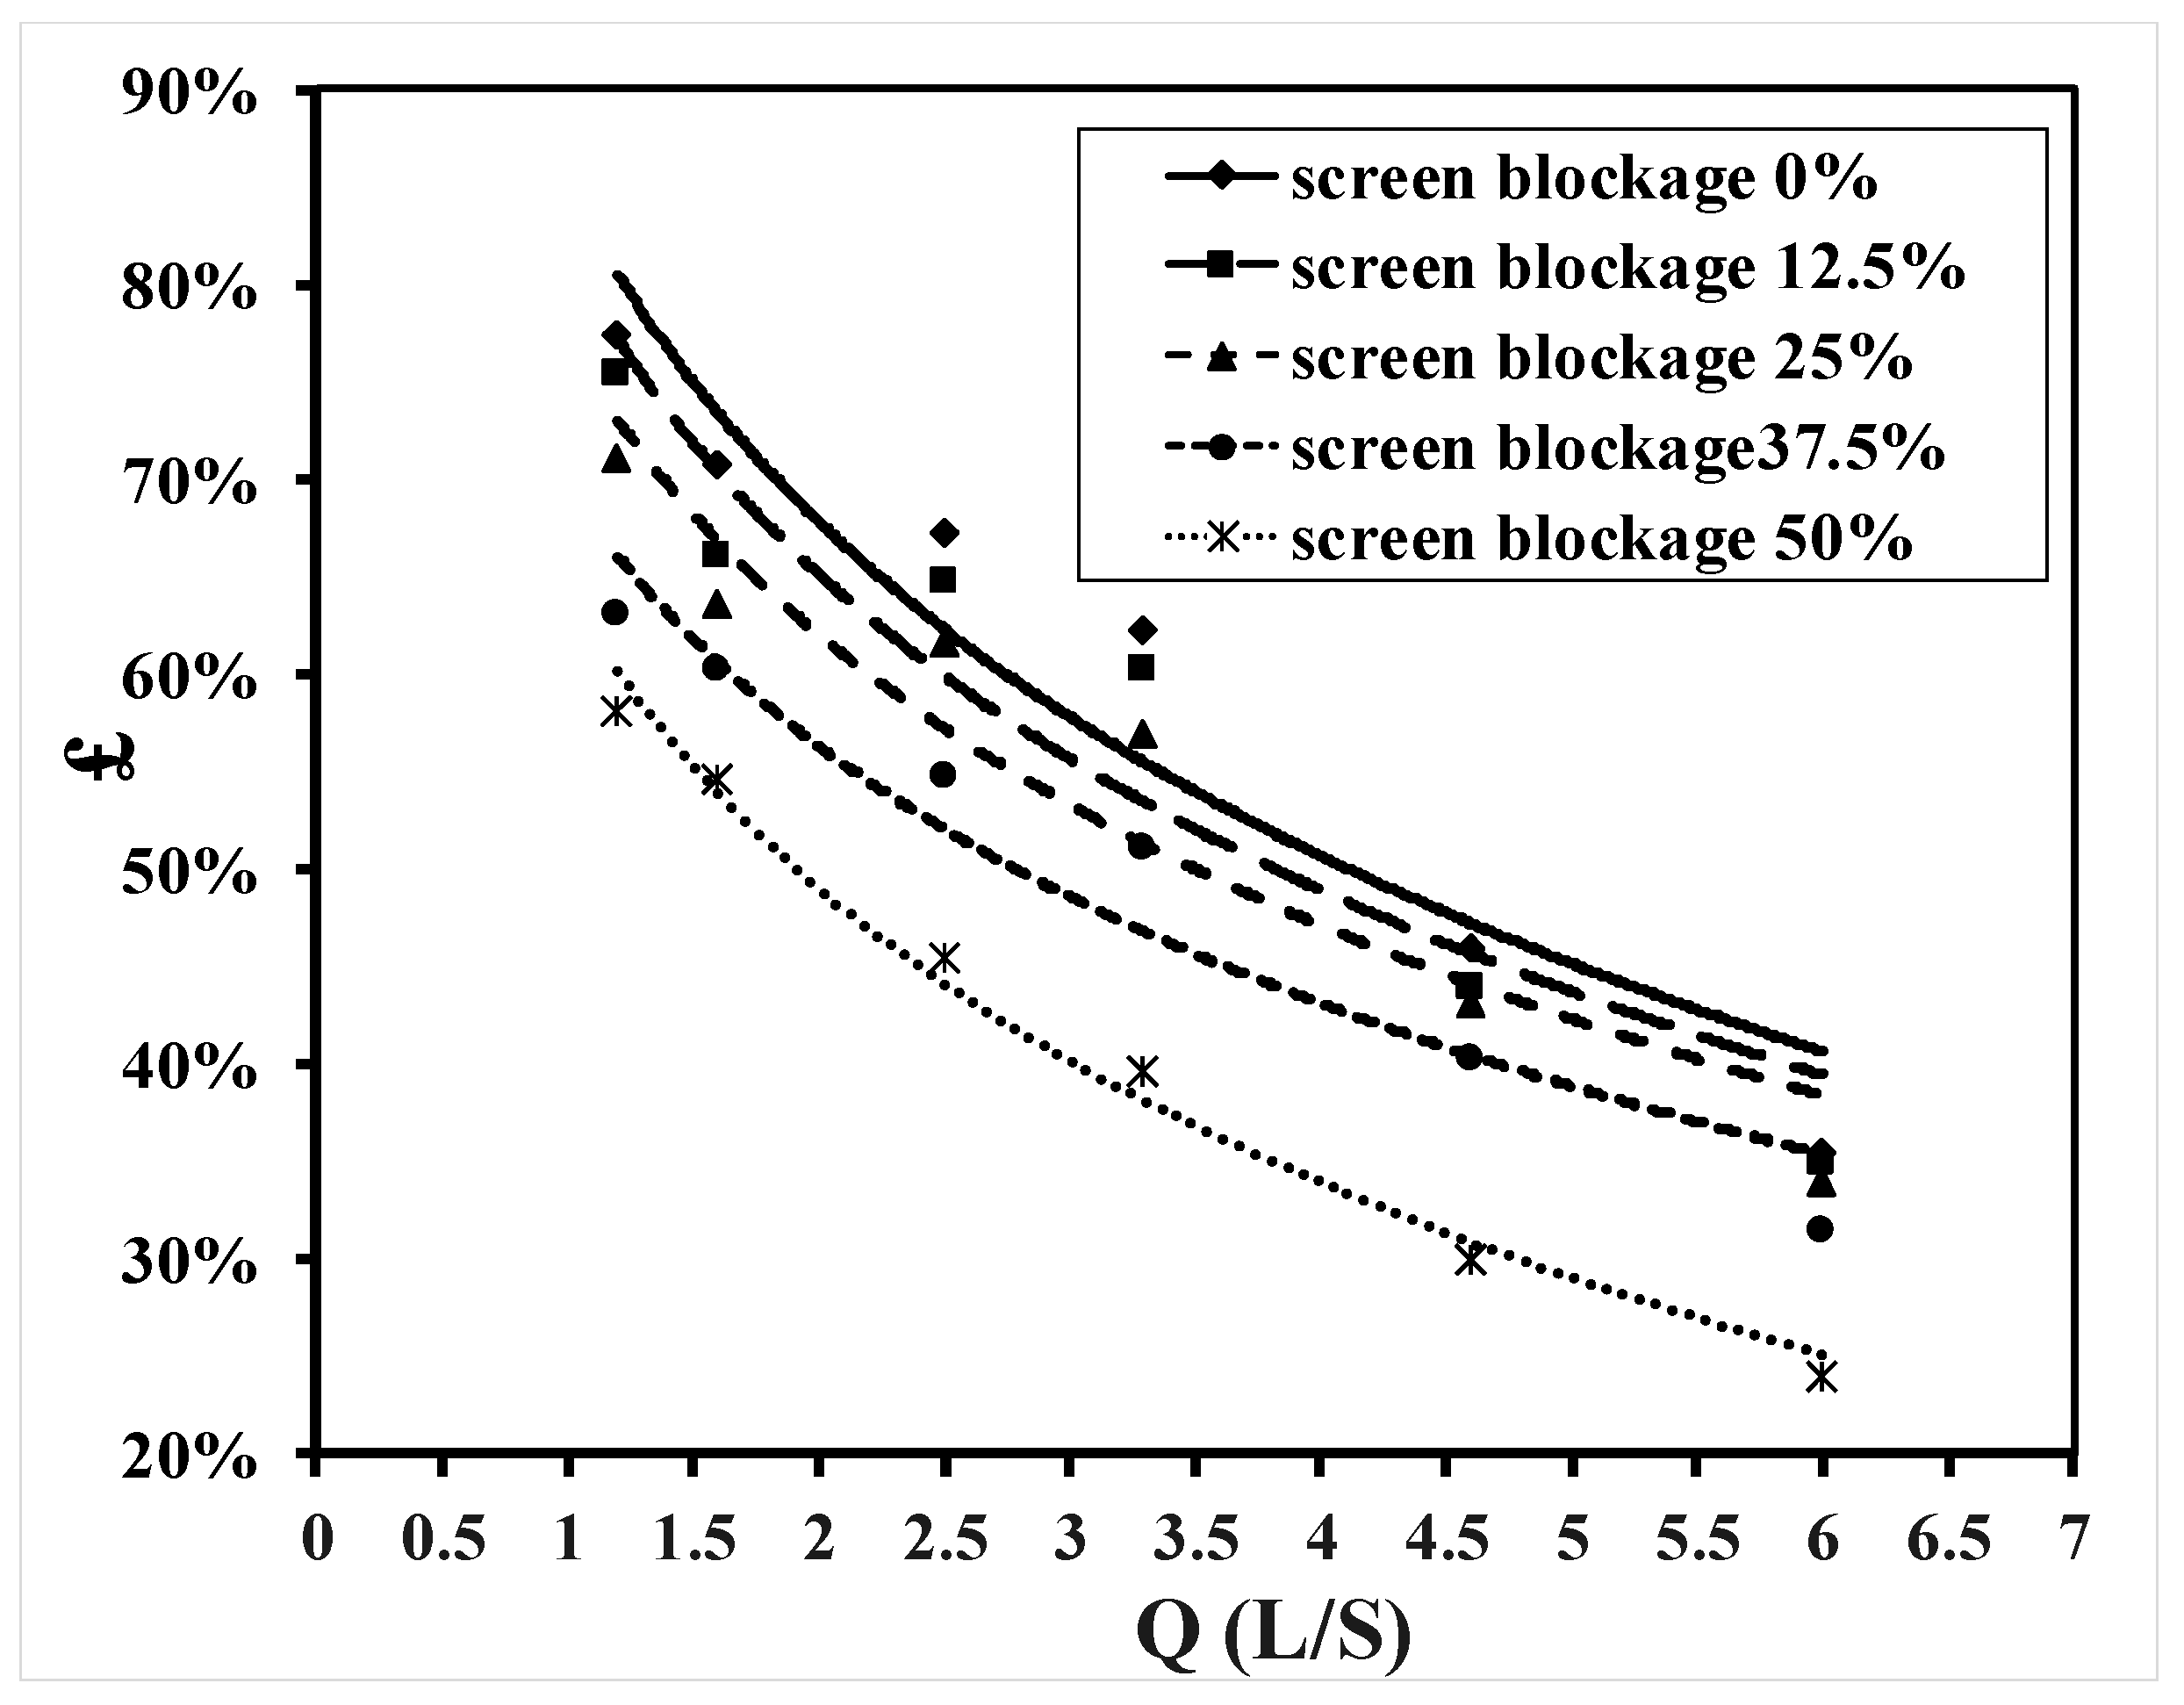
3.2. Second Group: Surface Blockage on Grate
Hydraulic efficiency was obtained for different ratios of surface blockage, as shown in Figure 22. The effect of surface blockage on drainage efficiency was examined for different blockage areas of grates (12.5%, 25%, 37.5%, and 50%).

Figure 22.
Surface blockage.
Figure 23 shows the relationship between discharge efficiency and passing discharge for various relative blockage areas of grates. It is obvious that by increasing surface blockage to 50% the efficiency decreases by (17.9%).

Figure 23.
Relationship between £ and Q for different surface blockages without pipe blockage.
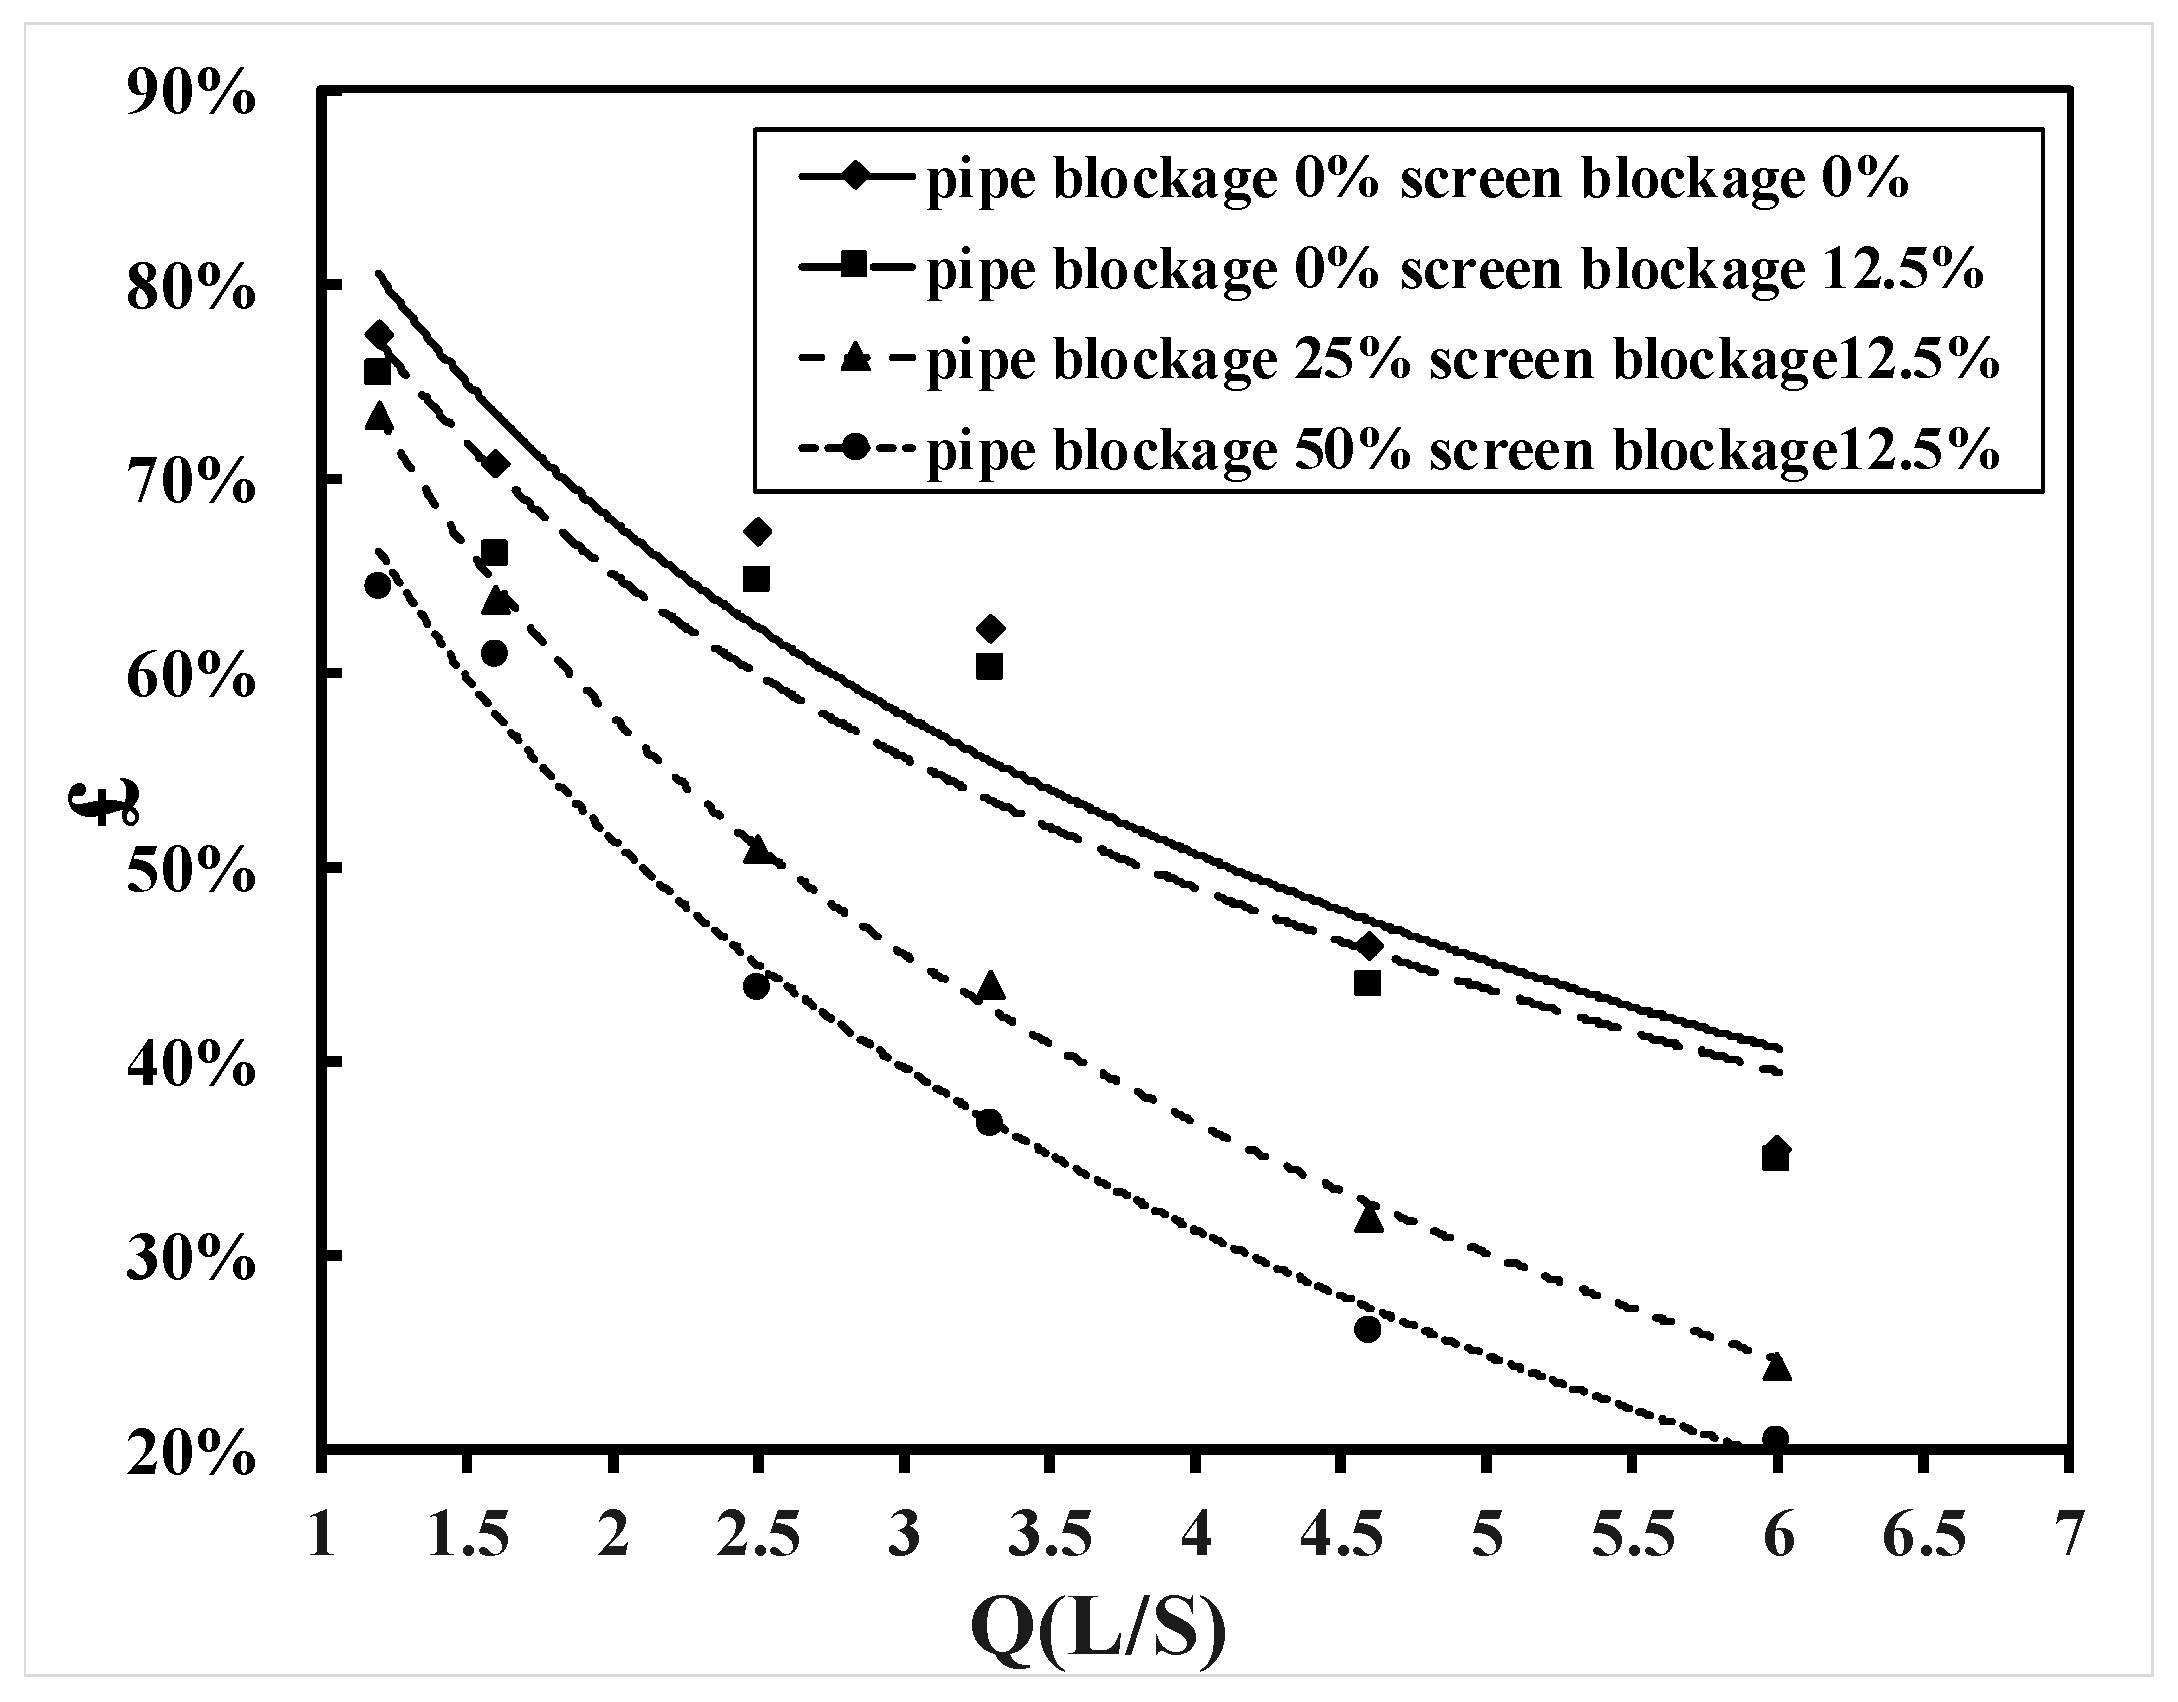
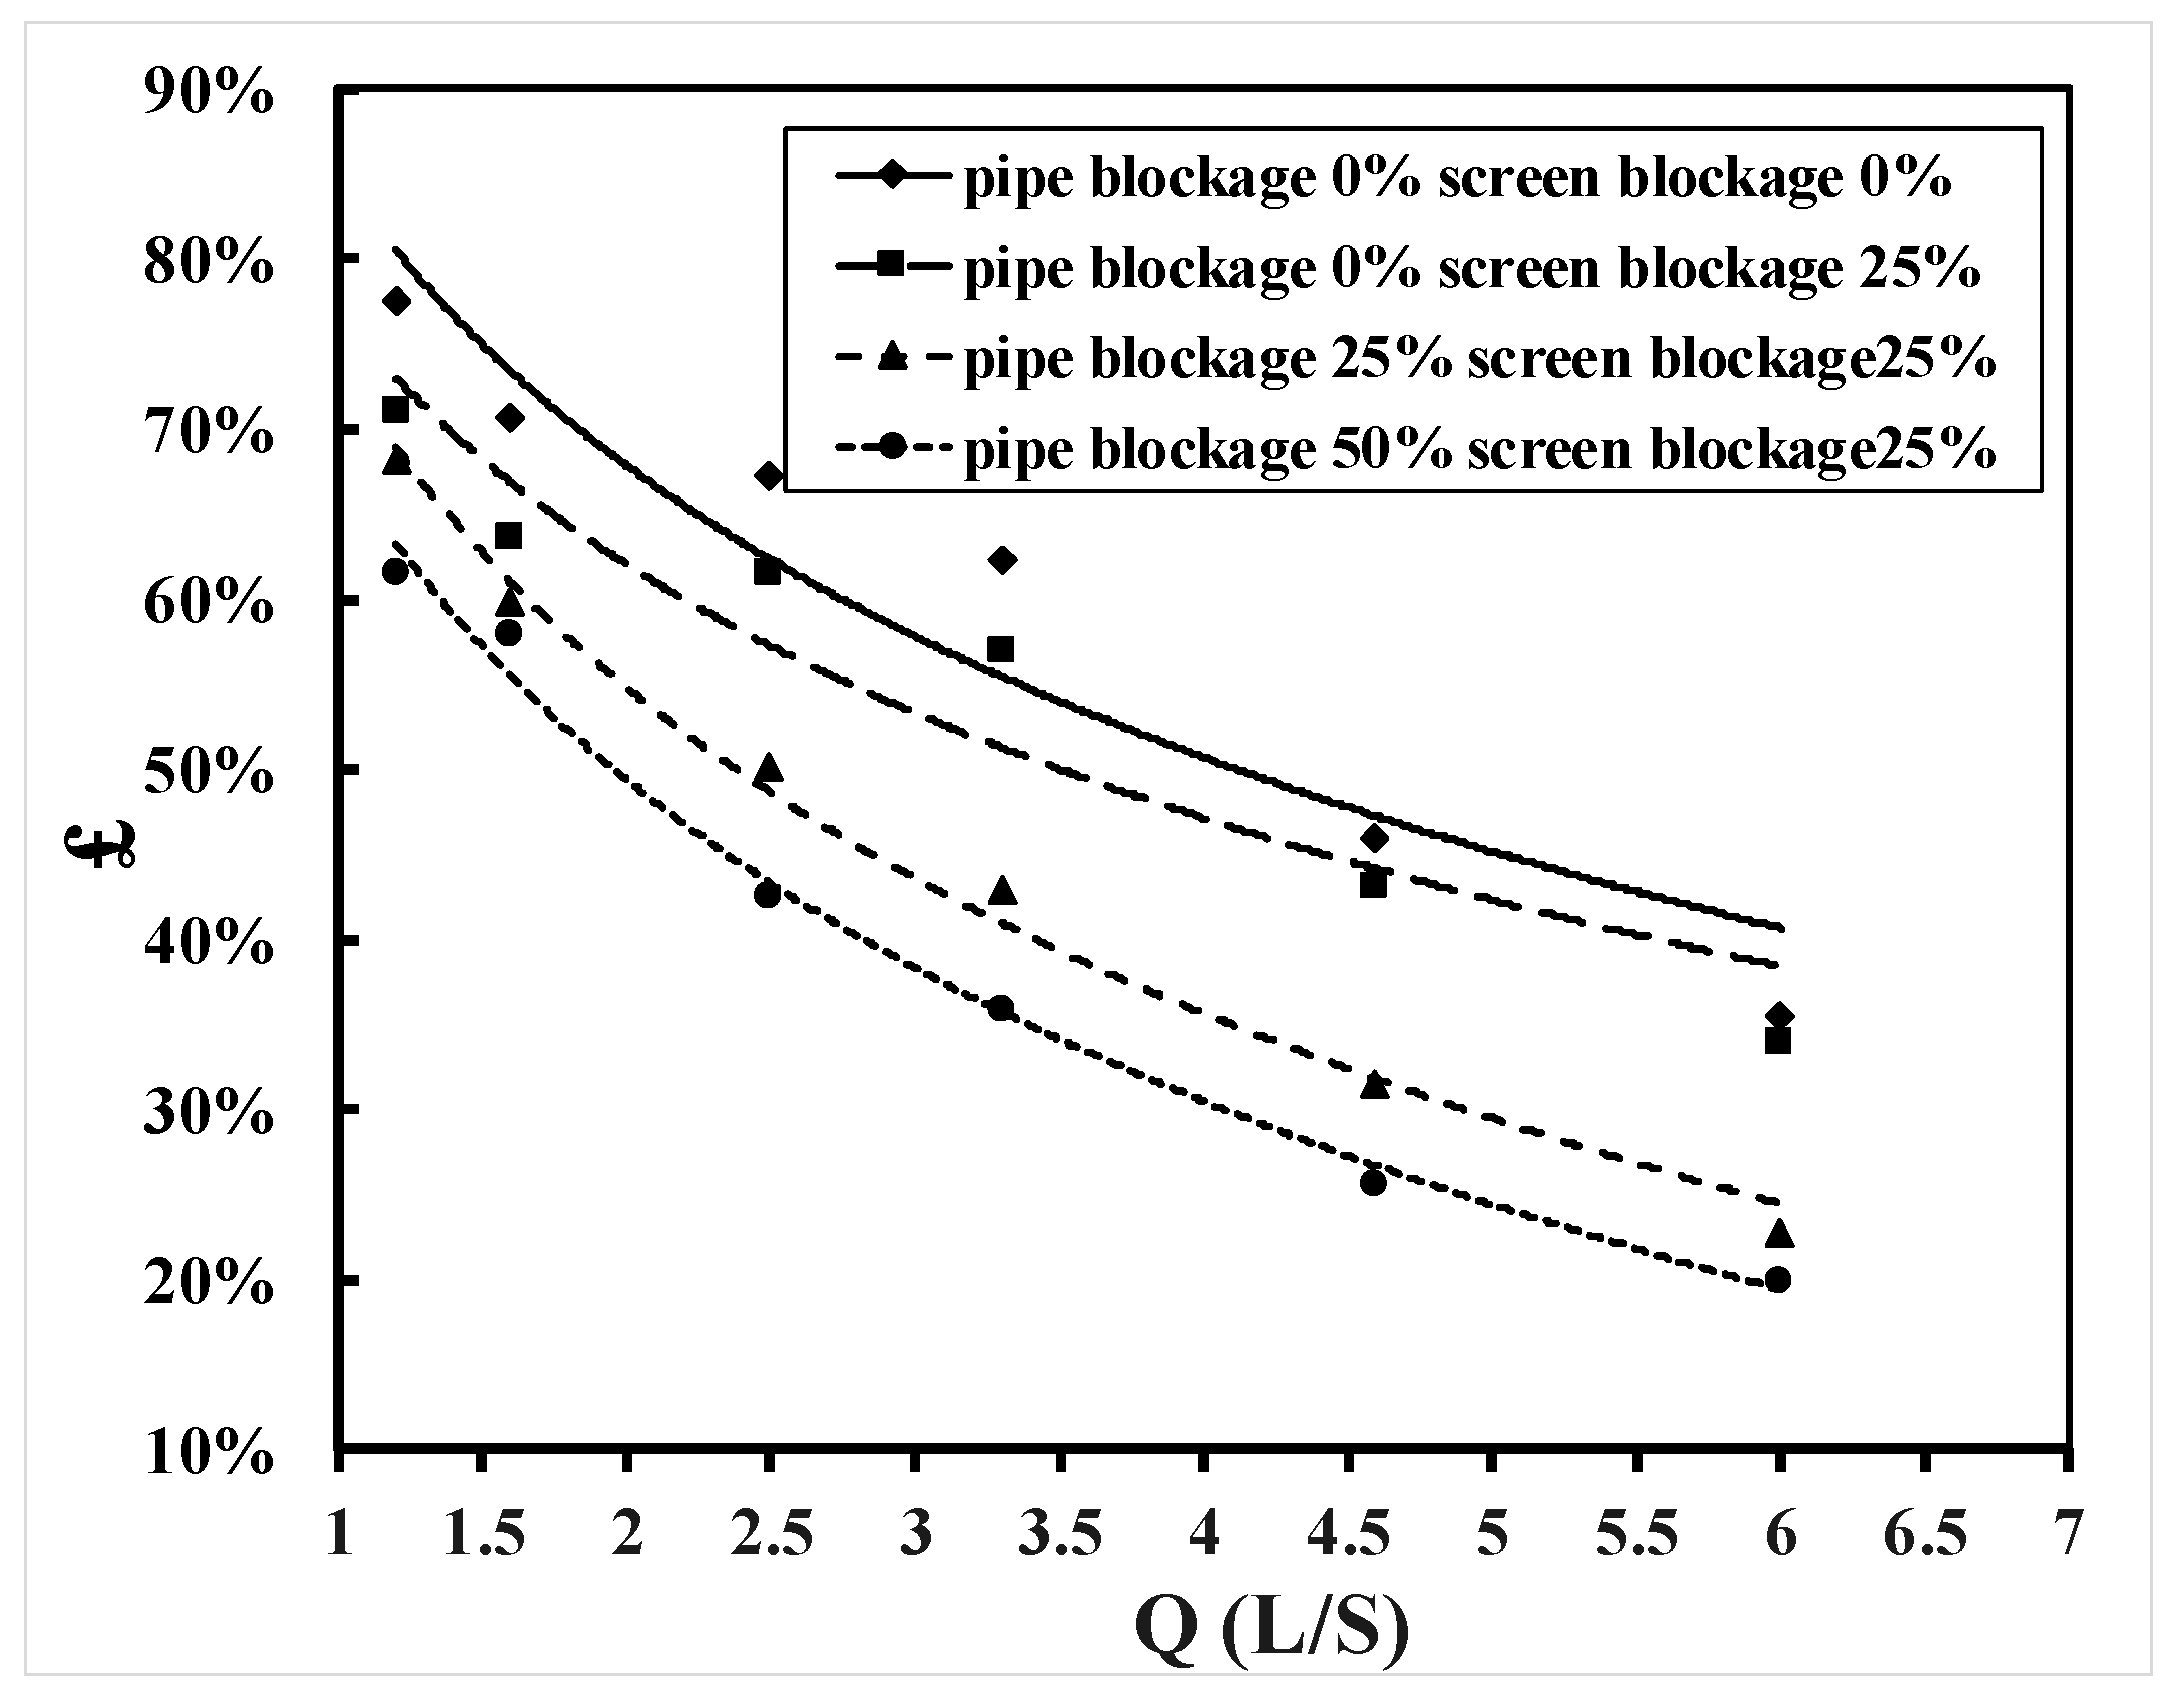
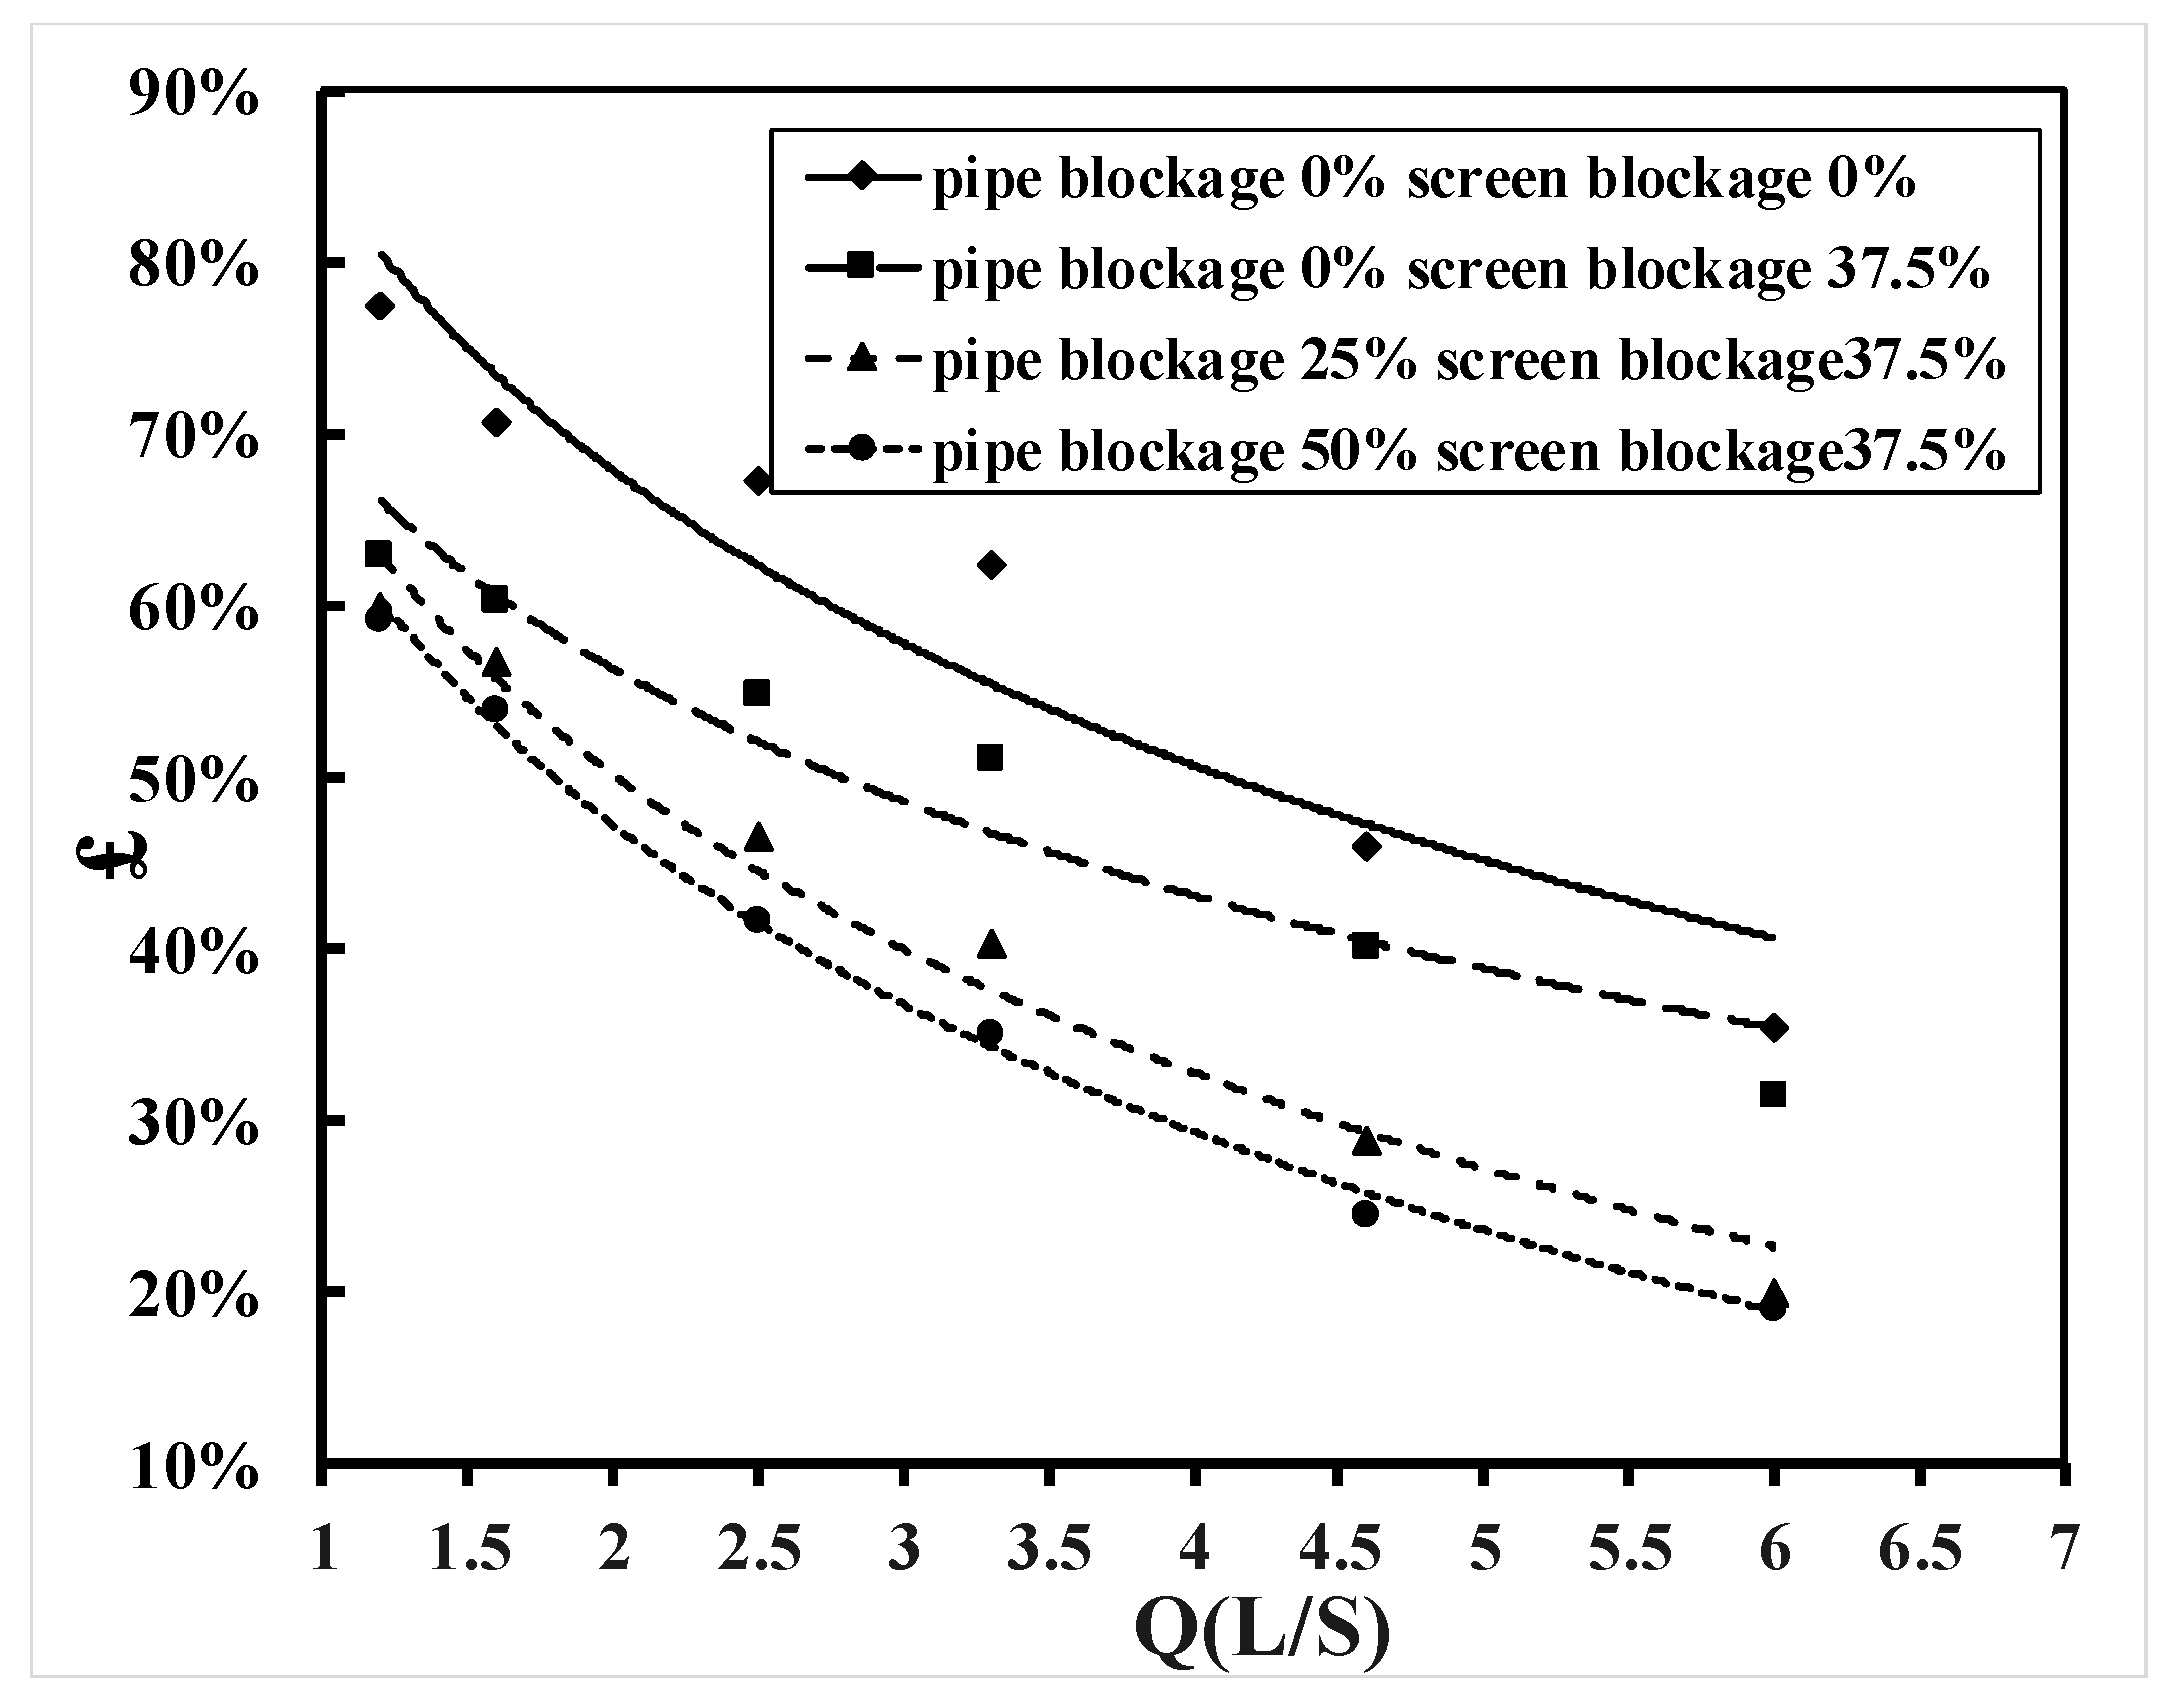
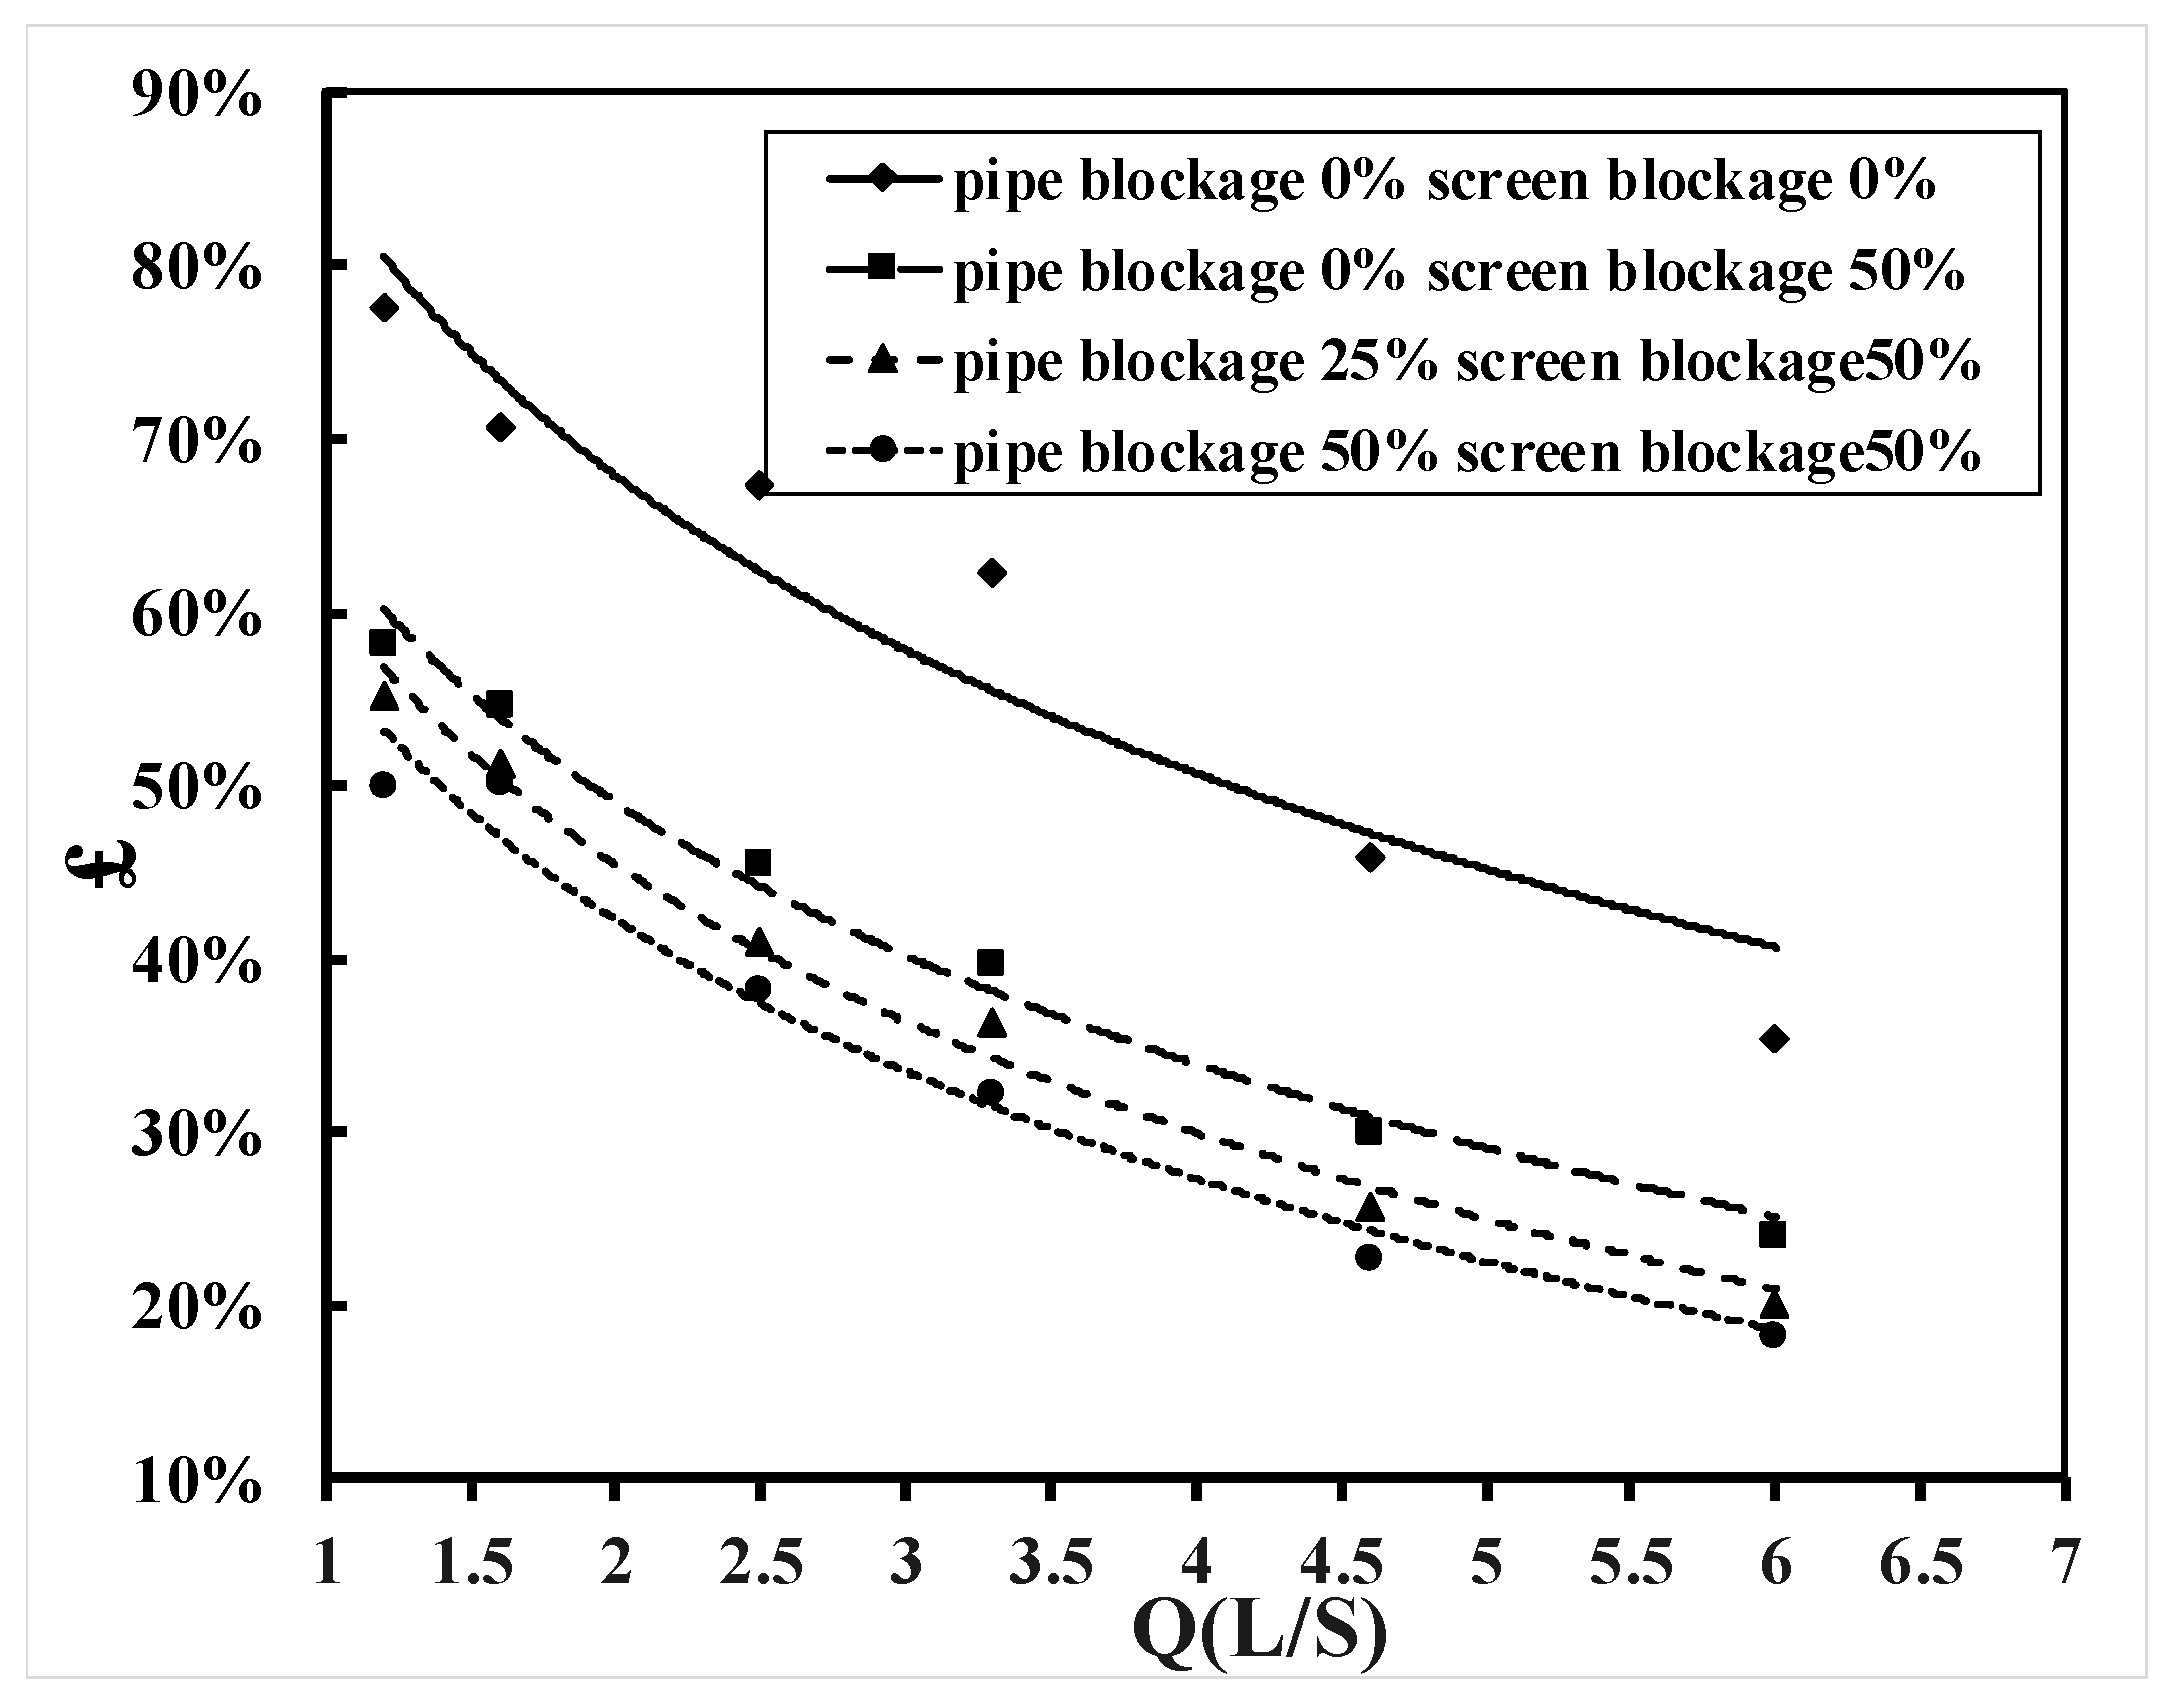
3.3. Third Group: Combined Blockage (Pipe and Grate Blockage)
A combined grate and main pipe blockage was investigated. A comparison between no blockage, grate blockage, and pipe blockage with relative height blockages of 25% and 50%, combining various surface blockages (12.5%, 25%, 37.5%, and 50%) was shown in Figure 24, Figure 25, Figure 26 and Figure 27. From these figures, it is clear that the discharge efficiency decreased as the amount of blockage increased with different grate blockages of 17.8%, 19.3%, 21%, and 24.6%, respectively. From the previous discussion, the blockage on the grate’s screen reduces the capture of surface water as well as the blockage within the main pipe reduces the size of the pipe needed for the transfer of excess water, which negatively affects the efficiency of the drainage system.

Figure 24.
Relationship between £ and Q for different ratios of blockage height at surface blockage 12.5%.

Figure 25.
Relationship between £ and Q for different ratios of blockage height at surface blockage 25%.

Figure 26.
Relationship between £ and Q for different ratios of blockage height at surface blockage 37.5%.

Figure 27.
Relationship between £ and Q for different ratios of blockage height at surface blockage 50%.
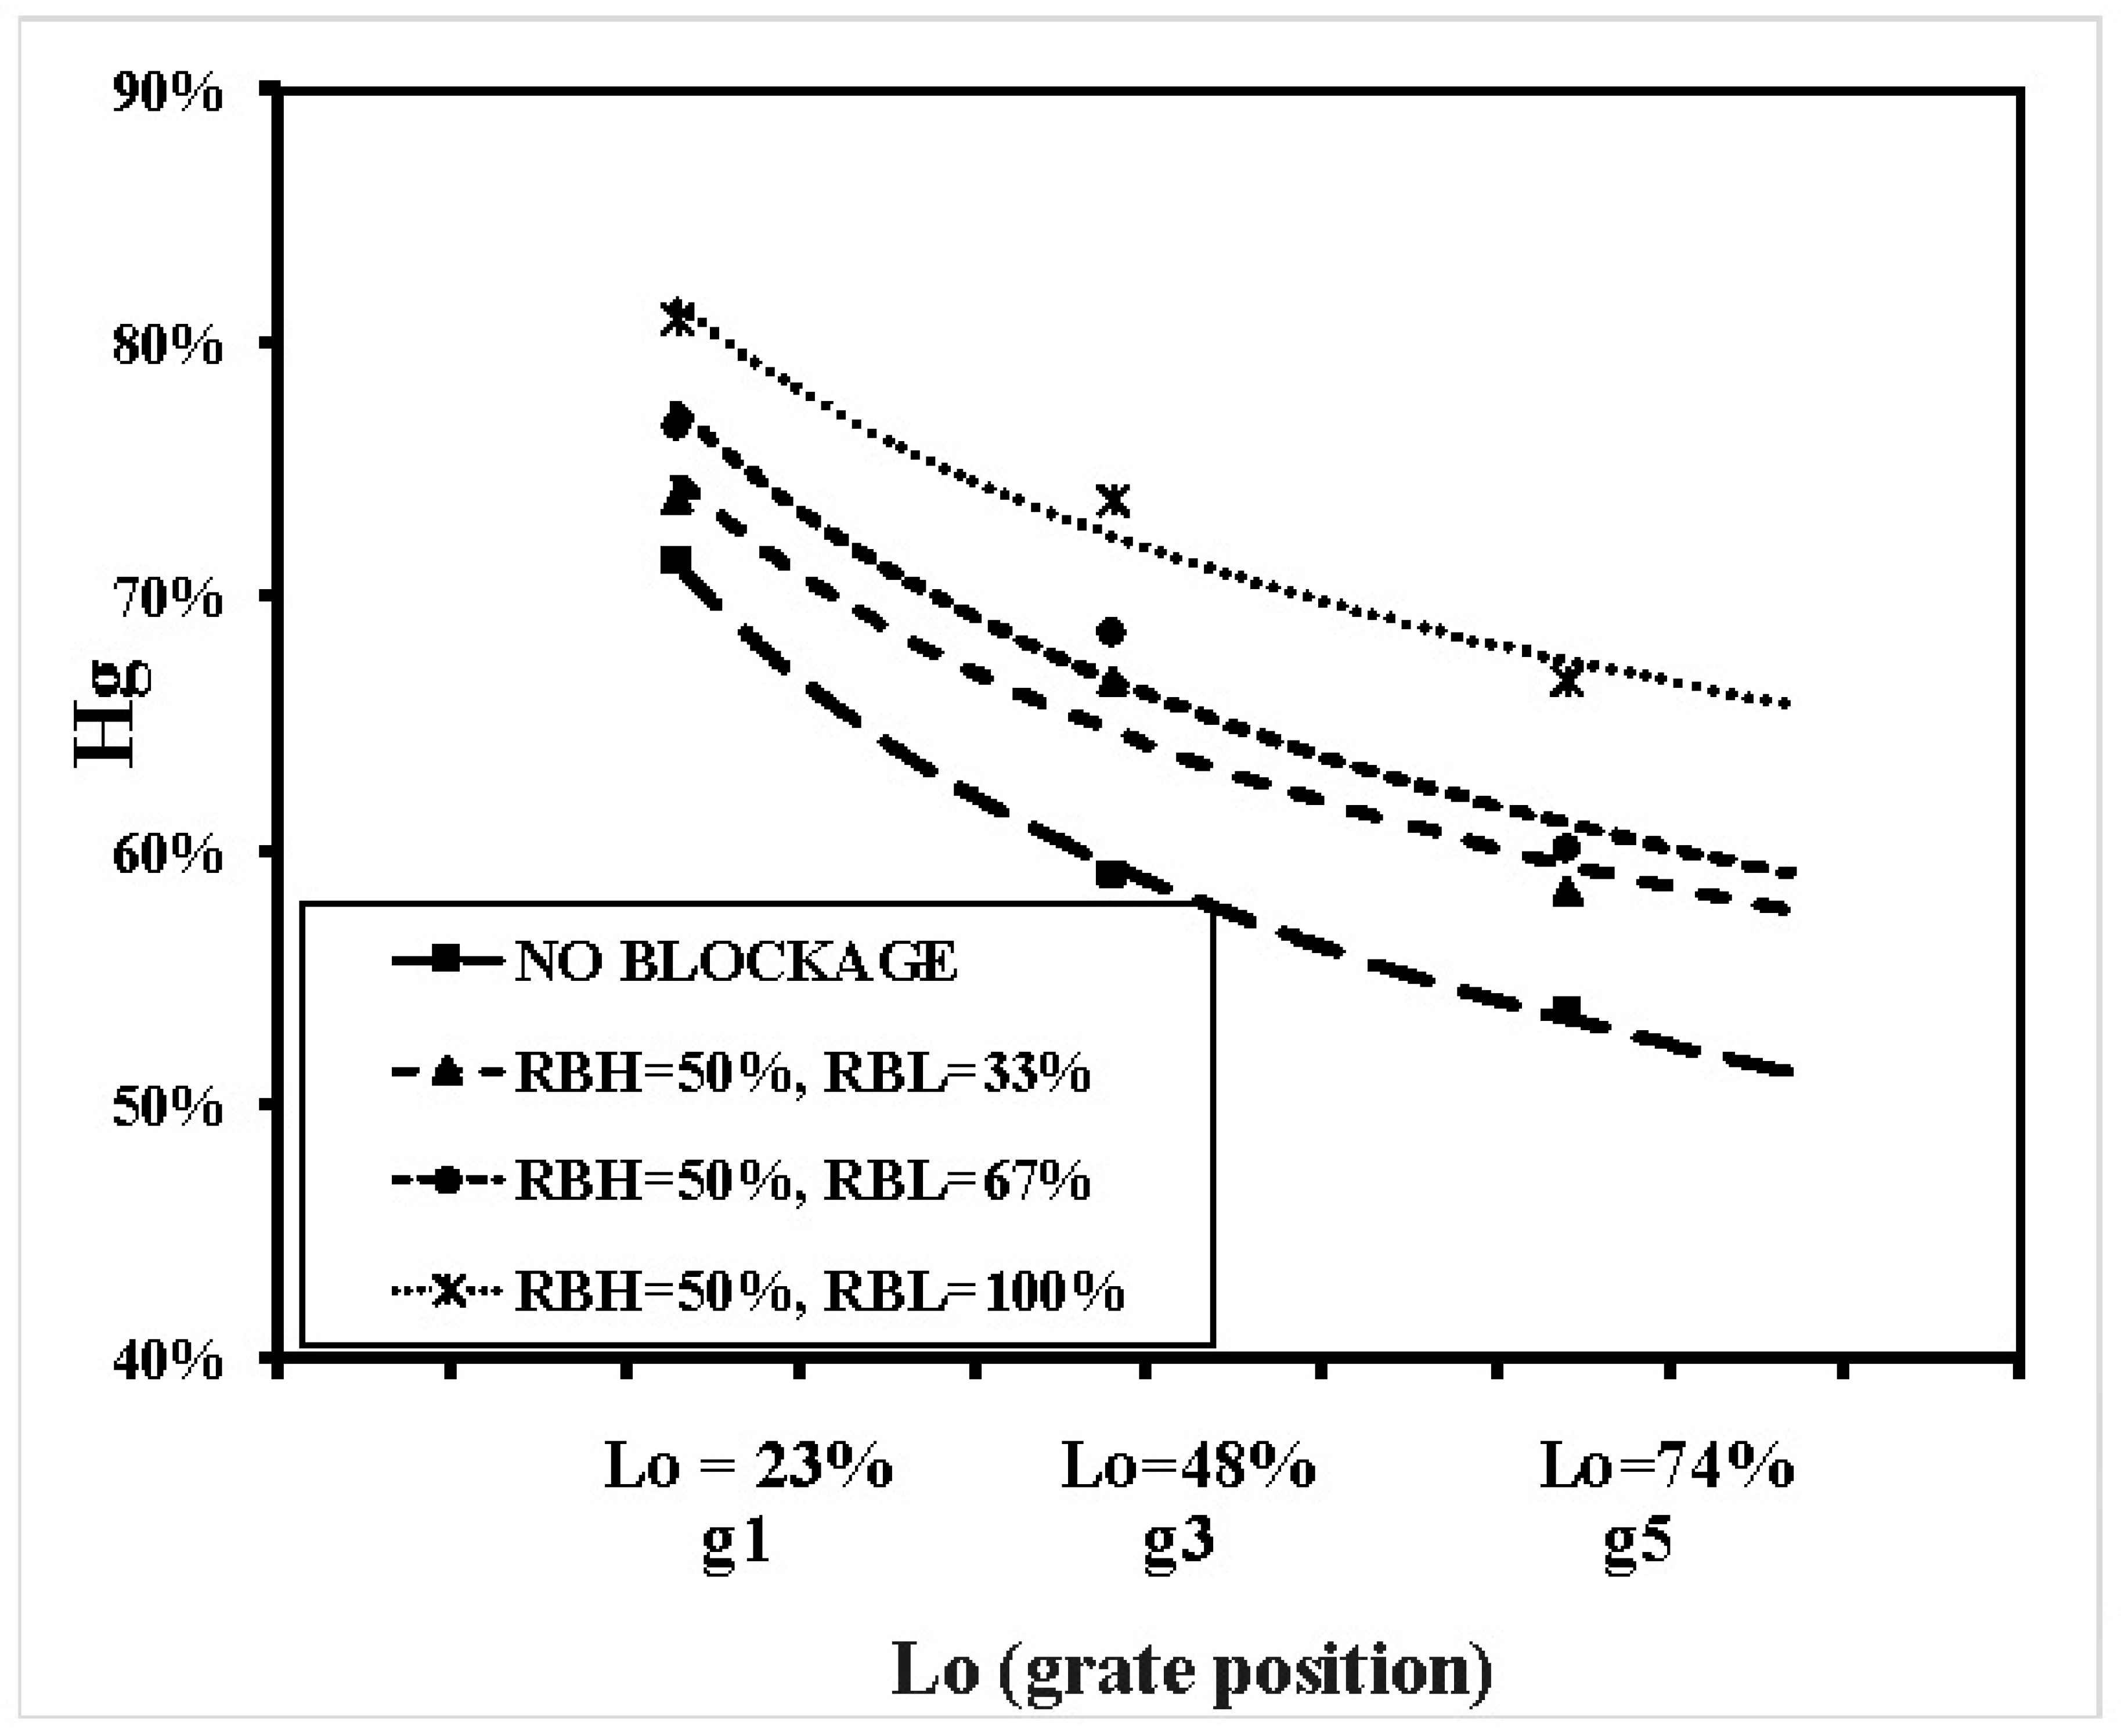
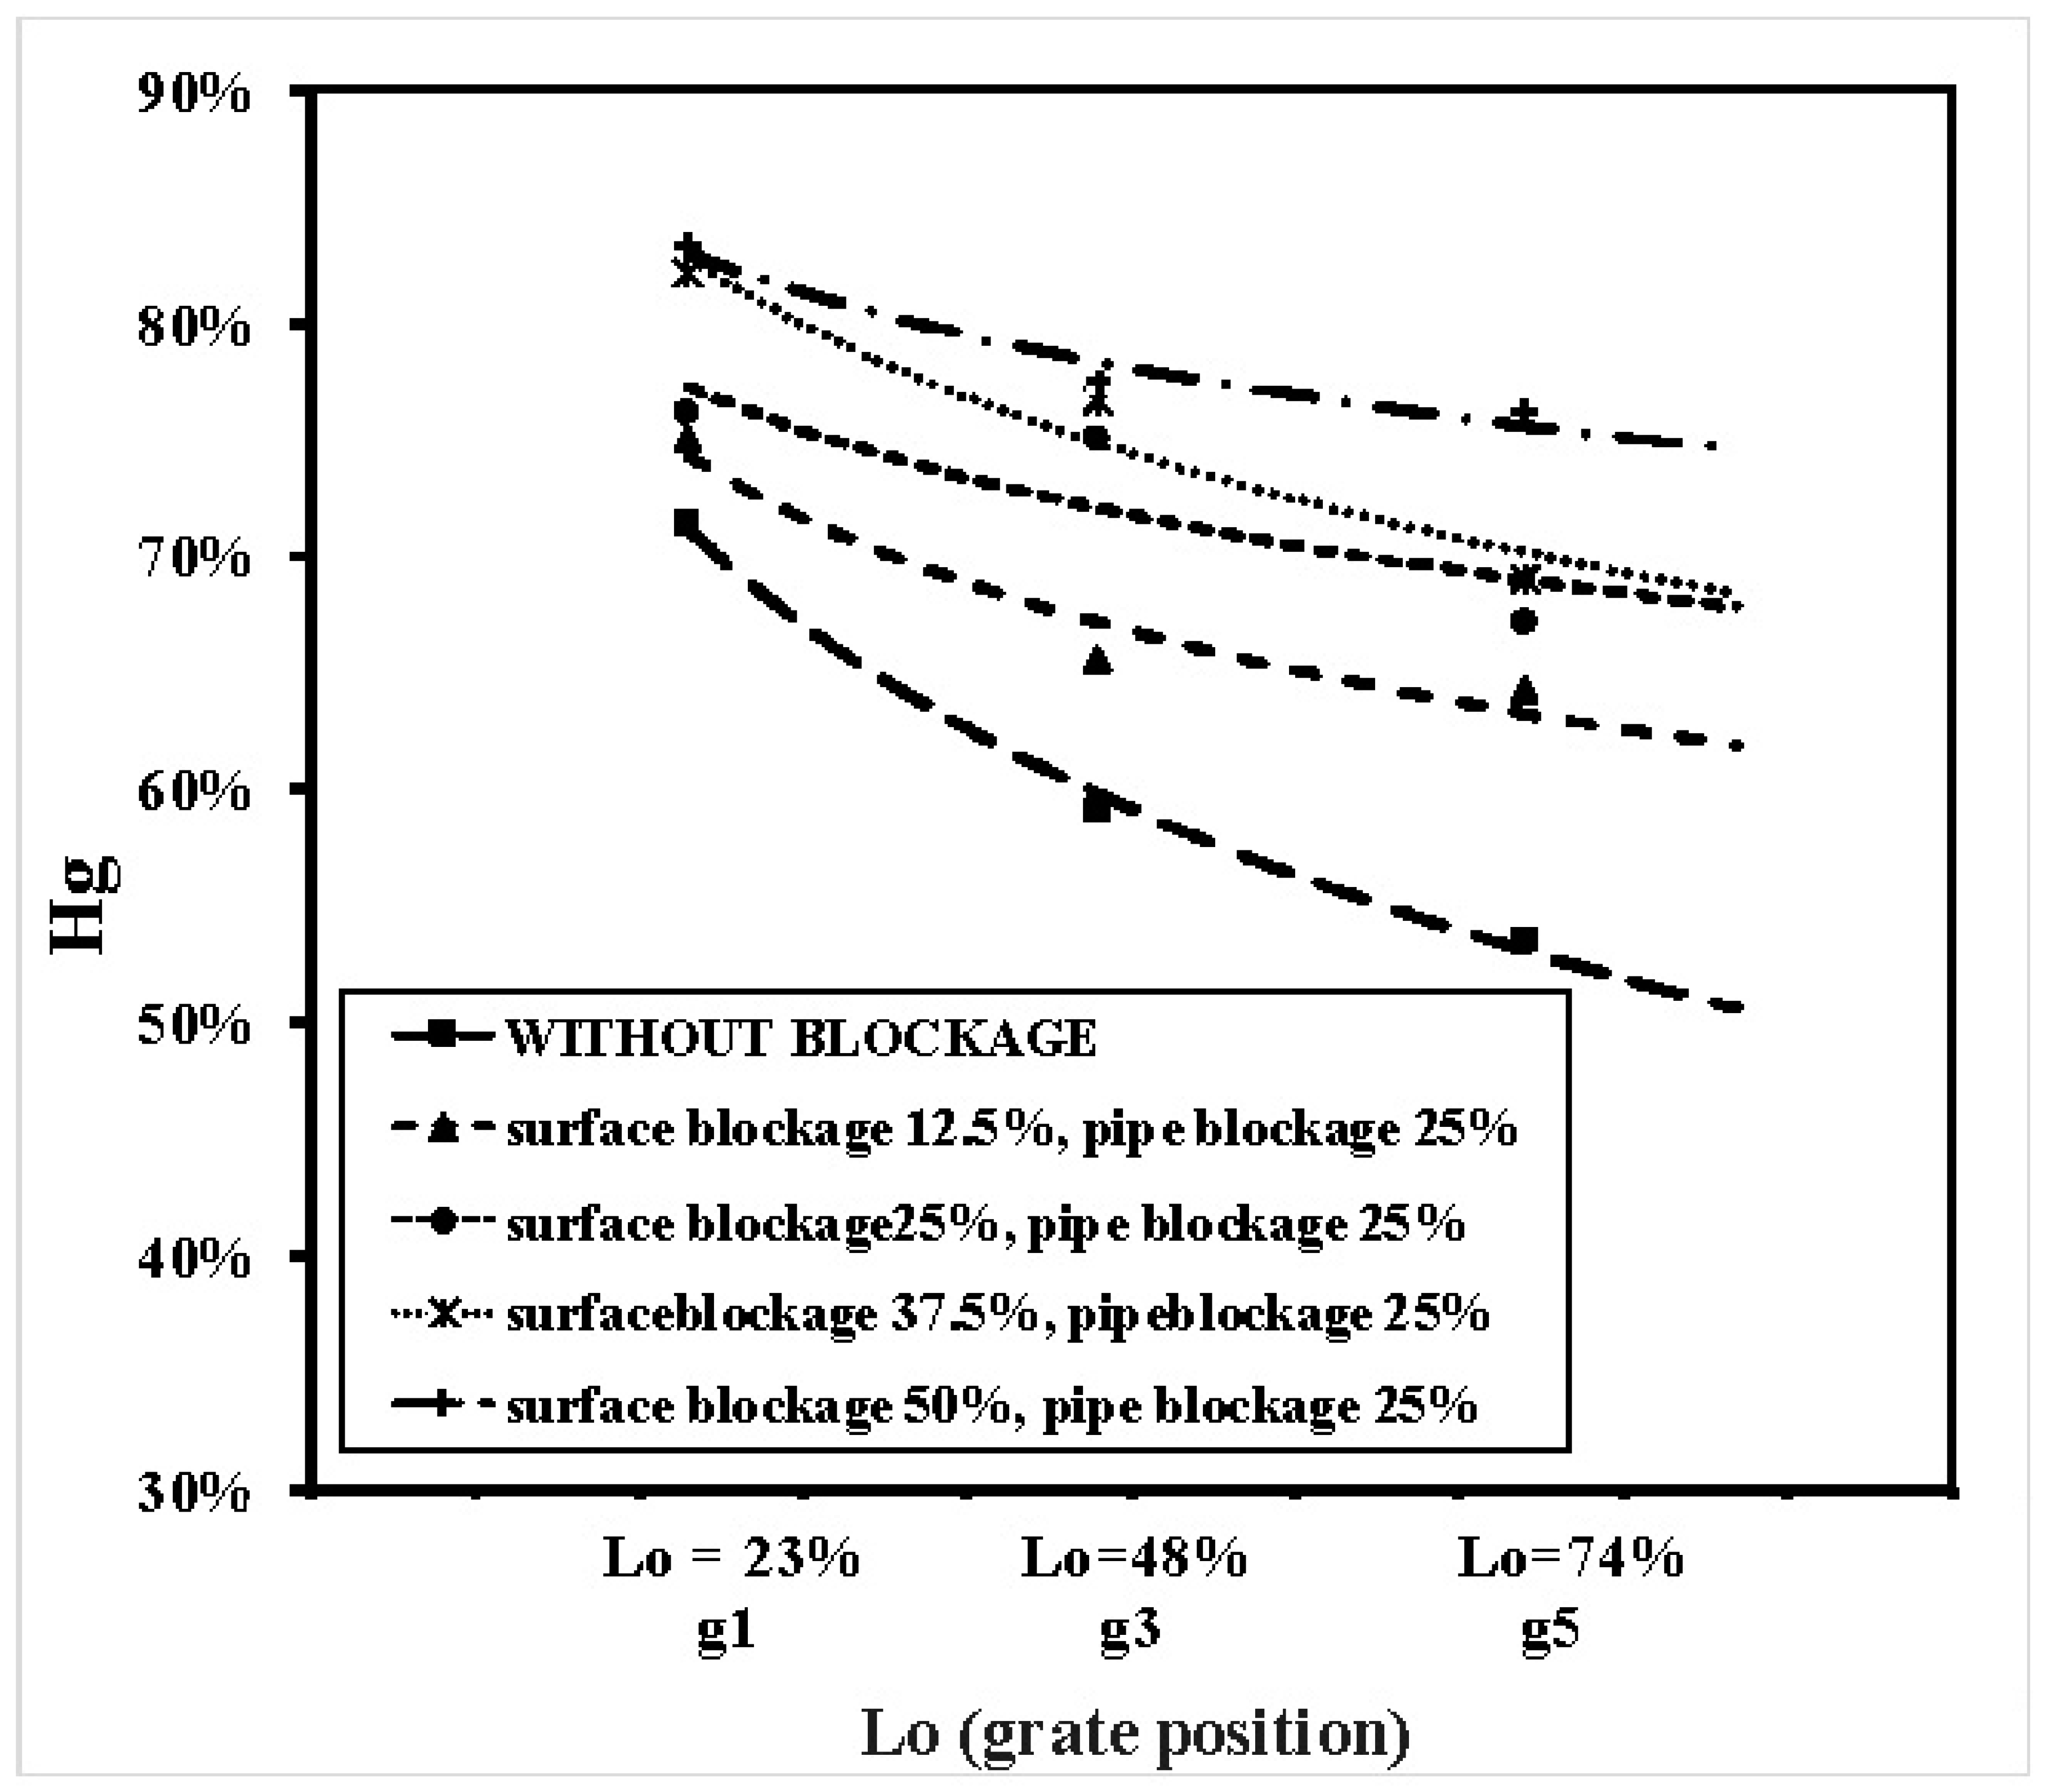
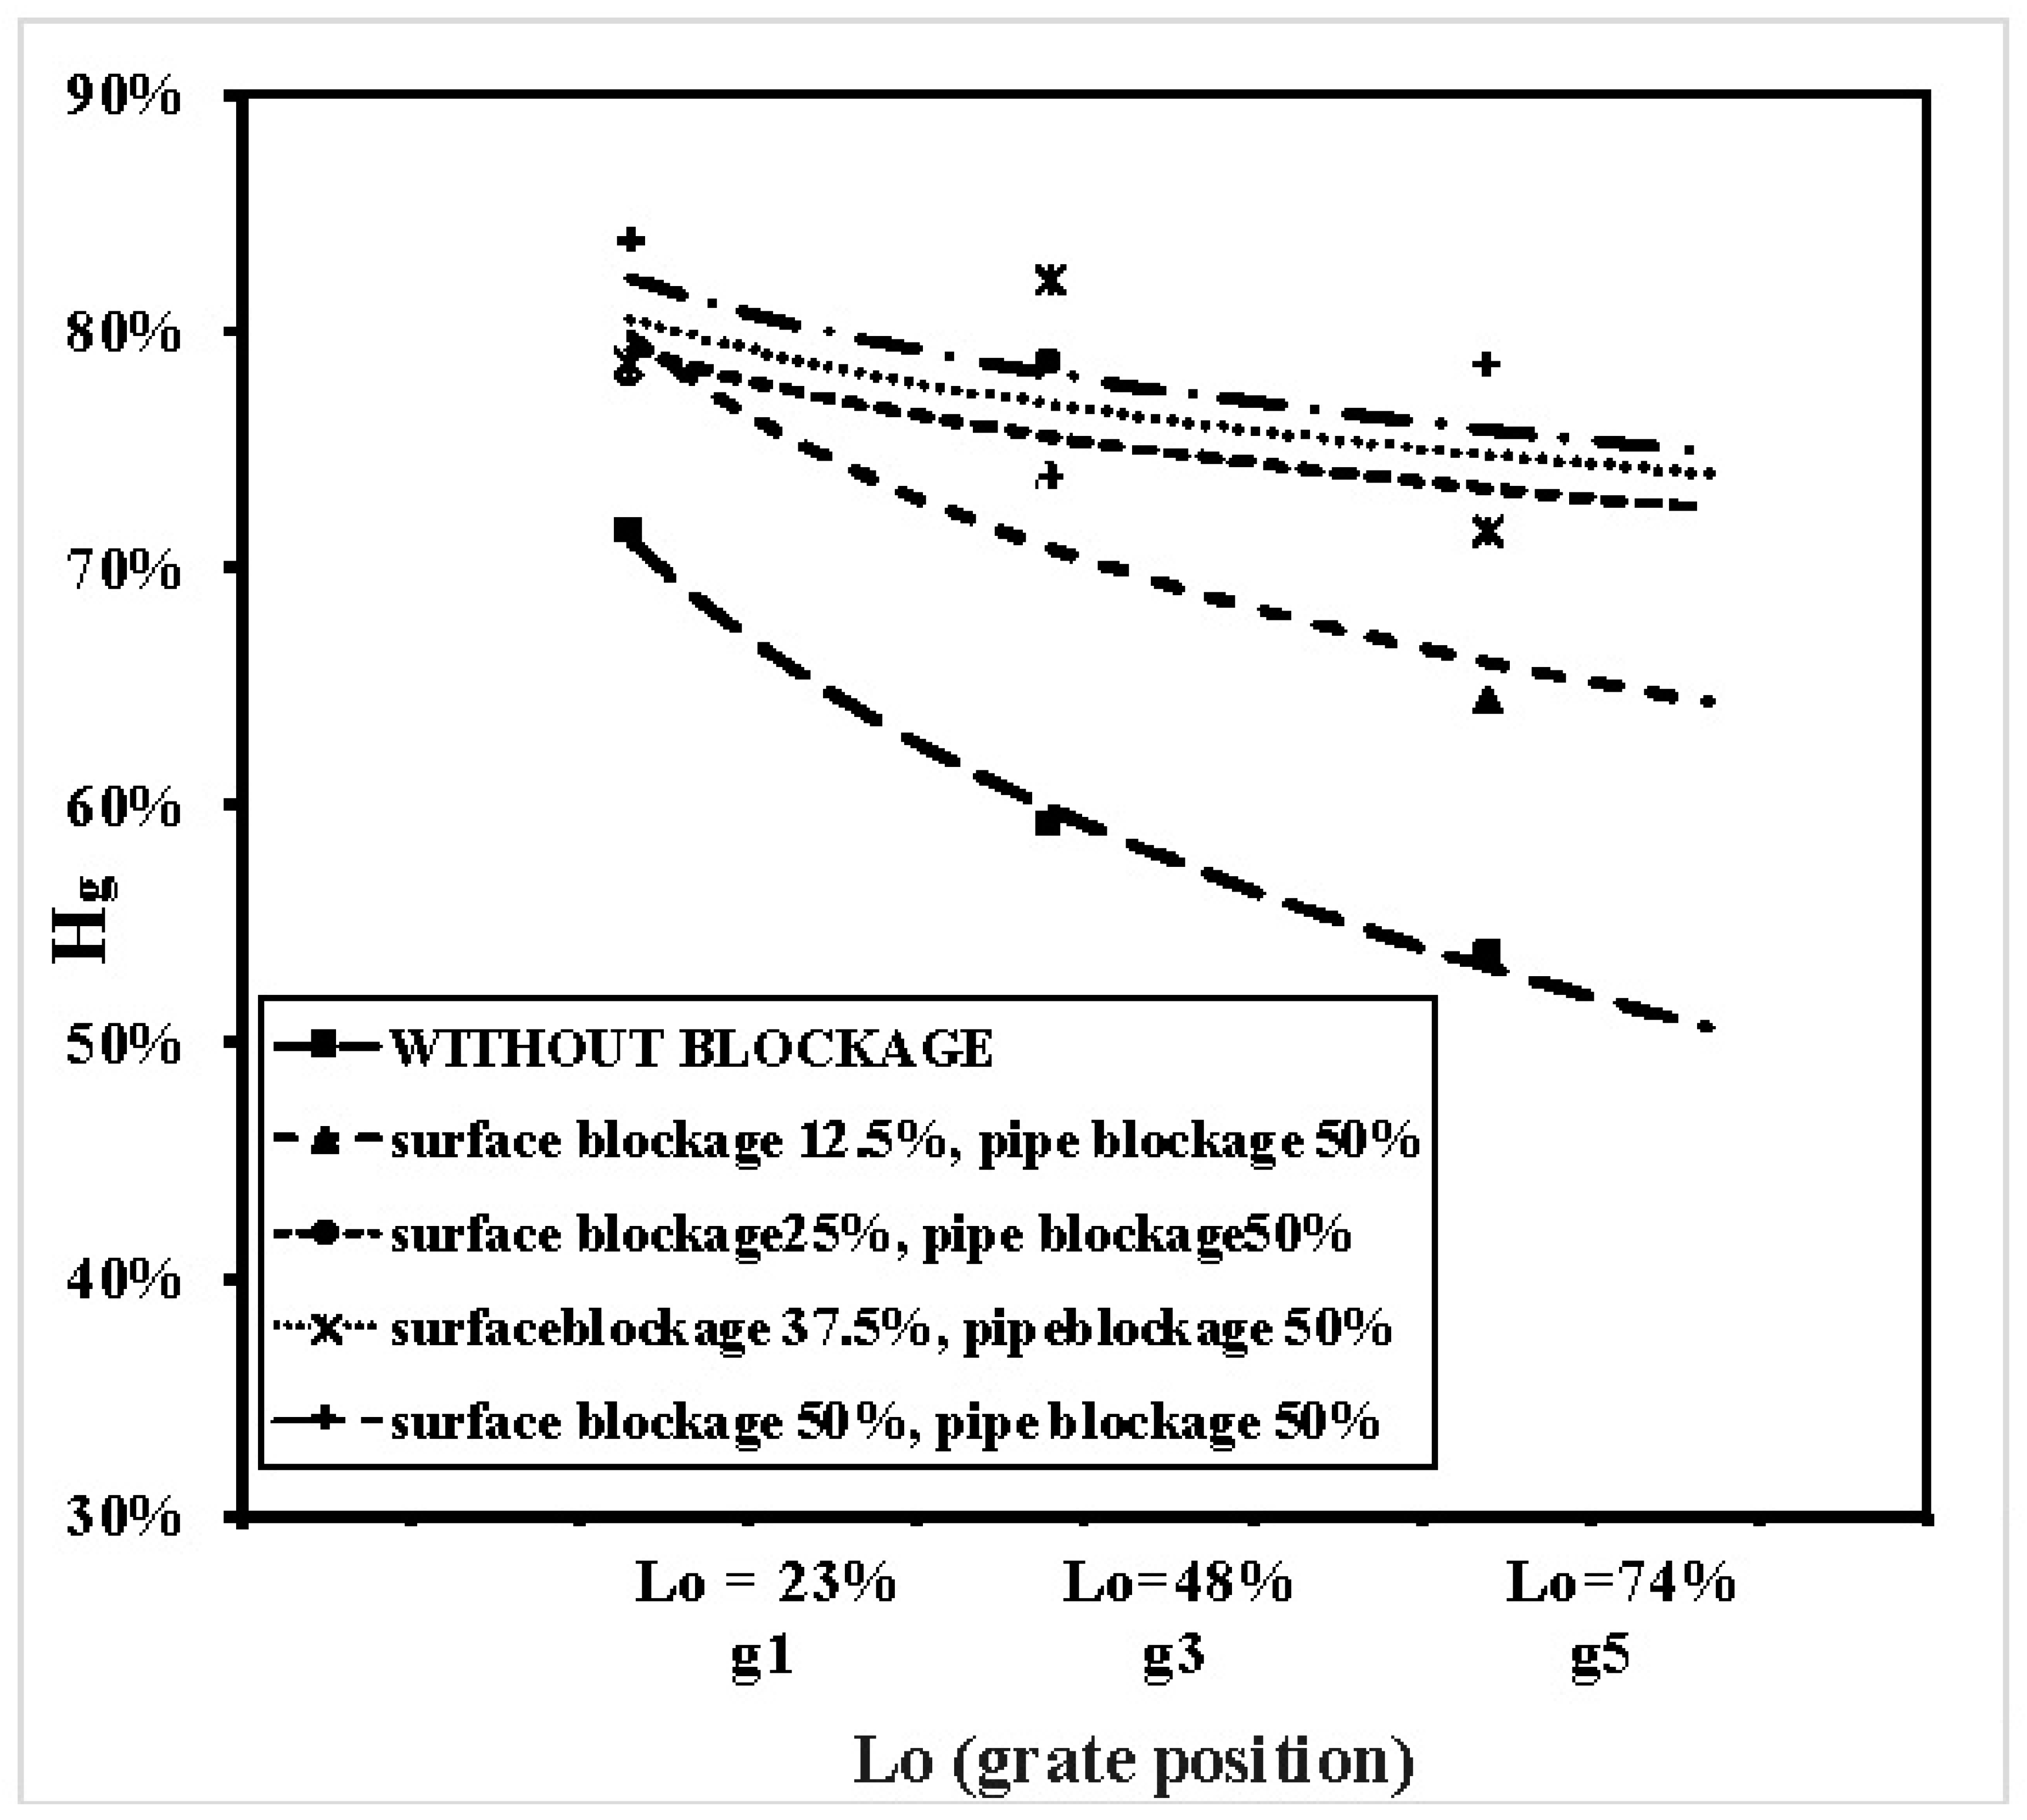
Figure 28 and Figure 29 show the relationship between relative grate water heights and relative grate length according to pipe blockage of 25% and 50%, with different grate blockage at Q = 6.00 L/sec. From these figures, it can be noted that as surface blockage increased, the relative grate heights increased within 6.15%, 8.6%, 10%, and 12%) due to shortage in discharge efficiency, which lead to increased water surface profile.

Figure 28.
Relationship between Hg and LO for different ratios of grate blockage with pipe blockage 25% at Q = 6.00 L/sec.

Figure 29.
Relationship between Hg and LO for different ratios of grate blockage with pipe blockage 50% at Q = 6.00 L/sec.
3.4. Summary of Results
Results of all blockage ratios through storm water drainage system can be summarized according to the following tables and figures:
Table 1 shows the reduction of overall discharge efficiency of system according to pipe height blockage. The table also demonstrates the efficiency of system for discharge of 6.00 L/s and 1.00 L/s. Moreover, the table shows the average efficiency of discharge (AEOD) of discharges Q = 1.00 L/s to 6.00 L/s.

Table 1.
The results of efficiency reduction for different blockage heights.
Table 2 shows the reduction of overall discharge efficiency for combined pipe blockage (end and length blockage).
Table 2.
The results of efficiency reduction for different relative blockage lengths and heights.
Finally, Table 3 illustrates the overall reduction efficiency by combined pipe and grate blockage.
Table 3.
Experimental results for various ratios of blockage.
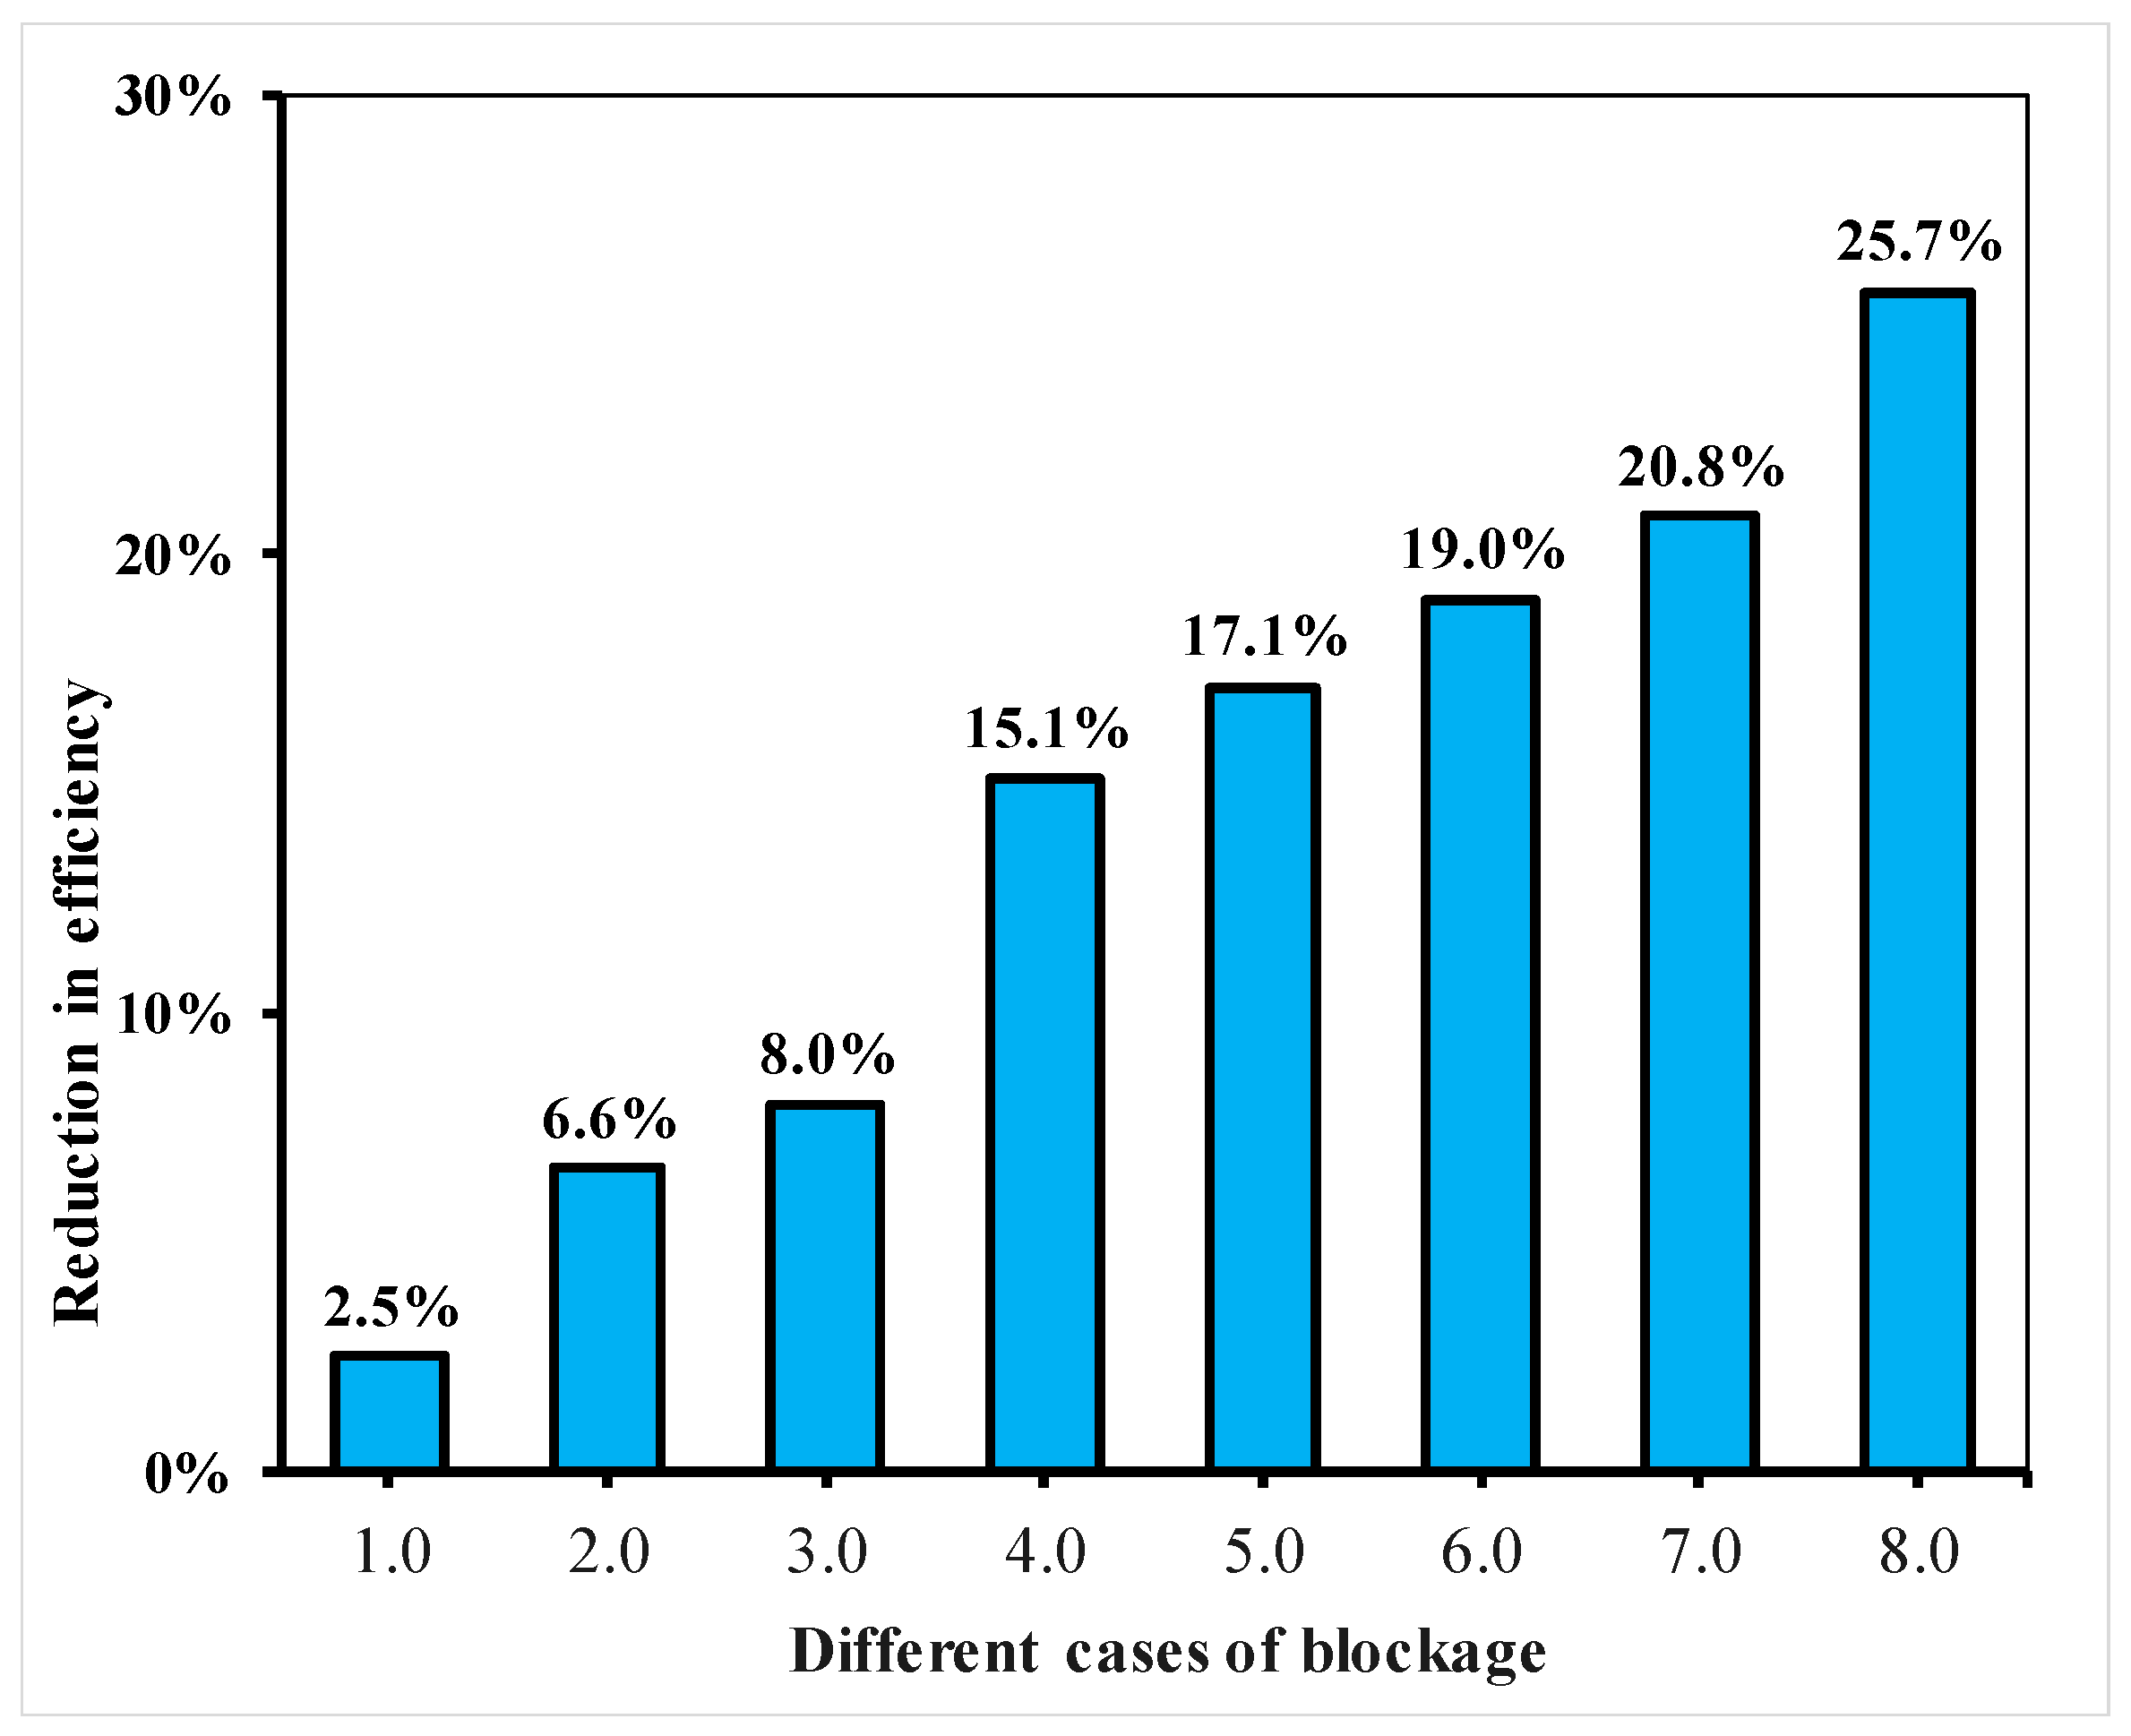
Moreover, Figure 30 shows discharge efficiency for different remaining ratios of blockages.
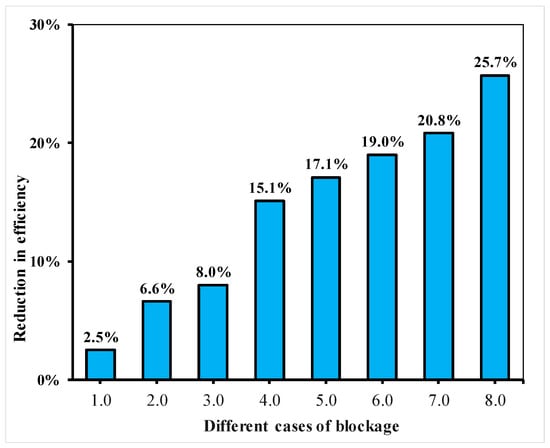
Figure 30.
Reduction in efficiency tor different ratios.
where
- Relative blockage height (RBH) = 50%
- RBH = 50%, relative blockage length (RBL) = 33%
- RBH = 50%, RBL = 66%
- RBH = 50%, RBL = 100%
- RBH = 50%, RBL = 100%, relative blockage of grate area (RBGA) = 12.5%
- RBH = 50%, RBL = 100%, RBGA = 25%
- RBH = 50%, RBL = 100%, RBGA = 37.5%
- RBH = 50%, RBL = 100%, RBGA = 50%
3.5. Prediction of Efficiency
By analyzing measured data, Equation (2) was developed to correlate the water discharge efficiency (£) with relative blockage height, relative blockage length, relative area blockage, and flume discharge.
where
- LB = relative blockage length (decimal)
- HB = relative blockage height (decimal)
- AB = relative blockage area (decimal)
- Q = flume discharge (L/s)
- = system discharge efficiency (decimal)
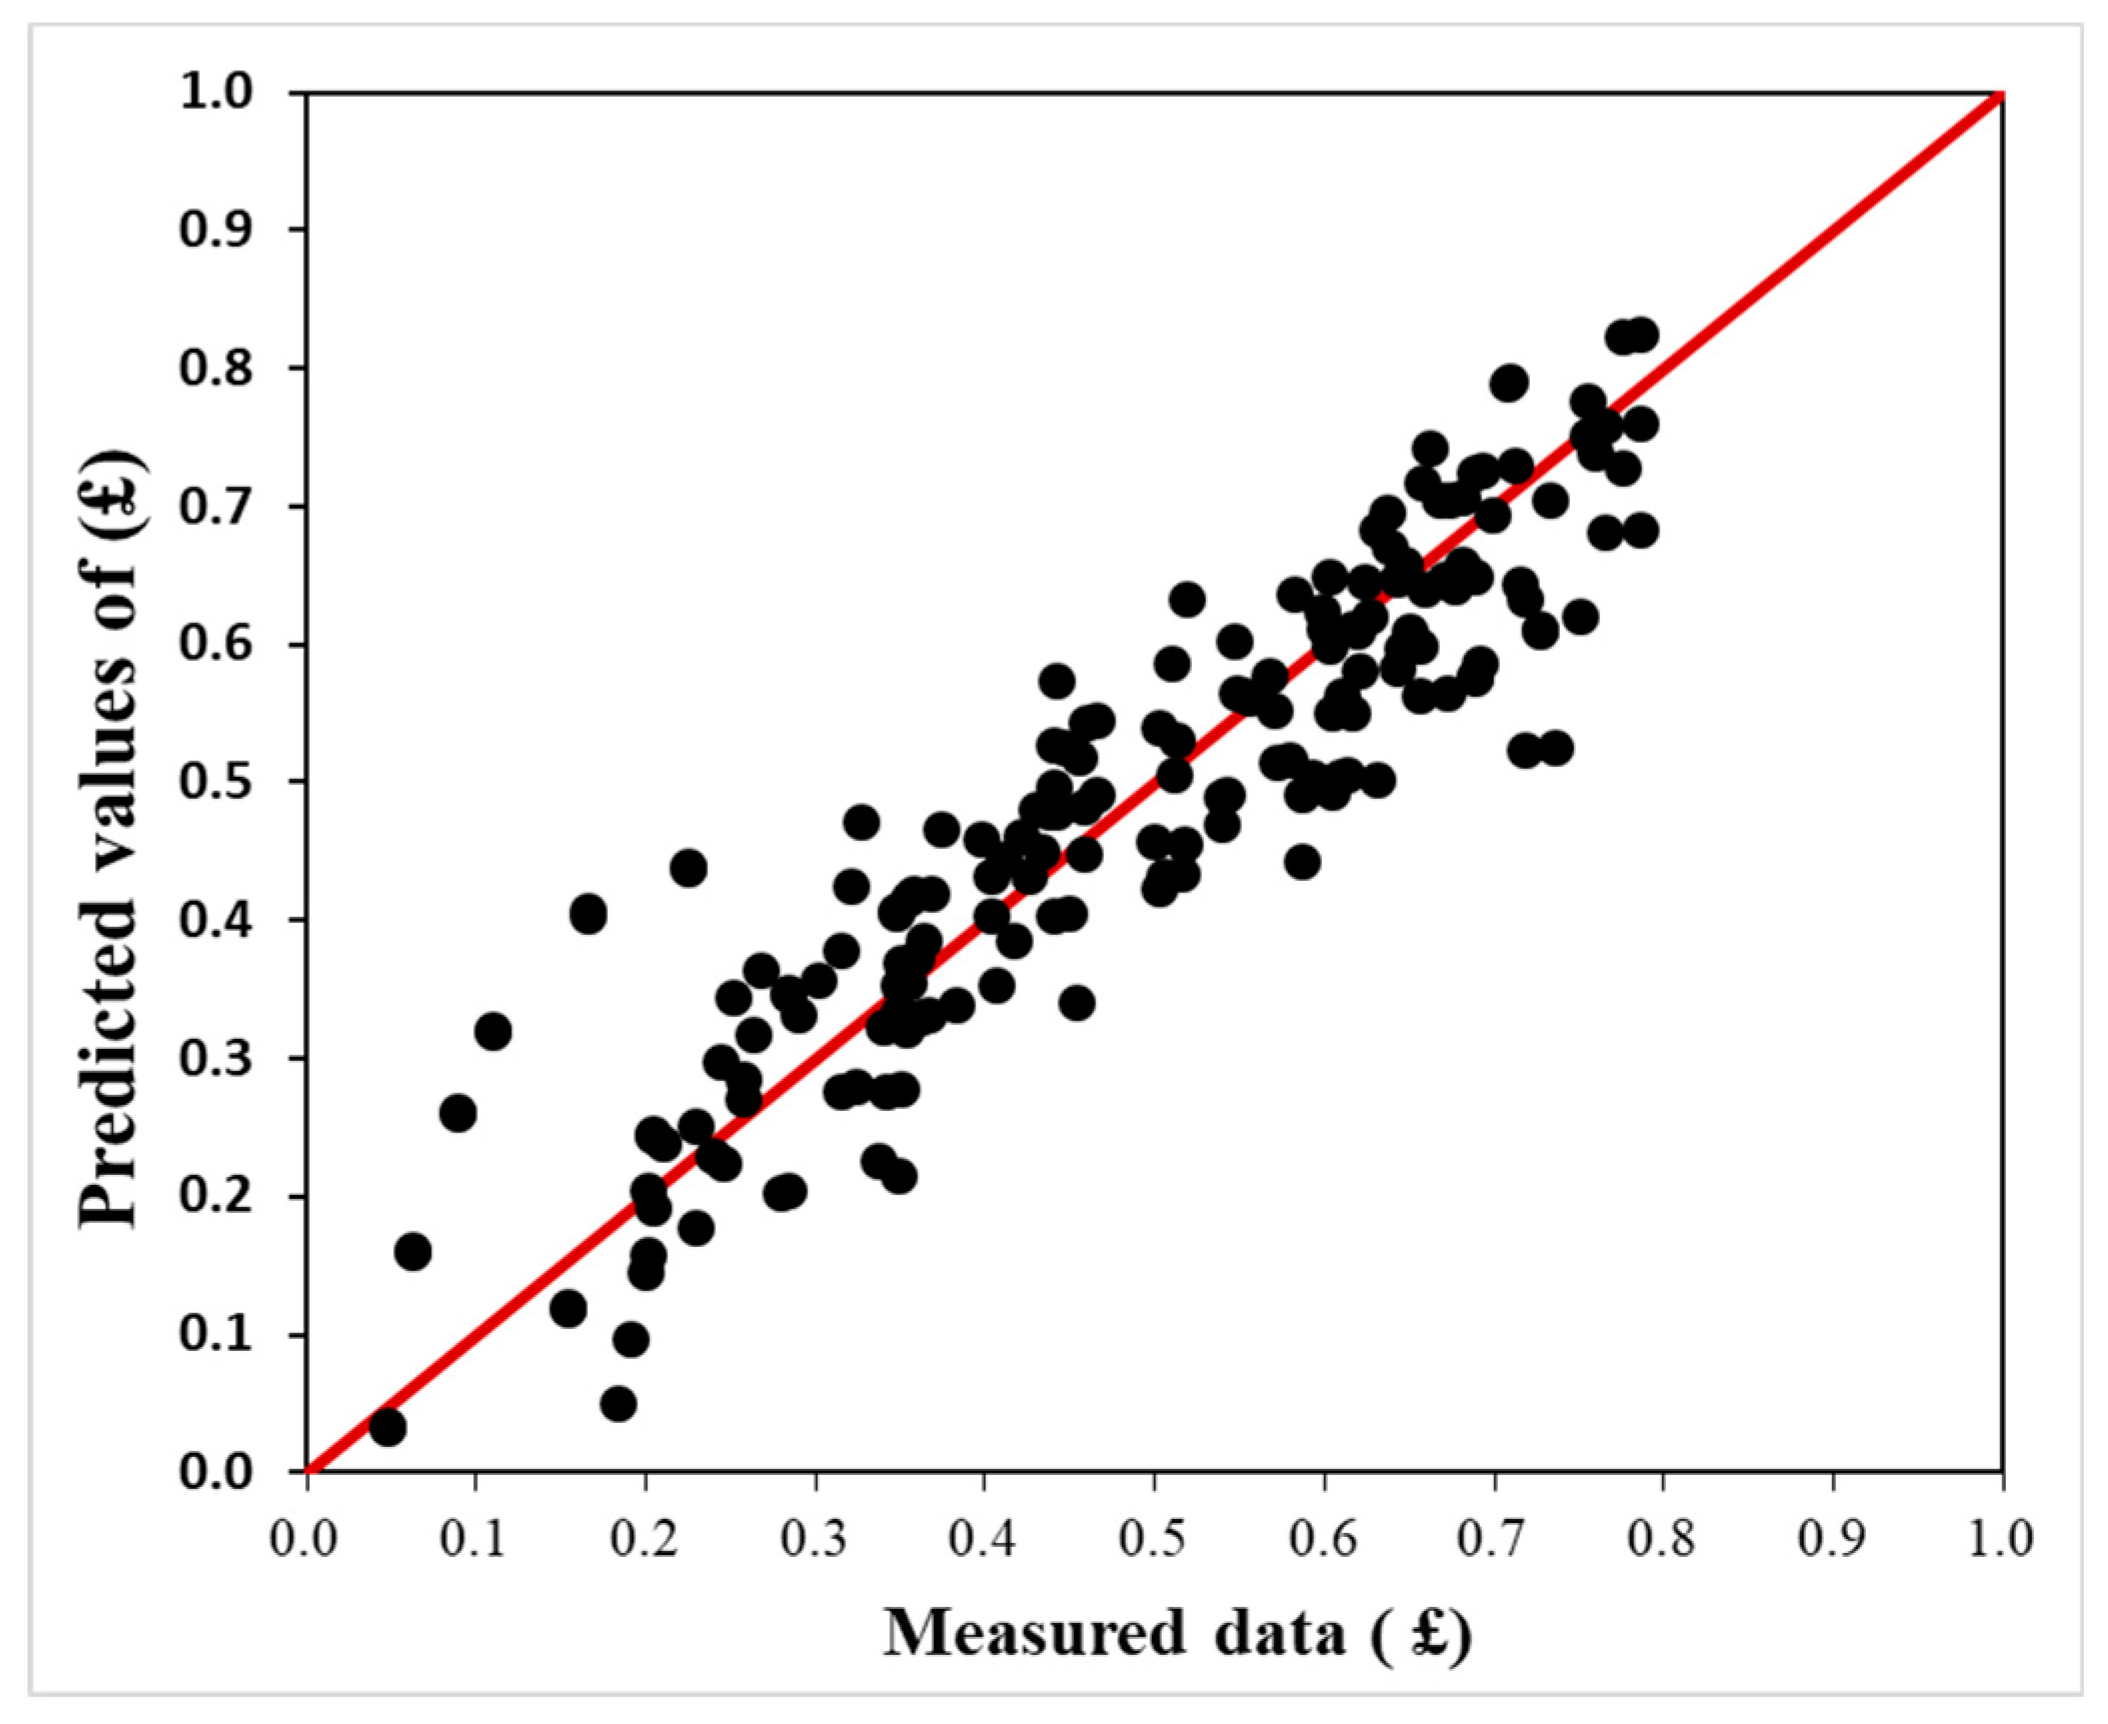
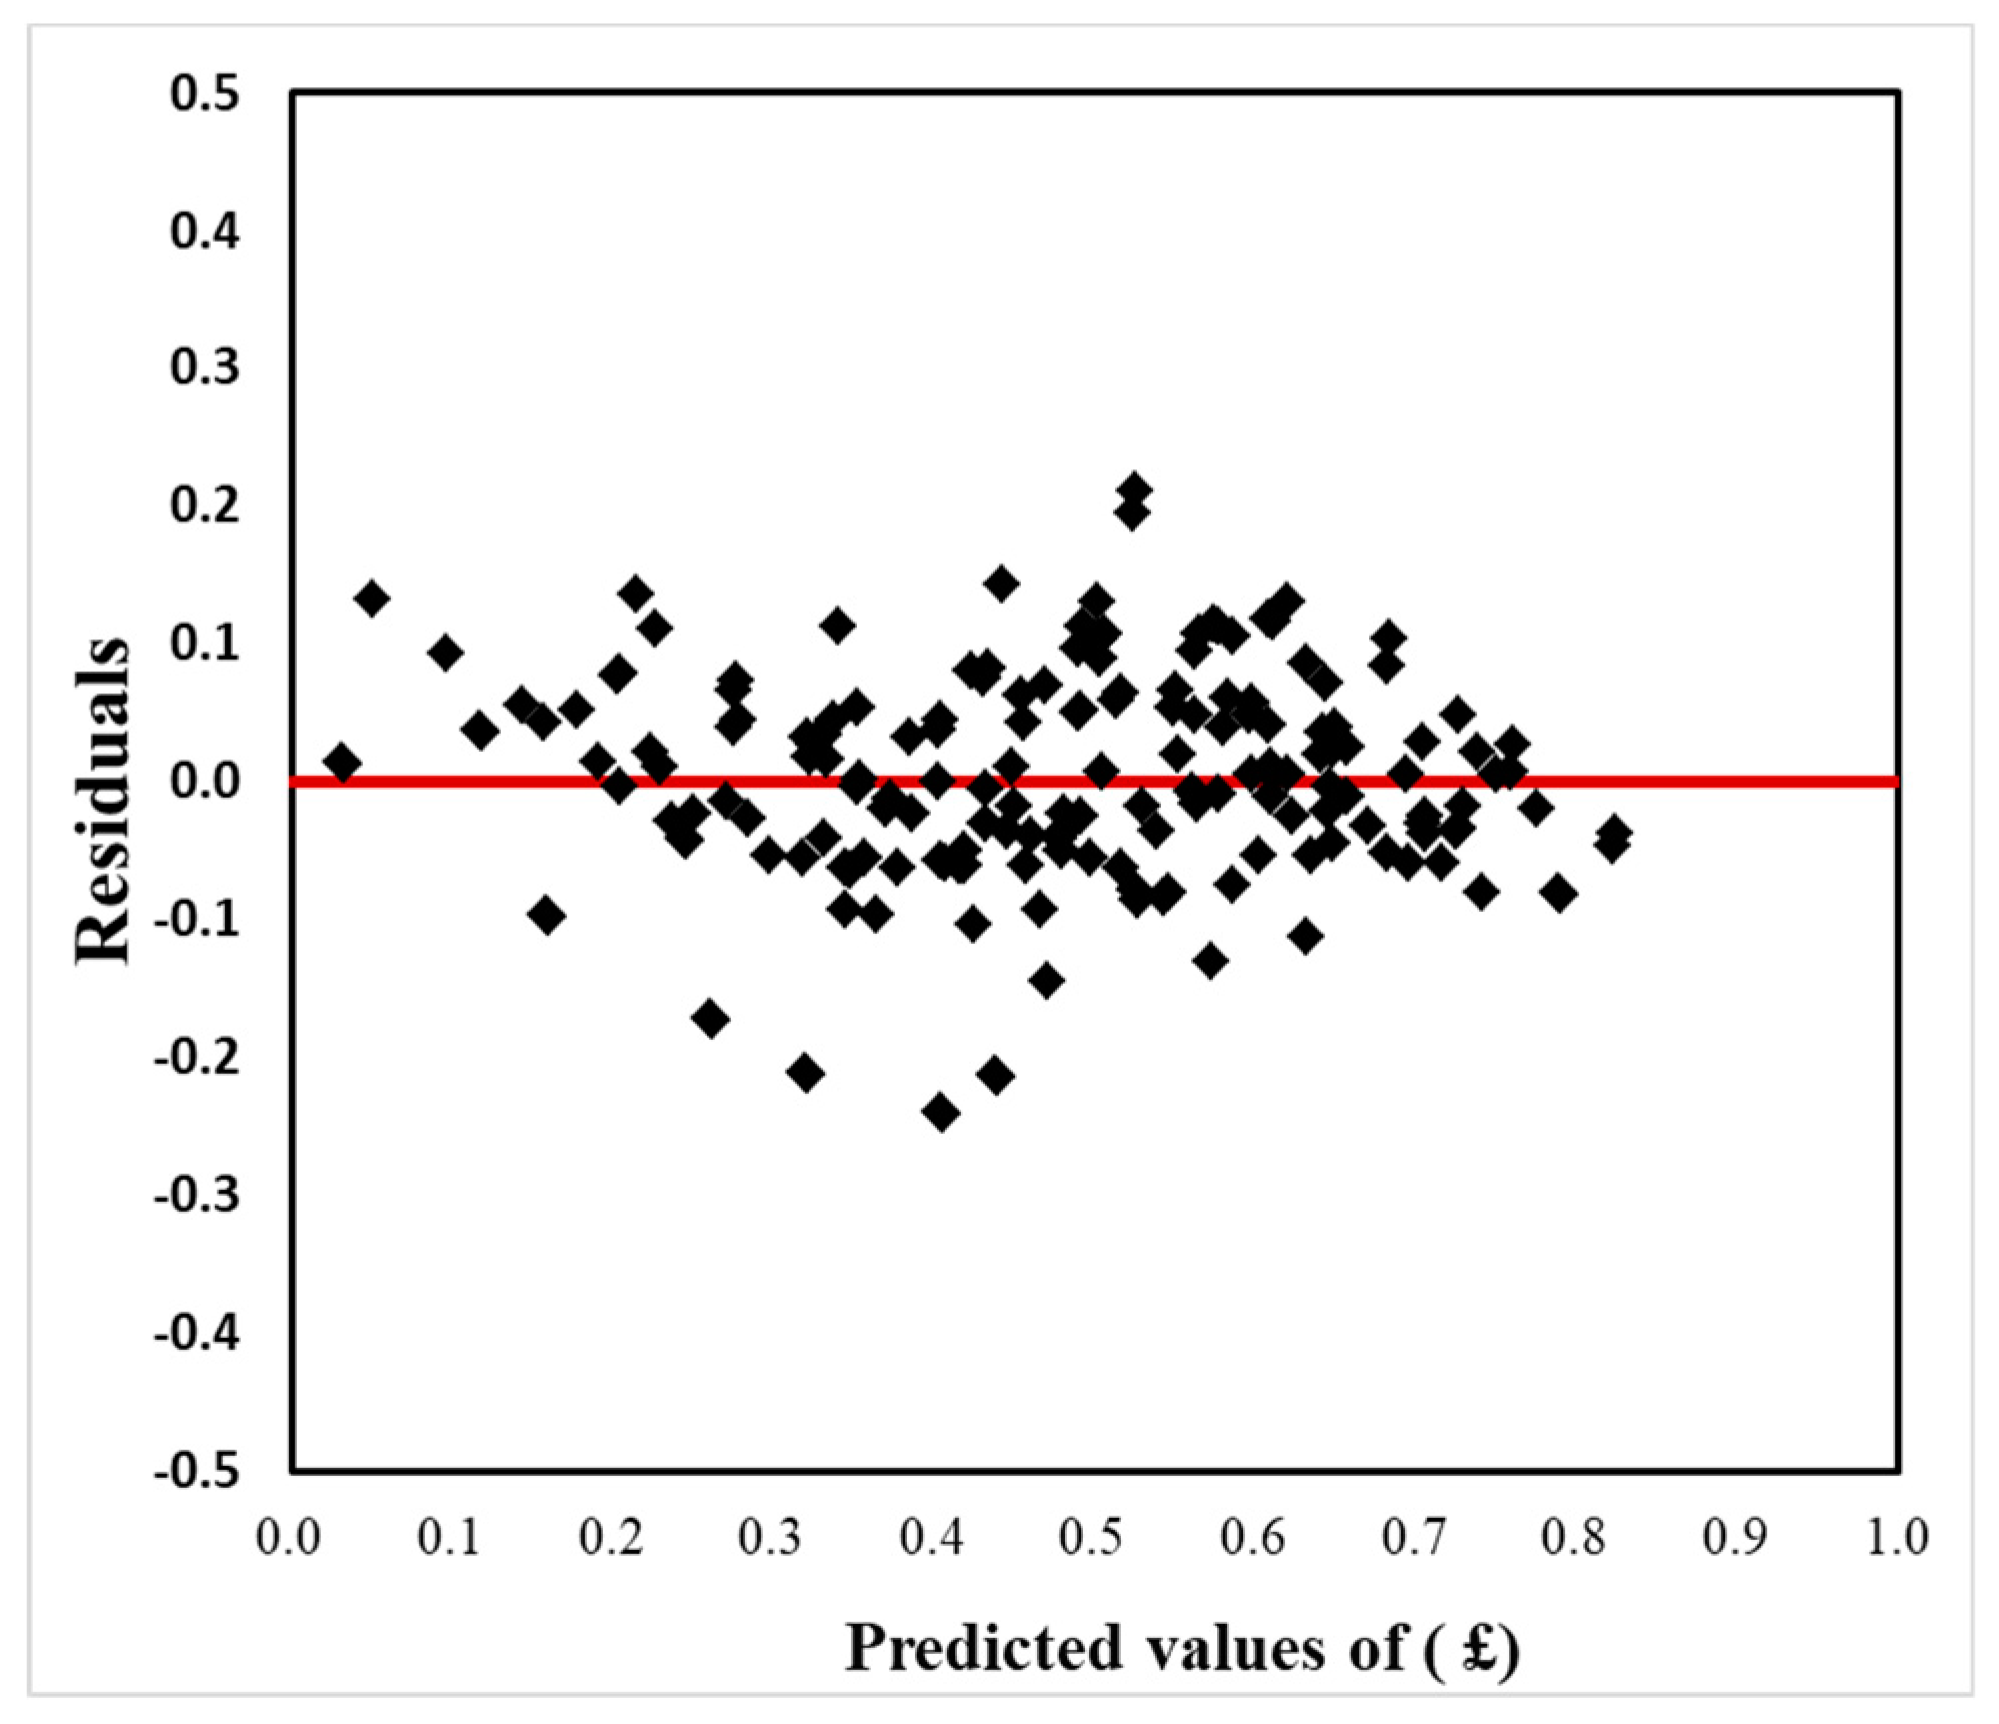
The correlation coefficient and the standard error of estimate for Equation (2) are 90% and 0.07 respectively. Figure 31 shows the relationship between the predicted values of £ using Equation (2) versus the measured ones, while Figure 32 shows the distribution of the residuals around the line of zero error. Both figures indicate that Equation (2) represented the measured data very well and hence could be used safely to predict the discharge efficiency of storm system for system discharge ranging from 1.00 to 6.00 L/sec.

Figure 31.
Measured £ versus Predicted ones from Equation (2).

Figure 32.
Residuals versus Predicted £ from Equation (2).
4. Conclusions
The conclusions, which are valid within the experimental study, could be summarized as follows.
Maintenance of storm network is an important process that should be taken into account every time period, which may be a year, or after the end of rainstorms. The maintenance process depends on two main factors: the first is raising the network’s efficiency, and the second is reducing maintenance costs. It is known that the design of storm networks will be done for the worst rainstorm conditions, but in normal case conditions, there is no need to increase its efficiency; thus, the network will be operating in low efficiency mode to save costs and reduce the number of maintenance intervals. The research provides engineers interested in designing and maintaining a storm network with important information for this purpose by identifying the efficiency of a storm system for most blockage ratios. Finally, an empirical equation was developed to estimate the discharge efficiency of the storm drainage system as a function of relative blockage height (HB), relative blockage pipe length (LB), relative blockage area (AB), and system discharge.
Author Contributions
Conceptualization, I.F.; Data curation, G.M.A.-A. and A.F.; Formal analysis, M.Z.; Investigation, G.M.A.-A.; Methodology, A.F.; Project administration, I.F. and M.Z.; Resources, G.M.A.-A.; Software, M.R.F.; Supervision, M.Z.; Validation, M.R.F.; Visualization, M.R.F.; Writing—original draft, I.F.; Writing—review & editing, A.F. All authors have read and agreed to the published version of the manuscript.
Funding
This research received no external funding.
Acknowledgments
This work was supported by projects of the Ministry of Education of the Slovak Republic VEGA 1/0308/20, Mitigation of hydrological hazards—floods and droughts—by exploring extreme hydroclimatic phenomena in river basins.
Conflicts of Interest
The authors declare no conflicts of interest.
References
- Woo, D.C.; Jones, S.J. Hydraulic Characteristics of Two Bicycle Safe Grate Inlet Designs; Final Technical Report, FHWA-RD-74-77; Federal Highway Administration: Washington, DC, USA, 1974.
- Forbes, C. Capacity of Lateral Storm Water Inlets. Civ. Eng. J. 1976, 18, 195–205. [Google Scholar]
- Hotchkiss, H. Improvements in curb opening and grate inlet efficiency. Recent Res. Hydraul. Hydrol. 1994, 1471, 24–30. [Google Scholar]
- Soares, E. Analysis of the Efficiency of an Alternative South Carolina Storm Water Drainage Structure. Master’s Thesis, Clemson University, Clemson, SC, USA, 1991. [Google Scholar]
- Pezzaniti, D.; Johnson, L.; Argue, J. Road Surface Storm Water Drainage Hydraulics, New Design Information. In Proceedings of the 8th International Conference on Urban Storm Drainage, Sydney, Australia, 30 August–3 September 1999. [Google Scholar]
- Russo, B.; Gómez, M. Hydraulic Efficiency of Continuous Transverse Grates for Paved Areas. J. Irrig. Drain. Eng. 2009, 135, 225–230. [Google Scholar] [CrossRef]
- Patil, A.; Patil, J. Effects of Bad Drainage on Roads. Civ. Environ. Res. 2011, 1, 1–7. [Google Scholar]
- Comport, C.; Thornton, I. Hydraulic efficiency of grate and curb inlets for urban storm drainage. J. Hydraul. Eng. 2012, 138, 878–884. [Google Scholar] [CrossRef]
- Beniamino, R.; Manuel, V.; Jackson, A. Estimate the Hydraulic Efficiency of Non tested Continuous Transverse Grates. J. Irrig. Drain. Eng. 2013, 139, 864–871. [Google Scholar]
- Sezenöz, B.; Canan, Ö.; Ahmet, Y.; Şahnaz, T. Numerical Modelling of Continuous Transverse Grates for Hydraulic Efficiency. Master’s Thesis, Engineering Department, Middle East Technical University, Ankara, Turkey, 2014. [Google Scholar]
- Cumhur, Ö.; Gülbin, Ü.; Ahmet, Y.; Ġahnaz, T. Laboratory Investigation of Hydraulic Efficiency of Transverse Grates in Roads. Master’s Thesis, Engineering Department, Middle East Technical University, Ankara, Turkey, 2015. [Google Scholar]
- Manuel, G.; Joan, R.; Beniamino, R.; Eduardo, M. Assessment of inlet efficiency through a 3D simulation: Numerical and experimental comparison. Water Sci. Technol. 2016, 74, 1926–1935. [Google Scholar]
- Veerappan, R.; Le, J. Hydraulic efficiency of road drainage inlets for storm drainage system under clogging effect. In Proceedings of the 5th International Conference on Flood Risk Management and Response, San Servolo, Venice, Italy, 29 June–1 July 2016; Volume 165. [Google Scholar] [CrossRef] [Green Version]
- Zheng, F.; Li, Y.; Zhao, J.; An, J. Energy Dissipation in Circular Drop Manholes under Different Outflow Conditions. Water J. 2017, 9, 752. [Google Scholar] [CrossRef] [Green Version]
- Čarnogurská, M.; Příhoda, M.; Zeleňáková, M.; Lázár, M.; Brestovič, T. Modelling the Profit from Hydropower Plant Energy Generation Using Dimensional Analysis. Pol. J. Environ. Stud. 2016, 25, 73–81. [Google Scholar] [CrossRef]
- Zeleňáková, M.; Čarnogurská, M. A dimensional analysis-based model for the prediction of nitrogen concentrations in Laborec River, Slovakia. Water Environ. J. 2012, 9, 1–8. [Google Scholar] [CrossRef]
- Zeleňáková, M.; Čarnogurská, M.; Slezingr, M.; Słys, D.; Purcz, P. Model based on dimensional analysis for prediction of nitrogen and phosphorus concentrations at the river station Ižkovce, Slovakia. Hydrol. Earth Syst. Sci. 2013, 17, 201–209. [Google Scholar] [CrossRef] [Green Version]
- Tu, M.; Traver, R. Clogging Impacts on Distribution Pipe Delivery of Street Runoff to an Infiltration Bed. Water 2018, 10, 1045. [Google Scholar] [CrossRef] [Green Version]
- Vani, V.; Mohana, M.; Vanishree, D.; Subiksha, K.; Sushanthika, M. Smart Drainage System using Zig Bee and IoT. Int. J. Recent Technol. Eng (IJRTE) 2019, 8. [Google Scholar]
- Hesarkazzazi, S.; Hajibabaei, M.; Reyes-Silva, J.; Krebs, P.; Sitzenfrei, R. Assessing Redundancy in Stormwater Structures Under Hydraulic Design. Water 2020, 12, 1003. [Google Scholar] [CrossRef] [Green Version]
- Buckingham, E. On physically similar systems; illustrations of the use of dimensional equations. Phys. Rev. 1914, 4, 345–376. [Google Scholar] [CrossRef]

© 2020 by the authors. Licensee MDPI, Basel, Switzerland. This article is an open access article distributed under the terms and conditions of the Creative Commons Attribution (CC BY) license (http://creativecommons.org/licenses/by/4.0/).