Article

Assessment of Building Vulnerability with Varying Distances from Outlet Considering Impact Force of Debris Flow and Building Resistance

Forest Engineering Research Institute, National Forestry Cooperative Federation, 1800 Dongseo-Daero Daedeok-Gu, Daejeon 34417, Korea
*
Author to whom correspondence should be addressed.
Water 2020, 12(7), 2021; https://doi.org/10.3390/w12072021
Submission received: 7 June 2020 / Revised: 12 July 2020 / Accepted: 13 July 2020 / Published: 16 July 2020
(This article belongs to the Section Hydrology)

Abstract

:
Studies have been conducted to understand the physical characteristics of debris flows and quantitatively assess the vulnerability of the buildings nearby to mitigate damage from debris flow disasters. However, there remains a paucity of research on vulnerability assessments that discuss the impact force of debris flow and building resistance within certain sections, where debris flows spread from an outlet. In this regard, the study assesses the vulnerability of buildings to debris flows while considering the distance from an outlet. For this purpose, it selects the two sites of Chuncheon-shi in Gangwon-do and Cheongju-shi in Chungcheongbuk-do in South Korea, which are widely known for having experienced debris flow damage in 2011 and 2017, respectively. For the sites, the study conducts an inverse analysis through debris flow simulation to understand the physical characteristics of debris flows, including flow depth, flow velocity, and impact force. Then, the study assesses vulnerability by estimating the resistance of the materials of the buildings placed in the range where debris flows spread, which allows the calculation of a vulnerability index that a building material may have and the estimation of a safety distance from the outlet for each material of the buildings in the study sites. The result shows that with an increasing distance from the outlet, the flow depth, velocity, and impact force, which represent debris flow properties, tend to decrease. This again results in vulnerability being gradually reduced. The study also suggests that buildings are exposed to the risk of debris flow disasters at a sections 40 to 60 m from an outlet for wood material construction, 70 to 110 m for brick-masonry material construction, and all sections from an outlet for prefabricated material construction. Based on this result, the vulnerability index is estimated for the wood material (0.85), brick-masonry material (0.58), and prefabricated material (0.003).

1. Introduction

The global temperature anomaly causes large-scale natural disasters around the world, such as heatwaves, earthquakes, and superstorms, which have not been frequently reported in the past [1,2,3,4], with increasing damage to people and property. In South Korea, which has 70% of its territory covered by mountains, slopes with considerable gradients have been formed around living areas as urbanization is accelerated in the surroundings of mountains. Such areas with steep slopes are characterized by the frequent occurrence of mountainous disasters, including landslides and debris flows, particularly during the summer season when rainfall is intensified [5,6,7]. In particular, the collapsed masses from landslides on mountains and steep slopes move downward through valleys and catchments to spread and cause damages [8,9,10,11,12,13,14,15].
During the period from 25 to 28 July 2011, the total precipitation was 587 mm, which corresponds to 40% of the average annual precipitation of Seoul, the capital of South Korea. Following heavy rainfall, several landslides and debris flow occurred mainly around the Umyeon-san Mountain in Seocho-gu, Seoul, causing substantial losses of both property and life, including 15 deaths and 2 missing persons [16]. During the same period, in Sinbuk-eup, Chuncheon-shi, Gangwon-do, there were two major episodes of landslides and debris flow considered as a mountainous disaster, after which the number of people confirmed dead was at 13 and the number of injured people was 26. In addition, on 16 July 2017, in the Cheongju-shi area in the Chungcheonbuk-do Province, 259 mm of 6 h rainfall was recorded with 79.5 mm/h of maximum hourly rainfall. Such heavy rain in a short time, which exceeded 76.6 mm/h—the probable rainfall intensity of a 50-year return period—caused landslides and debris flows in Nangseong-myeon that led to death and property losses with buildings destroyed in the area.
This is a typical example of a debris flow disaster where collapsed soils and sediments of landslides on slopes in a mountain flow (spread) into lower areas, causing increasing damage to people and property [17]. These cases of mountain disasters highlight the importance of assessing building vulnerability to respond to debris flow hazards and establishing measures to prevent them.
Buildings in residential areas near mountains are usually structures with wood, brick masonry, and prefabricated panel materials that show relatively high vulnerability to debris flow disasters. In this regard, mitigating damage from debris flows requires an analysis of the physical characteristics as well as a quantitative assessment on whether the buildings are under the impact of such a hazard. In particular, a proper assessment of building vulnerability will lead to more effective risk assessment, emergency management and mitigation measures, and preparedness [18,19,20,21,22,23,24,25,26,27,28].
The level to which a building is damaged or destroyed presents quantitative vulnerability in the assessment. The physical vulnerability of a building indicates an expected damage level with a quantified scale between 0 and 1 [29]. Therefore, the physical vulnerability of a building is assessed based on the interrelation between physical characteristics of debris flows and the elements that are exposed to the risk they pose, and such an interaction can be shown with a vulnerability curve [23]. Compared to South Korea, other countries see more assessment studies having been conducted on building vulnerability based on the physical characteristics of debris flows [19,20,21,22,23,24,25,26,27,28,29,30,31,32,33,34,35,36,37,38,39,40].
Barbolini et al. [31] assessed the vulnerability for the episodes of avalanches in the Austrian Alps in 1988 and 1999, using impact force and flow depth. For the assessment, they classified the targets into three groups: buildings, people inside the buildings, and people outside the buildings. In particular, Quan Luna et al. [30] suggested three vulnerability curves as the function of debris flow depth, impact pressure, and kinematic viscosity, based on a numerical analysis of debris flows. This study provided the basis for the quantitative assessment of building damage costs incurring because of debris flows with their classification into maximum, minimum, and average groups. Kang and Kim [33] selected 11 areas damaged by debris flows in South Korea to understand the relation between the results of numerical analysis and buildings. They present two vulnerability curves after grouping them into ferroconcrete structures and other structures, including wood and masonry. They contributed to the understanding of the debris flow impact force, suggesting that even a level of giving negligible damage to the ferroconcrete structures may lead to the destruction of the buildings constructed with masonry and wood materials.
Ciurean et al. [34] conducted a vulnerability analysis for the Eastern Italian Alps area to explain the extent of economic loss from debris flows. The vulnerability analysis used an empirical model and a parametric model, which is based on the attribute data obtained from a field study. Based on the result, they calculated the economic losses and verified their accuracy. Zhang et al. [35] conducted the FLO-2D simulation for the large-scale debris flow disaster that occurred on 7 August 2010, in the Zhauqu area of the Gansu Province. The numerical analysis and field study results were used to develop new vulnerability curves. The suggested vulnerability curves were then compared with other vulnerability curves that past studies presented with different classifications, including flow depth, flow velocity, impact pressure, reinforced concrete, and masonry concrete.
As such, diverse studies have been conducted to suggest vulnerability curves through analyses on physical characteristics of debris flows and their impact on the vulnerability of buildings or to assess the extent of economic losses. However, the discussion needs to be also made for an outlet as a reference point for a mountain boundary where debris flows initiate and spread, moving downward to the lower parts. In this regard, more studies are needed to assess the vulnerability for each construction material type with consideration of the impact force of debris flows and the location of buildings by distance.
Therefore, the study conducts a debris flow simulation for two sites in South Korea that have experienced damage from debris flows. In addition, using the formula proposed by Kim et al. [41] for the estimation of a debris flow’s impact force, it calculates the impact force by the distance of buildings from an outlet. The study also estimates the representative resistance for each material of buildings in the study area where actual damage occurred from debris flows. Then, it analyzes the vulnerability relation with the impact force and building resistance, based on the vulnerability equation developed by Quan Luna et al. [30] and Kang and Kim [33]. Finally, it proposes a method to calculate a safety distance from an outlet in the mountainous watershed to mitigate damage to buildings.

2. Study Area

The study selected the Majeok-san Mountain area in Chuncheon-shi, Gangwon-do (Site A), and the Nangseong-myeon area in Cheong-ju, Chungcheongbuk-do (Site B) for the analysis (Figure 1). In 2011 and 2017, the two areas experienced landslides and debris flows with localized heavy rainfall that caused considerable damage to people and property (Figure 1).
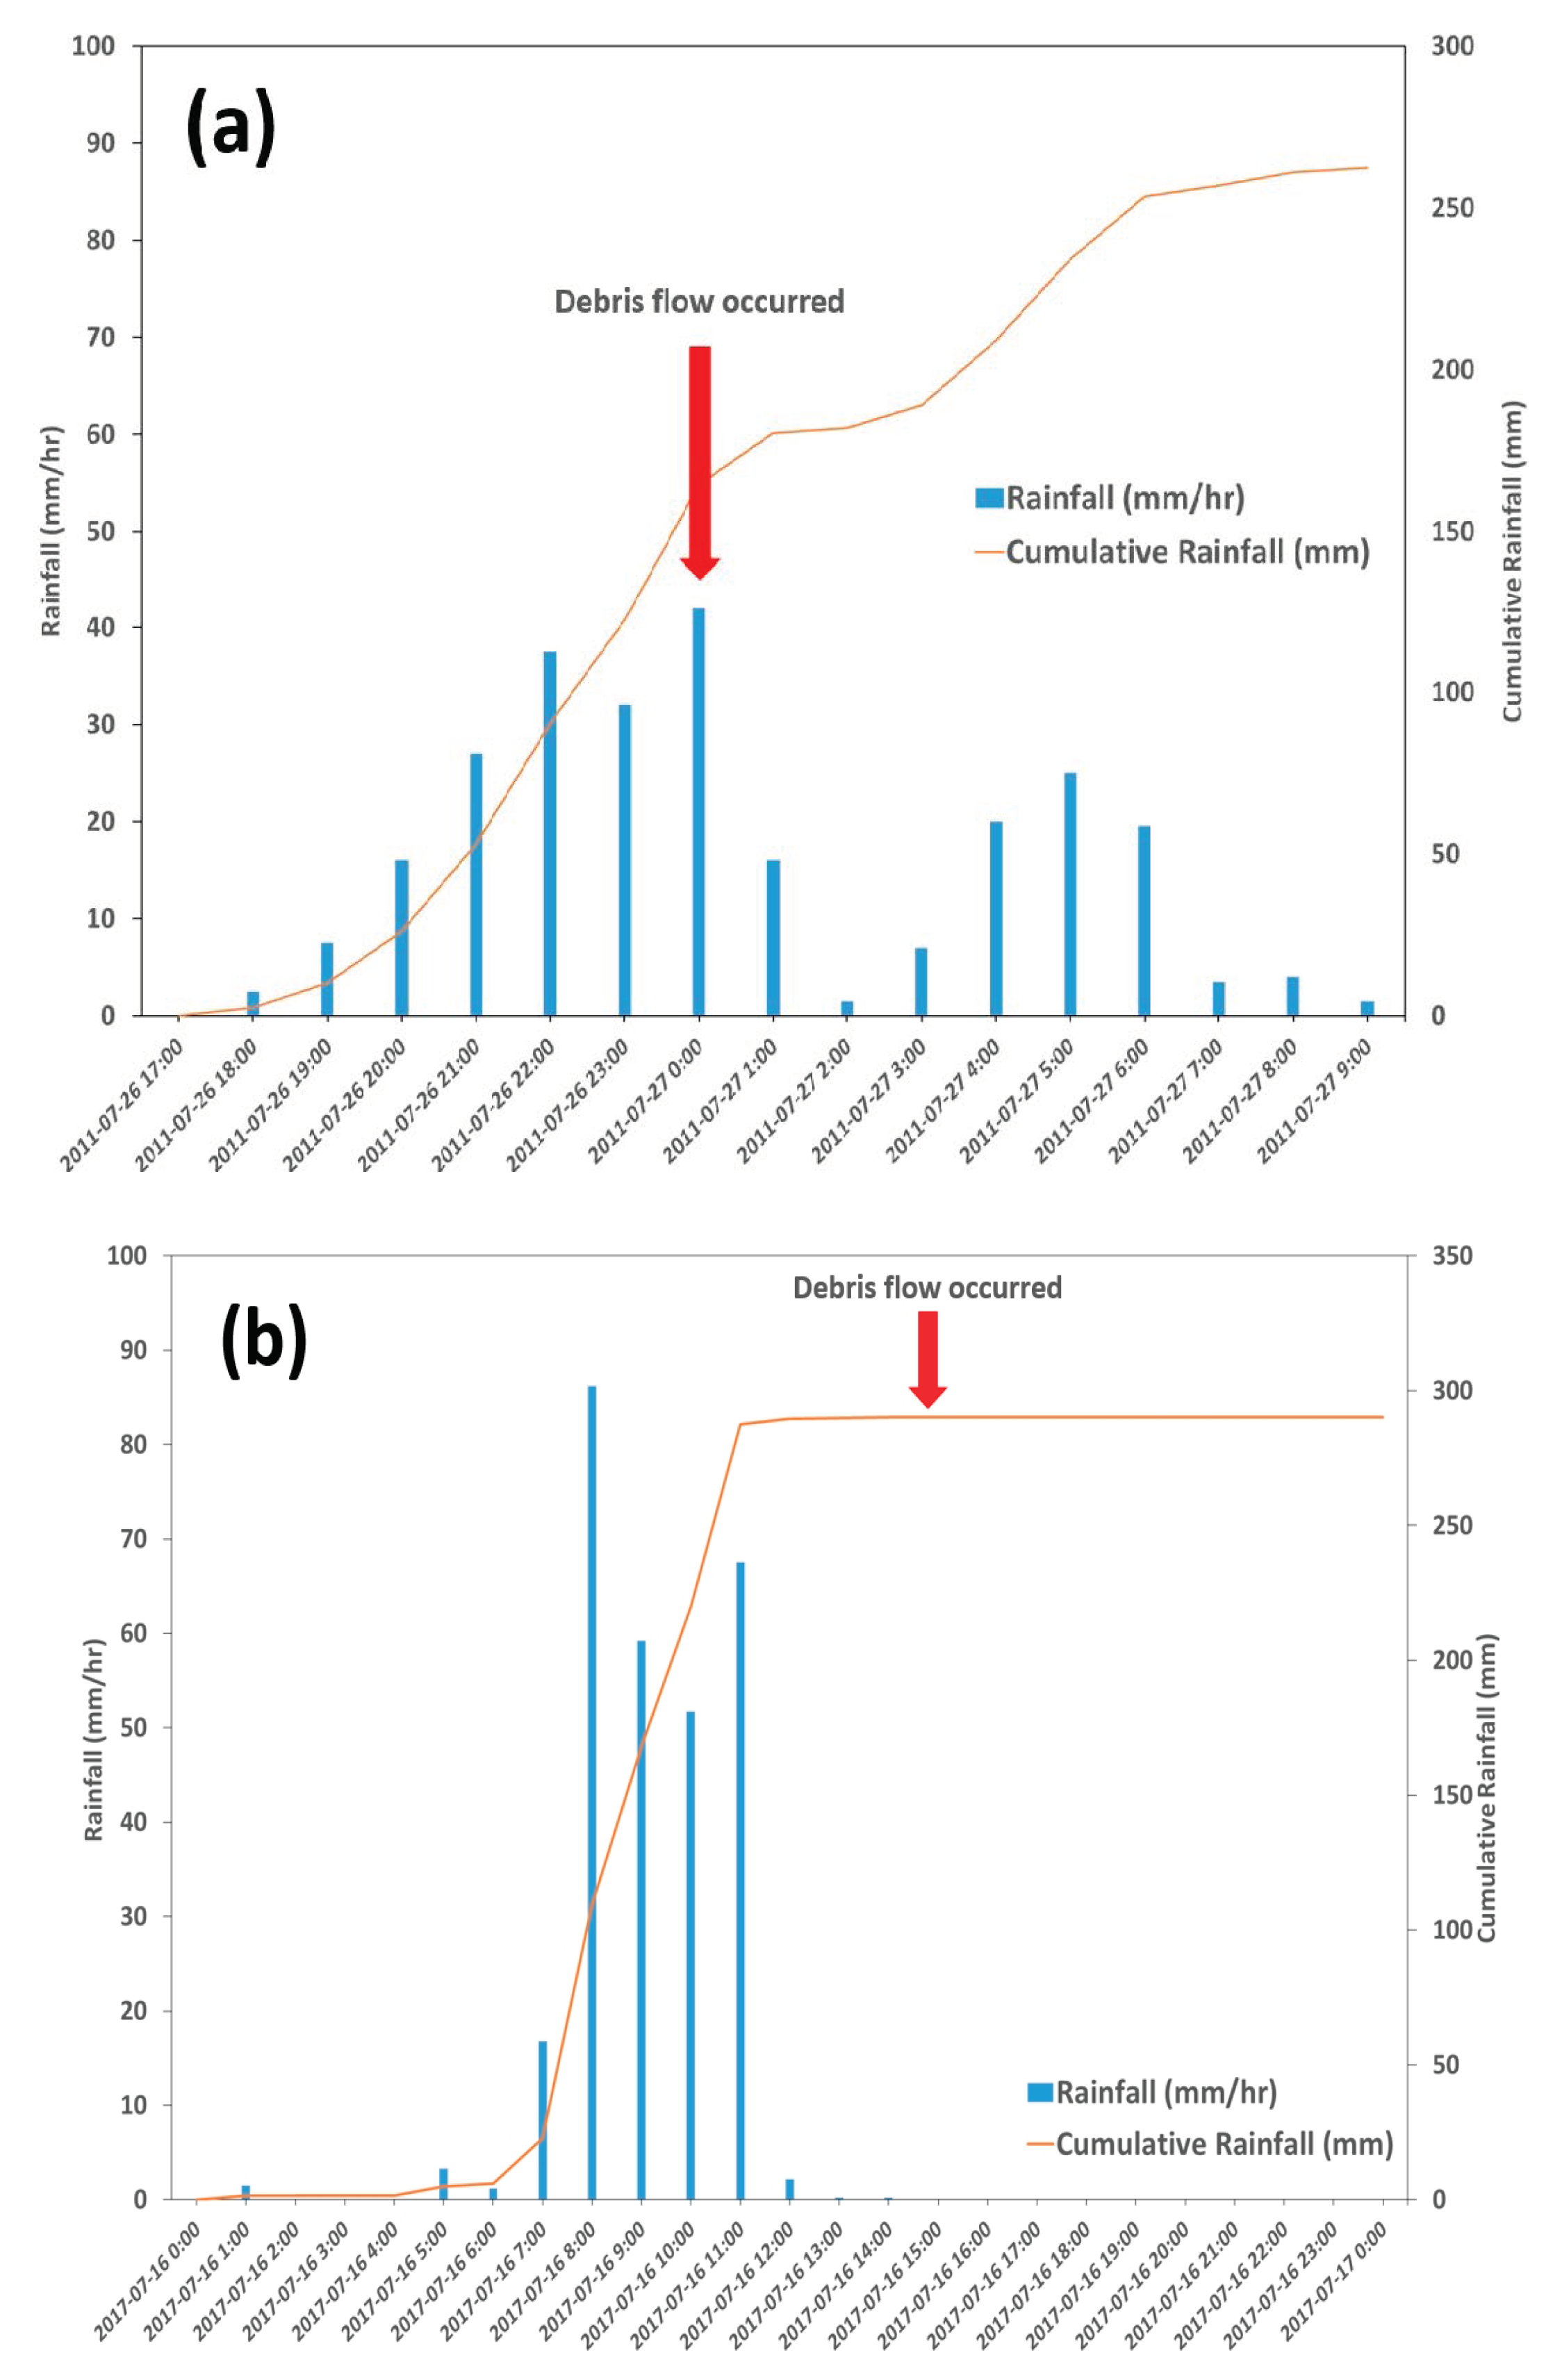
In the case of Chuncheon-shi in 2011, 555.5 mm of accumulated rainfall and 65 mm of maximum hourly rainfall were reported for the period from 26 to 29 July, bringing about landslides and debris flows (Figure 2a). The debris flows triggered by such localized heavy rainfall caused injuries to 39 people and damage to 19 buildings in 3 watershed areas of Chuncheon-shi. Out of them, two areas in the surrounding of the Majeok-san Mountain had the debris flows occurring at altitudes around 125 m to 215 m. The area of landslides and debris flows had geological features of granite with gneisses mixed in parts and the colluvium, and soil layers are distributed relatively deep in depth. The slopes on which the landslide occurred were steep with approximately 35° of the gradient, and they were followed by debris flows that resulted in the collapse of a pension located in the lower part of the mountain and damage to people, including 13 deaths and 26 injuries (Figure 1).
In Cheongju-shi, Chungcheongbuk-do, localized heavy rain occurred with 309 mm of accumulated rainfall, and 79.5 mm/h of maximum hourly rainfall was recorded for three days up until 16 July 2017, when the debris flows initiated from 14 July 2017 (Figure 2b). The landslide and debris flow disaster induced by the localized heavy rains caused one death in Nangseong-myeon, Cheongju-shi (Figure 1). The slopes where landslides occurred were steep with an approximate 31° gradient and had the topographical characteristics of the catchment to which the groundwater was gathered. The collapsed masses in landslides moved down the slope to the lower part and evolved and transformed into debris flows. The damaged area had geological characteristics of metamorphic rocks with low-degenerated or thermally denatured psammite being predominant, while pelite being present in some parts. In particular, it was found that the soil layers in mountain streams where debris flows occurred had a weak shear strength as they had a high share of clayey soils and rock fragments.

3. Methodology

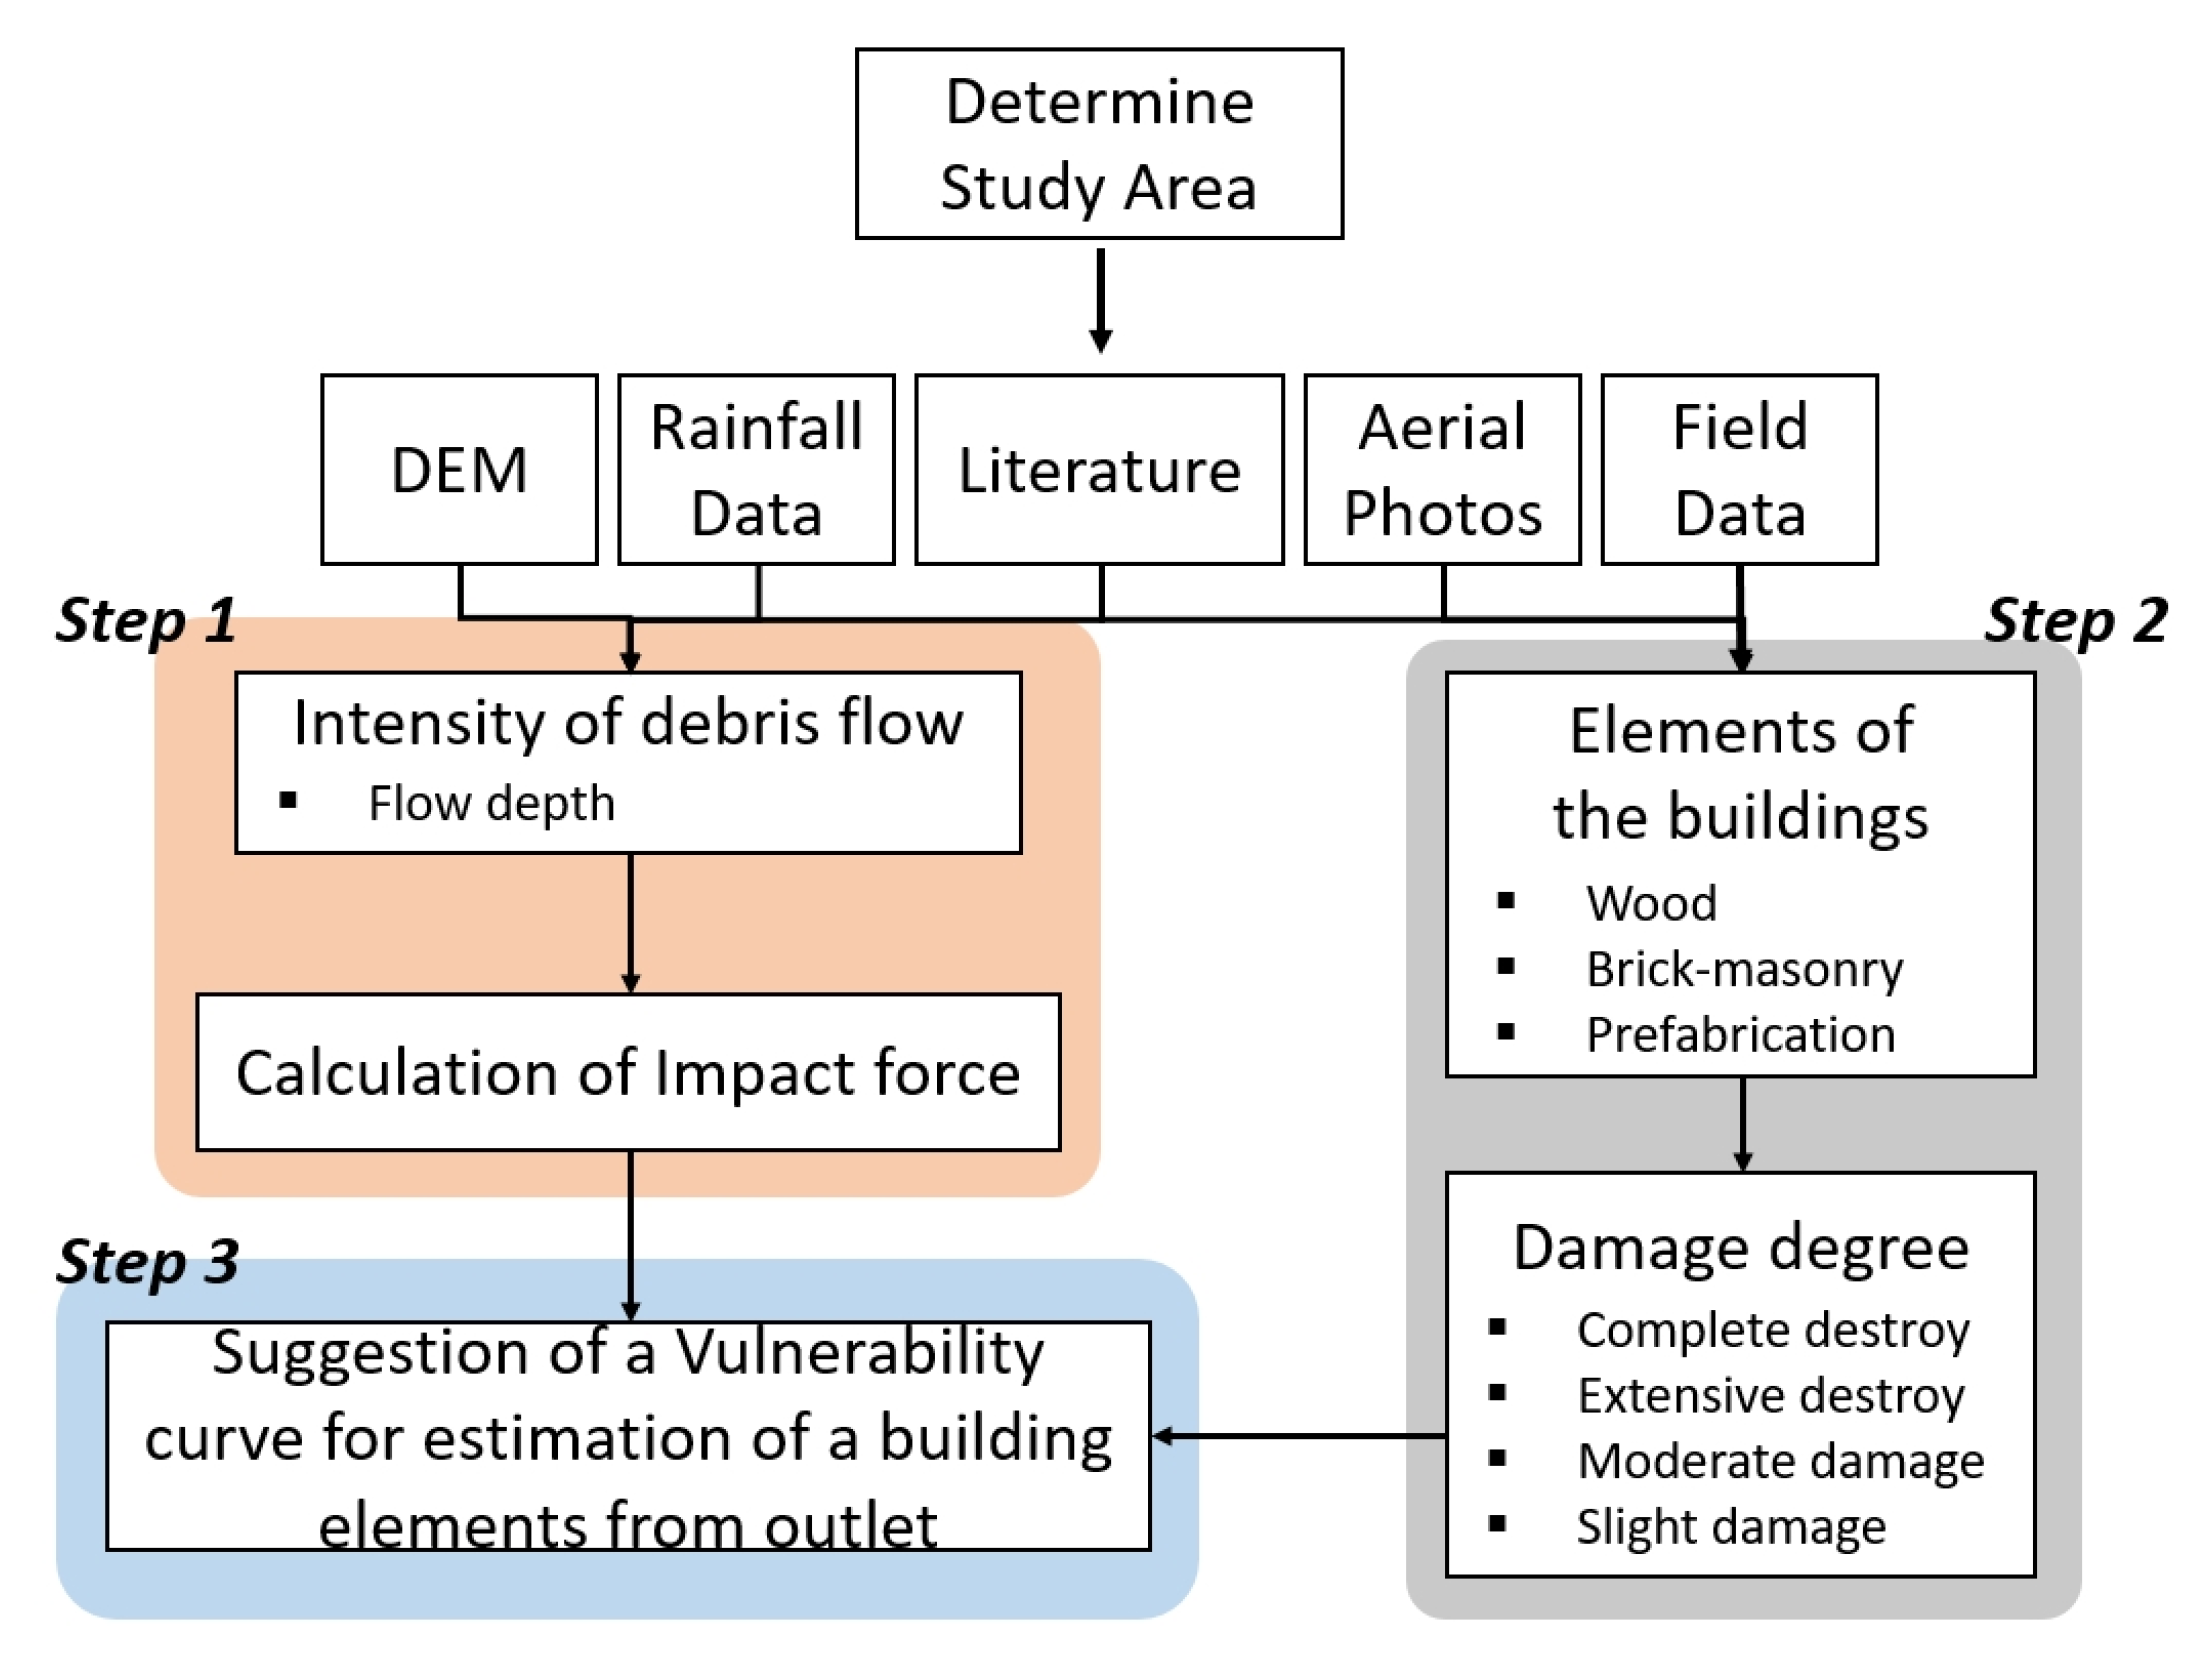
We proceeded with a total of three steps, as shown in Figure 3, to analyze the characteristics of debris flows by distance from an outlet and to estimate a vulnerability index that reflects the level of damage to each of the building materials. The first step was to understand the status of the damaged area, based on the field study and satellite map. Then, the result was used to simulate characteristics of debris flows for each site with FLO-2D, which is a program for the numerical analysis of debris flows. The simulated flow characteristics generated by FLO-2D were applied to the formula that Kim et al. [41] proposed for estimating an impact force that a debris flow has in order to calculate the force given to a building by distance from an outlet. This was followed by the second step of calculating the resistance for each of the building materials, which are wood, brick masonry, and prefabricated, as found in the Korean Building Code. These building materials are those used in the buildings damaged by debris flows in the study area. Their resistance was also estimated for our review in connection with the impact force. Finally, for the third step, we used the vulnerability equation proposed by Quan Luna et al. [30] and Kang and Kim [33] to draw vulnerability curves for the impact force by the distance from the outlet and to analyze its relation with the resistance of the building.

3.1. Assessment of Physical Characteristics of Debris Flows Using FLO-2D

Among the different models used for the numerical analysis of debris flows, FLO-2D is the one that is widely used across the world for diverse verification purposes and studies [30,42,43,44,45]. The FLO-2D numerical model is defined with eight directional flows on a two-dimensional surface, and the governing equation is composed of the continuity equation and momentum equation for each of the directions. The modeling for debris flow consists of five shear stress factors as follows.
τ = τ c + τ mc + τ v + τ t + τ d
where τ is the total shear stress, τ c is the shear stress by adhesive power, τ mc is the Mohr-Coulomb shear resistance, τ v is the viscous shear stress, τ t is the turbulence shear stress, and τ d is the distributed shear stress. This can be represented as follows after conversion to the second rheological model.
τ = τ y + η ( dv dy ) + C i ( dv dy ) 2
where τ y is the yield stress, η is the viscosity coefficient, and C i is the inertial shear stress coefficient. The integral calculus of Equation (2) for the depth of debris flow is as follows.
S f = S y + S v + S td = τ y γ m h + K η u 8 γ m h + n 2 u 2 h 4 / 3
where S y   is the yield slope, S v is the viscosity slope, S td is the turbulence-distributed slope, τ y   is the yield stress, γ m   is the ratio of mixture, K is the resistance parameter, n is the Manning coefficient, h is the water depth, u is the flow velocity, and η is the viscosity. Out of them, the yield stress ( τ y ) and viscosity ( η ) can be represented as follows according to the volumetric concentration (Cv).
τ y = α 2 e β 2 C V
η = α 1 e β 1 C V
where α 1 ,   α 2 ,   β 1 ,   and   β 2 are the experience coefficient determined after the experiment and suggested in the FLO-2D user manual [45].
The study, based on the field photos and aerial photos of the sites where debris flows occurred, referred to the literature for attribute values to conduct the FLO-2D simulation. As for topographical data, the study used the digital map with a scale of 1:5000 provided by the Korean National Geographic Information Institute to produce the digital elevation model (DEM) with a grid size of 1 × 1 m for its application. The digital map the study used is the one that was produced before the debris flow occurrence.
The peak discharge for the simulation of debris flows was obtained using a rational formula for the estimation of discharge, as presented in Equation (6), which is widely used as a method for the design of water flow discharges because of its simplicity [46] and to determine the design of water flow discharges in a mountainous gully or debris flow gully [47,48,49].
Q = (C × I × A)/360
where Q is the peak discharge (m3/s), C is the runoff coefficient, A is the catchment area (m2), and I is the maximum rainfall intensity (MM/h). The rainfall intensity, I, was applied based on the rainfall graphs shown in Figure 2. The value of the runoff coefficient C was selected as 0.4 with the River Design Criteria provided by the Korean Ministry of Land, Infrastructure, and Transport (MOLIT) [50] taken into account. As for the attribute data to run FLO-2D, the values suggested in the FLO-2D user manual were used with referring to aerial videos, drone videos, and field photos. Furthermore, the debris flow simulation was adjusted by interpreting the trial and error method. The finally adopted attribute data are shown in Table 1, which include 0.15 for the manning coefficient, 0.8 for the limiting Froude number, and 0.56 for the concentration.

3.2. Calculation of Impact Force of Debris Flow

The impact force of debris flow is determined by the two forces: static force and dynamic force. Therefore, the impact force can vary with the peak discharge, velocity, volume, ratio between soil and water, and particle composition of debris flow [51]. The study used the formula proposed by Kim et al. [41] for estimating the impact force of debris flow. Out of the two forces, the suggested formula is based on the dynamic force and applies the Manning equation to reinterpret the density and velocity of debris flow as follows.
P   =   [ k { δ C v + ( 1 C v ) p w } ( 1 n R 2 3 I 1 2 ) 2 ] α sin β ,   ( 0.3     α     0.4 )  
where k indicates the experience coefficient, δ is soil density (kg/m3), C v is soil concentration, p w   is water density (kg/m3), n is the roughness coefficient, R is the wetted perimeter, I is the hydraulic gradient, sinβ is the direction angle of the building to the flowing direction of debris flow (°), and α is the correction index.
Past studies suggested that the densities of debris flows fall in the range from 2000 to 2200 kg/m3 [52,53]. For this study, 2000 kg/m3 of the debris flow density and 1200 kg/m3 of the water density were applied. As for the hydraulic gradient (I), the study applied a gradient by distance for each of the spots from an outlet. The wetted perimeter (R) was estimated based on the FLO-2D simulation result and field photos. For the concentration of debris flow, the study used the same value provided by the FLO-2D simulation, 0.56. As for the correction index, 0.4 was applied. The ArcGIS analysis result was used to apply the direction angle of the building to the movement direction of debris flow.

3.3. Calculation of Resistance by Construction Material

Analyzing the level of damage to a building from debris flows requires consideration of their impact force and the resistance of the materials composing the building. Hu et al. [53] suggested classification of the damages to reinforced concrete and brick masonry buildings into four levels: complete, heavy, moderate, and slight. Kang and Kim [33] determined the damage levels, based on field photos, aviation photos, and on-site study for the area where debris flows occurred.
The study took the method of Kang and Kim [33] and determined the damage levels of buildings that were affected by debris flows, based on field photos, aviation photos, and on-site research results. In addition, the study referred to past studies and the Korean Building Code to calculate the minimum resistance for each of the construction materials. In addition, the buildings damaged by debris flows were classified into the wood, brick masonry, and prefabricated groups for the analysis of the resistance and impact force by each of the materials.
One of the relevant past studies, Quan Luna et al. [30], conducted a vulnerability analysis for 30 brick-masonry buildings and suggested that the impact force of debris flow with 37.49 kPa or higher caused the vulnerability to get closer to 1, which is the level of destruction. Kang and Kim [33] analyzed a total of 25 buildings and found that destroyed buildings with the wood had the minimum impact force of 31.2 kPa, and those with the masonry had 27.4 kPa. Hu et al. [53] conducted impact force analysis for masonry concrete and reinforced concrete and suggested that the impact force leading to destruction was 18 kPa and 110 kPa, respectively.
The minimum resistance for each of the construction materials that the Korean Building Code suggests is 30 kPa for the wood and 17.2 to 55.1 kPa for the masonry. However, as for the resistance of prefabricated panels, we referred the Korean Standard, KS F 4724 [54], which suggests about 0.9 kPa of resistance for sandwich panels. Therefore, the study selected the resistance as 30.0 kPa for wood construction, 20.7 kPa for the solid masonry brick by masonry object, which is the same type of masonry construction as the buildings in the study areas, and 0.9 kPa for prefabricated panels.

3.4. Vulnerability by Building Material

Based on the impact force that we produced using the formula of Kim et al. [41] for estimating debris flow impact force, the study applied the vulnerability equation suggested by Quan Luna et al. [30] and Kang and Kim [33] to calculate the vulnerability index by distance from an outlet. Quan Luna et al. [30] proposed a vulnerability equation using the flow depth, impact pressure, and kinematic viscosity, based on the simulation result from FLO-2D numerical modeling for 30 kinds of masonry buildings. The equation of Quan Luna et al. [30] is as follows.
v   = 1.596   × | P / 28.16 | | 1.808 | 1 + | P / 28.16 | | 1.808 |   for   P 37.49   kPa
v   =   1   for   P   >   37.49   kPa
where v is the vulnerability, and P indicates the impact pressure (kPa).
Kang and Kim [33] simulated 11 debris flow episodes that have been reported in Korea. Based on the result, they classified construction materials into two types, reinforced concrete and non-reinforced concrete, to propose vulnerability equations using the impact force of debris flow. The non-reinforced concrete buildings include wood, steel, and brick-masonry constructions for which the impact force with about 30 kPa or higher leads to destruction. Out of the vulnerability equations proposed by Kang and Kim [33], the study selected the one for non-reinforced concrete as follows.
v   = 1 e ( 0.001 × p 2.227 )     for   P 30.00   kPa
v   =   1   for   P   >   30.00   kPa
where v is the vulnerability, and P indicates the impact pressure (kPa).

4. Result

4.1. Analysis of Debris Flow Characteristics

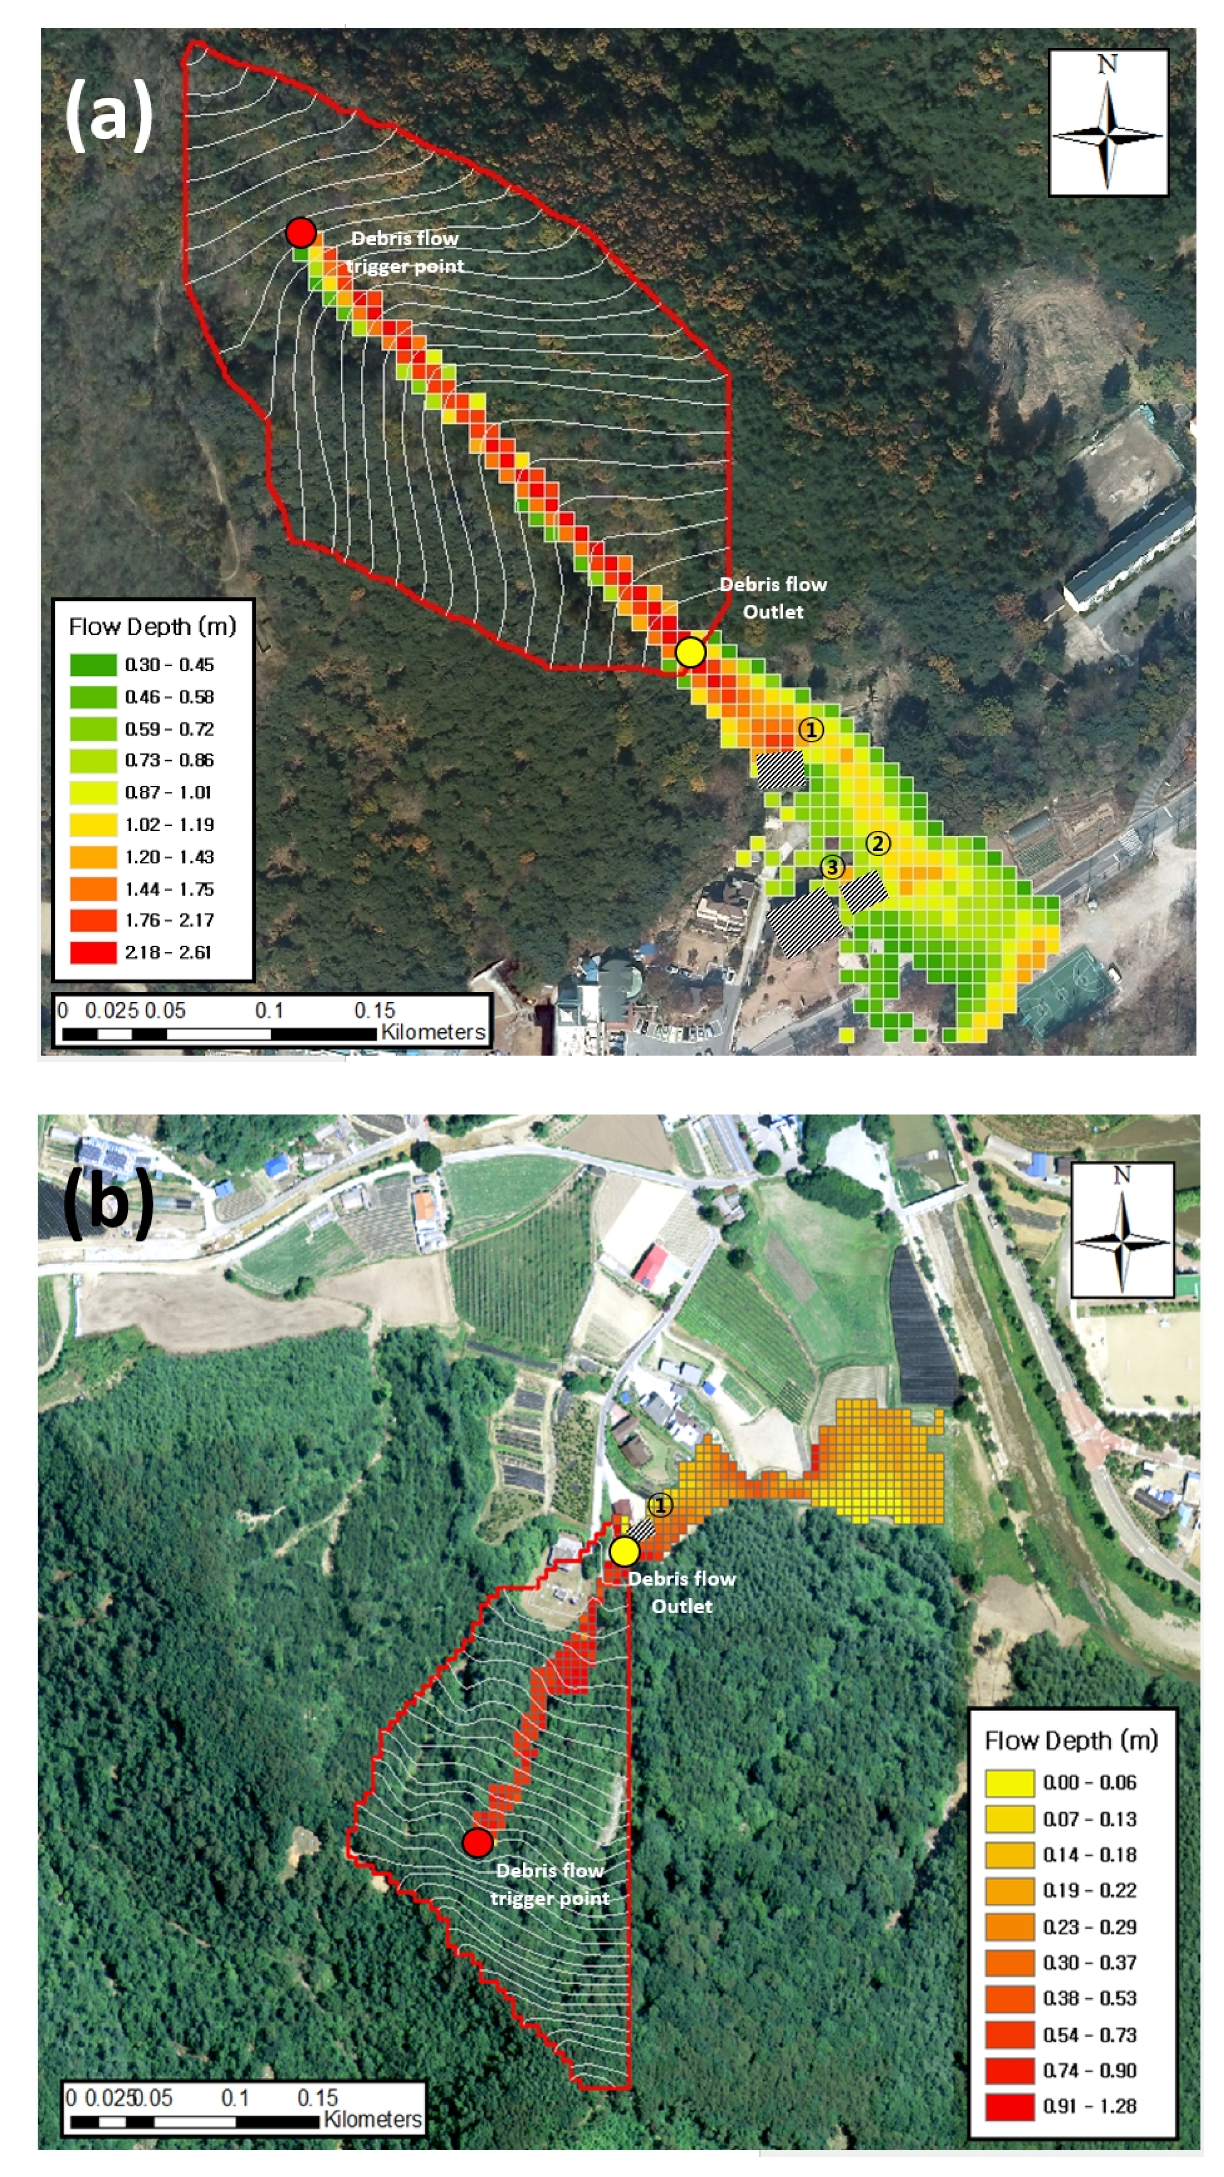
The study areas that experienced debris flows are topographically characterized with the slopes of 24° to 26° at the section where collapsed masses after landslides move downward through mountain streams to become debris flows. In addition, at the section where they pass through an outlet and spread, the slopes are gentle with gradients of less than 10°. The study reflected these topographical characteristics in the debris flow analysis using FLO-2D to simulate debris flows for Sites A and B (Figure 4).
As a result of analyzing the characteristics of debris flows, the average flow depth was estimated at around 0.99 m with a maximum of 2.61 m for Site A. For Site B, the average flow depth was estimated at around 0.35 m with a maximum of 1.28 m. The depth of debris flows moving into the surroundings of the buildings damaged by them was about 1.0 to 1.5 m for Site A and about 0.5 to 1.0 m for Site B.
In this analysis, Site A showed the range of debris flows where they passed through the pension building and moved across the four-lane road located at the lower part of the slope to be spread and ran out by about 10 m to the opposite side. Furthermore, the soils flowed inside the destroyed pension buildings to 1.2 m high. In addition, Site B had the debris flow traces up to 0.7 m high from the floor of the building outer walls.

4.2. Building Vulnerability Assessment by Distance From Outlet

Using the flow depth produced by the FLO-2D simulation, the study estimated the impact force for each of the distances from an outlet with intervals of 10 m. In addition, the impact force for the point of damaged construction was calculated. The results are shown in Table 2 with an explanation about the material types of the affected buildings and the damage levels.
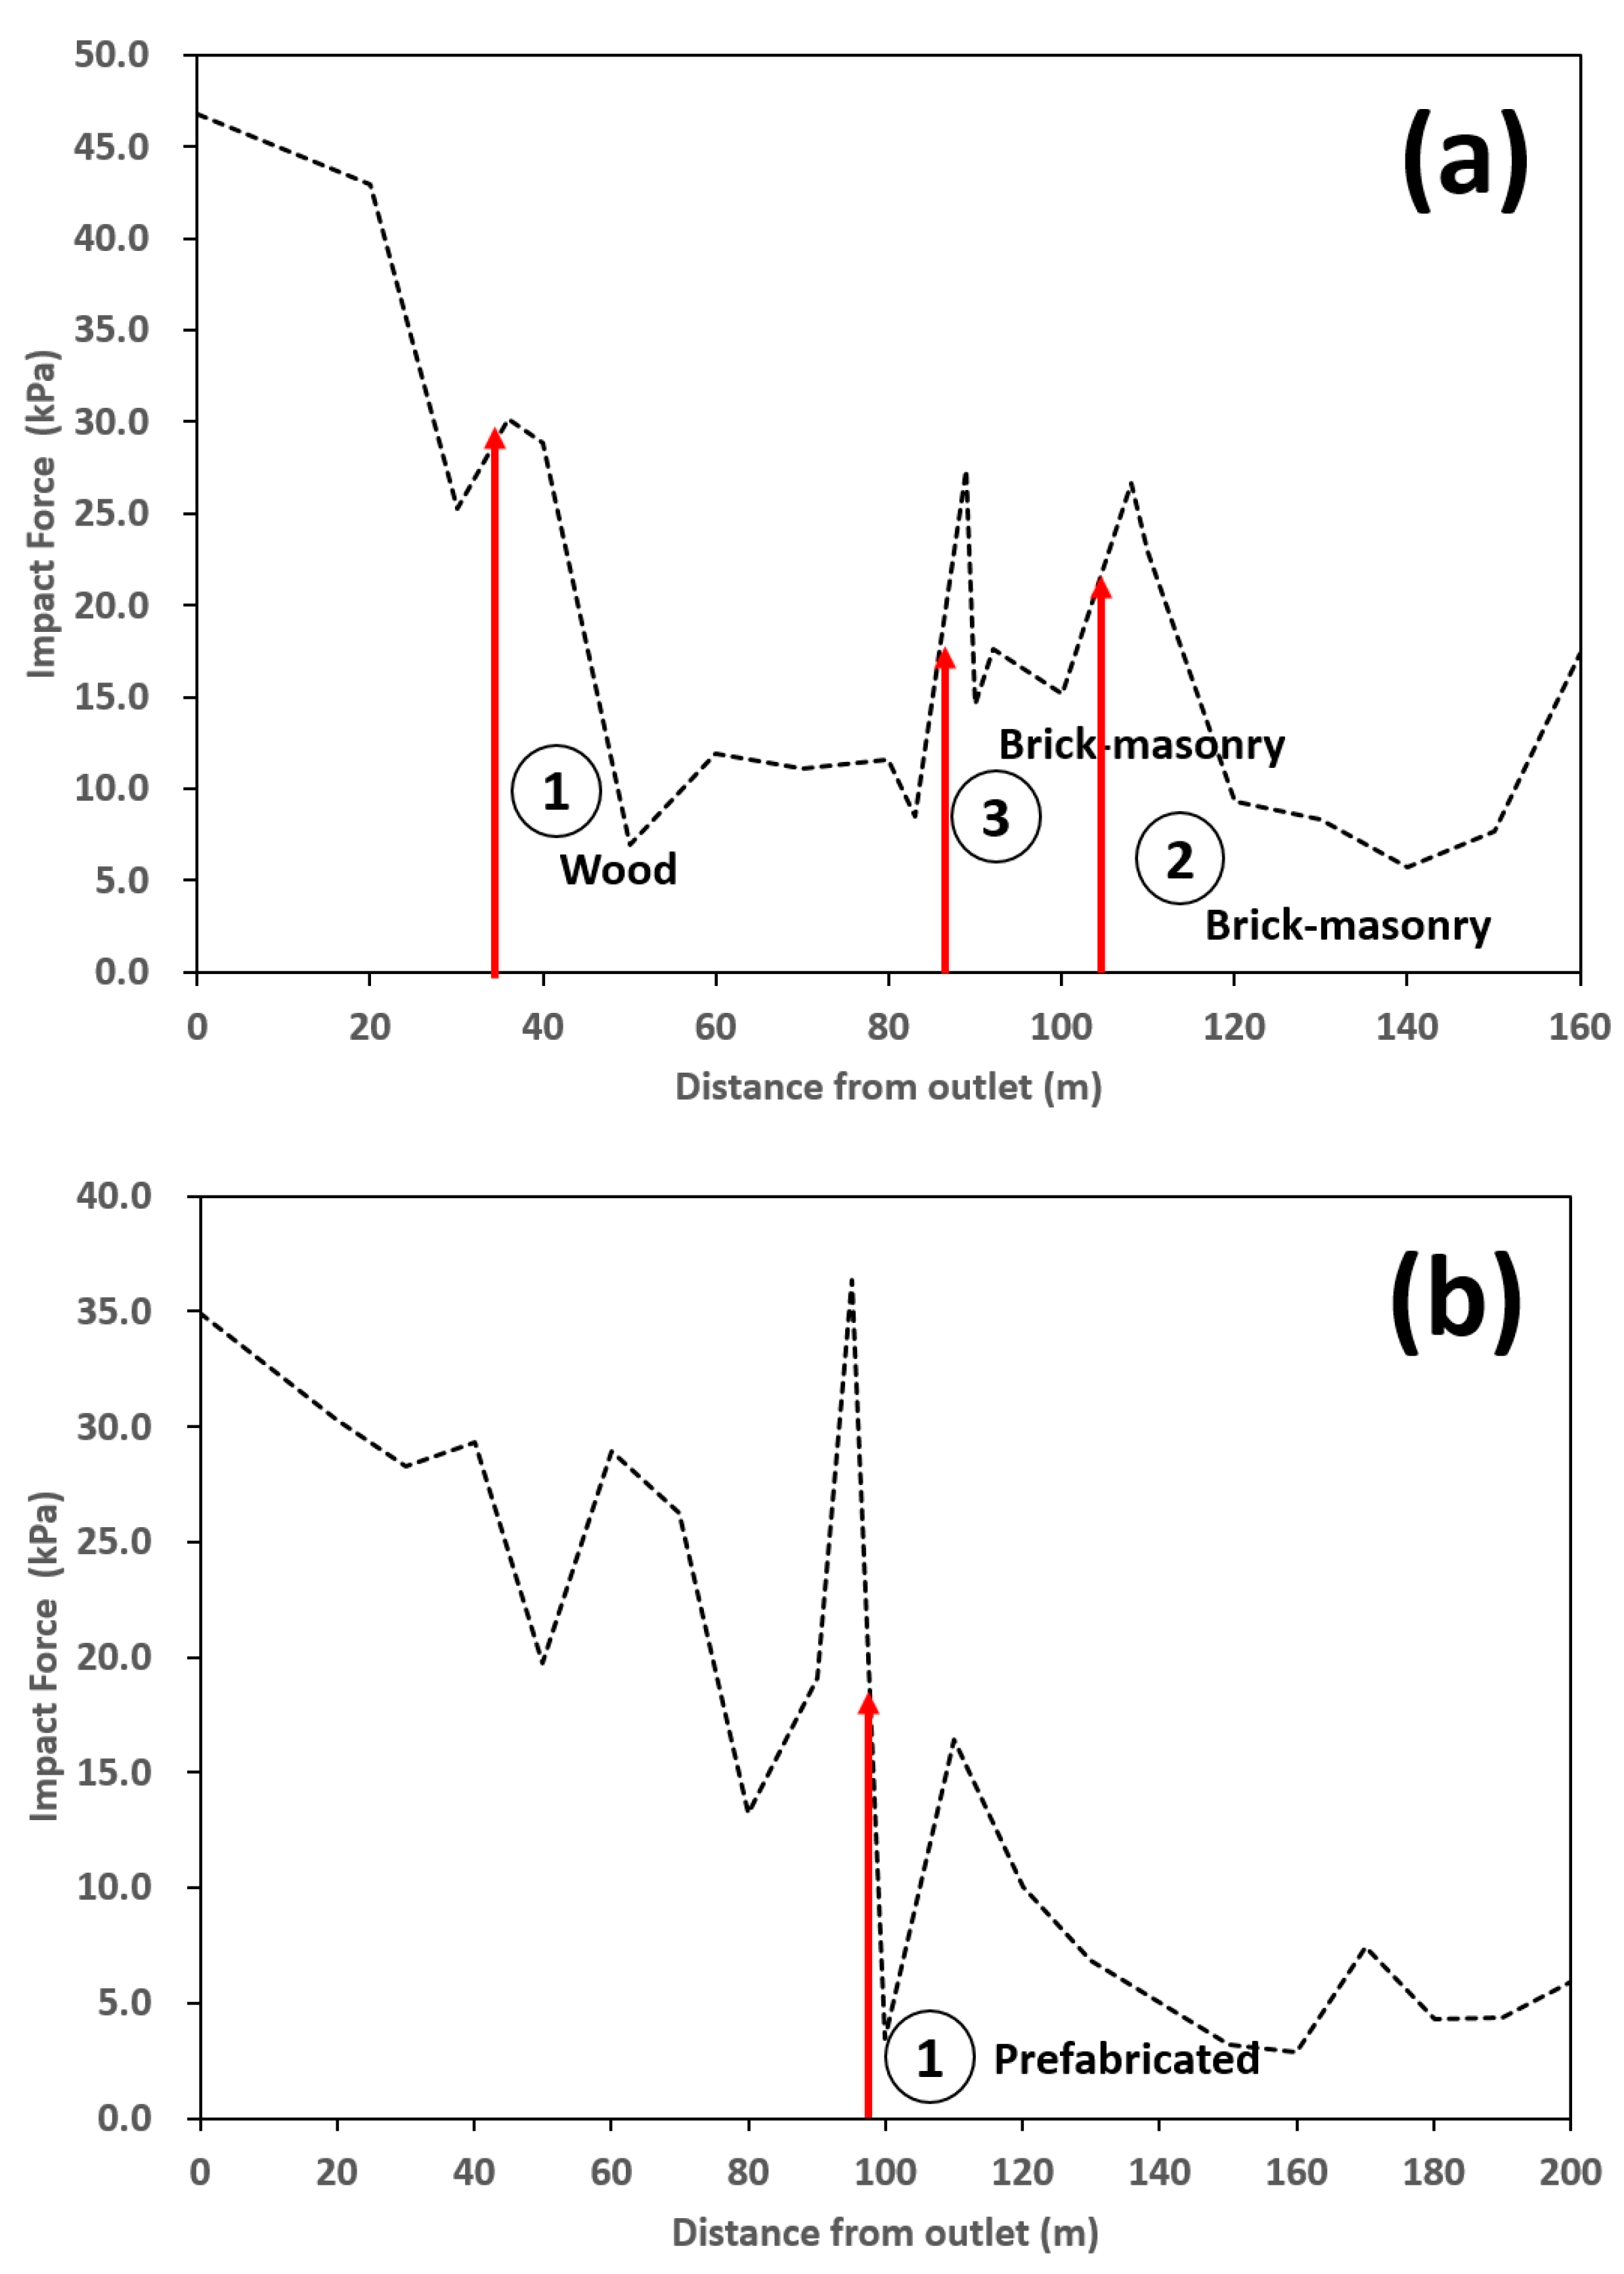
The impact force in the study areas showed a decreasing pattern related to distance from the outlet (Figure 5). According to Kim et al. [41], the characteristics of debris flows when analyzed using FLO-2D were shifting with changing topographical elements such as inflection points. This was also noticeable in this study at the inflection section with the topographical change, and the change in the depth of debris flow influenced both impact force and flow velocity.
In order to evaluate the impact force of debris flow, Scheidl et al. [55] and Cui et al. [56] conducted a study on the diffusion–deposition flow of debris flows considering changes in soil density and slope through methods such as experimental analysis and the modeling approach. These results are used directly to evaluate the vulnerability of buildings from the relationship between the impact force of debris flow and the resistance of buildings.
In Site A, the highest impact force, 42.99 kPa, was found at the distance point of 20 m, which is closest to the outlet. This point also had the highest flow depth when the debris flow moved. For the locations of the buildings damaged from debris flow, the wood construction (building no. 1) was at the point of 36 m, and the brick-masonry construction (building no. 2) was at the point of 96 m. The impact force of debris flows given to these buildings was calculated as 30.14 kPa for building no. 1, 27.39 kPa for building no. 2, and 26.63 kPa for building no. 3.
In Site B, the prefabricated panel building was located at the 95 m point starting from the outlet, and the impact force of debris flow occurring at this point was 36.36 kPa, which is the highest number for all the debris flow sections. As the building at this point was constructed with the prefabricated panels with very weak resistance, it was destroyed by the debris flow.
The calculated impact forces were applied to Equations (8)–(11) to estimate the vulnerability indexes, which were then used for drawing the graphs to show the relation between the two (Figure 6). Hu et al. [53] and Kang and Kim [33] suggested classifying the damage of buildings affected by debris flows into five levels (Complete, Heavy, Moderate, Slight, and Very Slight) and four levels (Complete, Extensive, Moderate, and Slight), respectively. Fuchs et al. [57] analyzed the debris flow intensity and vulnerability, and they derived the vulnerability function for debris flow risk assessment. Jakob et al. [58] calculated the debris flow intensity index by analyzing the flow depth and flow velocity identified in the debris flows. Based on this, the classification of vulnerability assessment suggested four types (some sedimentation, some structural damage, major structural damage, complete destruction) of damage caused by debris flow. To evaluate the vulnerability of buildings in this study, the vulnerability index was analyzed according to the distance of buildings based on the outlet by supplementing the concept of debris flow intensity analysis of the previous study.
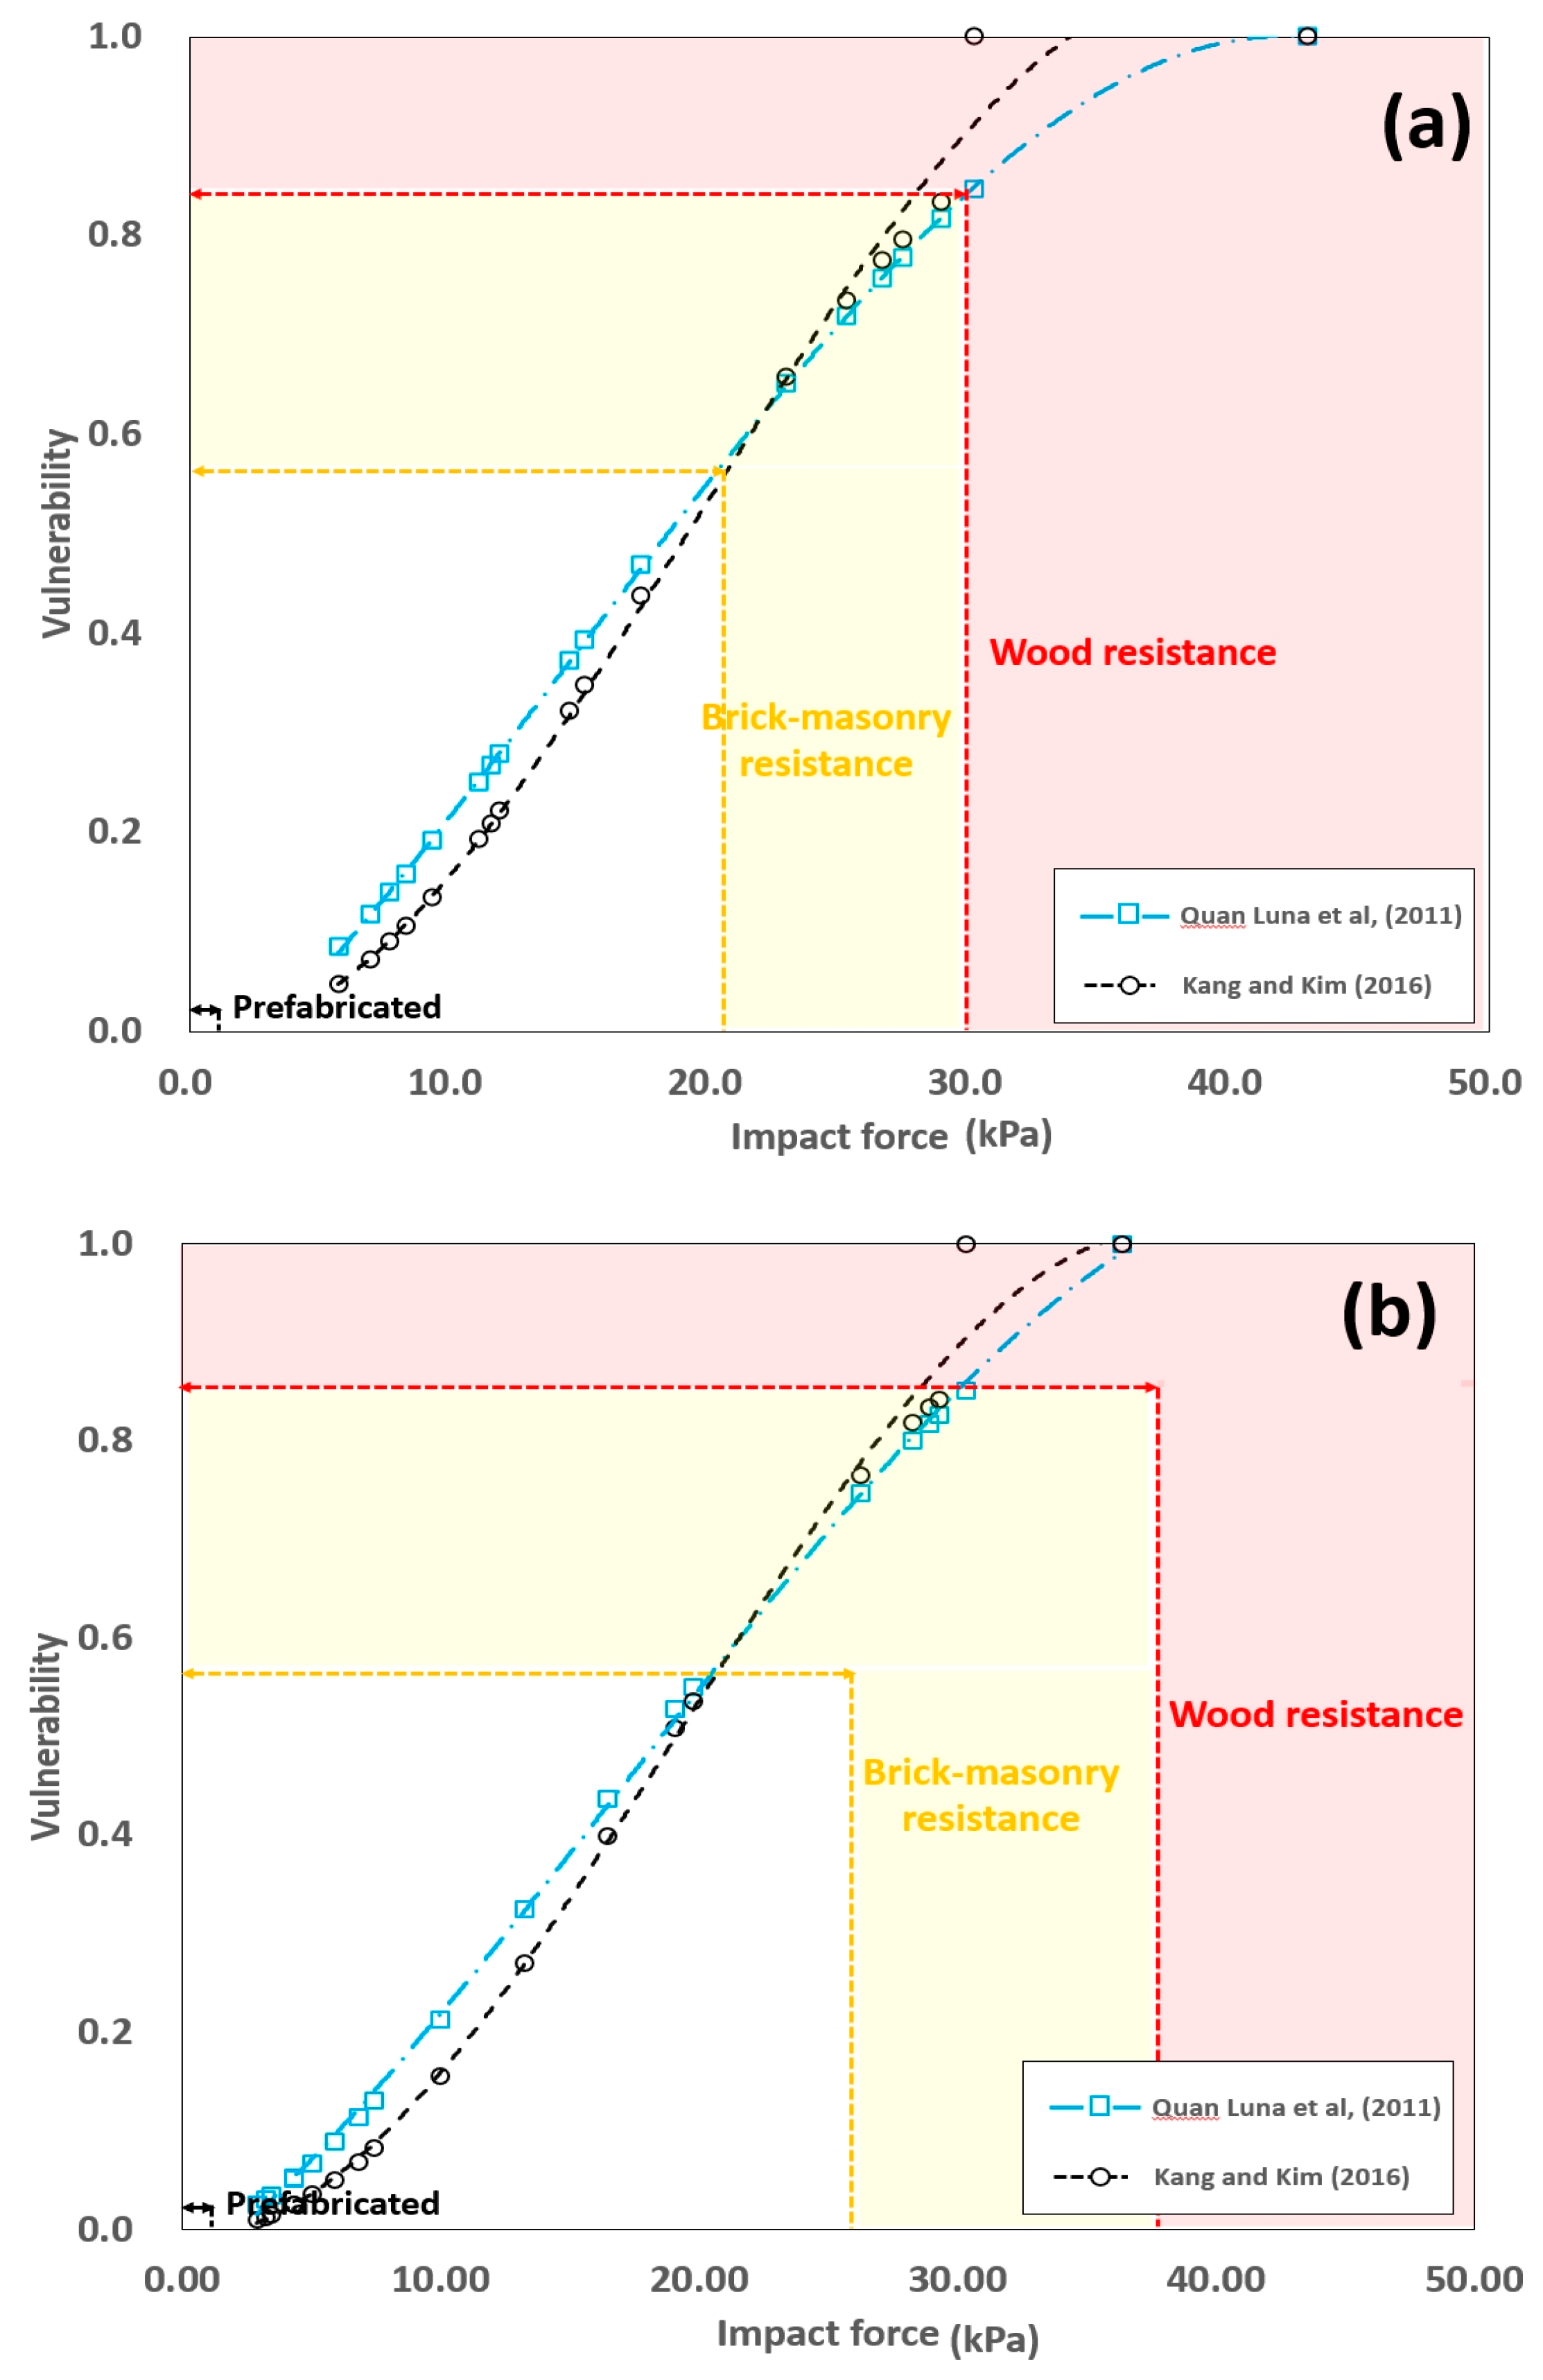
In this study, the building points with damage occurring with debris flows had high vulnerability indexes ranging from about 0.76 to 1.00, which are considered moderate to complete (Table 3). In addition, the vulnerable indexes were distributed at 0.6 or higher on average at around the 40 m point, starting from the outlet for Site A and at around the 50 m point from the outlet for Site B. This can be because the velocity of debris flow starts changed from the outlet with the topographical influence, slope, and inflection point, and, thus, the impact force similarly changed. In addition, the collision of debris flows with the buildings located in their movement direction increases the impact force and thereby causes the greater vulnerability index. Based on this analysis result, the maximum vulnerability index was estimated at 0.85 for the wood material, 0.58 for the brick-masonry material, and 0.003 for the prefabricated material.

5. Discussion

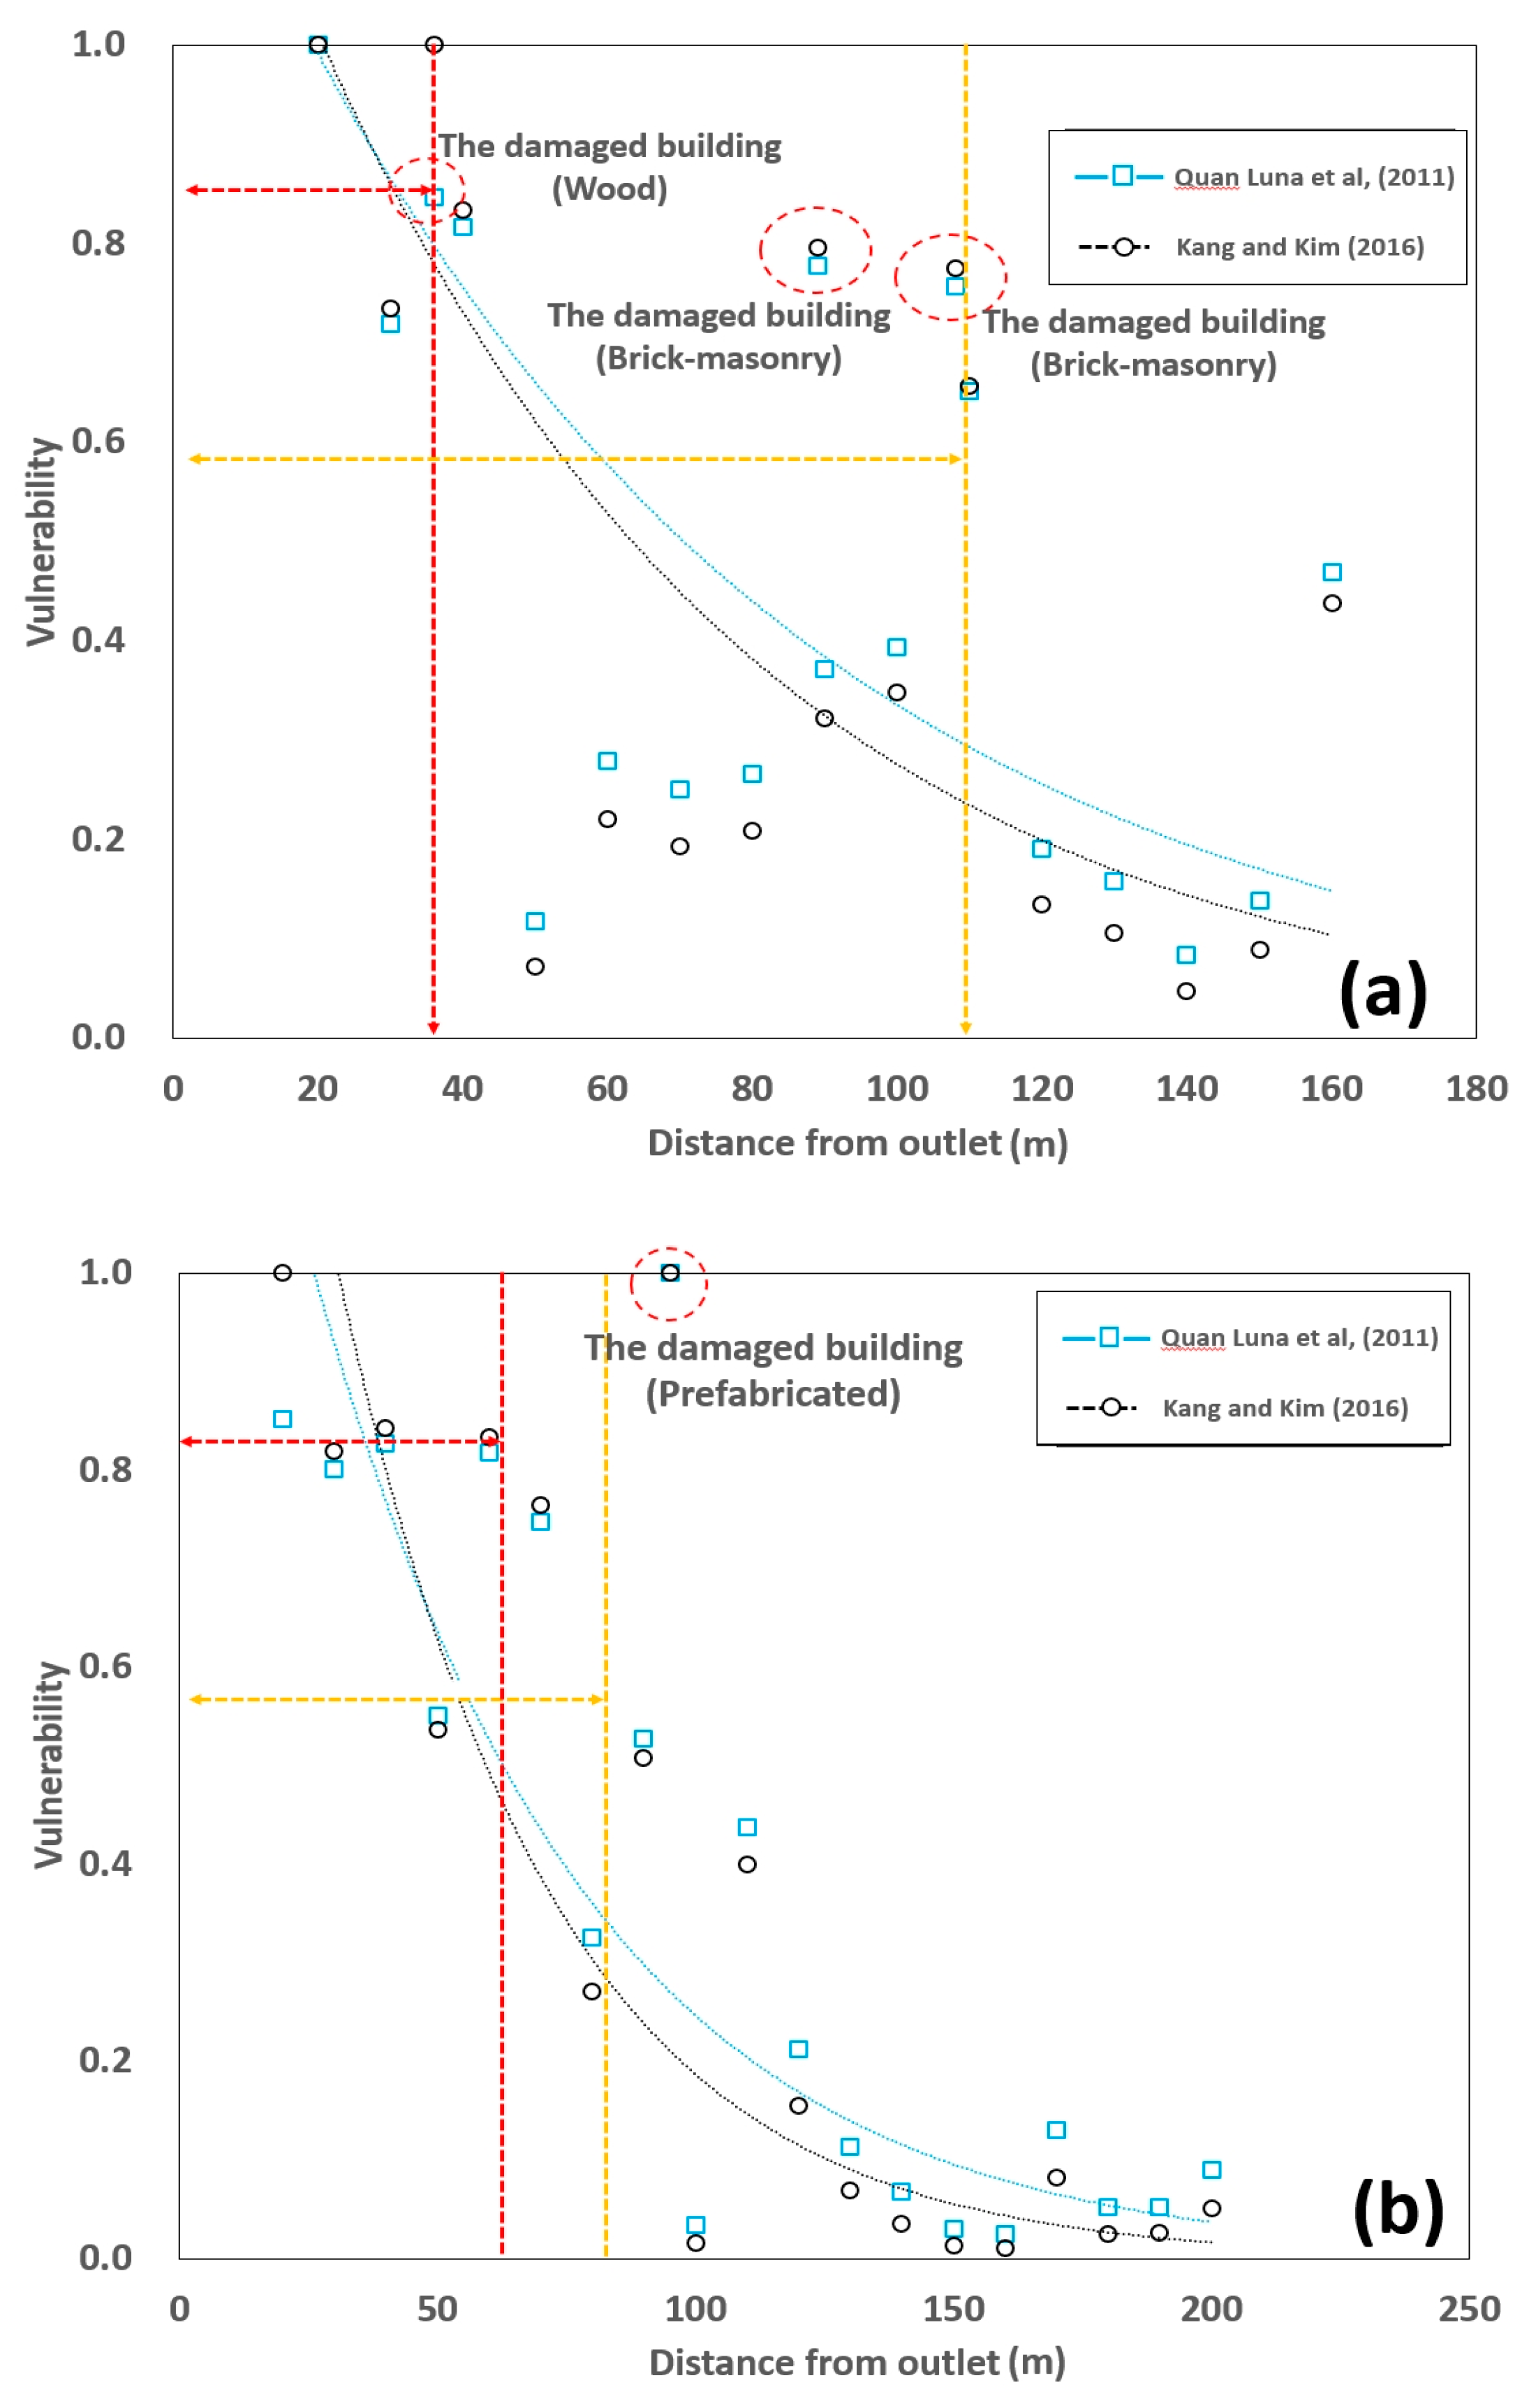
The study calculated the maximum vulnerability index for each of the construction materials and analyzed the relation with the vulnerability indexes changing by distance from the outlet to produce the minimum safety distance (Figure 7). The maximum vulnerability was 0.85 for wood, 0.58 for brick masonry, and 0.03 for prefabricated material. Therefore, the study determined that the destruction of buildings was caused in the sections for which the vulnerability was higher than that of each material.
For Site A, the section of destruction was located around 40 m from the outlet for the wood material construction and around 100 m for brick-masonry material construction. It was found that in July 2011, the three damaged buildings in the study area with debris flow occurrence were also located in the section at around 40 m from the outlet (Figure 7a). In addition, for Site B, the destruction section was extended to the distance point of around 60 m for the building with wood material and the point of around 70 m for the building with brick-masonry material. Meanwhile, in the area, the prefabricated panel building damaged by debris flows was located at 95 m in the distance from the outlet, but the building was destroyed, which would be because of the weak resistance of the construction material (Figure 7b).
For the two sites, we analyzed the relation between vulnerability by the material of the buildings and their distance from the outlet. Based on the analysis result, it was found that the wood construction was exposed to the risk at the section of 40 to 60 m, the brick masonry construction was exposed to the risk at the section of 70 to 110 m, and the prefabricated construction was exposed to the risk at all distances. The latter had weak material resistance as well as a very low vulnerability as 0.003, as shown in Figure 6. Therefore, when a building with prefabricated material is located in the range of movement and spread of debris flows, it would have a very high possibility for destruction by them, regardless of its distance from an outlet.
In addition, monitoring the information of debris flows measured using various sensors such as rain gauge, soil moisture, pore-water pressure, and ground vibration will be important data to reduce the damage caused by debris flows [59].

6. Conclusions

Mountains cover about 70% of South Korea’s territory, wherein precipitations are concentrated during the summer season. These geological and climatic characteristics jointly make the country particularly vulnerable to mountainous disasters such as landslides and debris flows. Especially with the acceleration of urbanization, residential areas are extended to the surroundings of the mountains. Accordingly, buildings constructed with a range of construction materials have the possibility of being damaged directly or indirectly. Therefore, efforts need to be made to reduce the potential risk of damage to buildings from debris flow disaster in the mountains.
The study used the FLO-2D numerical model to analyze the characteristics of debris flows for the areas where the damage from a debris flow occurred to buildings. It estimated the impact force of a debris flow and the resistance of buildings by distance from an outlet to calculate vulnerability indexes and produce the minimum safety distance. The minimum safety distance from the outlet would be used as an important factor when determining a level of damage to a building from debris flow.
Therefore, surveys need to be conducted for the status of the areas where buildings are located to identify the potential risk of debris flows with consideration of the minimum safety distance from an outlet. Once the risk is detected, it should install effective disaster prevention facilities and set a standard to secure the minimum safety distance to prepare a plan for reducing damage from debris flows proactively.
As described above, this study established the concept of the safety distance of buildings that can respond to debris flow by presenting an analysis and evaluation method for the impact force of debris flow and the resistance of buildings. To expand the applicability of these findings, future studies will be conducted that can be standardized based on the current state of the various debris disasters and buildings.

Author Contributions

Conceptualization, M.-I.K.; data curation, J.-H.K.; investigation, M.-I.K.; methodology, M.-I.K. and J.-H.K.; visualization, J.-H.K.; Writing—Original draft, M.-I.K. and J.-H.K.; Writing—Review and editing, M.-I.K. and J.-H.K. All authors have read and agreed to the published version of the manuscript.

Funding

This research was supported by a grant (2019-MOIS31-011) of Fundamental Technology Development Program for Extreme Disaster Response funded by Ministry of Interior and Safety (MOIS, Korea).

Conflicts of Interest

The authors declare no conflicts of interest.

References

  1. Mousavi, M.E.; Irish, J.L.; Frey, A.E.; Olivera, F.; Edge, B.L. Global warming and hurricanes: The potential impact of hurricane intensification and sea level rise on coastal flooding. Clim. Chang. 2011, 104, 575–597. [Google Scholar] [CrossRef]
  2. Gallina, V.; Torresan, S.; Critto, A.; Sperotto, A.; Glade, T.; Marcomini, A. A review of multi-risk methodologies natual hazards: Consequences and challenges for a climate change impact assessment. J. Env. Manag. 2016, 168, 123–132. [Google Scholar] [CrossRef] [PubMed]
  3. Solomon, S.; Qin, D.; Manning, M.; Chen, M.; Marquis, A.K.B.; Tignor, M.; Miller, H.L. Climate Change 2007: The Physical Science Basis. Contribution of Working Group I to the Fourth Assessment Report of the Intergovernmental Panel on Climate Change. IPCC, 2007; Cambridge University Press: Cambridge, UK; New York, NY, USA, 2004; p. 996. [Google Scholar]
  4. Son, K.H.; Lee, B.J.; Bae, D.H. Assessment on flood characteristics changes using multi-GCMs climate scenario. J. Korea Water Resour. Assoc. 2010, 43, 789–799. [Google Scholar] [CrossRef]
  5. Lee, J.S.; Kang, H.S.; Suk, J.W.; Kim, Y.T. Development of hazard level-based rainfall threshold for prediction of rainfall-induced landslide occurrence in Korea. J. Korean Soc. Hazard Mitig. 2019, 19, 225–236, (In Korean with English abstract). [Google Scholar] [CrossRef] [Green Version]
  6. Kwak, J.H.; Kim, M.-I.; Lee, S.J. Landslide susceptibility assessment considering the saturation depth ratio by rainfall change. J. Eng. Geol. 2018, 28, 687–699, (In Korean with English abstract). [Google Scholar]
  7. O’Brien, J.S.; Julien, P.Y. Laboratory analysis of mudflow properties. J. Hydraul. Eng. 1988, 114, 877–887. [Google Scholar] [CrossRef] [Green Version]
  8. Tropeano, D.; Turconi, L. Geomorphic classification of alpine catchments for debris-flow hazard reduction. In Proceedings of the Debris-Flow Hazards Mitigation: Mechanics, Prediction and Assessment, Davos, Switzerland, 10–12 September 2003; pp. 1221–1232. [Google Scholar]
  9. Palladino, M.R.; Viero, A.; Turconi, L.; Brunetti, M.T.; Peruccacci, S.; Melillo, M.; Luino, F.; Deganutti, A.M.; Guzzetti, F. Rainfall thresholds for the activation of shallow landslides in the Italian Alps: The role of environmental conditioning factors. Geomorphology 2018, 303, 53–67. [Google Scholar] [CrossRef]
  10. Turconi, L.; Coviello, V.; Arattano, M.; Savio, G.; Tropeano, D. Monitoring Mud-Flows for Investigative and Warning Purposes: The Instrumented Catchment of Rio Marderello (North-Western Italy). Eng. Geol. Soc. Territ. 2015, 3, 85–90. [Google Scholar]
  11. Paranunzio, R.; Chiarle, M.; Laio, F.; Nigrelli, G.; Turconi, L.; Luino, F. New insights in the relation between climate and slope failures at high-elevation sites. Theor. Appl. Climatol. 2019, 137, 1765–1784. [Google Scholar] [CrossRef]
  12. Kang, H.S.; Kim, Y.T. Physical vulnerability function of building impacted by debris flow. J. Korean Soc. Hazard Mitig. 2014, 14, 133–143, (In Korean with English abstract). [Google Scholar] [CrossRef] [Green Version]
  13. Rickenmann, D.; Weber, D.; Stepanov, B. Erosion by debris flows in field and laboratory experiments. In Proceedings of the 3rd International Conference on Debris-Flow Hazards Mitigation and Assessment, Davos, Switzerland, 10–12 September 2003; pp. 883–894. [Google Scholar]
  14. Chen, J.; He, Y.P.; Wei, F.Q. Debris flow erosion and deposition in Jiangjia Gully, Yunnan, China. Environ. Geol. 2005, 48, 772–777. [Google Scholar] [CrossRef]
  15. Choi, S.K.; Lee, J.M.; Kwon, T.H. Effect of silt-type barrier on characteristics of water-dominant debris flows: Small-scale physical modeling. Landslides 2017, 15, 111–122. [Google Scholar] [CrossRef]
  16. Lee, S.G.; Winter, M.G. The effects of debris flow in the Republic of Korea and some issues for successful risk reduction. Eng. Geol. 2019, 251, 172–189. [Google Scholar] [CrossRef]
  17. Kim, S.E.; Paik, J.C.; Kim, K.S. Run-out Modeling of Debris Flows in Mt.Umyeon using FLO-2D. J. Korean Soc. Civ. Eng. 2013, 33, 965–974. [Google Scholar] [CrossRef] [Green Version]
  18. Papathoma-Kohle, M.; Kappes, M.; Keiler, M.; Glade, T. Physical vulnerability assessment for alpine hazards: State of the art and future needs. Nat. Hazards 2011, 58, 645–680. [Google Scholar] [CrossRef]
  19. Edisvig, U.M.K.; Papathoma-Köhle, M.; Du, J.; Glade, T.; Vangelsten, B.V. Quantification of model uncertainty in debris flow vulnerability assessment. Eng. Geol. 2014, 181, 15–26. [Google Scholar] [CrossRef]
  20. Marques, M.; Monteiro, R.; Delgado, R. An improved model for seismic risk assessment in Portugal. Int. J. Disaster Resil. Built Environ. 2016, 9, 70–83. [Google Scholar] [CrossRef]
  21. Li, D.Q.; Xiao, T.; Cao, Z.J.; Zhou, C.B.; Zhang, L.M. Enhancement of random finite element method in reliability analysis and risk assessment of soil slopes using Subset simulation. Landslides 2016, 13, 293–303. [Google Scholar] [CrossRef]
  22. Li, D.Q.; Zheng, D.; Cao, Z.J.; Tang, X.S.; Phoon, K.K. Response surface methods for slope reliability analysis: A review and comparison. Eng. Geol. 2016, 203, 3–14. [Google Scholar] [CrossRef]
  23. Gao, L.; Zhang, L.M.; Chen, H.X.; Shen, P. Simulating debris flow mobility in urban settings. Eng. Geol. 2016, 214, 67–78. [Google Scholar] [CrossRef]
  24. Gao, L.; Zhang, L.M.; Chen, H.X. Likely scenarios of natural terrain shallow slope failures on Hong Kong Island under extreme storms. Nat. Hazards Rev. 2017, 18, B4015001. [Google Scholar] [CrossRef]
  25. Pfurtscheller, C.; Genovese, E. The Felbertauern Landslide of 2013: Impact on Transport Networks, Effects on Regional Economy and Policy Decisions; SEEDS Working Paper; SEEDS: Ferrara, Italy, 2018; pp. 1–24. [Google Scholar]
  26. Jalayer, F.; Aronica, G.T.; Recupero, A.; Carozza, S.; Manfredi, G. Debris flow damage incurred to buildings: An in-situ back analysis. Flood Risk Manag. 2018, 11, 5646–5662. [Google Scholar] [CrossRef]
  27. Arattano, M.; Bertoldi, G.; Cavalli, M.; Comiti, F.; D’Agostino, V.; Theule, J. Comparison of Methods and Procedures for Debris-Flow Volume Estimation. In Engineering Geology for Society and Territory; Springer International Publishing: Cham, Switzerland, 2015; Volume 3, pp. 115–119. [Google Scholar]
  28. Coviello, V.; Arattano, M.; Turconi, L. Detecting torrential processes from a distance with a seismic monitoring network. J. Int. Soc. Prev. Mitig. Nat. Hazards 2015, 78, 2055–2080. [Google Scholar] [CrossRef]
  29. Fell, R.; Ho, K.K.S.; Lacasse, S.; Leroi, E. A framework for landslide risk assessment and management. In Landslide Risk Management; Hungr, O., Fell, R., Couture, R., Eberhardt, E., Eds.; Taylor & Francis: London, UK, 2005; pp. 533–541. [Google Scholar]
  30. Quan Luna, B.; Blahut, J.; van Westen, C.J.; Sterlacchini, S.; van Asch, T.W.J.; Akbas, S.O. The application of numerical debris flow modelling for the generation of physical vulnerability curves. Nat. Hazards Earth Syst. Sci. 2011, 11, 2047–2060. [Google Scholar] [CrossRef] [Green Version]
  31. Barbolini, M.; Cappabianca, F.; Sailer, R. Empirical estimate of vulnerability relations for use in snow avalanche risk assessment. In Risk Analysis IV; Brebbia, C., Ed.; WIT Press: Southampton, UK, 2004; pp. 533–542. [Google Scholar]
  32. Quan Luna, B.; Blahut, J.; Camera, C.; van Westen, C.; Apuani, T.; Jetten, V.; Sterlacchini, S. Physically based dynamic run-out modelling for quantitative debris flow risk assessment: A case study in Tresenda, Northern Italy. Environ. Earth Sci. 2014, 72, 645–661. [Google Scholar] [CrossRef]
  33. Kang, H.S.; Kim, Y.T. The physical vulnerability of different types of building structure to debris flow events. Nat. Hazards 2016, 80, 1475–1493. [Google Scholar] [CrossRef]
  34. Ciurean, R.L.; Hussin, H.; van Westen, C.J.; Jaboyedoff, M.; Nicolet, P.; Chen, L.; Frigerio, S.; Glade, T. Multi-scale debris flow vulnerability assessment and direct loss estimation of building in the Eastern Italian Alp. Nat. Hazards 2017, 85, 929–957. [Google Scholar] [CrossRef] [Green Version]
  35. Zhang, S.; Zhang, L.; Li, X.; Xu, Q. Physical vulnerability models for assessing building damage by debris flows. Eng. Geol. 2018, 247, 145–158. [Google Scholar] [CrossRef]
  36. Rickenmann, D.; Laigle, D.; McArdell, W.; Hübl, J. Comparison of 2D debris-flow simulation models with field events. Comput. Geosci. 2006, 10, 241–264. [Google Scholar] [CrossRef] [Green Version]
  37. Turconi, L.; Sunil, K.D.; Demurtas, F.; Demurtas, L.; Pendugiu, B.; Tropeano, D.; Savio, G. An analysis of debris-flow events in the Sardinia Island (Thyrrenian Sea, Italy). Environ. Earth Sci. 2013, 69, 1507–1521. [Google Scholar] [CrossRef]
  38. Comiti, F.; Marchi, L.; Macconi, P.; Arattano, M.; Bertoldi, G.; Broga, M.; Brardinoni, F.; Cavalli, M.; D’Agostino, V.; Penna, D.; et al. A new monitoring station for debris flows in the European Alps: First observations in the Gadria basin. Nat. Hazards 2014, 73, 1175–1198. [Google Scholar] [CrossRef]
  39. Revelliono, P.; Hungr, O.; Guadagno, F.M.; Evans, S.G. Velocity and runout simulation of destructive debris flows and debris avalanches in pyroclastic deposits, Campania region, Italy. Environ. Geol. 2004, 45, 295–311. [Google Scholar] [CrossRef]
  40. Aleotti, P.; Polloni, G.; Tropeano, D.; Turconi, L. Numerical Modeling to Determine Risk Scenarios in An Alpine Alluvial Fan. Risk Analysis IV 2004, 9, 153–162. [Google Scholar]
  41. Kim, M.-I.; Kwak, J.H.; Kim, B.-S. Assessment of dynamic impact force of debris flow in mountain torrent based on characteristics of debris flow. Environ. Earth Sci. 2018, 77, 538. [Google Scholar] [CrossRef]
  42. Julien, P.Y.; O’Brien, J.S. Selected Notes on Debris Flow Dynamics, Recent Developments on Debris Flows, Lecture Notes in Earth Sciences; Springer: Berlin, Germany, 1997; Volume 64, pp. 144–162. [Google Scholar]
  43. Hsu, S.M.; Chiou, L.B.; Lin, G.F.; Chao, C.H.; Wen, H.Y.; Ku, C.Y. Applications of simulation technique on debris flow hazard zone delineation: A case study in Hualien County, Taiwan. Nat. Hazards Earth Syst. Sci. 2010, 10, 535–545. [Google Scholar] [CrossRef] [Green Version]
  44. Li, M.N.; Sung, R.T.; Dong, J.J.; Lee, C.T.; Chen, C.C. The formation and breaching of a short-lived landslide dam at Hsiaolin Village, Taiwan-Part Ⅱ: Simulation of debris flow with landslide dam breach. Eng. Geol. 2011, 123, 66–71. [Google Scholar] [CrossRef]
  45. FLO-2D Software Inc. FLO-2D Reference Manual; FLO-2D Software Inc.: Nutrioso, AZ, USA, 2009. [Google Scholar]
  46. Chow, V.T.; Maidment, D.R.; Mays, L.W. Applied Hydrology; McGraw-Hill: New York, NY, USA, 1988. [Google Scholar]
  47. Berti, M.; Genevois, R.; Simoni, A.; Tecca, P.R. Field observations of a debris flow event in the Dolomites. Geomorphology 1999, 29, 265–274. [Google Scholar] [CrossRef]
  48. Chen, J.-C.; Jan, C.-D.; Lee, M.-H. Reliability analysis of design discharge for mountainous gully flow. J. Hydraul. Res. 2008, 46, 835–838. [Google Scholar] [CrossRef]
  49. Chen, J.C.; Chuang, M.R. Discharge of landslide-induced debris flows: Case studies of Typhoon Morakot in southern Taiwan. Nat. Hazards Earth Syst. Sci. 2014, 14, 1719–1730. [Google Scholar] [CrossRef] [Green Version]
  50. Ministry of Land, Infrastructure and Transport. River Design Criteria; Korea Water Resources Association; MOLIT: Seoul, Korea, 2009; pp. 463–476.
  51. Zanchetta, G.; Sulpizio, R.; Pareschi, M.T.; Leoni, F.M.; Santacroce, R. Characteristics of May 5–6, 1998 volcaniclastic debris-flows in the Sarno area (Campania, Southern Italy): Relationships to structural damage and hazard zonation. J. Volcanol. Geotherm. Res. 2004, 133, 377–393. [Google Scholar] [CrossRef]
  52. Okuda, S.; Okunishi, K.; Suwa, H. Observation of debris flow at Kamikamihori Valley of Mt. Yakedake. In Proceedings of the Third meeting of the IGU Commission on Field Experiments in Geomorphology, Kyoto, Japan, 24–30 August 1980; pp. 116–139. [Google Scholar]
  53. Hu, K.H.; Cui, P.; Zhang, J.Q. Characteristics of damage to buildings by debris flows on 7 August 2010 in Zhouqu, Western China. Nat. Hazards Earth Syst. Sci. 2012, 12, 2209–2217. [Google Scholar] [CrossRef]
  54. Steel Panel for Wall in Buildings; KS F 4724; Korean Standards Association: Seoul, Korea, 2017.
  55. Scheidl, C.; Chiari, M.; Kaitna, R.; Müllegger, M.; Krawtschuk, A.; Zimmermann, T.; Proske, D. Analysing Debris-flow impact models, based on small scale modelling approach. Surv. Geophys. 2013, 34, 121–140. [Google Scholar] [CrossRef] [Green Version]
  56. Cui, P.; Zeng, C.; Lei, Y. Experimental analysis on the impact force of viscous debris flow. Earth Surf. Process. Landf. 2015, 40, 1644–1655. [Google Scholar] [CrossRef] [Green Version]
  57. Fuchs, S.; Heiss, K.; Hübl, J. Towards an empirical vulnerability function for use in debris flow risk assessment. Nat. Hazards Earth Syst. Sci. 2007, 7, 495–506. [Google Scholar] [CrossRef] [Green Version]
  58. Jakob, M.; Stein, D.; Ulmi, M. Vulnerability of buildings to debris flow impact. Nat. Hazards 2012, 60, 241–261. [Google Scholar] [CrossRef]
  59. Hürlimann, M.; Coviello, V.; Bel, C.; Guo, X.; Berti, M.; Graf, C.; Hübl, J.; Miyata, S.; Smith, B.D.; Yin, H.Y. Debris-flow monitoring and warning: Review and example. Earth Sci. Rev. 2019, 199, 102981. [Google Scholar] [CrossRef]
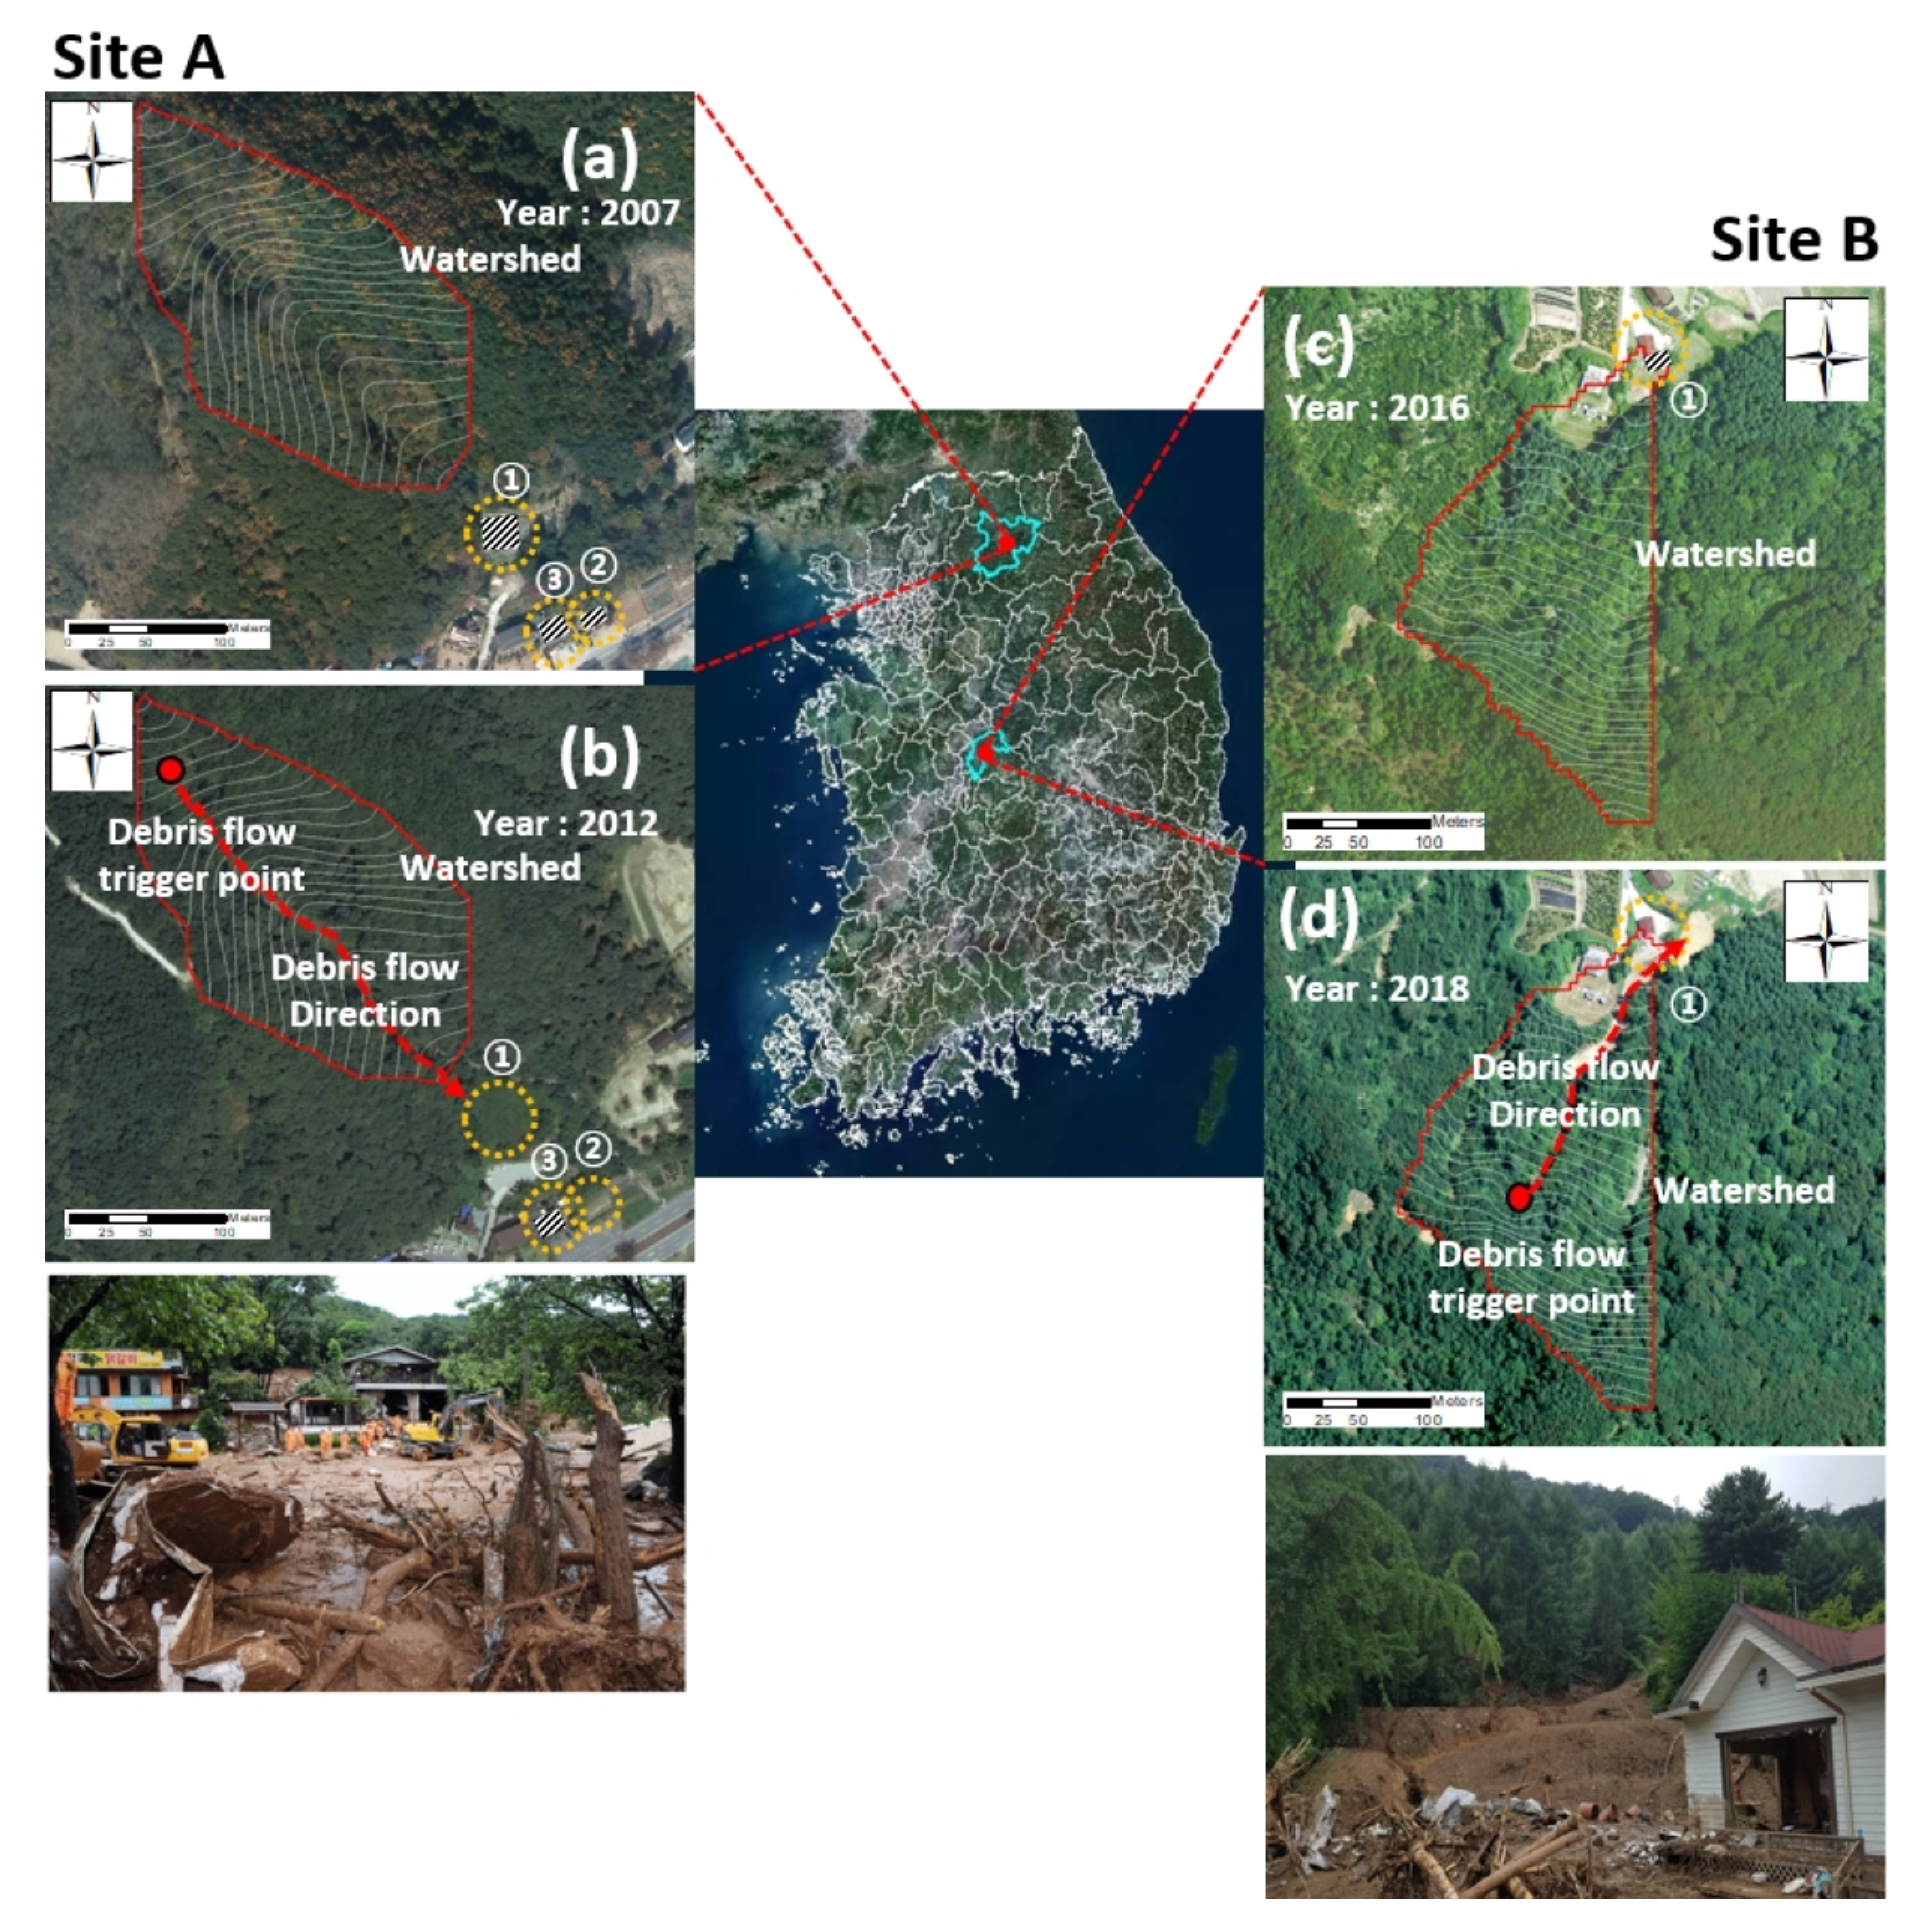
Figure 1. Location of study areas on satellite images. Before (a,c) and after (b,d) occurrence of debris flows in Chuncheon-shi (Site A) and Cheongju-shi (Site B). In Site A, ① wood structure (completely broken), ② brick masonry structure (completely broken), and ③ brick masonry structure (slightly damaged); and in Site B, ① prefabricated panel structure (completely broken).
Water 12 02021 g001
Figure 2. Analysis of rainfall events (hourly rainfall and accumulated rainfall) changing before and after the occurrence of debris flows in the study areas (source: data from the Korea Meteorological Administration): (a) Analysis of rainfall events from 26 to 27 July 2011, with the reference point as the debris flow occurrence in Chuncheon-shi, Gangwon-do; and (b) Analysis of rainfall events from 16 to 17 July 2017, with reference point as the debris flow occurrence in Cheongju-shi, Chungcheongbuk-do.
Water 12 02021 g002
Figure 3. Flowchart for methodology of the study.
Water 12 02021 g003
Figure 4. Result of debris flow simulation: (a) Site A, Chuncheon-shi area, ① and ② were completely destroyed, and ③ was slight broken; (b) Site B, Cheongju-shi area, ① was completely destroyed. The yellow circles indicate debris flow outlets.
Water 12 02021 g004
Figure 5. Analysis of debris flow impact forces varying with distance from outlet, based on FLO-2D simulation: (a) The graph shows the changing impact forces of debris flow for Site A, and the locations of damaged buildings are marked with the numbers ①, ②, and ③. (b) The graph shows the changing impact forces of debris flow for Site B and the location of the building having been damaged from the debris flow marked with the number ①, and the construction material is shown.
Water 12 02021 g005
Figure 6. Calculation of vulnerability indexes using vulnerability Equations (8)–(11), based on the debris flow impact forces provided by Equation (7) (blue line for Quan Luna et al. (2011); black dotted line for Kang and Kim (2016); and red line and orange line for vulnerability against the resistance of wood material and brick-masonry material, respectively) (a) Site A for the Chuncheon-shi area and (b) Site B for the Cheongju-shi area.
Water 12 02021 g006
Figure 7. Distribution of vulnerability indexes by construction material with changing distance from an outlet and analysis of minimum safety distance. The vertical dotted lines in different colors indicate the minimum safety distance at the point where it becomes the same as or lower than the maximum vulnerability point for each material (horizontal dotted line in red for vulnerability index of wood (0.84) and in yellow for vulnerability index of brick masonry (0.58)). (a) Site A for Chuncheon-shi area and (b) Site B for Cheongju-shi area.
Water 12 02021 g007
Table 1. Input parameters of debris flow simulation (α1, β1: Chuncheon-shi area, α2, β2: Cheongju-shi area).
Manning CoefficientLimiting Froude NumberViscosityYield StressSediment Concentration
α1α2β1β2α1α2β1β2
0.150.80.00140.004623.020.0440.03830.004319.623.7750.56
Table 2. Calculation of impact force from the outlet and the description of the damaged building.
Site A Chuncheon-Shi AreaSite B Cheongju-Shi Area
Distance from Outlet (m)Impact Force (kPa)Structural TypeDamage GradeDistance from Outlet (m)Impact Force (kPa)Structural TypeDamage Grade
2042.99 2030.33
3025.25 3028.28
3630.14WoodComplete4029.32
4028.90 5019.77
506.96 6028.94
6011.93 7026.26
7011.14 8013.26
8011.59 9019.07
8927.39Brick masonrySlight9536.36PrefabricatedComplete
9014.57 1003.44
10015.18 11016.44
10826.63Brick masonryComplete12010.02
11022.94 1306.83
1209.34 1405.03
1308.32 1503.22
1405.71 1602.90
1507.69 1707.42
16017.36 1804.32
1904.36
2005.92
Table 3. Calculation of vulnerability based on impact force.
Site A Chuncheon-Shi AreaSite B Cheongju-Shi Area
Distance from Outlet (m)Impact Force (kPa) by Kim et al. [41]Vulnerability IndexDistance from Outlet (m)Impact Force (kPa) by Kim et al. [41])Vulnerability Index
Quan Luna et al. [30]Kang and Kim [33]Quan Luna et al. [30]Kang and Kim [33]
2042.991.001.002030.330.851.00
3025.250.720.733028.280.800.82
3630.140.851.004029.320.830.84
4028.900.820.835019.770.550.54
506.960.120.076028.940.820.83
6011.930.280.227026.260.750.76
7011.140.250.198013.260.330.27
8011.590.270.219019.070.530.51
8927.390.780.809536.361.001.00
9014.570.370.321003.440.030.02
10015.180.390.3511016.440.440.40
10826.630.760.7812010.020.210.16
11022.940.650.661306.830.110.07
1209.340.190.131405.030.070.04
1308.320.160.111503.220.030.01
1405.710.080.051602.900.030.01
1507.690.140.091707.420.130.08
16017.360.470.441804.320.050.03
1904.360.050.03
2005.920.090.05
Note: The light gray dashed boxes represent the range of serious damage to buildings with a vulnerability index of 0.6 or higher. In order to recalculate the vulnerability index considering the distance from outlet in this study area, the vulnerability equations (Equations (8)–(10)) suggested by Quan Luna et al. [30] and Kang and Kim [33], and the impact force equation (Equation (7)) presented by Kim et al. [41] were applied.