Article

Wave Energy Assessment in the Bohai Sea and the Yellow Sea Based on a 40-Year Hindcast

1
Key Laboratory of Far-Shore Wind Power Technology of Zhejiang Province, Hanzhou 311122, China
2
Power China Huadong Engineering Corporation Limited, Hanzhou 311122, China
3
School of Naval Architecture, Ocean and Civil Engineering, Shanghai Jiao Tong University, Shanghai 200240, China
4
Key Laboratory of Ministry of Education for Coastal Disaster and Protection, Hohai University, Nanjing 210098, China
*
Authors to whom correspondence should be addressed.
Water 2020, 12(8), 2087; https://doi.org/10.3390/w12082087
Submission received: 15 June 2020 / Revised: 10 July 2020 / Accepted: 15 July 2020 / Published: 23 July 2020
(This article belongs to the Section Oceans and Coastal Zones)

Abstract

:
A wave hindcast, covering the period of 1979–2018, was preformed to assess wave energy potential in the Bohai Sea and the Yellow Sea. The hindcase was carried out using the third generation wave model TOMAWAC with high spatio-temporal resolution (about 1 km and on an hourly basis). Results show that the mean values of significant wave height increase from north to south, and the maximum values are located at the south part of the Yellow Sea with amplitude within 1.6 m. The magnitudes of significant wave height values vary significantly within seasons; they are at a maximum in winter. The wave energy potential was represented by distributions of the wave power flux. The largest values appear in the southeast part of the numerical domain with wave power flux values of 8 kW/m. The wave power flux values are less than 2 kW/m in the Bohai Sea and nearshore areas of the Yellow Sea. The seasonal mean wave power flux was found up to 8 kW/m in the winter and autumn. To investigate the exploitable wave energy, a wave energy event was defined based on the significant wave height (Hs) threshold values of 0.5 m. The wave energy in south part of the Yellow Sea is more steady and intensive than in the other areas. Wave energy in winter is more suitable for harvesting wave energy. Long-term trends of wave power availability suggest that the values of wave power slightly decreased in the 1990s, whereas they have been increasing since 2006.

1. Introduction

Waves exist everywhere in the ocean. Wave energy is one of the major renewable energy sources with a global estimation of 2TW [1]. The large human populations and the enormous economic activities taking place in coastal areas make the harvesting of energy from waves very attractive [2]. Based on different mechanisms, a number of wave energy resource (WEC) devices have been proposed and tested under different sea conditions [3]. According to the location of operation, wave conditions and working principle, WEC devices can be categorized into four types, that is, wave activated bodies, point absorbers, oscillating water columns, and overtopping devices [4]. Among these, devices based on the point absorber concept are the most popular. However, due to the high cost compared to conventional electricity generation, there are still no commercial wave energy converters installed in the world [5].
The utility of wave energy is very challenging. To design wave energy converters and assess wave energy storage, wave characteristics need to be studied. The assessment of wave energy resources based on observed data usually does not have enough long-term sequence data. Besides, the high temporal and spatial variability of waves cannot be represented by wave observations. For example, a wave buoy station is the most common method to obtain wave data, and the early wave energy estimations are made based on wave buoy observations [6]. However, this method cannot obtain the spatial distributions of wave states.
Due to the limitation of wave observations, wave models are widely applied to calculate wave conditions and assess wave energy [7,8,9]. Since the 1990s, the third-generation models have been developed, such as WAM [10], WAVEWATCH III [11], SWAN [12], and TOMAWAC [13]. These models have been used to assess global [14,15,16] or regional wave conditions and wave resources [17,18,19,20,21,22,23,24,25]. For instance, Roger [26] used the wave model WAVEWATCH III to forecast the wave energy density along the east coast of the Pacific. Liang et al. [7] calculated the wave energy distributions from 1990 to 2011 in the Bohai Sea and the Yellow sea using the wave model SWAN. Zheng et al. [27] also used the WAVEWATCH III model to assess wave energy in the China Sea from 1988 to 2009. Besio et al. [28] carried out a 35-year hindcast to update the assessments of wave energy potential in the Mediterranean Sea.
Most of the previous studies have determined wave energy based on the spatial and temporal distributions of wave parameters. However, the stability of the wave energy is also important. In regions with very large wave energy density, if the temporal variability is significant, wave energy cannot be efficiently absorbed by wave energy devices. On the other hand, in the overall low wave energy region, if the wave energy is steady, it is also promising to use proper wave energy devices to continuously convert wave energy. Folley and Whittaker [29] studied the relationship between the net wave power and a gross wave power device when investing wave energy in coastal areas. Referring to the defined method of exploitable wind speed, the exploitable significant wave height was defined by Zheng et al. [27] as the wave height being higher than 0.5 m.
Based on the definition of exploitable significant wave height proposed by Zheng et al. [27], a wave energy event concept is proposed to better understand the wave energy behavior in this study. The paper is organized as follows: in Section 2, the governing equation, numerical schemes, and model setup are briefly discussed. In Section 3, the results are compared with observations. Annual and seasonal distributions of mean wave parameters and wave energy potential are also presented. In Section 4, exploitable wave energy is discussed. In Section 4, location scale assessment of wave energy is presented. Finally, concluding remarks are given in Section 5.

2. Methodology

The Bohai Sea (BS) and Yellow Sea (YS) are semi-enclosed; they are bounded in the east by the Korean Peninsula and connect to the East China Sea at the southern boundary (Figure 1). The third generation spectral wave model used in this study is TOMAWAC. The governing equation, source terms, and mesh grids are introduced in this section.

2.1. Model Description

TOMOWAC [13] was developed by the EDF R&D’s LNHE, and it is part of the Telemac-Mascaret system. The governing equation of TOMAWAC is the action balance equation
N t + c λ N λ + cos 1 φ c φ N φ + c σ N σ + c θ N θ = Q t o t σ
Q t o t = Q i n + Q d s + Q n l + Q b f + Q b r + Q t r ,
where N is the wave action density spectrum, φ is the latitude, λ is the longitude, σ is the radian frequency, and θ represents directions. The left-hand side terms in Equation (1) represent wave shifting in t , λ , φ , σ , θ -space. The source term on the right-hand includes the processes of wave generation by wind, quadruplet wave-wave interactions, and white-capping in deep ocean waters. In shallow water, however, the triad wave–wave interaction, bottom friction, and depth-induced breaking are considered.
TOMAWAC uses a finite element method (FEM), which allows the ratio of the largest size to the smallest size of the grids to exceed 100. Therefore, the TOMAWAC can be applied in cases simulating waves from deep water to coastal areas with complex geometry.

2.2. Model Setup

The hindcast system implemented used two nested models [30]. The large-scale model (Nest 1 in Figure 1) covers 10 –50 N, 100 –180 E, and the medium-scale grid fine grid (Nest 2 in Figure 1) includes the BS and YS. No wave spectrum was imposed at the boundaries of the large-scale model. The waves were generated only by wind forcing inside the numerical domain. The large-scale model had a resolution of 0.5 in the east boundary. The spatial size of the mesh was refined in the area close to the Pacific Northwest, which is up to 0.2 in deep sea and about 10 km in the region close to the Chinese coast. The wave spectra boundary conditions used in the Nest 2 grid were provided by the Nest 1 grid. To capture the wave information induced by complex coastal topography and bathymetry, the grid size of the Nest 2 was set to be about 1 km along Chinese and Korean coasts.
The models used wind fields input from the CFSR database [31] with a time step of 1 h and a resolution of 0.312 × 0.312 . The water depth data used in the wave models were obtained from the GEBCO (General Bathymetric Chart of the Oceans) database. The number of directions in 360 was 36, and the solved wave period in the models was from 1.5 to 29 s. The time steps for the large-sclae and medium-scale models were 300 s and 200 s, respectively. The simulations period was from 1979 to 2018.

2.3. Error Index

The normalized bias (NB) and the symmetrically normalized root mean square error (HH) [32,33] have been used to analyze the accuracy and reasonableness of the calculation results, which are defined as:
NB = 1 n ( S i O i ) 1 n ( O i )
HH = 1 n ( S i O i ) 2 1 n ( S i O i )
where n is the points number, O i is observed data, and S i is the result from the model.

2.4. Wave Energy Calculation

In the wave model, the wave energy flux per unit width of the progressing wave front can be expressed in terms of the directional wave energy spectrum E ( σ , θ ) , which is given by
WPF = ρ g 0 2 π 0 C g E ( σ , θ ) d σ d θ
where P is the wave energy flux with unit of W / m , ρ is the density of the sea water, g is the gravitational acceleration, C g is the wave group velocity, and E ( σ , θ ) represents wave energy density.

2.5. Definition of Exploitable Wave Energy

The exploitable wave energy is defined as the significant wave height (Hs) being higher than 0.5 m ([27]). When the Hs is higher than 0.5 m, the wave energy can be absorbed by most of the current wave power devices, and we define Hs > 0.5 m as the threshold of a wave energy event. Based on values of the exploitable wave energy, the parameters of the wave energy event number, the duration, and the exploitable wave energy storage of each wave energy event are defied as:
N ¯ = 1 m i = 1 m N j
T ¯ = 1 m i = 1 m j = 1 N j T i , j N j
E ¯ = 1 m i = 1 m j = 1 N j E i , j N j ,
where m is the total number of years, N j is the number of wave energy events every year, T i , j is the times when the Hs remains above 0.5 m, and E i , j is the storage of exploitable wave energy during a wave energy event.

3. Results

3.1. Validation

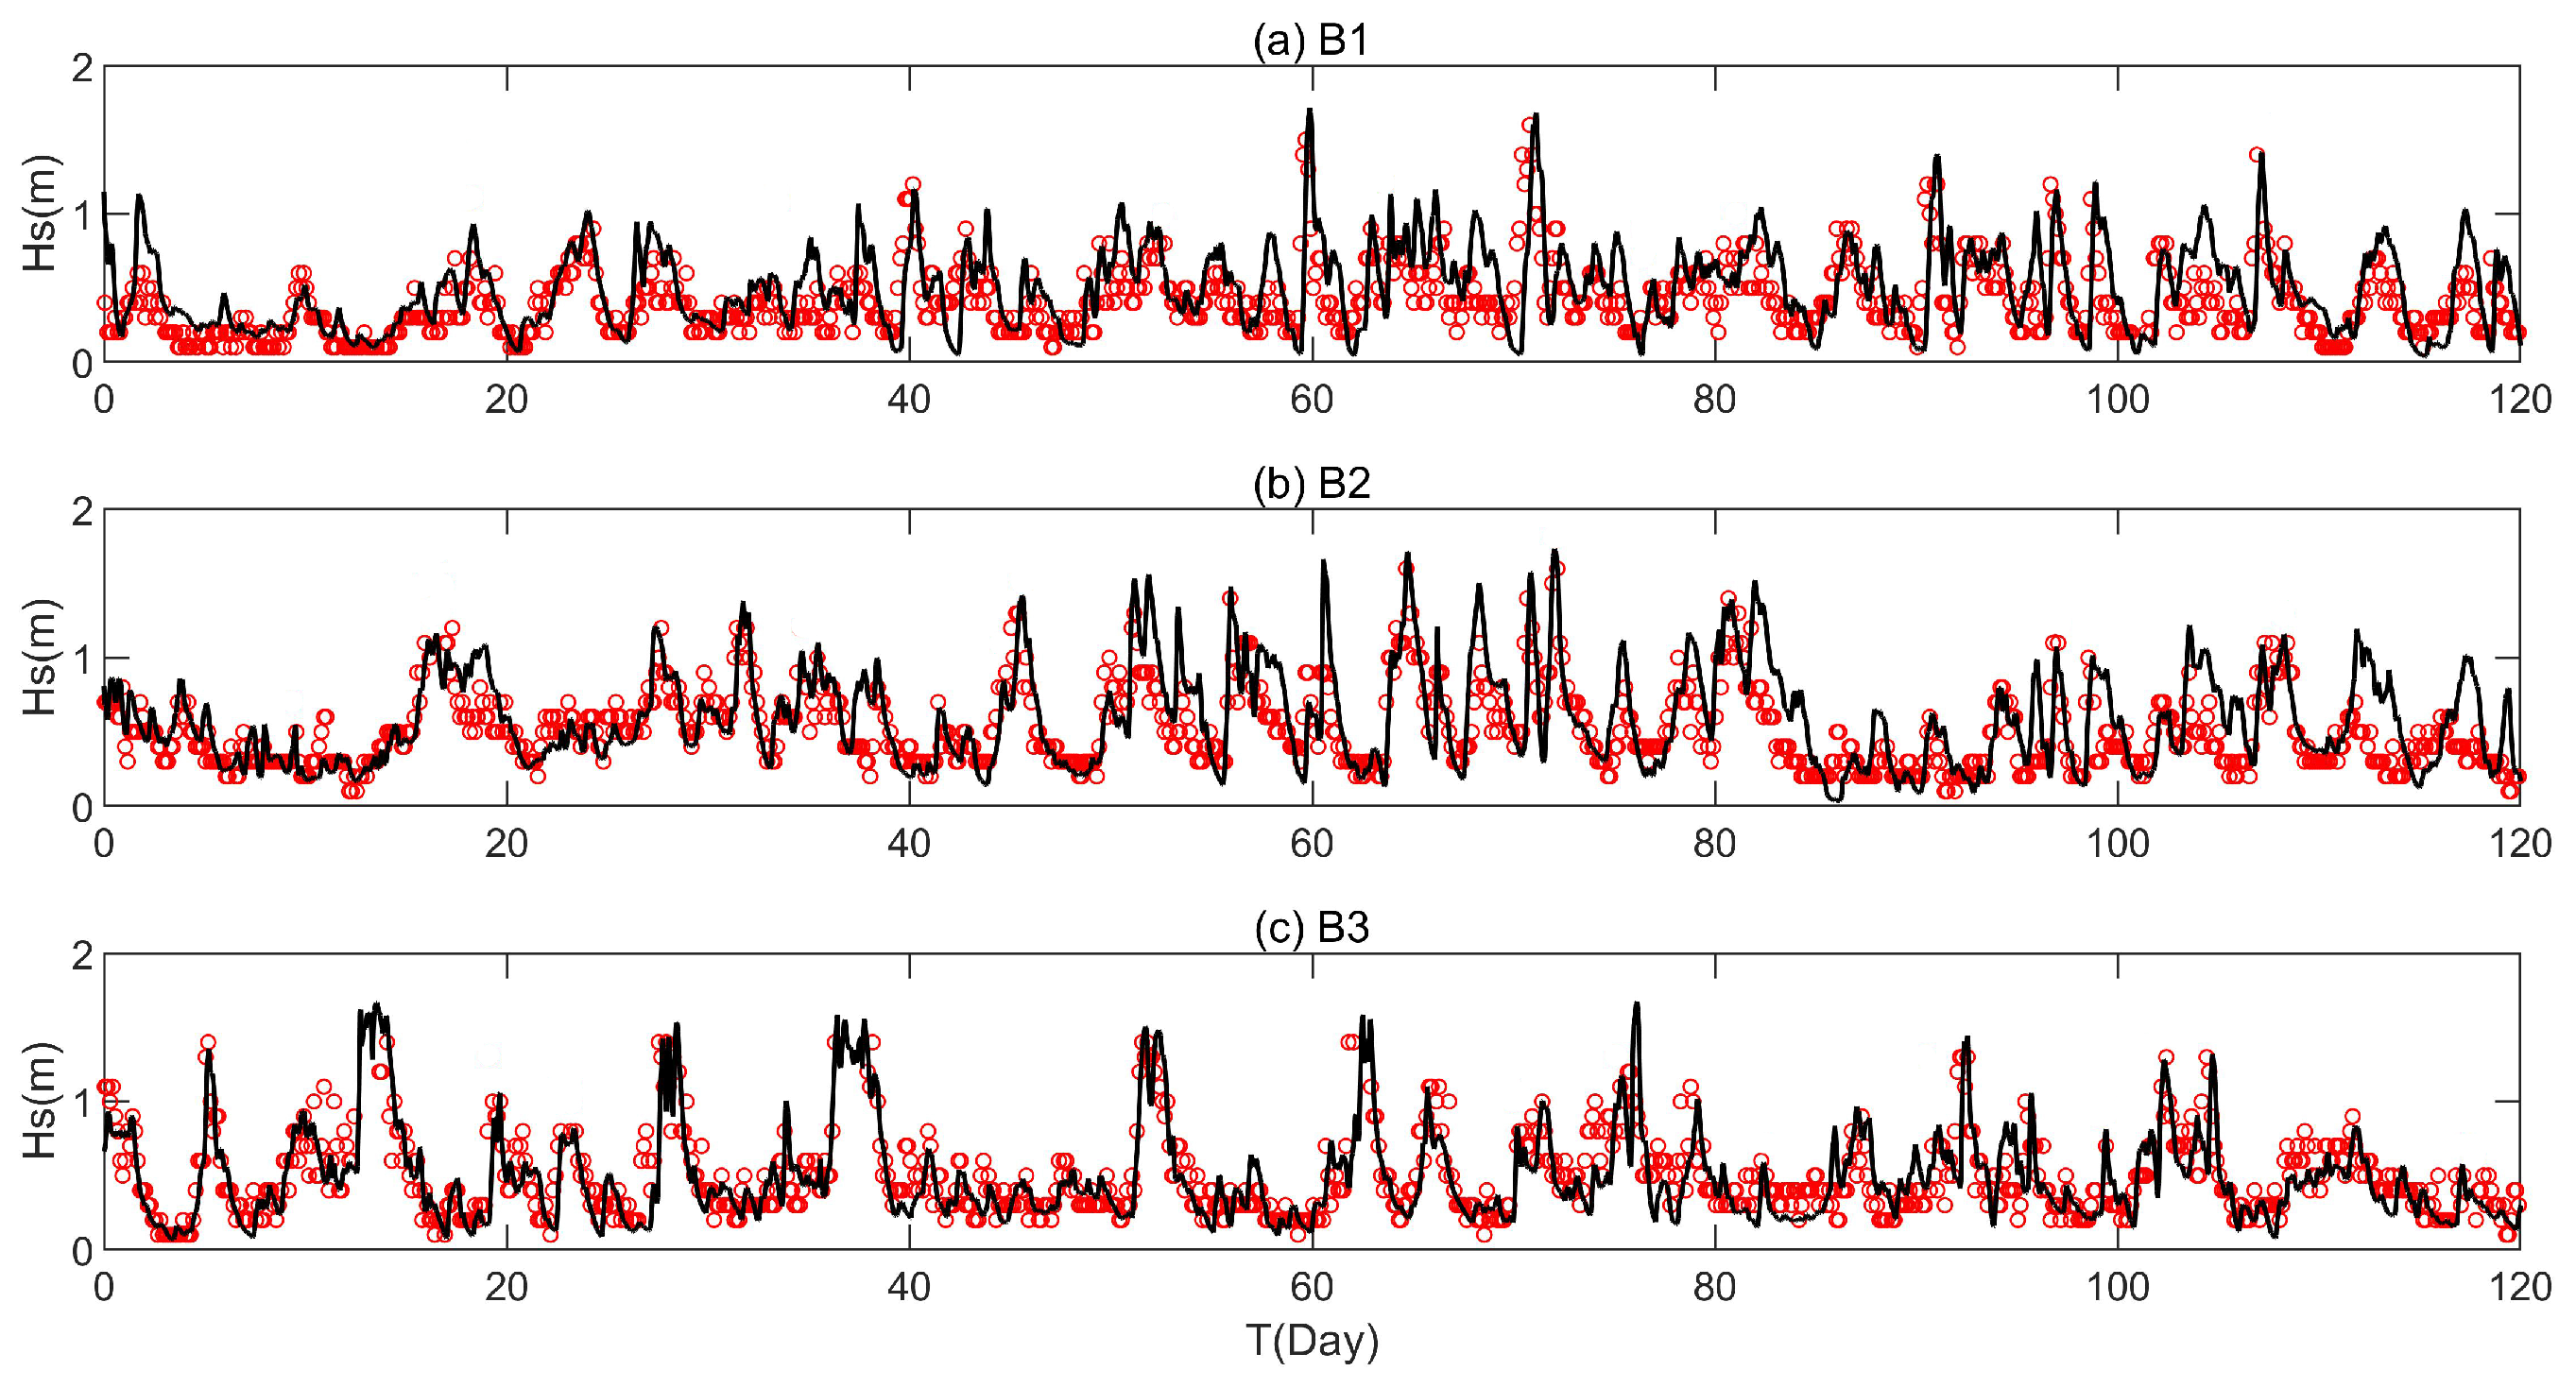
In order to evaluate the accuracy of the model for simulating waves, three buoys along the coast of BS and YS (Figure 1) were used to compare wave height and period with those of the wave model. The B1 station is located in the Bohai Sea at 121.7 E, 38.9 N. The B2 and B3 stations are in the Yellow Sea with locations of ( 120.4 E, 36.0 N) and ( 120.1 E, 34.4 N), respectively. Figure 2 and Figure 3 show the comparisons of the calculated results of the significant wave heights (Hs) and mean periods (MP) of these three buoy stations from September to December 2016 with the measured data. The calculated results of the model agree well with the buoy measurements for both Hs and MP.
In order to quantitatively analyze the model calculation errors, the values of NB and HH are shown in Table 1. The values of NB between calculated and measured Hs ares less than 0.04, while the NB values of MP are less than 0.05. All the MP values provided by the model are underestimated, but the underestimation of MP is less than 5%. The maximum values of HH are 0.19 for Hs and 0.17 for MP.

3.2. Mean Wave Characteristics in the BS and YS

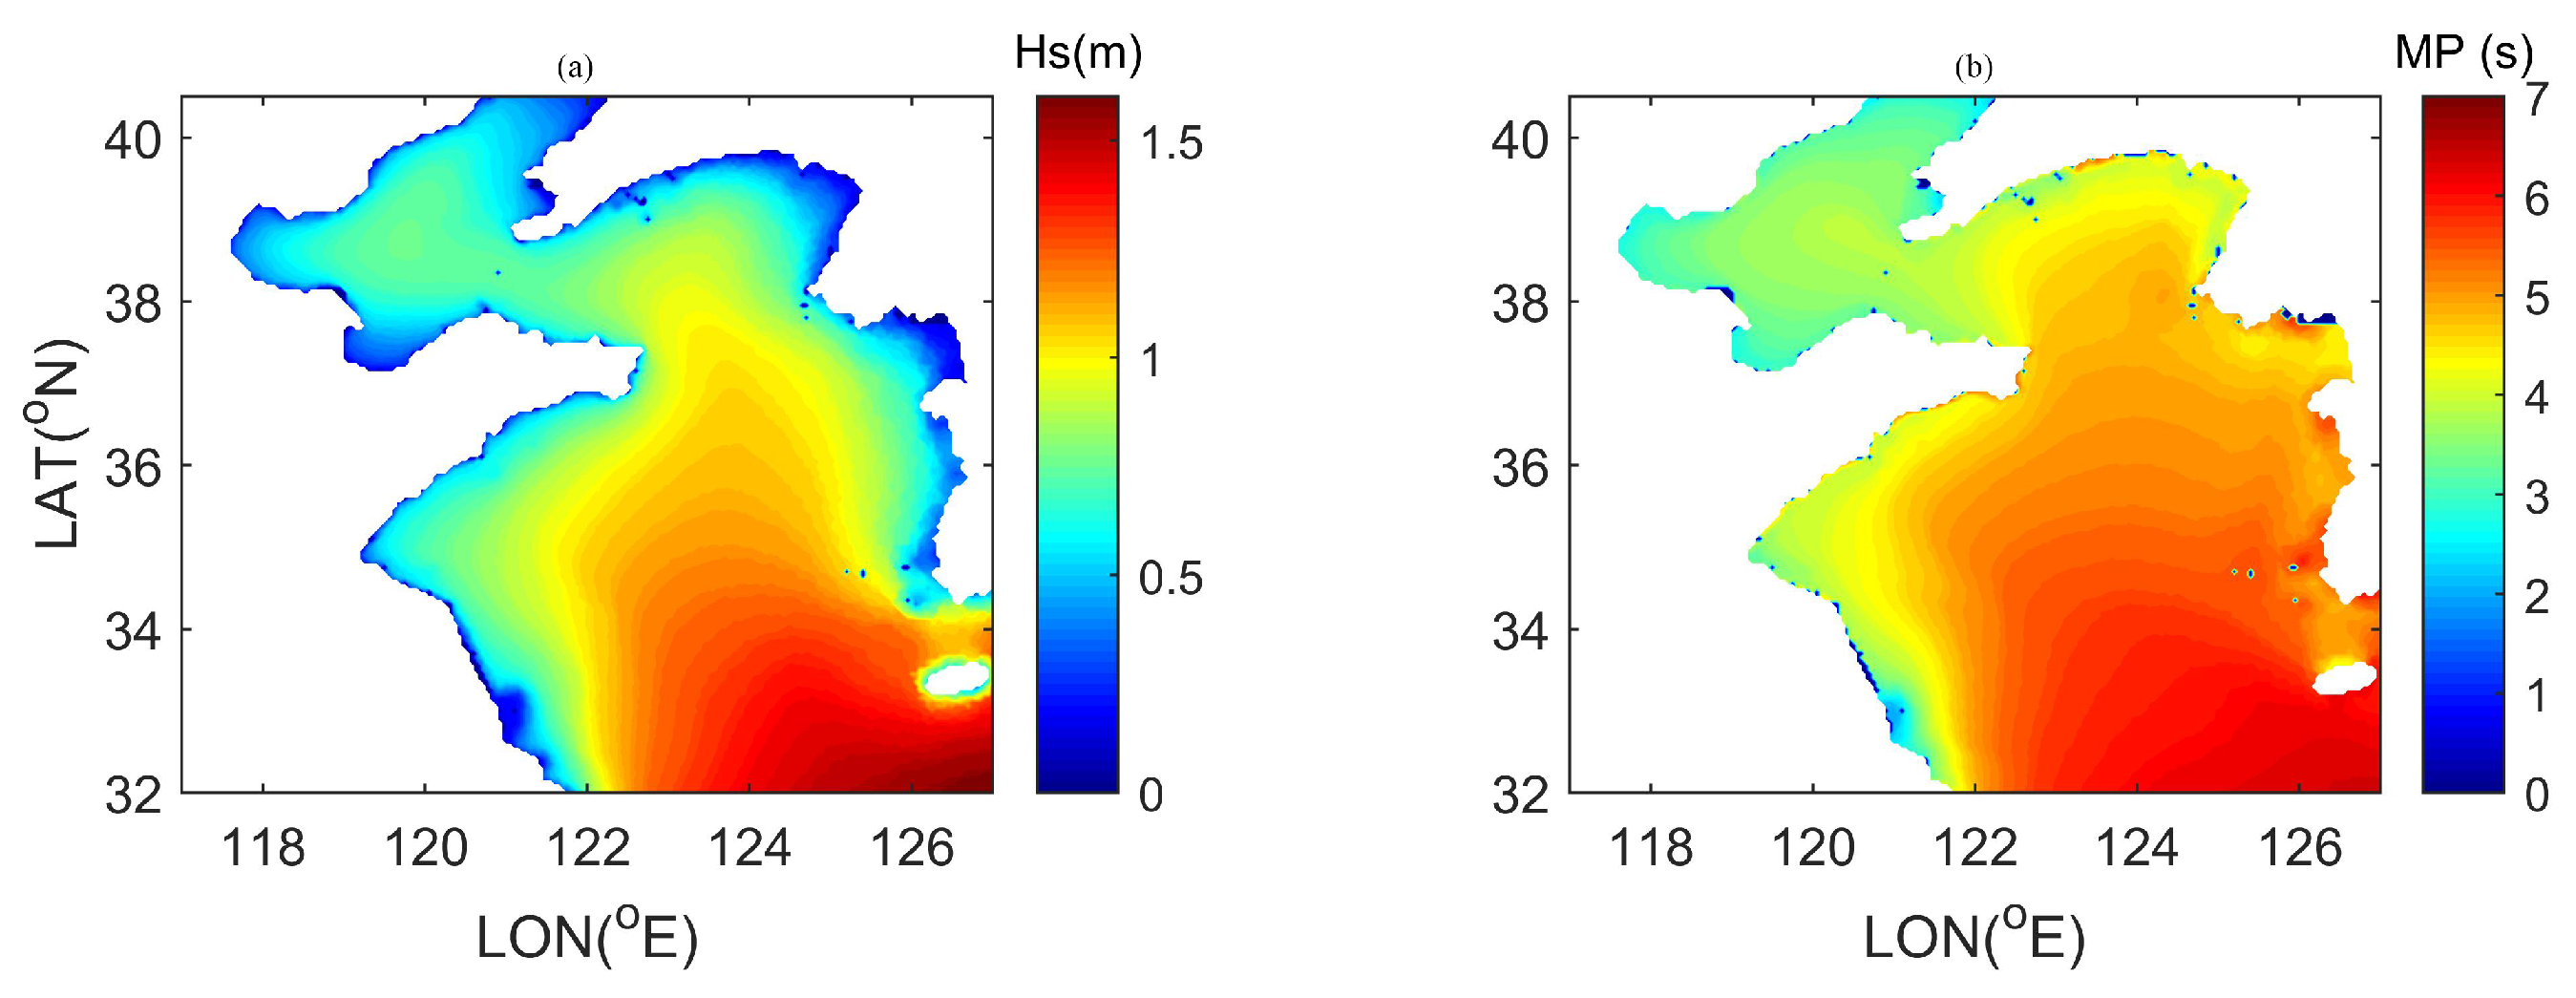
Figure 4 shows the mean values of simulated Hs and MP values from 1979 to 2018. The BS and YS are semi-enclosed by the Chinese Mainland and the Korean Peninsula. Swell waves generated in the Pacific Ocean can only impact the BS and YS from the south. Thus, the mean values of Hs decrease from south to north, and the maximum values are located at the southern part of the YS with amplitude within 1.6 m. The mean values of Hs in the BS are less than 1 m. The mean values of MP in the YS are larger than the values in the BS. The mean MP values over the 40 years in the center and southern parts of YS are about 6–7 s, and are 3–4 s in the coastal areas. In the BS, the maximum values of mean MP are around 4 s in the center part, and decrease to less than 3 s in the coastal areas.
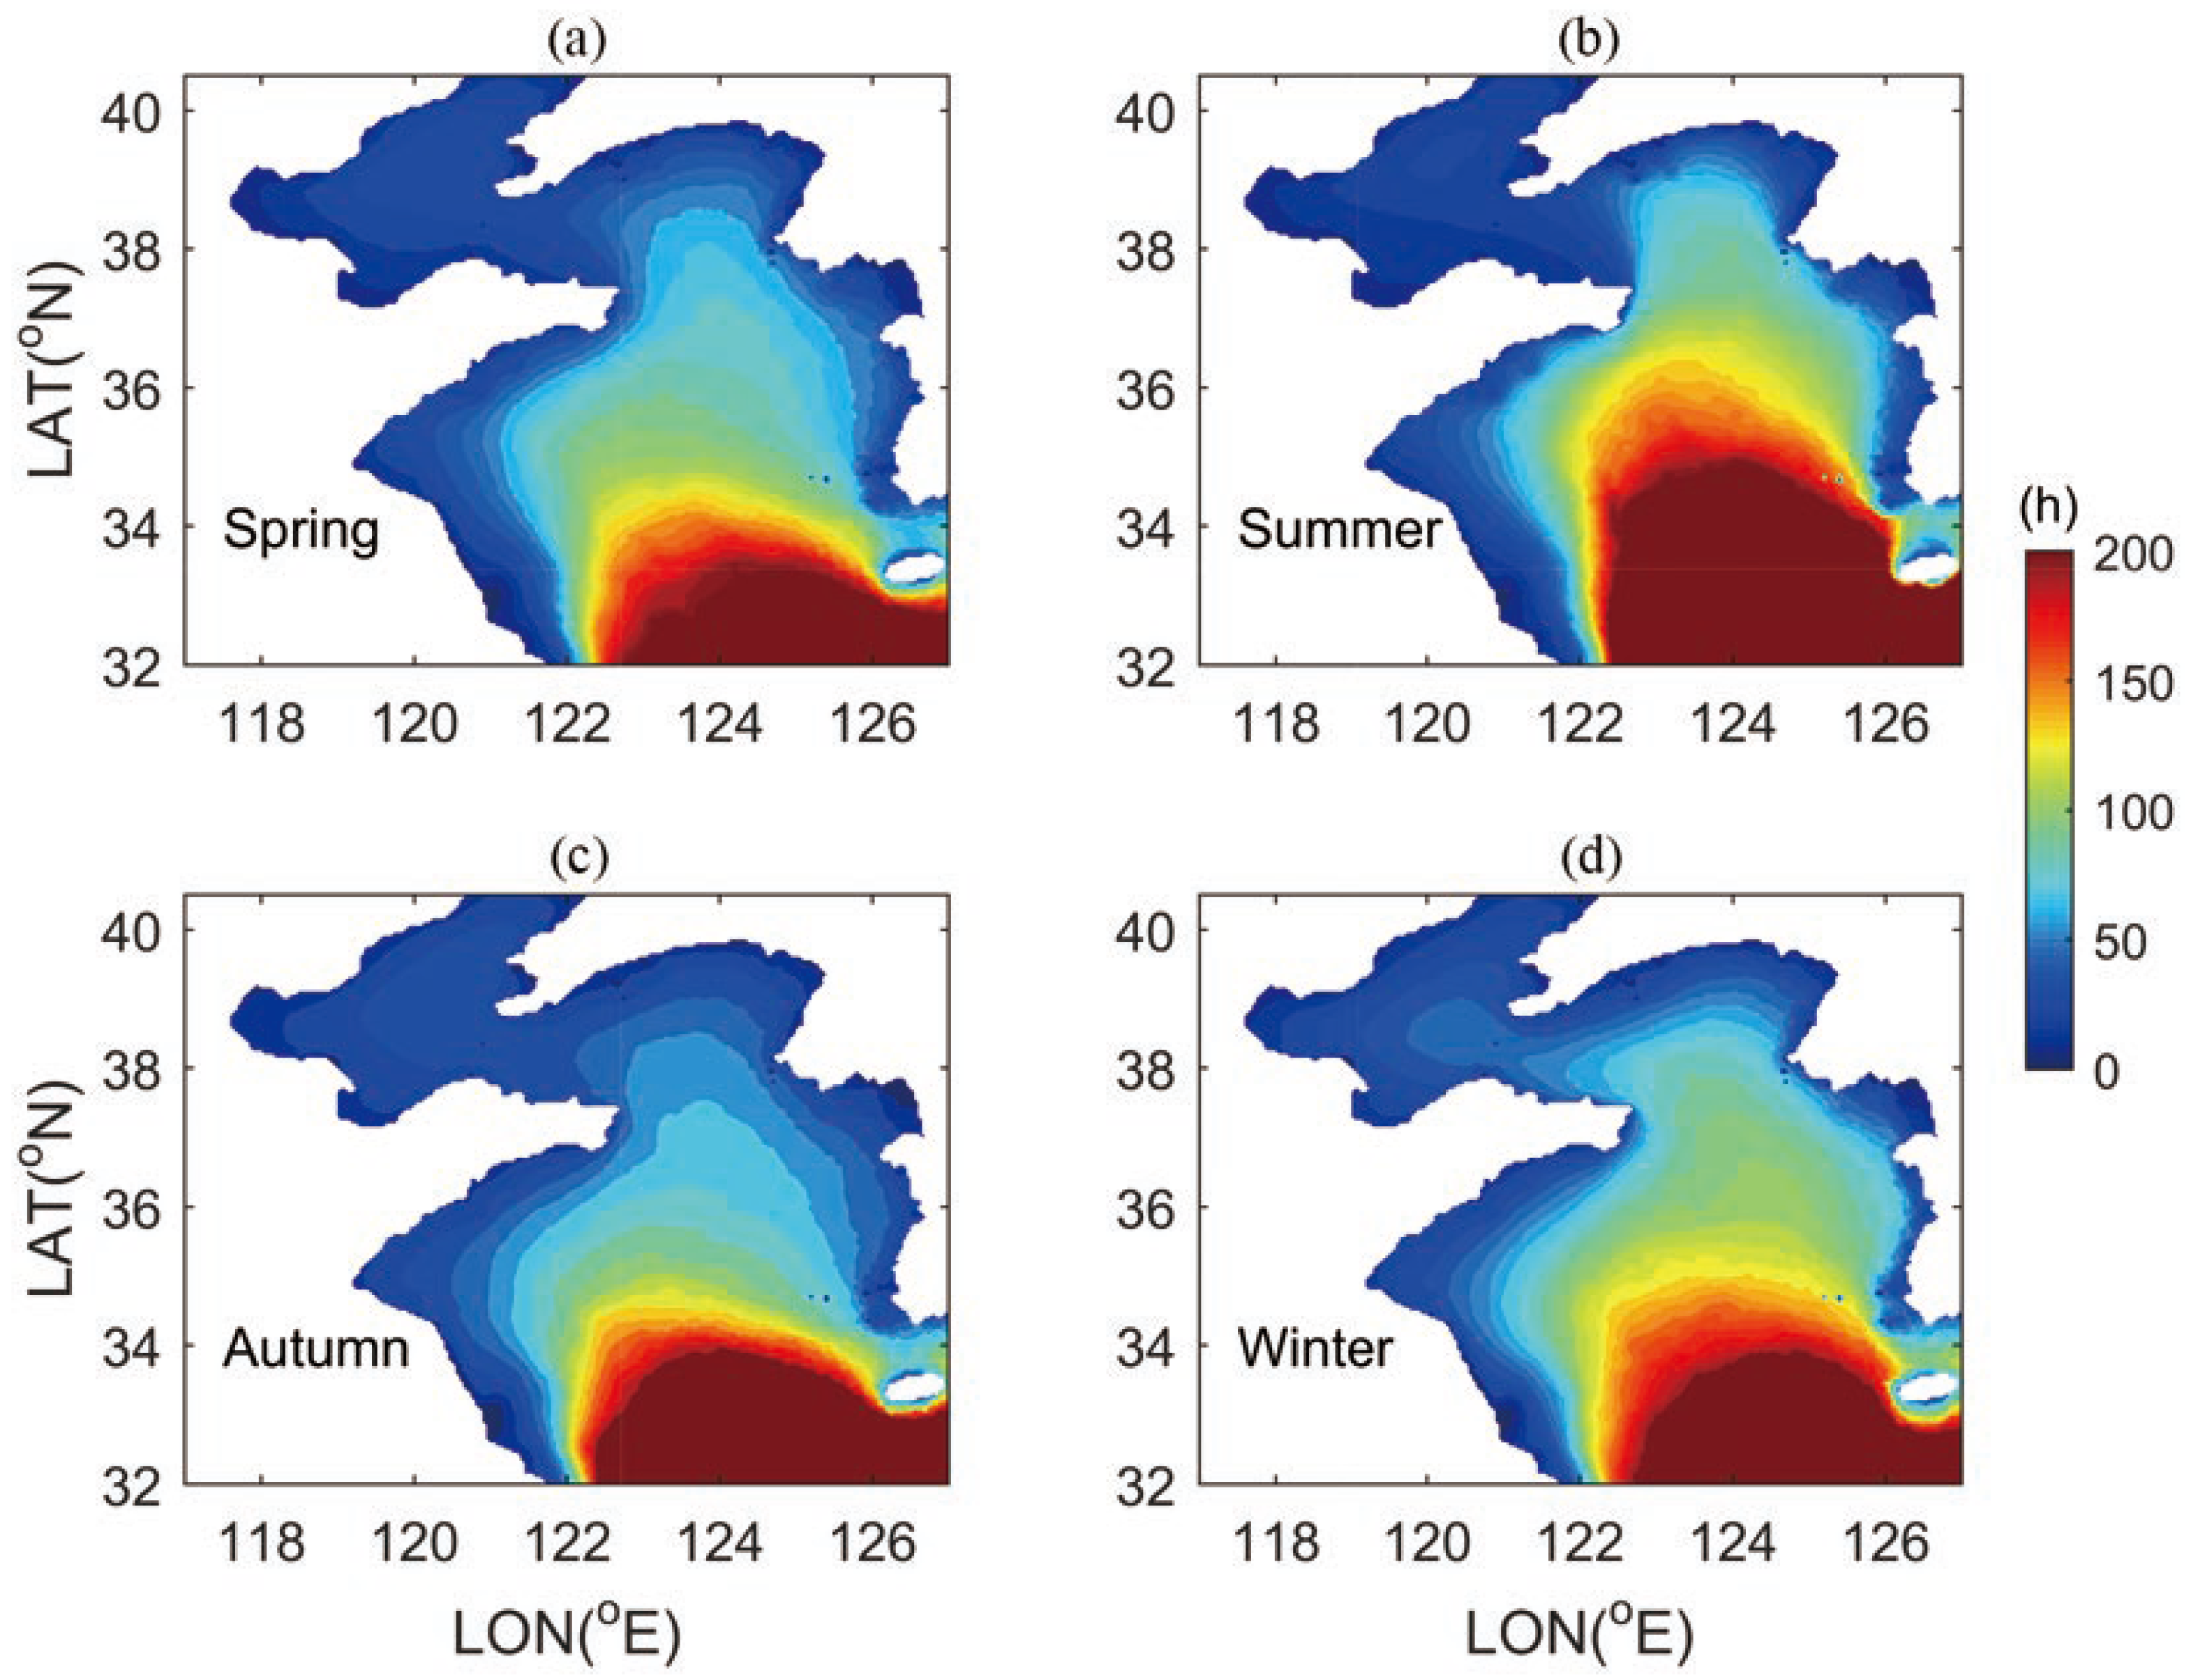
In order to assess the features of the spatiotemporal distribution of wave parameters, their average values corresponding to every season—spring (March–May), summer (June–August), autumn (September–November), and winter (December–February), were calculated. Figure 5 shows the spatial distribution of the seasonal mean Hs. The mean Hs are at a maximum in winter. The maximum values of Hs are located at the southern central part of the YS with values of more than 1.5 m. The mean values of Hs in spring and summer are significantly lower. For instance, maximum values of mean Hs were less than 1.2 m and the areas with mean Hs exceeding 1 m were all in the southern YS. An intensification of Hs was observed in autumn. In that season, the maximum values of Hs were larger than 1.5 m, but the areas with more than 1.5 m values were less common than those in winter.
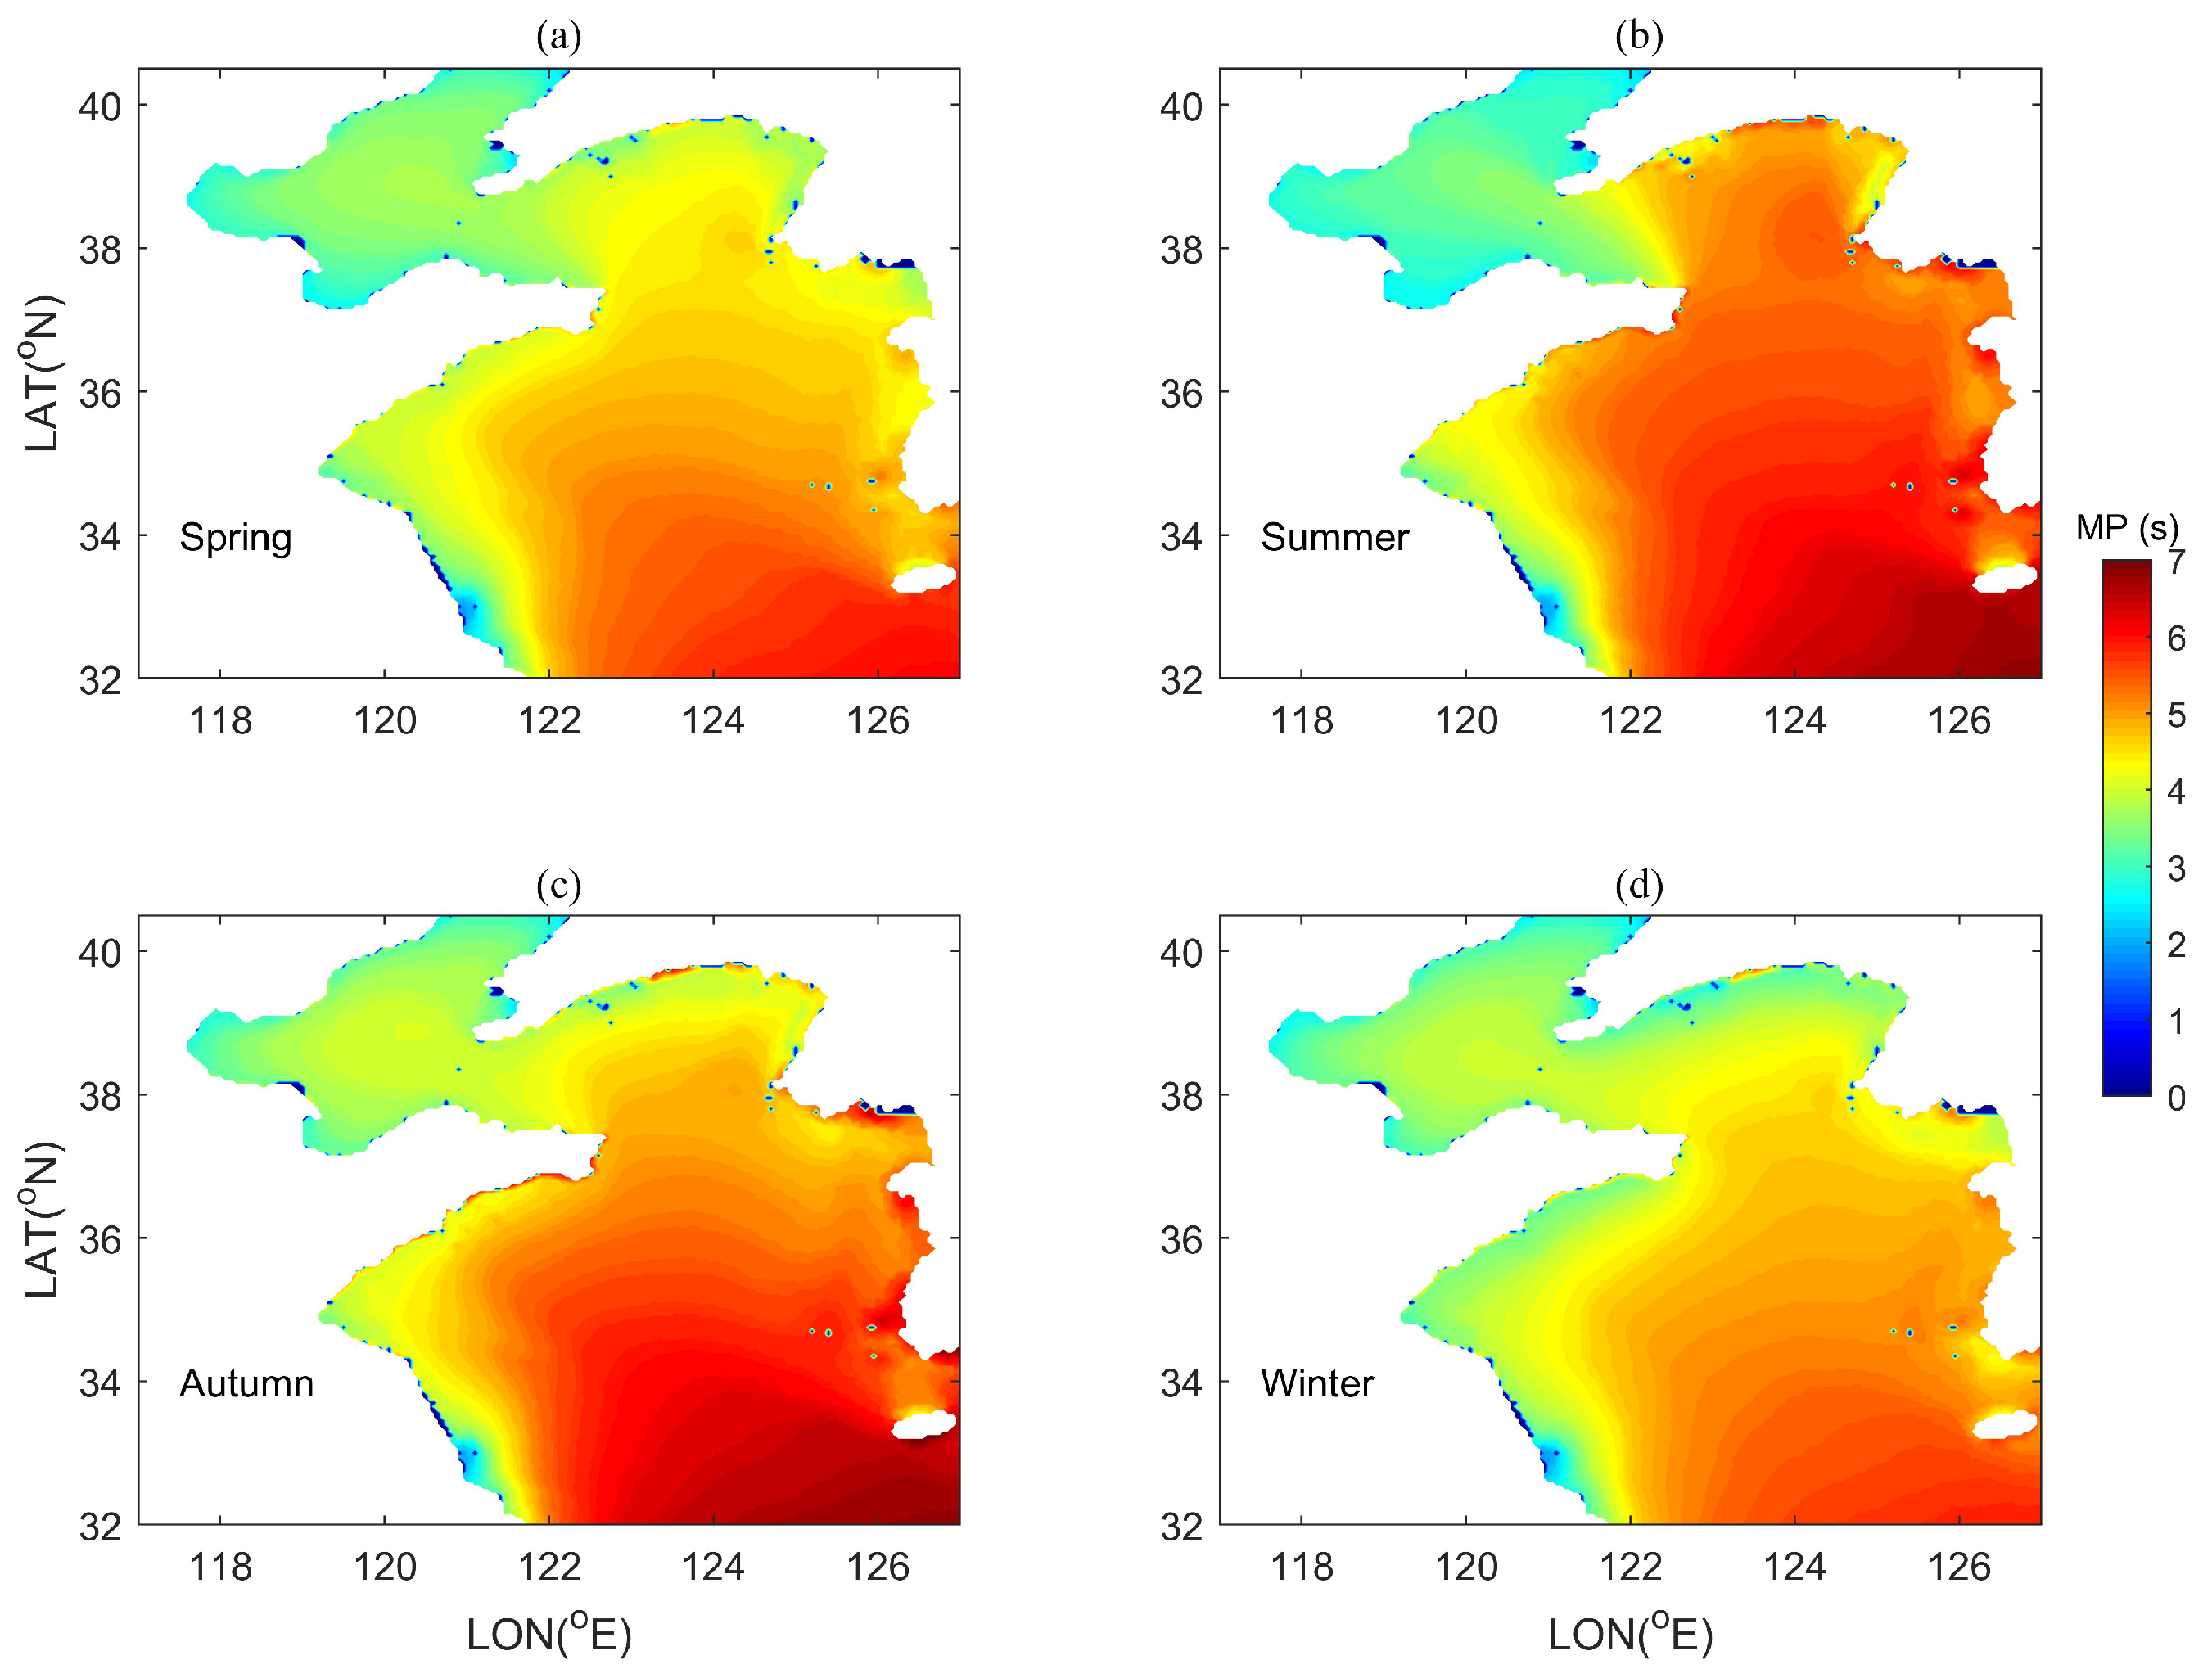
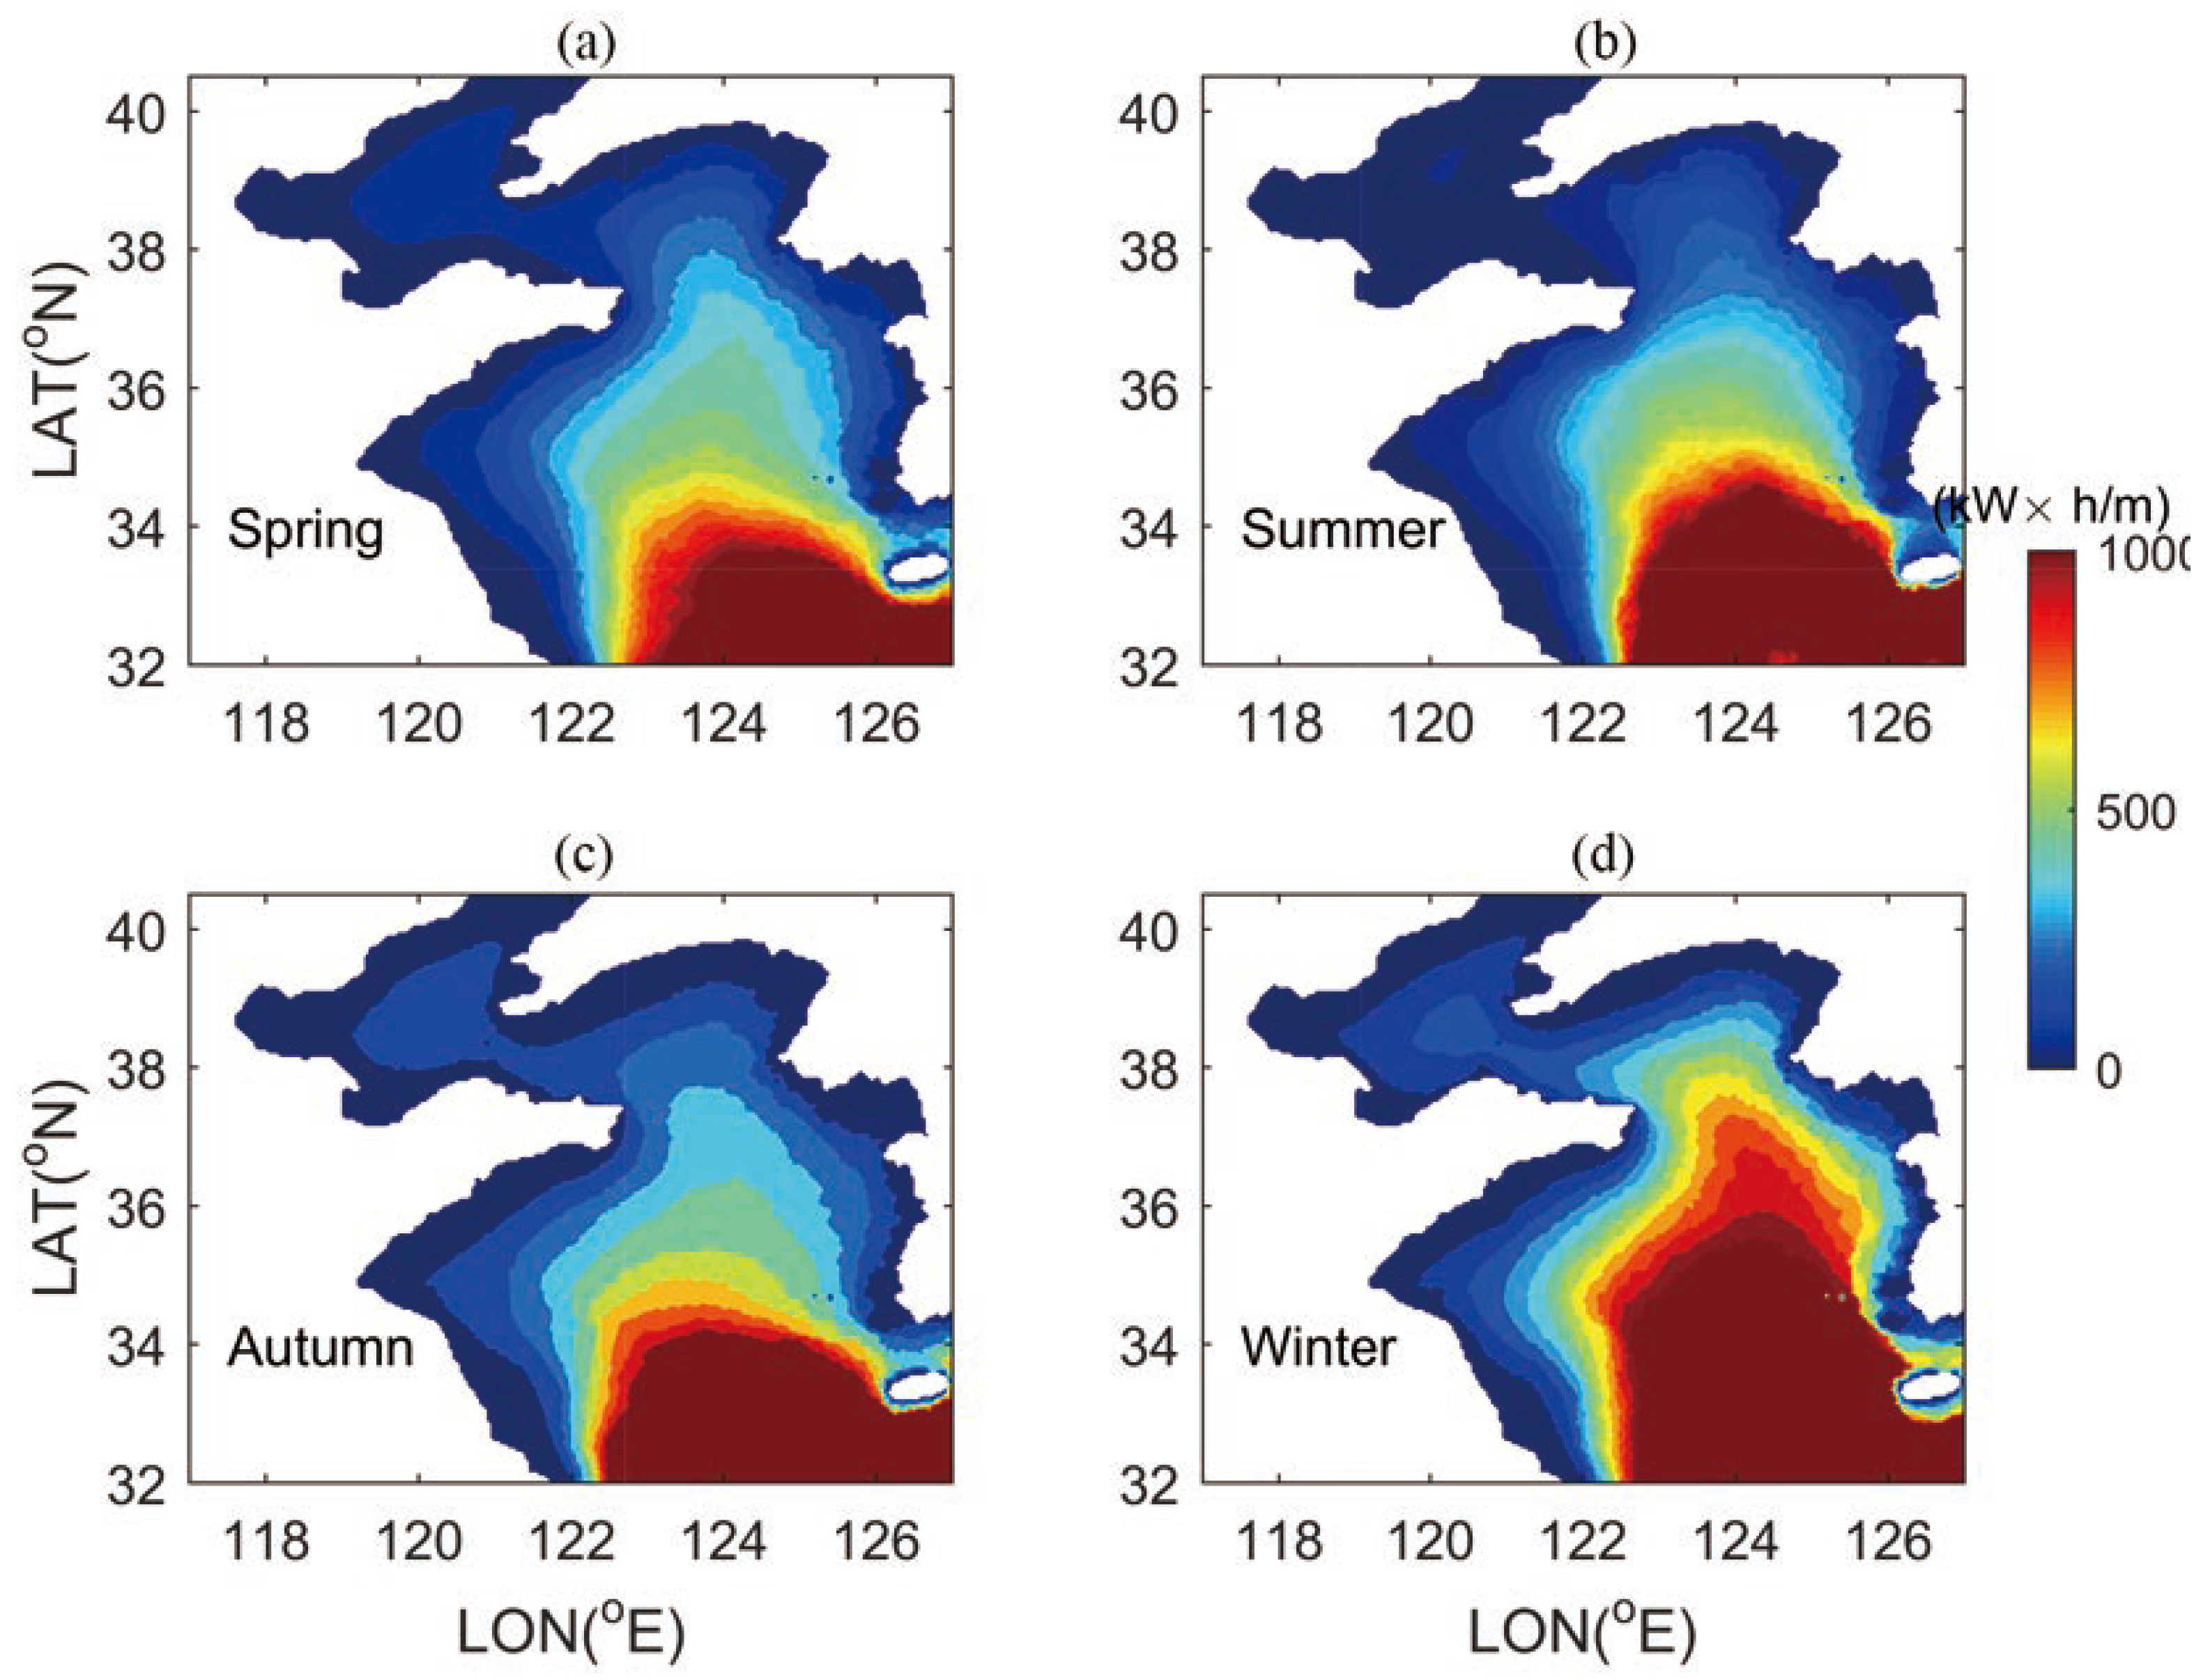
The seasonal mean MP distribution is shown in Figure 6. The maximum MP occurred in summer and autumn in the southern part of the YS. The maximum values of mean MP were larger than 7 s. As tropical cyclone events occurred frequently in this period, the maximum values of mean MP were induced by long swells during extreme typhoon events [34,35]. In winter and spring, the mean values of MP were relatively lower with maximum values of 5 s in the southern part of YS and less than 4 s in the BS.

3.3. Spatial and Temporal Distributions of the Wave Energy Potential

The wave power flux (WPF) can be obtained from the Equation (5). By calculating the temporal and spatial distributions of WPF, the characteristics of wave energy in the BS and YS can be assessed.
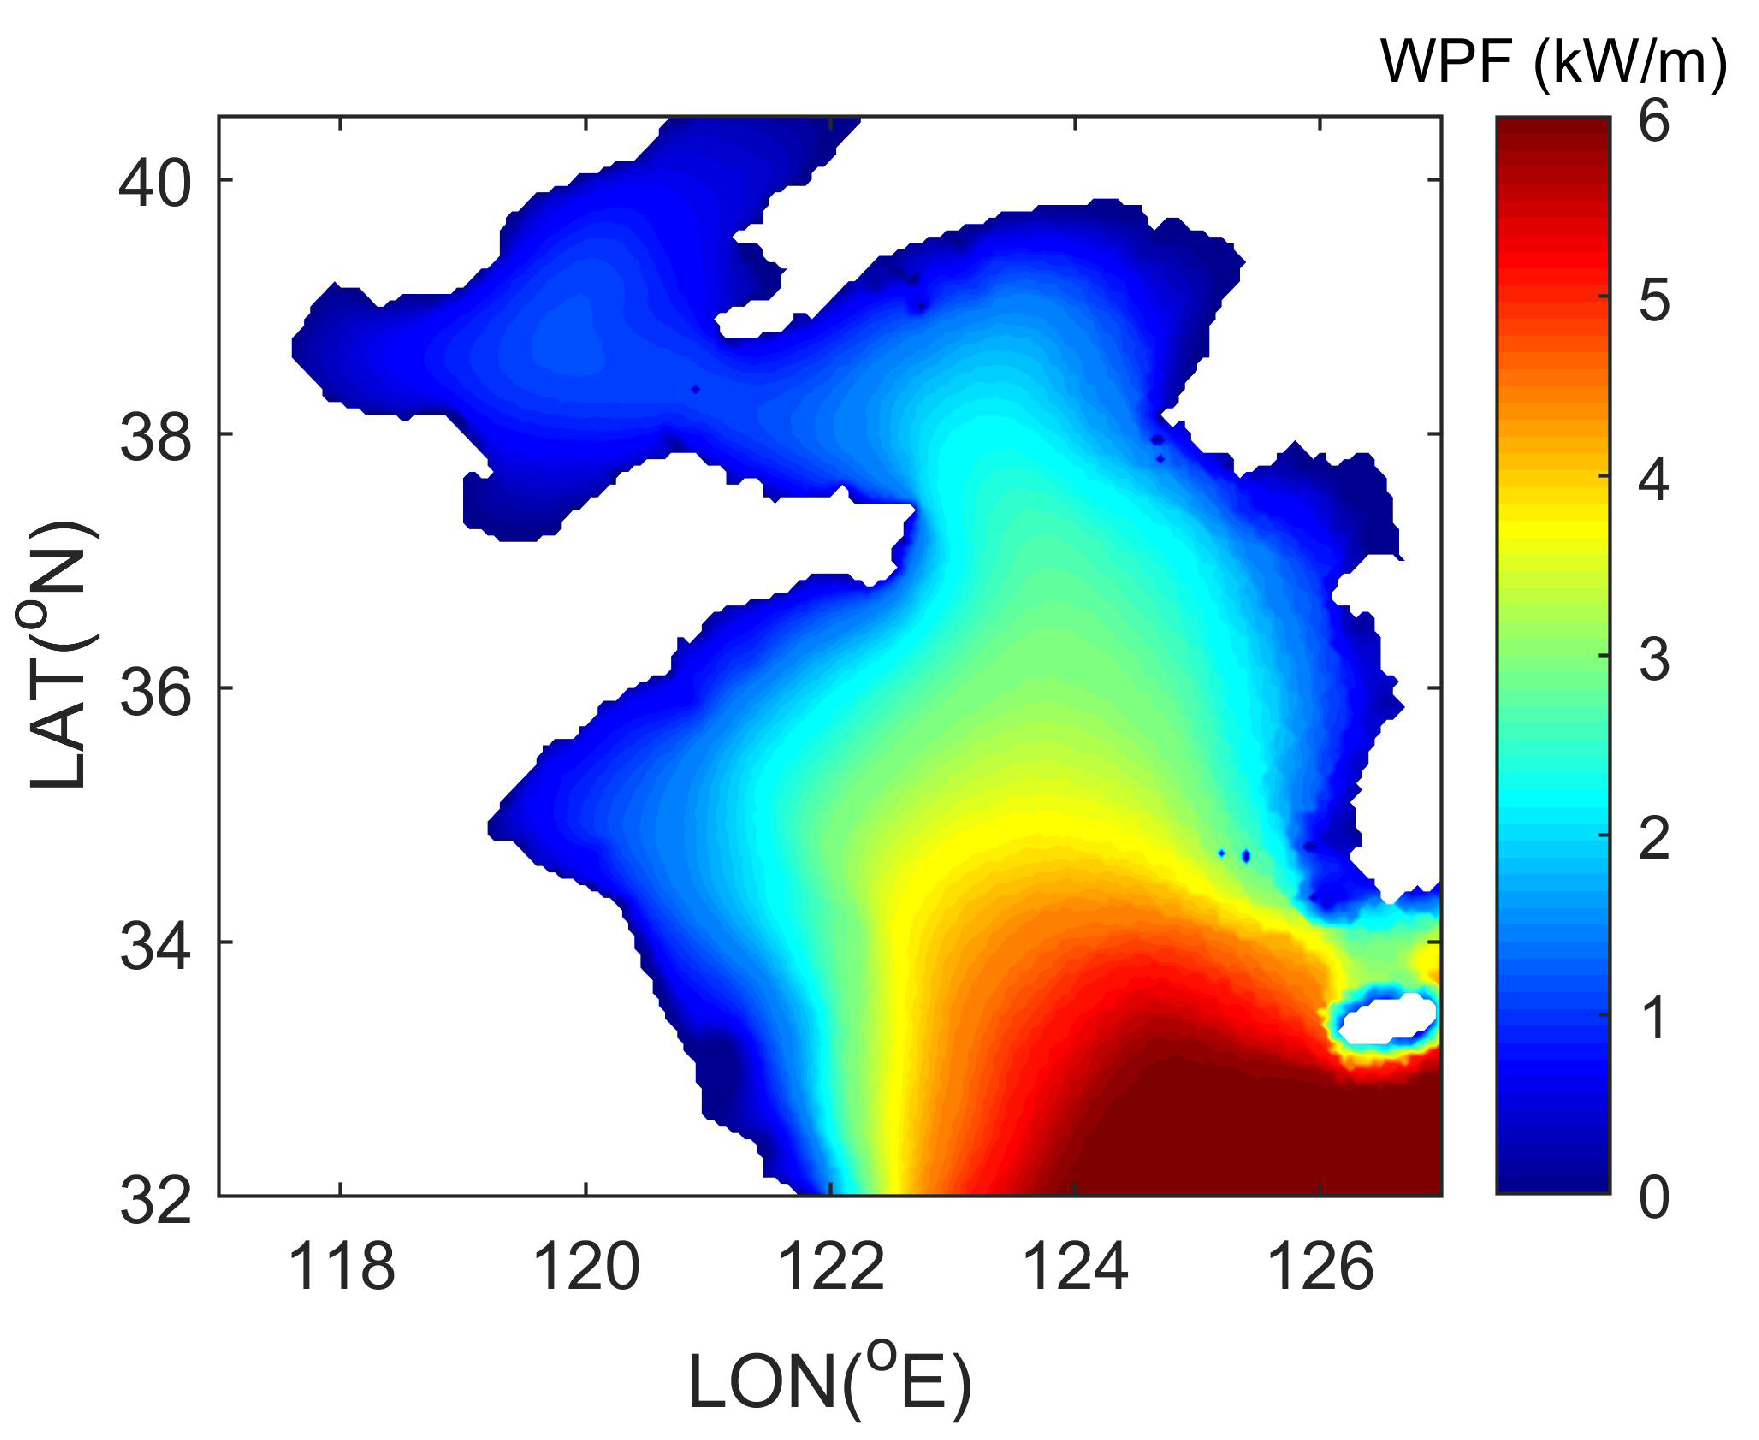
Figure 7 shows the features of the spatial distribution of mean WPF over the computed period from 1979 to 2018. It is obvious that the WPF in the deep sea is larger than in coastal zones. The largest values appear in southeast part of the numerical domain with WPF values of 8 kW/m. The wave energy increases gradually from north to south and from nearshore to offshore, with WPF values of less than 2 kW/m in the BS and nearshore areas of the YS.
Figure 8 shows the spatiotemporal distribution of mean WPF corresponding to the four seasons. Average WPF values are at a maximum in winter and autumn. The range of areas with WPF values of larger than 2 kW/m extends to nearshore areas in the YS and the central part of the BS. In spring and summer, the values of WPF are significantly lower. For instance, maximal values of mean WPF do not exceed 5 kW/m in spring.

4. Exploitable Wave Energy

Figure 9 shows the annual mean parameters of the exploitable wave energy events in the BS and YS. The distribution of wave energy event number is presented in Figure 9a. A large wave energy event number means the exploitable wave energy is unstable as the corresponding energy event duration is small. The maximum values of the number are larger than 200 in the west part of the BS. In the other part of the BS, the numbers are around 130–180. Turning to the YS, the numbers of wave energy event number are about 140–150 in the nearshore areas. In the offshore areas of the YS, the numbers decrease to less than 50. Therefore, the exploitable wave energy is most stable in the offshore areas of the YS. In the coastal areas of the YS and the whole BS, the wave energy resources are scarce and unstable.
Contrarily, Figure 9b shows the distributions of the annual mean duration and energy storage with a different pattern compared to Figure 9a. The longest durations are located at the southern part of the YS, with values of more than 200 h. The values of the duration decrease to 100–150 h from the central to the north part of the YS. Close to the coastline of the YS and in the BS, the values of duration are less than 50 h. The distribution of energy storage of the energy event (Figure 9c) is similar to that of the duration (Figure 9b). In the south part of the YS, the mean energy storage of each energy event can be up to 1000 kWh/m, whereas the values of the energy storage are less than 100 kWh/m in the nearshore areas of the YS and BS.
Figure 10, Figure 11 and Figure 12 show the seasonal means of the wave energy event number, duration, and energy storage. A significant inter-seasonal variability of the wave energy event can be noticed. For instance, the number of the wave energy events can be more than 40 in spring and summer in the BS and nearshore areas of the YS, while the values decrease to approximately 30 in autumn and winter. In the southern part of the YS, the number is less than 10, indicating the Hs is larger than 0.5 m in most time of this region. In the northern part of the YS, the minimal value of the number occurs in summer with values of about 15. Similarly to the annual mean values, the distribution of duration shows a contrary pattern compared with the wave energy event numbers. The duration time shows a maximum in the south part of the YS, and decreases from south to north and from offshore to nearshore. In the BS and nearshore areas of the YS, the maximum values of duration occur in winter, which means the wave energy in winter is most stable in these regions. For the average wave energy storage, the values also are at a maximum in winter as the wave energy devices can continuously absorb wave energy with long duration and intensive WPF (Figure 8).

5. Wave Energy Assessment on Location Scale

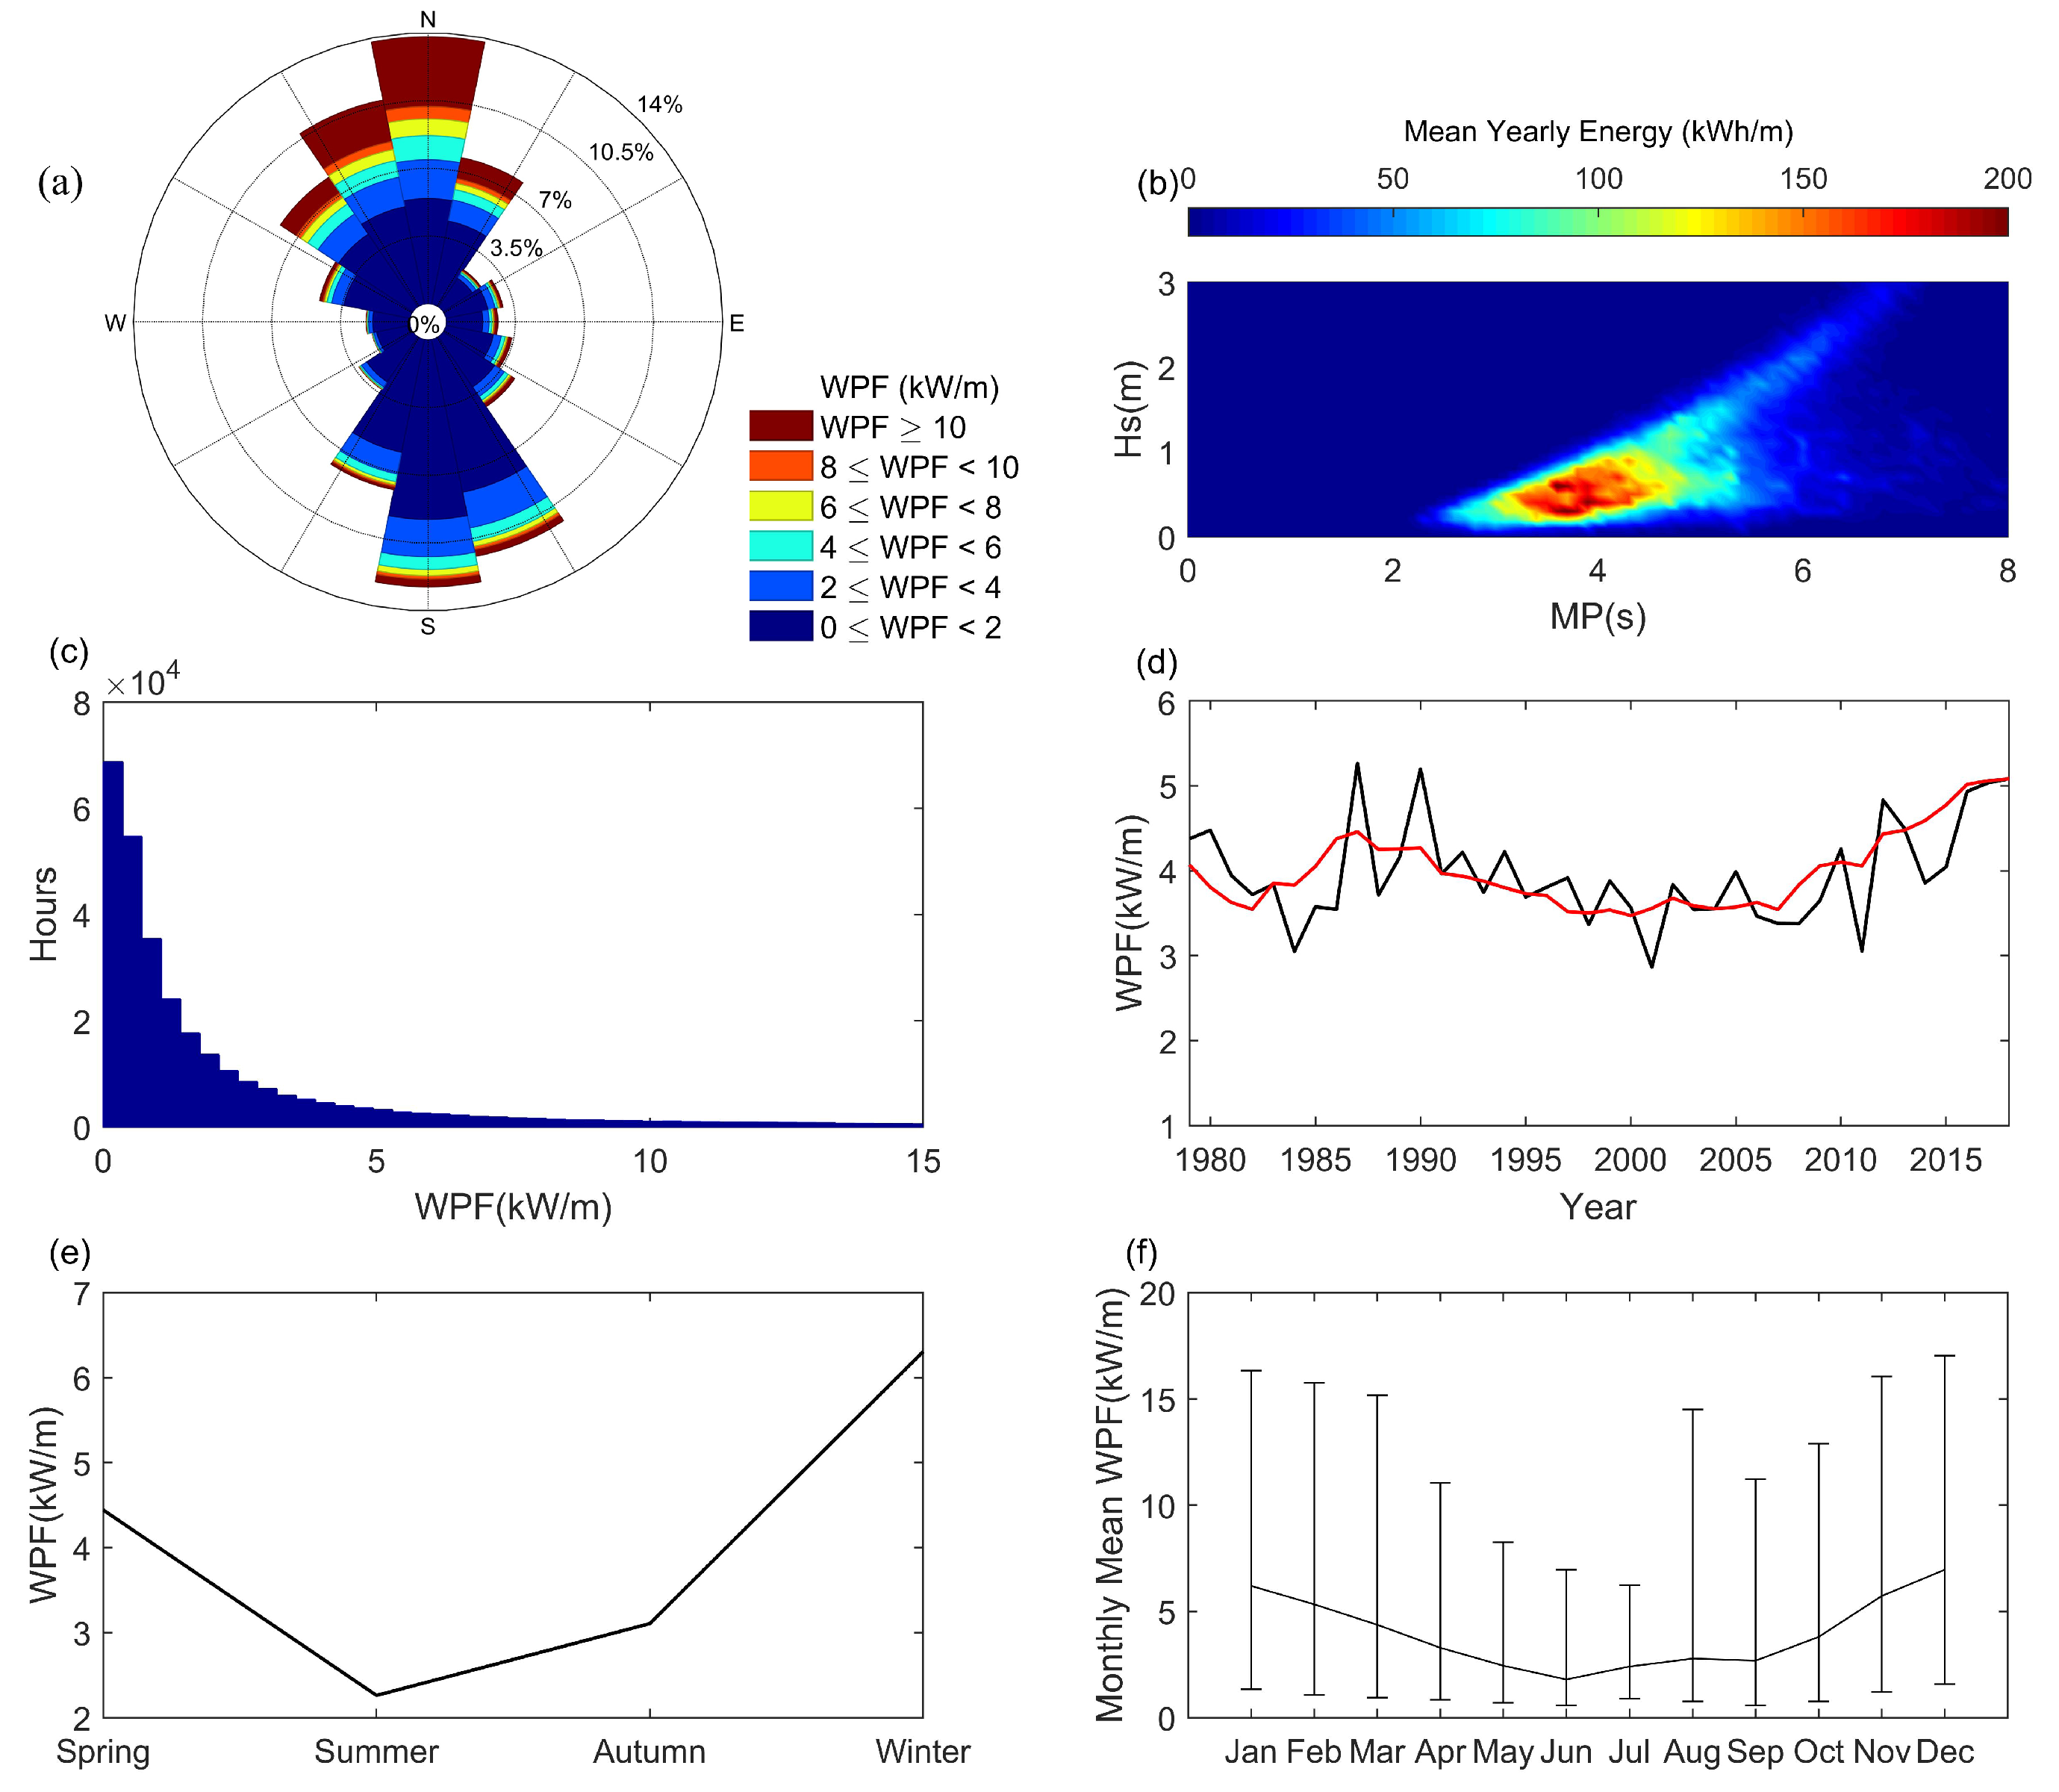
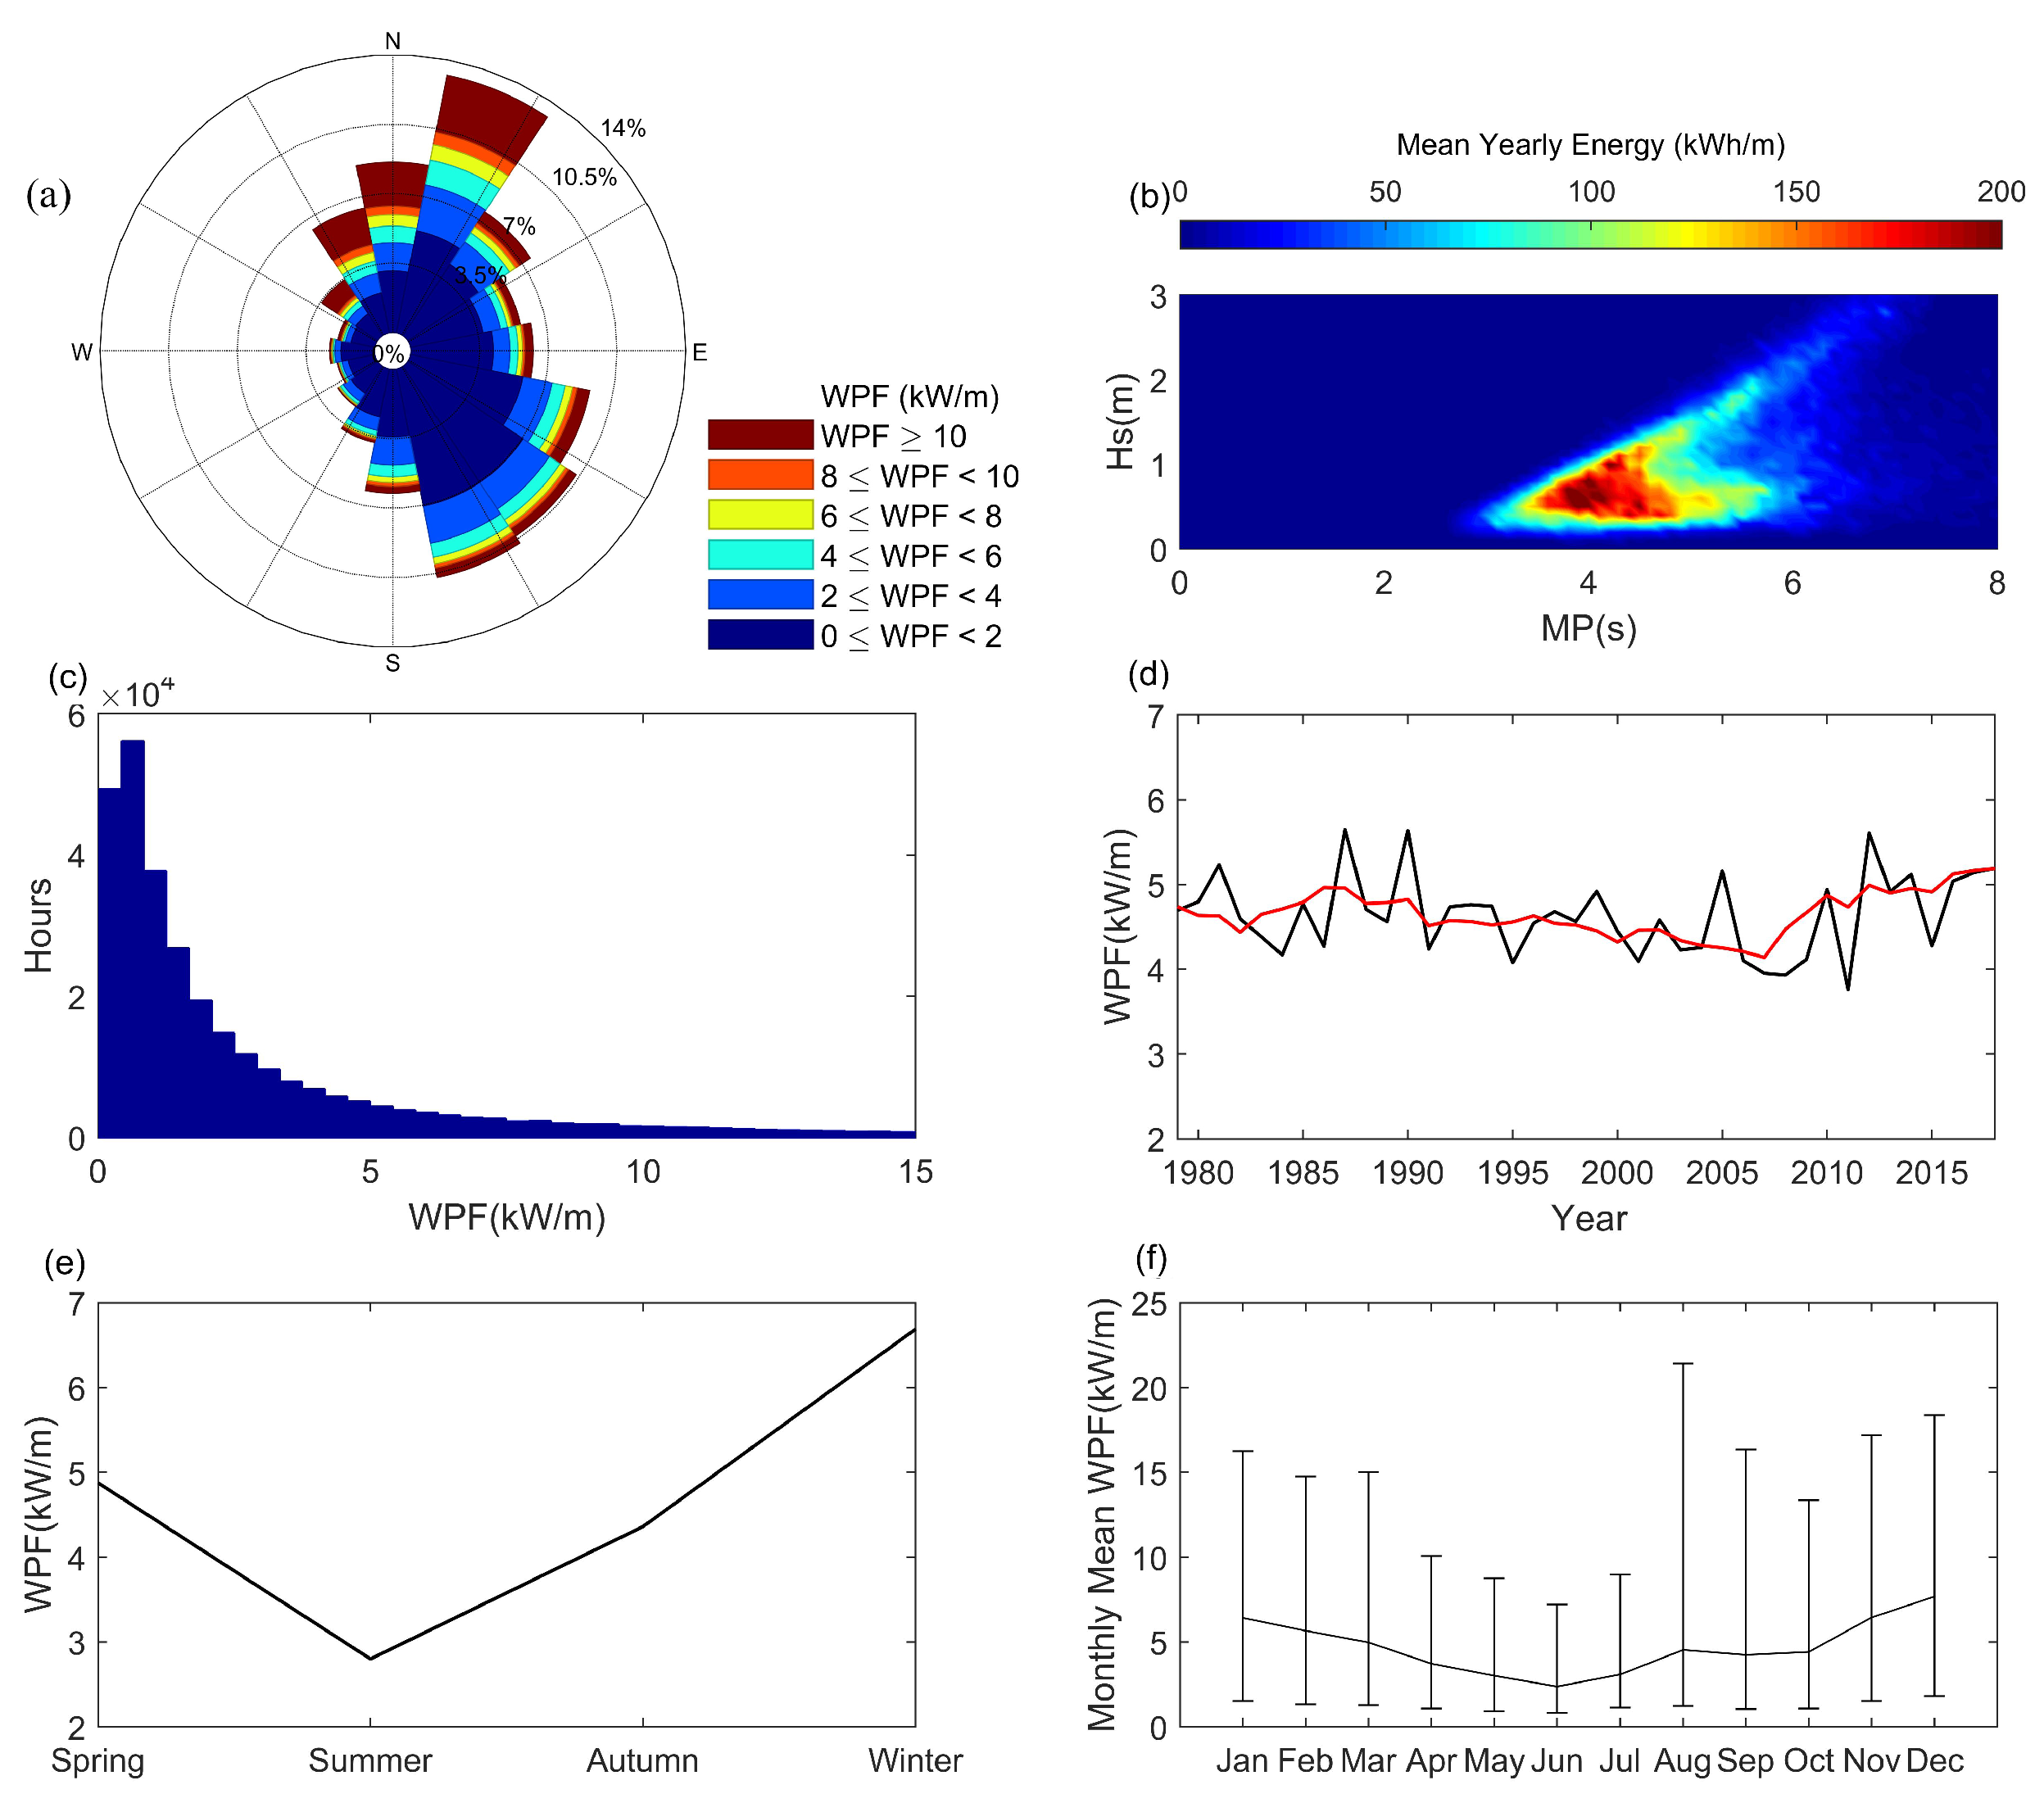
According to the above-basin scale analysis of wave energy, two promising resource exploitation locations were chosen (A1 and A2 in Figure 1). The wave power rose; distribution of wave power as a function of Hs and MP; persistence of the wave power in hours; and yearly, seasonal, and monthly mean wave power for the two locations are presented in Figure 13 and Figure 14.
Figure 13a shows the energy rose on A1. The wave energy mainly comes from the north in winter and the south in summer. In the choices and installation of wave energy harvesting devices, the spread of wave energy in Figure 13, are important. Figure 13b shows the wave power matrix. The yearly mean wave energy was calculated in bins of 0.1 m and 0.1 s, and plotted as a function of Hs anf MP. This matrix can be used to estimate the energy converter efficiency according to the specific WEC devices ([28]). Figure 13c presents wave energy persistence, which is needed for design of WEC in evaluating the most common wave conditions.
Figure 13d–f shows the inter-annual and intra-annual variation of the energy resource. In panel (d), the trend of yearly mean wave power is revealed. The yearly mean wave power first decreased from 1979 to 1982, and increased until 1988. During the 1990s the values of wave power slightly decreased, but began to increase again in 2006. The seasonal mean wave power in panel (e) is similar to those shown in Figure 8. The wave energy is most intensive in winter with seasonal mean values of 6.7 kW/m on A1, while the minimum value is in summer with mean wave power of lower than 3 kW/m. Figure 13f shows the wave power characteristics on a monthly basis: the monthly mean wave power, positive and negative square root from 1979 to 2018. The deviation from month to another is consistent with the seasonal mean values. The maximum value of the square root occurs in August, revealing that the extreme wave events in summer can induce large wave power, but are also hazards for the WECs structures.
The same yearly, seasonal, and monthly wave power characteristics can be observed on A2 in Figure 14. The only differences are in the direction of wave energy. Influenced by the coastal topography, the wave power comes mainly from the northeast and southeast directions.

6. Conclusions

In the present study, the wave conditions in BS and YS, China, were calculated by a third generation wave model TOMAWAC. The wave simulations covered 40 years, from 1979 to 2018. A comprehensive evaluation of the model’s skill performance indicated that the model can provide wave data with high accuracy.
The annual and seasonal mean wave conditions are shown based on the 40 year wave hindcast. In the BS and YS, the mean values of Hs decreased from south to north, and the maximum values were located at the south part of the YS with amplitude within 1.6 m. The mean values of MP in the YS were larger than the values in the BS. The mean MP values over the 40 years in the center and south parts of YS were about 6–7 s, and 3–4 s in the coastal areas. In the BS, the maximum values of mean MP were around 4 s in the center part, and decreased to less than 3 s in the coastal areas. The spatial distributions of Hs and MP are generally similar within different seasons. However, the magnitudes of Hs values vary significantly within seasons; it is at a maximum in winter. The maximum values of MP occur in summer and autumn in the southern part of the YS. The maximum values of mean MP are larger than 7 s. The wave energy potential was represented by distributions of the WPF. The largest values appeared in the southeast part of the numerical domain with WPF values of 8 kW/m. The WPF values were less than 2 kW/m in the BS and nearshore areas of the YS. Average WPF values were at a maximum in winter and autumn.
To investigate the exploitable wave energy in the YS and BS, wave energy event was defined based on the threshold value of H s = 0.5 m. The maximum values of the number are larger in the BS and nearshore areas of the YS, but the duration of a wave energy event in such a region is the shortest. The longest-duration events happened in the southern part of the YS, with values of more than 200 h. Turing to the seasonal variation of wave energy events, less wave energy events and longer duration occur in winter. Therefore, from the perspective of spatial distribution, the wave energy in southern part of the YS is more steady than in the other areas. From the temporal variation, wave energy in winter is more suitable for harvesting wave energy. Wave energy devices can continuously absorb wave energy with long duration and intensive WPF in south part of the YS in winter.
Long-term trends of wave power availability suggest that the values of wave power slightly decreased in 1990s, but began to increase in 2006. The wave energy is most intensive in winter and minimal in summer. The maximum value of the square root occurs in August, revealing that the extreme wave events in summer can induce large wave power, but are also hazards for the WECs structures.

Author Contributions

J.D. and J.S. conceived and wrote the draft. J.S., J.D., and H.X. performed the numerical simulations. J.Z. and C.Z. contributed to the analysis and discussion of the results. All authors have read and agreed to the published version of the manuscript.

Funding

This work was supported by the National Key R&D Program of China (2017YFC0405400), the National Natural Science Foundation of China (41930538, 41706087, 51879096), the Natural Science Foundation of Jiangsu Province (BK20170867 and BK20161509), a Project funded by the Chinese Postdoctoral Science Foundation (2018M632220), the Marine Science and Technology Innovation Project of Jiangsu Province (HY2018-15), and the Fundamental Research Funds for the Central Universities (B200202064).

Acknowledgments

The authors would like to acknowledge Experimental Center in College of Harbour, Coastal and offshore Engineering, Hohai University. Numerical simulations were performed at Community Cluster of the Experimental Center.

Conflicts of Interest

The authors declare no conflict of interest.

References

  1. Silva, D.; Martinho, P.; Soares, C.G. Wave energy distribution along the portuguese continental coast based on a thirty three years hindcast. Renew. Energy 2018, 127, 1064–1075. [Google Scholar] [CrossRef]
  2. Haces-Fernandez, F.; Hua, L.; Ramirez, D. Wave energy characterization and assessment in the u.s. gulf of mexico, east and west coasts with energy event concept. Renew. Energy 2018, 123, 312–322. [Google Scholar] [CrossRef]
  3. Mustapa, M.A.; Yaakob, O.; Ahmed, Y.M.; Rheem, C.; Koh, K.K.; Adnan, F.A. Wave energy device and breakwater integration: A review. Renew. Sustain. Energy Rev. 2017, 77, 43–58. [Google Scholar] [CrossRef]
  4. Lopez, I.; Andreu, J.; Ceballos, S.; Martinez de Alegria, I.; Kortabarria, I. Review of wave energy technologies and the necessary power-equipment. Renew. Sustain. Energy Rev. 2013, 27, 413–434. [Google Scholar] [CrossRef]
  5. Liberti, L.; Carillo, A.; Sannino, G. Wave energy resource assessment in the mediterranean, the italian perspective. Renew. Energy 2013, 50, 938–949. [Google Scholar] [CrossRef]
  6. Lanfredi, N.W.; Pousa, J.L.; Mazio, C.A.; Dragani, W.C. Wave-power potential along the coast of the province of buenos aires, argentina. Energy 1992, 17, 997–1006. [Google Scholar] [CrossRef]
  7. Liang, B.; Fan, F.; Liu, F.; Gao, S.; Zuo, H. 22-year wave energy hindcast for the china east adjacent seas. Renew. Energy 2014, 71, 200–207. [Google Scholar] [CrossRef]
  8. Zhang, C.; Zhang, Q.; Zheng, J.; Demirbilek, Z. Parameterization of nearshore wave front slope. Coast. Eng. 2017, 127, 80–87. [Google Scholar] [CrossRef]
  9. Zheng, J.; Zhang, C.; Demirbilek, Z.; Lin, L. Numerical study of sandbar migration under wave-undertow interaction. J. Waterw. Port Coast. Ocean Eng. 2014, 140, 146–159. [Google Scholar] [CrossRef] [Green Version]
  10. The Wamdi Group. The WAM model—A third generation ocean wave prediction model. J. Phys. Oceanogr. 1988, 18, 1775–1810. [Google Scholar] [CrossRef] [Green Version]
  11. Tolman, H. A third-generation model for wind waves on slowly varying unsteady, and inhomogeneous depths and current. J. Phys. Oceanogr. 1991, 21, 782–797. [Google Scholar] [CrossRef]
  12. Booij, N.; Ris, R.C.; Holthuijsen, L. A third-generation wave model for coastal regions, Part 1, Model description and validation. J. Phys. Oceanogr. 1999, 104, 7649–7666. [Google Scholar]
  13. Benoit, M.; Marcos, F.; Becq, F. Development of a third generation shallow-water wave model with unstructured spatial meshing. In Proceedings of the 25th Conference on Coastal Engineering, Orlando, FL, USA, 2–6 September 1996; pp. 465–478. [Google Scholar]
  14. Sterl, A.; Komen, G.; Cotton, P. Fifteen years of global wave hindcasts using winds from the European Centre for Medium—Range Weather Forecasts reanalysis: Validating the reanalyzed winds and assessing wave climate. J. Geophys. Res. 1998, 103, 5477–5492. [Google Scholar] [CrossRef]
  15. Cox, A.T.; Swail, V.R. A global wave hindcast over the period 1958–1997: Validation and climate assessment. J. Geophys. Res. Ocean. 2001, 106, 2313–2329. [Google Scholar] [CrossRef]
  16. Caires, S.; Sterl, A. 100-year return value estimates for ocean wind speed and significant wave height from the ERA-40 data. J. Clim. 2005, 18, 1032–1048. [Google Scholar] [CrossRef]
  17. Kaas, E.; Li, T.S.; Schmith, T. Statistical hindcast of wind climatology in the North Atlantic and northwestern European region. Clim. Res. 1996, 7, 97–110. [Google Scholar] [CrossRef] [Green Version]
  18. Soares, C.G.; Weisse, R.; Carretero, J.C.; Alvarez, E. A 40 year hindcast of wind, sea level and waves in European waters. In Proceedings of the OMAE 2002: 21st International Conference on Offshore Mechanics and Arctic Engineering, Oslo, Norway, 23–28 June 2002; pp. 669–675. [Google Scholar]
  19. Wang, X.; Swail, V. Trends of atlantic wave extremes as simulated in a 40-yr wave hindcast using kinematically reanalyzed wind fields. J. Clim. 2002, 15, 1020–1035. [Google Scholar] [CrossRef]
  20. Arkhipkin, V.S.; Gippius, F.N.; Koltermann, K.P.; Surkova, G.V. Wind waves in the Black Sea: Results of a hindcast study. Nat. Hazards Earth Syst. Sci. 2014, 14, 2883–2897. [Google Scholar] [CrossRef] [Green Version]
  21. Reistad, M.; Breivik, Ø.; Haakenstad, H.; Aarnes, O.J.; Furevik, B.R.; Bidlot, J.R. A high-resolution hindcast of wind and waves for the North Sea, the Norwegian Sea, and the Barents Sea. J. Geophys. Res. Oceans 2011, 116, C05019. [Google Scholar] [CrossRef] [Green Version]
  22. Liang, B.; Gao, H.; Shao, Z. Characteristics of global waves based on the third-generation wave model swan. Mar. Struct. 2019, 64, 35–53. [Google Scholar] [CrossRef]
  23. Shi, J.; Zheng, J.; Zhang, C.; Joly, A.; Zhang, W.; Xu, P.; Sui, T.; Chen, T. A 39-year high resolution wave hindcast for the Chinese coast: Model validation and wave climate analysis. Ocean Eng. 2019, 183, 224–235. [Google Scholar] [CrossRef]
  24. Bozzi, S.; Archetti, R.; Passoni, G. Wave electricity production in Italian offshore: A preliminary investigation. Renew. Energy 2014, 62, 407–416. [Google Scholar] [CrossRef]
  25. Lo Re, C.; Manno, G.; Ciraolo, G.; Besio, G. Wave Energy Assessment around the Aegadian Islands (Sicily). Energies 2019, 12, 333. [Google Scholar]
  26. Roger, B. Wave Energy Forecasting Accuracy as a Function of Forecast Time Horizon; Electric Power Research Institute: Palo Alto, CA, USA, 2009. [Google Scholar]
  27. Zheng, C.W.; Pan, J.; Li, J.X. Assessing the China Sea wind energy and wave energy resources from 1988 to 2009. Ocean Eng. 2013, 65, 39–48. [Google Scholar] [CrossRef]
  28. Besio, G.; Mentaschi, L.; Mazzino, A. Wave energy resource assessment in the Mediterranean Sea on the basis of a 35-year hindcast. Energy 2016, 94, 50–63. [Google Scholar] [CrossRef]
  29. Folley, M.; Whittaker, T.J.T. Analysis of the nearshore wave energy resource. Renew. Energy 2009, 34, 1709–1715. [Google Scholar] [CrossRef]
  30. Gaeta, M.G.; Samaras, A.G.; Federico, I.; Archetti, R.; Maicu, F.; Lorenzetti, G. A coupled wave-3-d hydrodynamics model of the taranto sea (italy): A multiple-nesting approach. Nat. Hazards Earth Syst. Sci. 2016, 16, 2017–2083. [Google Scholar] [CrossRef] [Green Version]
  31. Saha, S.; Moorthi, S.; Pan, H.-L.; Wu, X.; Wang, J.; Nadiga, S.; Tripp, P.; Kistler, R.; Woollen, J.; Behringer, D.; et al. The NCEP climate forecast system reanalysis. Bull. Am. Meteorol. Soc. 2010, 91, 1015–1057. [Google Scholar] [CrossRef]
  32. Hanna, S.R.; Heinold, D.W. Development and Application of a Simple Method for Evaluating Air Quality Models; Technical Report; American Petroleum Institute: Washington, DC, USA, 1985. [Google Scholar]
  33. Mentaschi, L.; Besio, G.; Cassola, F.; Mazzino, A. Performance evaluation of Wavewatch III in the Mediterranean Sea. Ocean Model. 2015, 90, 82–94. [Google Scholar] [CrossRef]
  34. He, H.; Song, J.; Bai, Y.; Xu, Y.; Wang, J.; Bi, F. Climate and extrema of ocean waves in the East China Sea. Sci. China Earth Sci. 2018, 61, 980–994. [Google Scholar] [CrossRef]
  35. Liang, B.; Liu, X.; Li, H.; Wu, Y.; Lee, D. Wave Climate Hindcasts for the Bohai Sea, Yellow Sea, and East China Sea. J. Coast. Res. 2014, 32, 172–180. [Google Scholar]
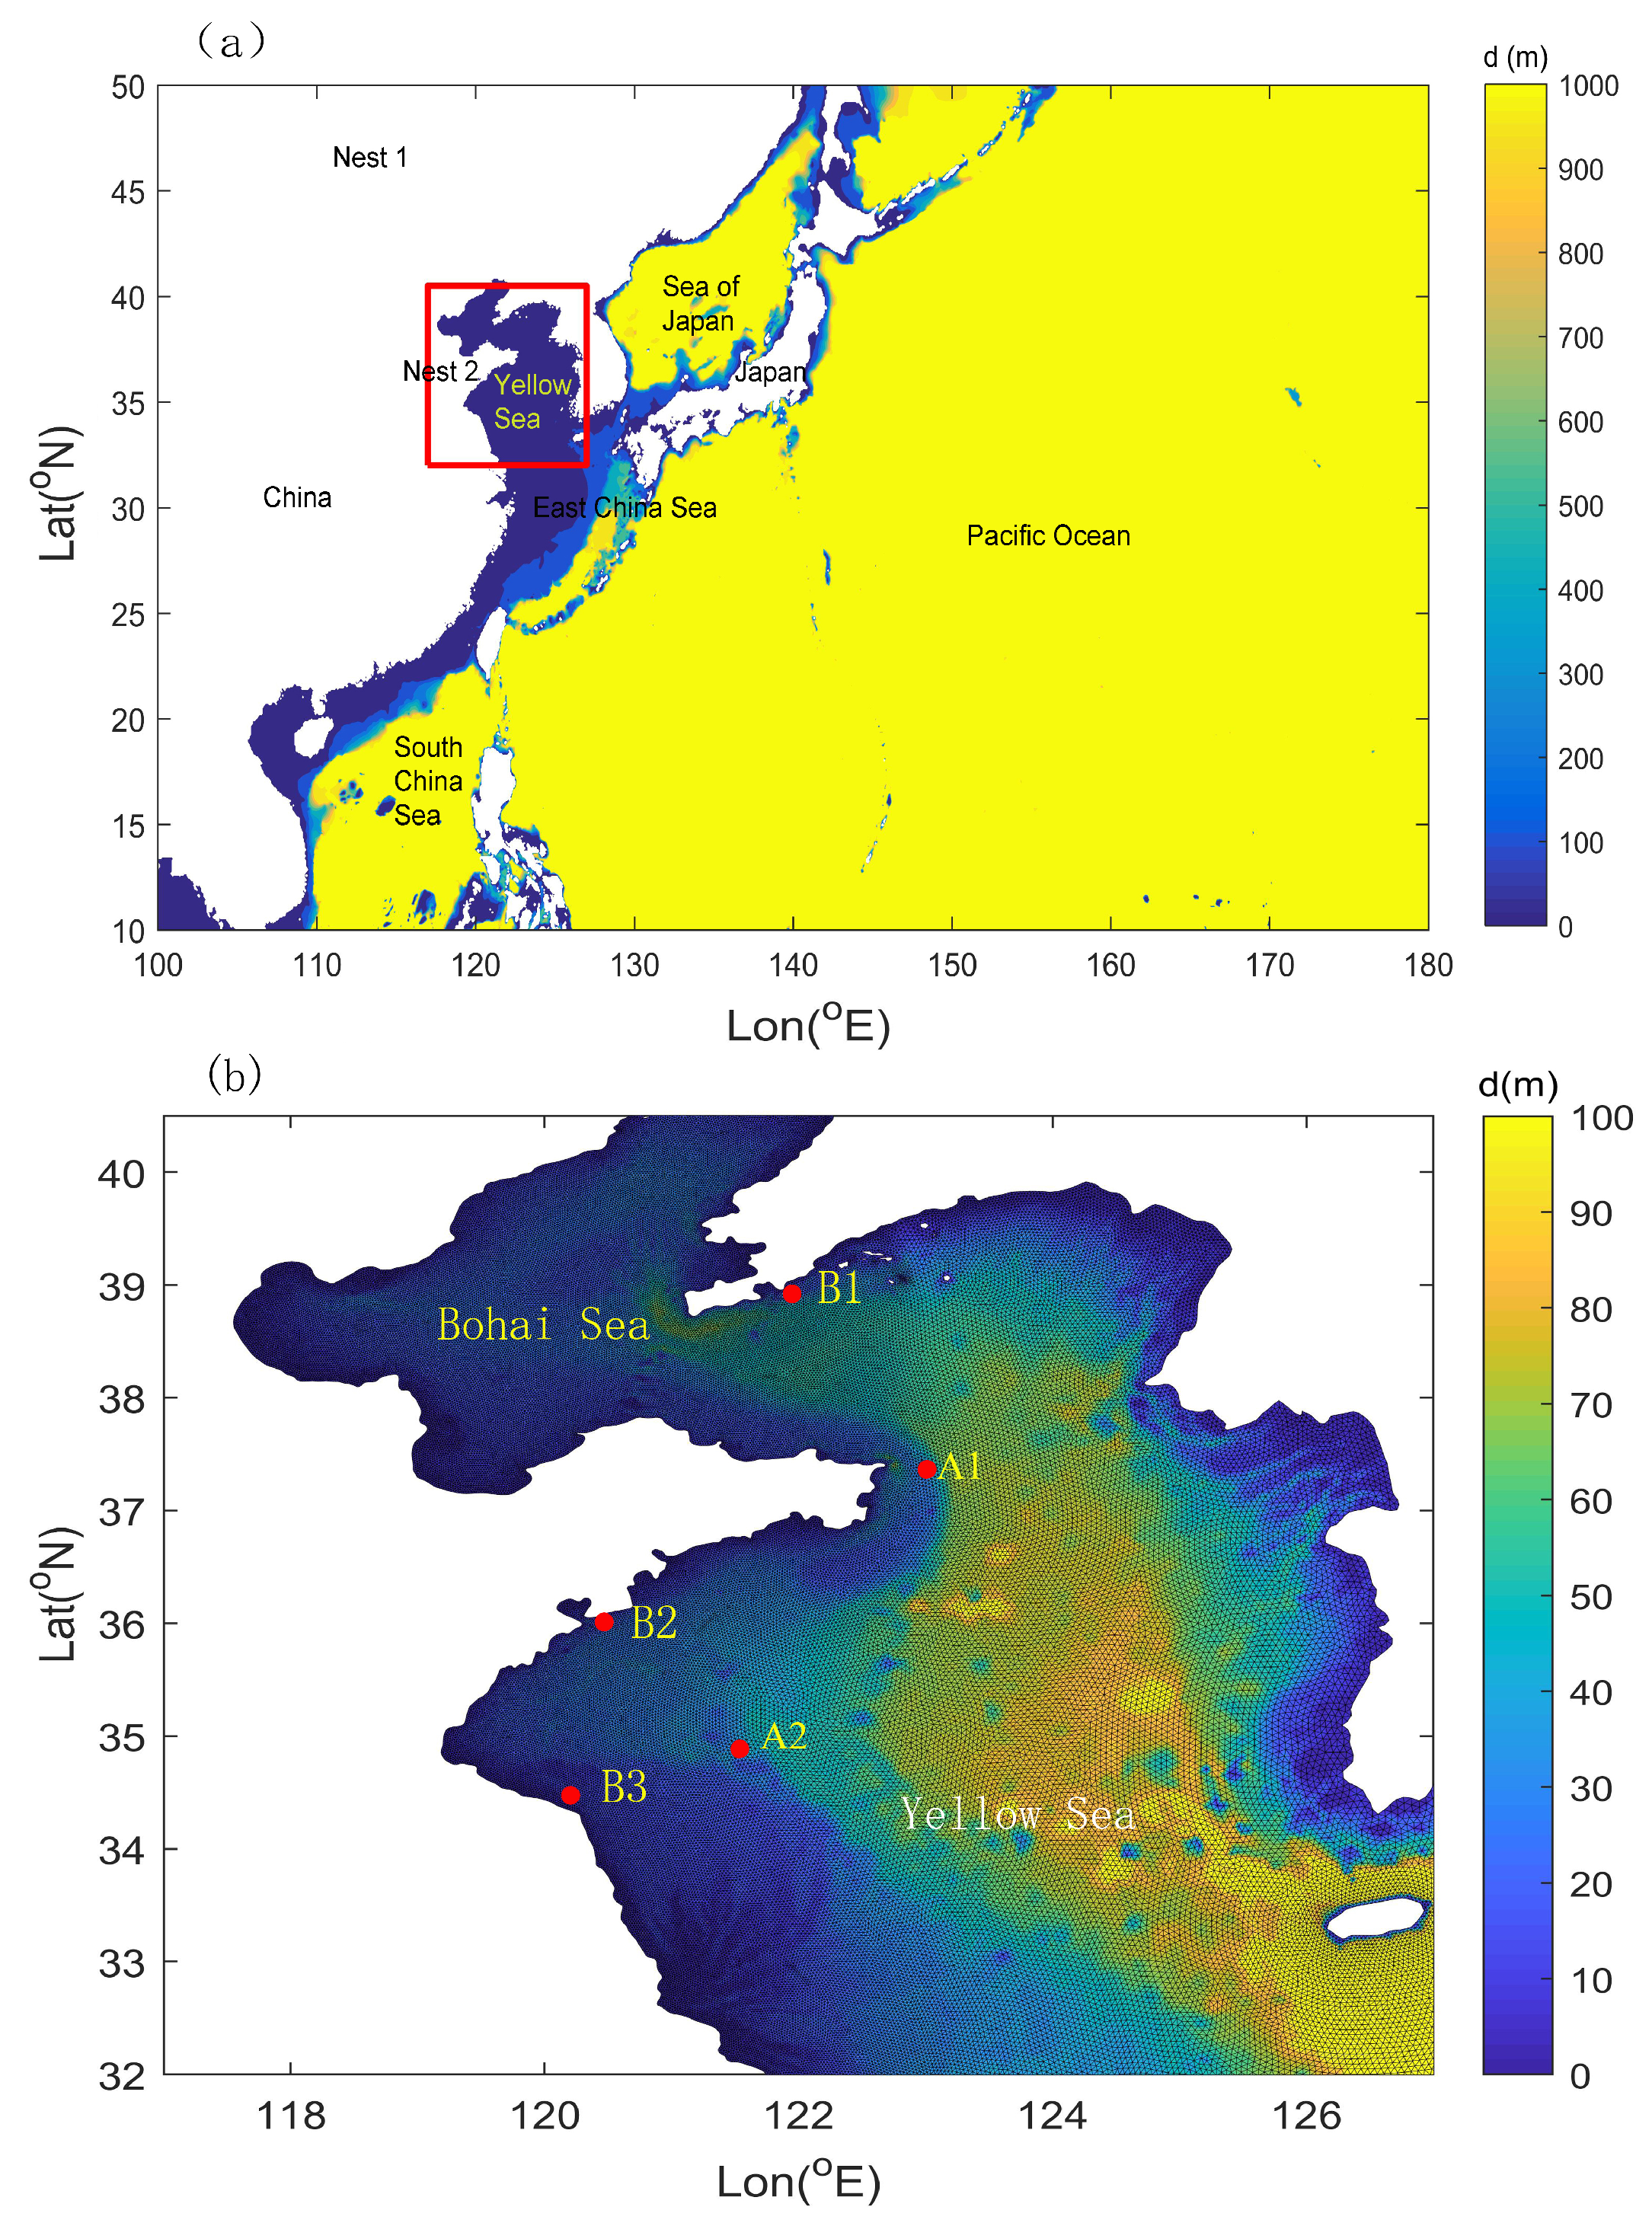
Figure 1. Implementation areas and Nest 2 mesh for TOMAWAC model ((a) Domain for Nest 1; (b) Domain for Nest 2).
Water 12 02087 g001
Figure 2. Comparison of hindcast and observed significant wave height (Hs) curves (black line: simulation; red circles: observations; (a) B1, (b) B2, (c) B3 represent buoys 1 to 3 in Figure 1).
Water 12 02087 g002
Figure 3. Comparison of hindcast and observed mean period (MP) curves (black line: simulation; red circles: observations; (a) B1, (b) B2, (c) B3 represent buoys 1 to 3 in Figure 1).
Water 12 02087 g003
Figure 4. Distributions of mean Hs (a) and MP (b) based on the hindcast from 1979 to 2018.
Water 12 02087 g004
Figure 5. Distributions of seasonal mean Hs based on the hindcast from 1979 to 2018 ((a) Spring; (b) Summer; (c) Autumn; (d) Winter).
Water 12 02087 g005
Figure 6. Distributions of seasonal mean MP based on the hindcast from 1979 to 2018 ((a) Spring; (b) Summer; (c) Autumn; (d) Winter).
Water 12 02087 g006
Figure 7. Total wave power average (1979–2018) at the YS and BS.
Water 12 02087 g007
Figure 8. Seasonal wave power average for the time period 1979–2018 in the YS and BS ((a) Spring; (b) Summer; (c) Autumn; (d) Winter).
Water 12 02087 g008
Figure 9. Mean parameters of the exploitable wave energy events during 1979–2018. (a) Annual mean wave energy event number; (b) wave energy event duration; (c) storage of exploitable wave energy.
Water 12 02087 g009
Figure 10. Seasonal average wave energy event number ((a) Spring; (b) Summer; (c) Autumn; (d) Winter).
Water 12 02087 g010
Figure 11. Seasonal average wave energy event duration ((a) Spring; (b) Summer; (c) Autumn; (d) Winter).
Water 12 02087 g011
Figure 12. Seasonal average wave energy storage of the wave energy event ((a) Spring; (b) Summer; (c) Autumn; (d) Winter).
Water 12 02087 g012
Figure 13. Wave energy assessment for A1. ((a) The wave power rose; (b) the wave power matrix; (c) persistence of the wave power in hours; (d) black line: yearly mean wave power, red line: 5 years mean wave power; (e) seasonal mean wave power; (f) monthly mean wave power).
Water 12 02087 g013
Figure 14. Wave energy assessment for A2 ((a) The wave power rose; (b) the wave power matrix; (c) persistence of the wave power in hours; (d) black line:yearly mean wave power, red line: 5 year mean wave power; (e) seasonal mean wave power; (f) monthly mean wave power).
Water 12 02087 g014
Table 1. Statistical parameters between simulated wave results and observations.
StationHsMP
NB HH NB HH
B 1 0.04 0.18−0.05 0.17
B 2 0.03 0.19−0.03 0.15
B 3 −0.02 0.17−0.03 0.16