Article

Assessing Vegetation Dynamics and Landscape Ecological Risk on the Mainstream of Tarim River, China

1
College of Hydrology and Water Resources, Hohai University, Nanjing 210098, China
2
Key Laboratory of Water Cycle and Related Land Surface Processes, Institute of Geographic Sciences and Natural Resources Research, Chinese Academy of Sciences, Beijing 100101, China
3
University of Chinese Academy of Sciences, Beijing 100049, China
4
Hohai University Wentian College, Maanshan 243000, China
5
Xinjiang Tarim River Basin Authority, Korla 841000, China
6
College of Resources and Environmental Science, China Agricultural University (CAU), Beijing 100094, China
*
Author to whom correspondence should be addressed.
Water 2020, 12(8), 2156; https://doi.org/10.3390/w12082156
Submission received: 14 June 2020 / Revised: 27 July 2020 / Accepted: 28 July 2020 / Published: 30 July 2020
(This article belongs to the Section Hydrology)

Abstract

:
The Tarim River (TR), the longest inland river at an arid area in China, plays a critical role in the sustainable development of the regional ecological environment. This study presents the spatial-temporal variations in the vegetation coverage at regional and pixel scales and its driving factors on the TR mainstream. The latest dataset of normalized difference vegetation index (NDVI) and a vegetation coverage index (fc) over the period from 2000–2015 were analyzed with the unary linear regression and the partial correlation. On the basis of land use data, we further built the landscape ecological risk index and assessed the ecological risk level of the mainstream. Our results suggest that the vegetation coverage index demonstrated fluctuations but denoted a generally upward trend in the TR mainstream, the vegetation improvement areas are far greater than the degraded areas during the study period. Apparently, the overflow days in the TR mainstream and the cumulative amount of water transport are the two main factors that dominate the vegetation coverage. The ecological risk level varies throughout the TR with a high-to-low spatial distribution from upstream to downstream, and the overall landscape ecological risk of the whole basin exhibits an upward tendency. Above all, our study provides a framework with the remote sensing data to assess vegetation coverage and landscape ecological risk which can help design and implement reliable strategies for the ecological management and vegetation restoration in the Tarim River Basin.

1. Introduction

Recent years have witnessed increasing concern for vegetation dynamics and landscape ecological risk on the environment and society [1,2,3]. The increasing population pressure and intense human activities have changed the water circulation process in many basins, resulting in various ecological problems, thus the fragile environment is facing unprecedented challenges [4]. Vegetation ecosystems in arid areas typically lack biodiversity and stability and have been susceptible to climatic variability and anthropogenic activities [5,6]. In particular, due to poor natural condition, the degree of water resources utilization basically determines the habitat and oasis area on both sides of the river. Based on eco-sustainable principles, it is vital to carry out dynamic monitoring and assessment of landscape pattern and ecological environment changes in arid and semi-arid areas. A more profound understanding of vegetation dynamics and landscape ecological risk are therefore of essential importance for planning strategies to adapt to concurrent ecological environment [7].
Vegetation is one of the critical elements within a terrestrial ecosystem [8], as well as providing ecosystem services for humans. With economic development, population growth, and shifts in land use, irreversibly degraded states of ecosystems may occur when the vegetation variations cross a certain ecological threshold [9]. Concerns over the potential impacts of those anthropogenic activities on vegetation dynamics (vegetation distributions and its compositions) have increased in recent decades. Thus, assessment of vegetation dynamics in arid areas are emerging as a research focus worldwide [10,11,12]. Cao et al. reported that responses of the 10-day normalized difference vegetation index (NDVI) to temperature were more significant than that to precipitation in Xinjiang, while the decrease in the annual precipitation was the main factor that led to the fluctuations of the vegetation coverage [13]. Dai et al. examined the spatiotemporal variations in the NDVI in northwestern China over the period from 1982 to 2006 and concluded that the increase in NDVI was due largely to the large-scale ecological construction projects [14]. During the past decades, for the mainstream of TR, water shortage has dramatically triggered a series of ecological environment problems in the oasis, including land desertification, vegetation degradation, oasis shrinkage, and underlying surface changes. Hence, accurately characterizing the spatiotemporal variability in vegetation and identifying the factors that dominate vegetation degradation (or restoration) of Tarim River Basin are the key problems that need to be solved in order to assess regional ecological balance and formulate suitable restoration policies.
Ecological risk refers to the damage or risk that ecosystems and their different internal components may suffer within a certain region [15]. In the 1980s, ecological risk assessment came into being. With the promulgation of “Guidelines for Ecological Risk Assessment” by EPA in 1998 [16], the study of ecological risk of the environmental system has entered a mature stage. Land use/cover change (LUCC) is one of the feasible ways to carry out ecological environment impact assessment and a new breakthrough point in watershed scientific research. Meanwhile, the ecological risk assessment of land use based on watershed landscape pattern is helpful to better understand the status of regional risks, and it is an effective method for integrated ecological risk management in view of landscape patterns and ecological processes. Landscape ecological risk is the adverse consequence of the interaction between landscape patterns and ecological processes under the influence of natural or human factors [17], which has been widely recognized by scholars. Peng et al. explored landscape ecological risk assessment associated with mining cities, and found the result that landscape ecological risk is lower in highly urbanized areas than those rural areas [7]. Li et al. constructed landscape ecological risk pattern evolution models and analyzed the spatiotemporal evolutions of ecological risk patterns of coastal zones in Zhejiang Province, China [18]. A scientific ecological risk assessment and risk pattern evolution analysis may provide an important reference for establishing an ecological risk early warning mechanism and promoting landscape pattern optimization, particularly for those regions with a harsh environment.
The Tarim River Basin, a region of pivotal importance to the water security of northwestern China, has experienced dramatic ecological deterioration, which has aroused widely public concern [6,19]. Nowadays, much attention has been paid to the relationship between vegetation patterns and meteorological factors [20,21]. However, the response mechanism of vegetation growth in TR is more complex than that in other systems due to water scarcity, then additional impact factors besides meteorological need further exploration [22]. Furthermore, this region has experienced rapid land use change in the past few years and is under the influence of alternative government policies for hydraulic project construction, farmland protection [23], urban planning, ecological conservation, and ecological water transport. Landscape pattern conflicts thus often exist when taking into account these policies serving for different purposes. Few studies focused on the landscape pattern change in the mainstream of the TR, in particular, evaluation of landscape ecological risk has not been explored in depth. The study of landscape ecological risk will provide substantial support for the resolution of land use conflicts and contribute to the future landscape management of the TR ecosystem. Therefore, in this study, the vegetation dynamics and landscape ecological risk in the whole mainstream of TR are analyzed in view of the whole basin sustainability. Specifically, objectives of the study are three-fold including the following: (1) Calculate the spatial-temporal variations in the vegetation coverage during the growing season; (2) discuss driving factors of eco-flow regime and eco-transport that possibly dominate the vegetation changes in TR; (3) construct landscape ecological risk indices and analyze spatio-temporal variation of the landscape ecological risk patterns during the period from 2000–2015 in the study area. Mitigating threats caused by potential vegetation degradation in the TR requires better knowledge to identify the driving mechanisms for taking most efficient and sustainable actions. The results obtained in this study will be helpful to explore the reasons for regional vegetation coverage changes and shed a light for restoring effectively the ecological system in the Tarim River.

2. Materials and Methods

2.1. Study Area

Located in the southern Xinjiang, China, the TR is the largest inland river basin with a typical continental arid climate (Figure 1). The mainstream of TR begins at the junction of Akesu River, Yarkant River, and Hotan River, the upstream segment with a length of 495 km from Xiaojiake to Yingbazha, the middle segment from Yingbazha to Qiala (398 km), and the lower reaches from Qiala to Taitema Lake (428 km). The vulnerability of the TR is embodied in the poor annual precipitation less than 70 mm, and annual evaporation greater than 1000 mm. Due to the overdraft of water resources, the streamflow at the TR downstream has decreased considerably. Consequently, several channel sections dried up especially in the reaches below the Daxihaizi Reservoir, resulting in desertification, rapidly shrunk oases, and degraded ecosystems [24]. To alleviate the deterioration of ecological environment, a string of ecosystem rehabilitation programs have been implemented by the local government, among which the water diversion project for recovery of the TR and the Taitema Lake since 2000 is the most well-known [25].

2.2. Data

Data used in this study are as follows: (1) The NDVI from the MODIS/Terra Vegetation Indices 1-Month China 500 m Grid (MODND1M) product was adopted as basic data on the website of the Chinese Geospatial Data Cloud [26]. The MODND1M product are processed by the MOD09GA daily product through splicing, cutting, projection, unit conversion and calculation, and the calculation method is to take the maximum value in the month. The data was collected from 2000 through 2015 during the growing season from April to October; (2) monthly precipitation and temperature from the six meteorological stations (Alar, Kuche, Luntai, Korla, Tikanlik, and Ruoqiang) on the TR over a period from 2000–2015 were downloaded from the Chinese Meteorological Data Sharing Service System [27]; (3) daily streamflow data of Alar and Xinquman hydrological stations on the TR from January 2000 to December 2015, were provided by the Xinjiang Tarim River Basin Management Bureau. Locations of the hydrological stations are shown in Figure 1; (4) no. 1–16 of the ecological water delivery date in the down reaches of the TR were obtained from the Xinjiang Tarim River Basin Management Bureau; and (5) the raster data of land use in 2000, 2005, 2010, and 2015 at a 1 km spatial resolution were produced and provided by the Resources and Environment Science Data Center, Chinese Academy of Sciences [28].

2.3. Methods

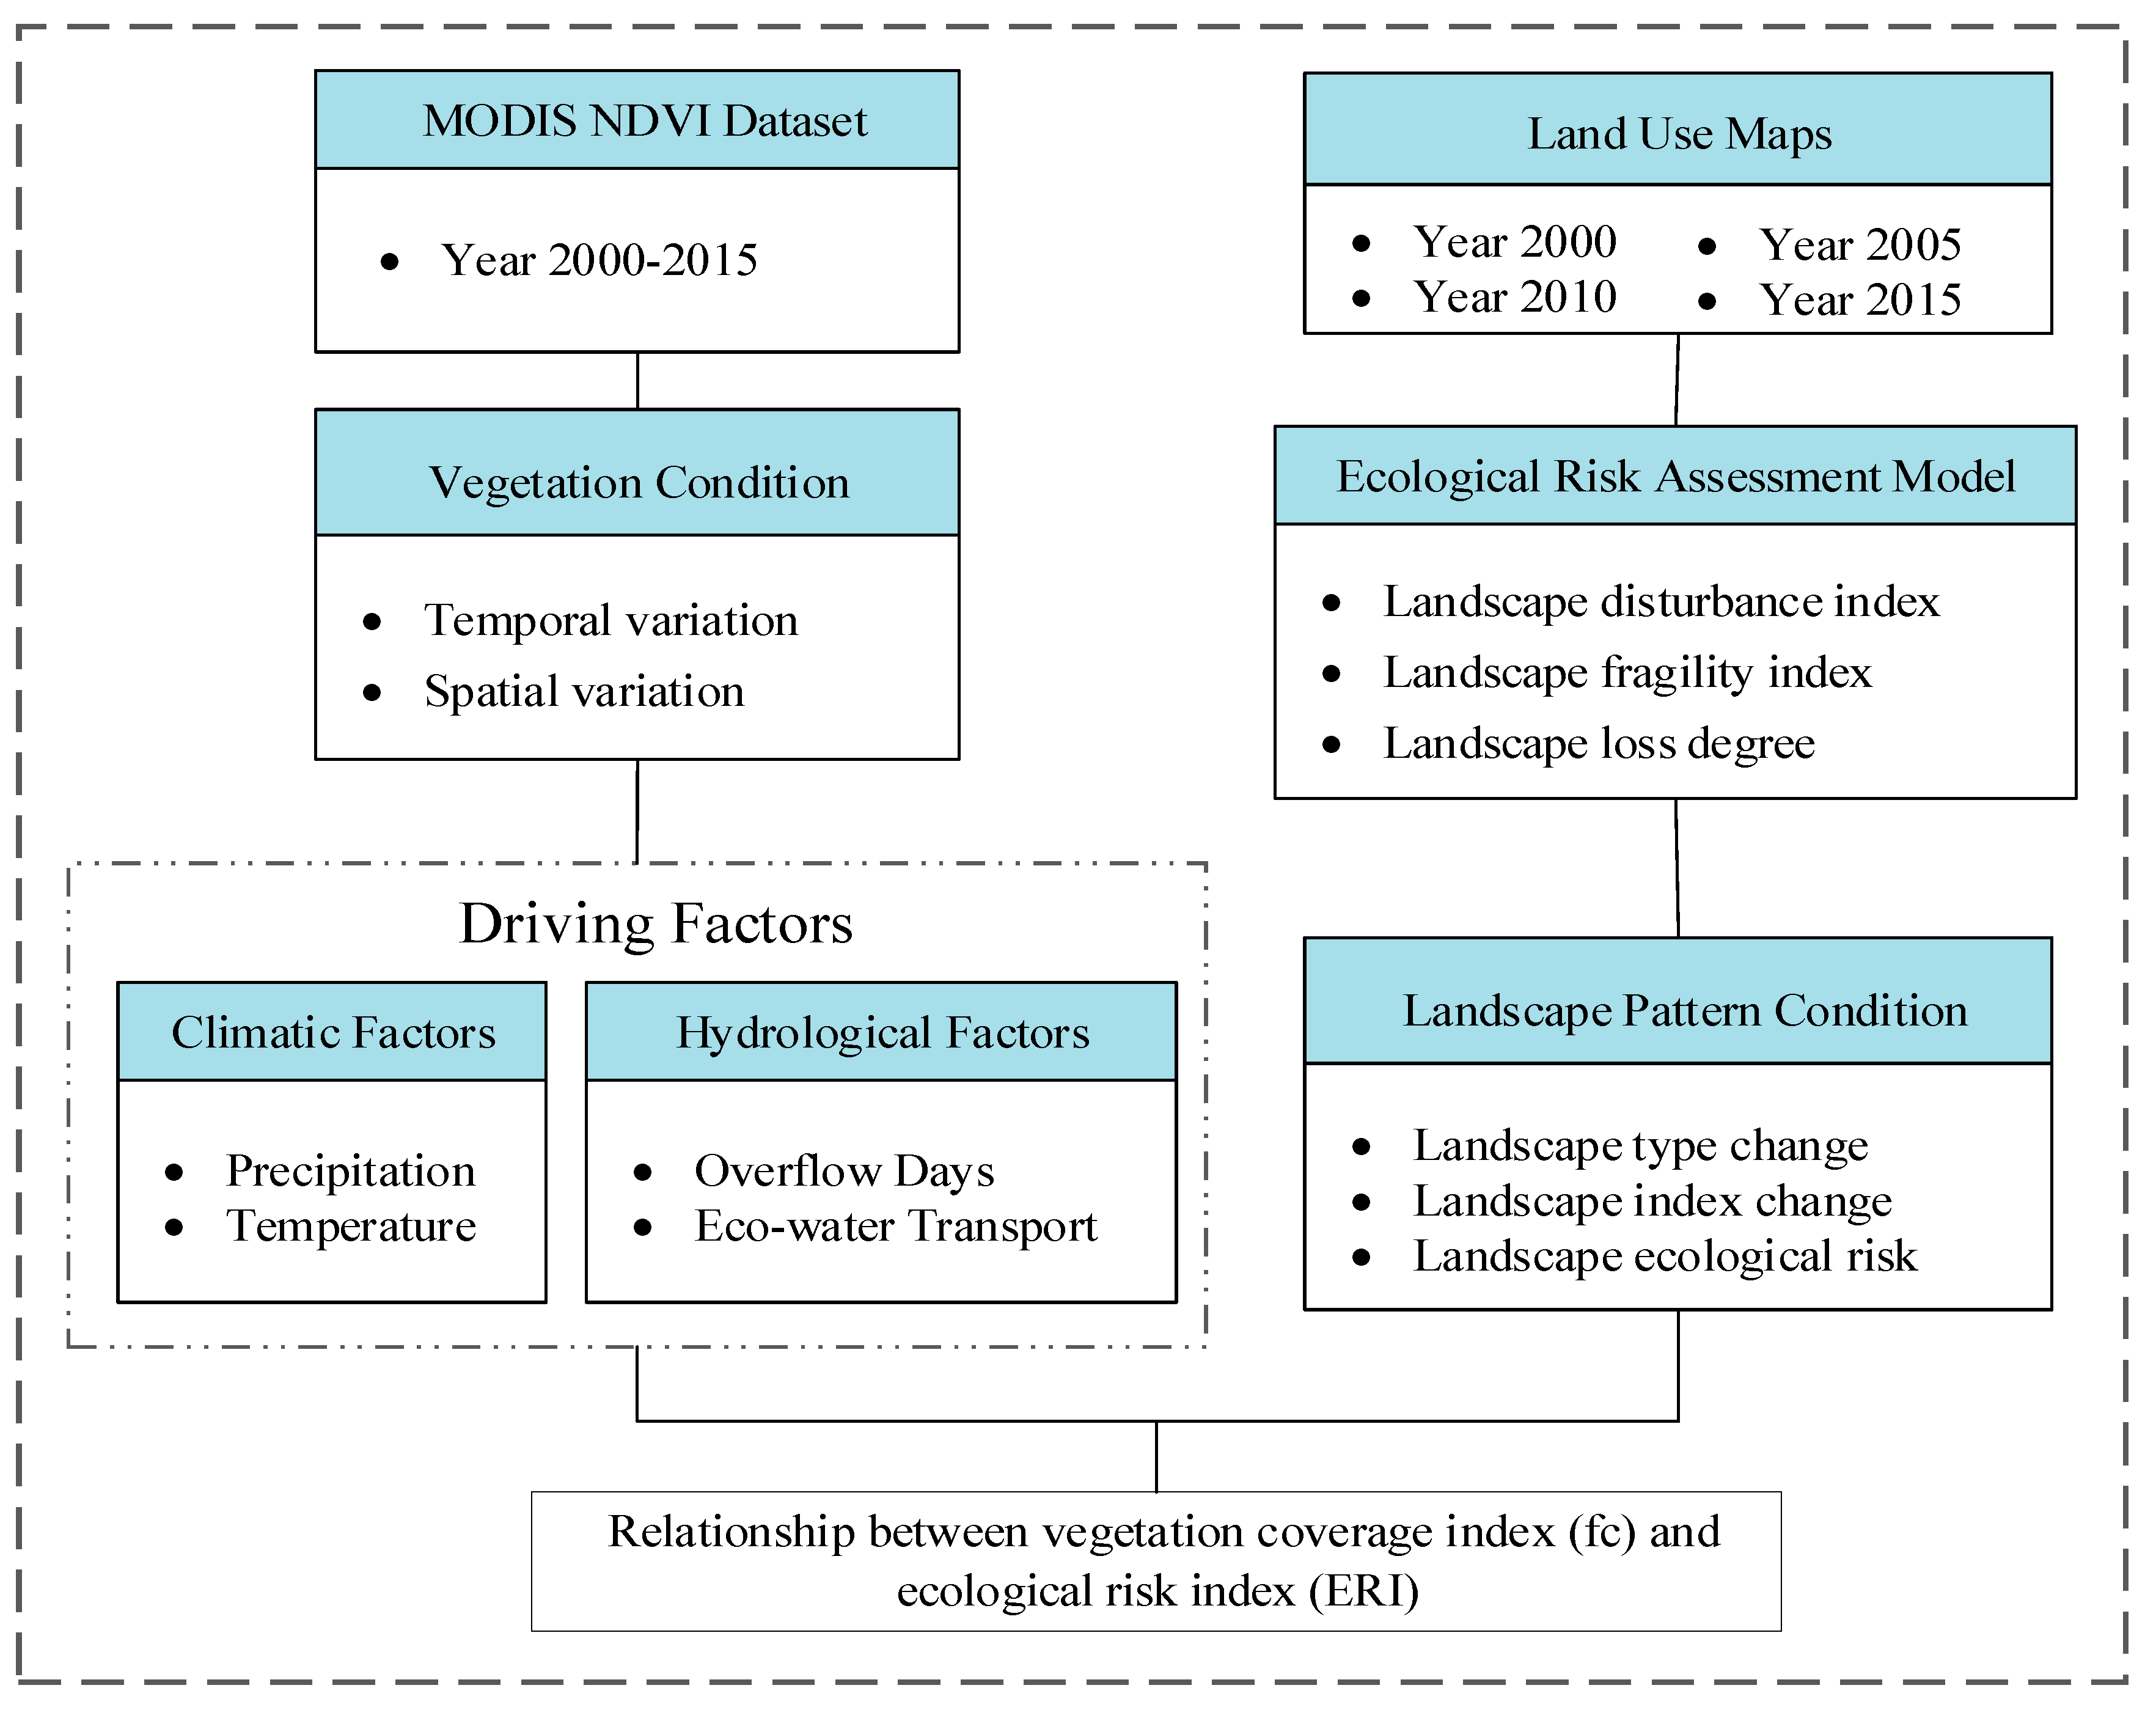
We present a framework that integrates a set of indices and model to enable the evaluation of vegetation dynamics and landscape ecological risks (Figure 2). Specifically, this framework consists of five key components: Temporal and spatial variation analysis of vegetation coverage, driving factors of vegetation coverage change, ecological risk assessment model built using multiple indices, landscape pattern analysis using landscape metrics, and the relationship between vegetation coverage index and ecological risk index.

2.3.1. Calculation and Classification of Vegetation Coverage

The MODIS NDVI, an indicator of photosynthetically active vegetation, is one of the excellent data sources which can be used to analyze vegetation coverage [29]. According to the Dimidiate Pixel Model [30], the NDVI value is composed of the green vegetation information and the bare soil information on a per-pixel basis. Vegetation coverage, as an important indicator of plant, is particularly vital in monitoring changes in plant diversity. Assuming a linear correlation between NDVI and vegetation coverage, the vegetation coverage index (fc) is given by [14]:
f c = NDVI NDVI soil NDVI veg NDVI soil
where NDVI is the value at each pixel, NDVI soil is the value at the bare soil area, NDVI veg is the value at the vegetation area. Combined with the actual vegetation coverage in the TR, NDVI value in which the cumulative frequency is 0.5% in the pixels was chosen to be the NDVI soil , while the cumulative frequency of NDVI above 99.5% was chosen to be NDVI veg .

2.3.2. Regression Analysis

(1) Linear regression analysis
Linear regression can quantitatively assess the overall trend in change of vegetation coverage at each grid cell, and the change rate of vegetation coverage over time. In this study, the spatio-temporal variations in the vegetation coverage were analyzed based on the monthly NDVI data at 500 × 500 m resolution using the linear regression method as follows [4]:
θ s = n i = 1 n i f ic i = 1 n i i = 1 n f ic n i = 1 n i 2 ( i = 1 n i ) 2
where θ s represents the trend, n refers to the total years, and   f ic is the vegetation cover index for the ith year. If θ s is greater than 0, the vegetation coverage shows an increasing trend. Otherwise the vegetation coverage exhibits a decreasing trend.
(2) Hierarchical regression approach
Hierarchical regression is a way to show if variables of your interest explain a statistically significant amount of variance in your Dependent Variable after accounting for all other variables. This is a framework for model comparison rather than a statistical method. In this framework, you build several regression models by adding variables to a previous model at each step; later models always include smaller models in previous steps. In many cases [31,32], our interest is to determine whether newly added variables show a significant improvement in R2.

2.3.3. Correlation Analysis

Correlation analysis is commonly used to analyze the relationship between inter-annual vegetation changes and its driving factors [14]. The partial correlation coefficient (PCC) and the lag partial correlation coefficient (LPCC) for the vegetation coverage during the growing season and the climatic variables (precipitation and temperature) were calculated at each of the three segments of the TR. LPCC is the lag partial correlation coefficient between the vegetation coverage index of the current month and the climatic variables (precipitation and temperature) of the previous month [33]. In order to test the significance of the linear correlation between the vegetation coverage and yearly overflow days and the cumulative eco-water transport, Pearson’s correlation coefficient was computed for the two variables. According to the conditions of TR, the streamflow of Alar station is divided into three grades with Q < 50 m3/s, 50–500 m3/s, and >500 m3/s, and the streamflow of Xinquman station is divided into three grades with Q < 40 m3/s, 40–400 m3/s, and >400 m3/s, respectively representing the low flow process, medium flow process, and large flow process by Yu et al. [34]. Considering there is no clear river boundary in the mainstream of TR, the annual occurrence days of the large flow process in Alar (Q > 500 m3/s) and Xinquman station (Q > 400 m3/s) are defined as the yearly overflow days in this paper. Since 2000, an ecological water transport project was launched by the local government, the cumulative eco-water transport value is the sum of the total eco-water transport amount up to a certain year. Various time lags were considered in analyzing the correlation between the time series of vegetation coverage and its driving factors [35].

2.3.4. Ecological Risk Structure

(1) Landscape disturbance index (Ei)
Landscape disturbance index (Ei) can indicate the degree of disturbance in different landscape ecosystems caused by hazards or land use activities. Obviously, the greater the disturbance of the external state to the basin, the greater the ecological risk the basin faces [7]. The study chooses landscape fragmentation index (Ci), landscape isolation index (Ni), and landscape dominance index (Di) to build the landscape disturbance index, and the expression of these indices are as follows:
E i = aC i + bN i + cD i
C i = n i A i
N i = A 2 A i n i A
D i = n i n
where n i is the patch number of landscape i (the landscape types in this paper included such nine categories as bare land, low-covered grassland, high-covered grassland, farmland, sparse forest, forest, river, water body, and urban); A i is the area of landscape i; A is the total area; a, b, and c represent the weight of the landscape metrics and a + b + c = 1. According to experience [15], a = 0.5, b = 0.3, and c = 0.2 in this paper.
(2) Landscape fragility index (Fi)
The ability of different landscape types to resist external disturbance can be expressed by an index, that is, landscape fragility index (Fi). Lower resistance ability means higher fragility index and greater ecological risk [15]. The vulnerability of landscape types was determined based on the actual situation of the TR, and the order from high vulnerability to low was bare land, low-covered grassland, high-covered grassland, farmland, sparse forest, forest, river, water body, and urban. The weights are assigned from 9 to 1, and the vulnerability index for a specific landscape type is obtained after normalization.
(3) Landscape loss degree (Ri)
Landscape loss degree reflects the degree of loss of different landscape types in the watershed ecosystem under artificial-natural interaction [15]. The Equation for Ri is as follows:
R i = E i × F i
where R i is the landscape loss degree, E i is the landscape disturbance index, F i is the landscape fragility index.
(4) Landscape ecological risk index (ERI)
Landscape ecological risk index based on landscape pattern is a basic assessment method, which reveals the relationship between landscape structure and landscape ecological risk system by calculating the areal proportion of landscape components [17]. The Equation for ERI is as follows [16]:
ERI i = i = 1 N A ki A k R i
where Aki is the area for landscape i in the k sample area; Ak is the total area in the k sample; and n is the number of landscape types.
With consideration of the watershed scale factor, the study area was divided into 1592 grids on 5 × 5 km by the equidistance sampling function, and each grid is an ecological risk zone. The ERI of all landscape types from 2000 to 2015 were calculated based on the above the Equation (8). Then, the comprehensive risk indices of each landscape type in each grid were calculated, which were set as the ecological risk level of the risk zones center.

3. Results

3.1. Vegetation Condition and Change

3.1.1. Temporal Variation of Vegetation Coverage

The average vegetation coverage in the growing season (from April to October) presents temporal variations from 2000 to 2015 in the mainstream of the TR (Figure 3). The bare land areas (with fc < 0.1) on both sides of the TR were gradually decreased after the implementation of the ecological water diversion project in 2000. At the early stage of water transportation (2000–2002), the bare land area showed some minor variations. After 2003, the bare land area declined rapidly, which was obviously less than the area during the period from 2000–2002. The low vegetation coverage (0.1 ≤ fc < 0.25) exhibited minor variations with an average 23.08% of the total area in the TR from 2000 through 2009. The percentage of the low vegetation coverage reached up to a highest value of 27.35% in 2010 and kept almost stable over the period of 2011 to 2015. The high vegetation coverage (0.25 ≤ fc < 0.35) experienced a minor variation, 8.65% to 10.34%. The oasis agricultural area (fc ≥ 0.35) showed a remarkable upward trend, which is consistent with the study by Du et al. (2015) [36]. It is very interesting that bare land possessed two low points in 2003 and 2013, in contrast, the oasis agricultural area was at its peak in these two years. In general, the almost opposite trends may reflect the mutual transformation relationship between the bare area and the oasis agricultural area in the TR.
The vegetation coverage index was observed in an extremely significantly increasing trend in each of the three segments of the TR, suggesting that the environmental condition for the vegetation coverage has improved (Figure 4). The vegetation coverage index in the upstream has a greater slope than those in the midstream and downstream, confirming the results of Guan et al. (2018) [19]. The vegetation coverage index and the percentage of oasis agricultural area in the upstream and midstream of TR have a similar trend over time, while the vegetation coverage index in the lower reaches was more consistent with the percentage of low coverage area. Furthermore, the upstream was the densely inhabited and the oasis agricultural region with a large-scale reclamation of the cultivated land. The TR downstream has been gradually dried up since the 1970s, consequently, the downstream underwent a long process of ecological degradation. Although the gradual process of vegetation restoration in TR takes time, the slow restoration process also provides many long-term ecosystem services. Generally, the vegetation coverage in the mainstream has a positive slope, presenting remarkable improvement in recent years, our results are highly correlated with the studies by Guo et al. (2017) and Yan et al. (2018) [38,39].

3.1.2. Spatial Patterns of Vegetation Coverage

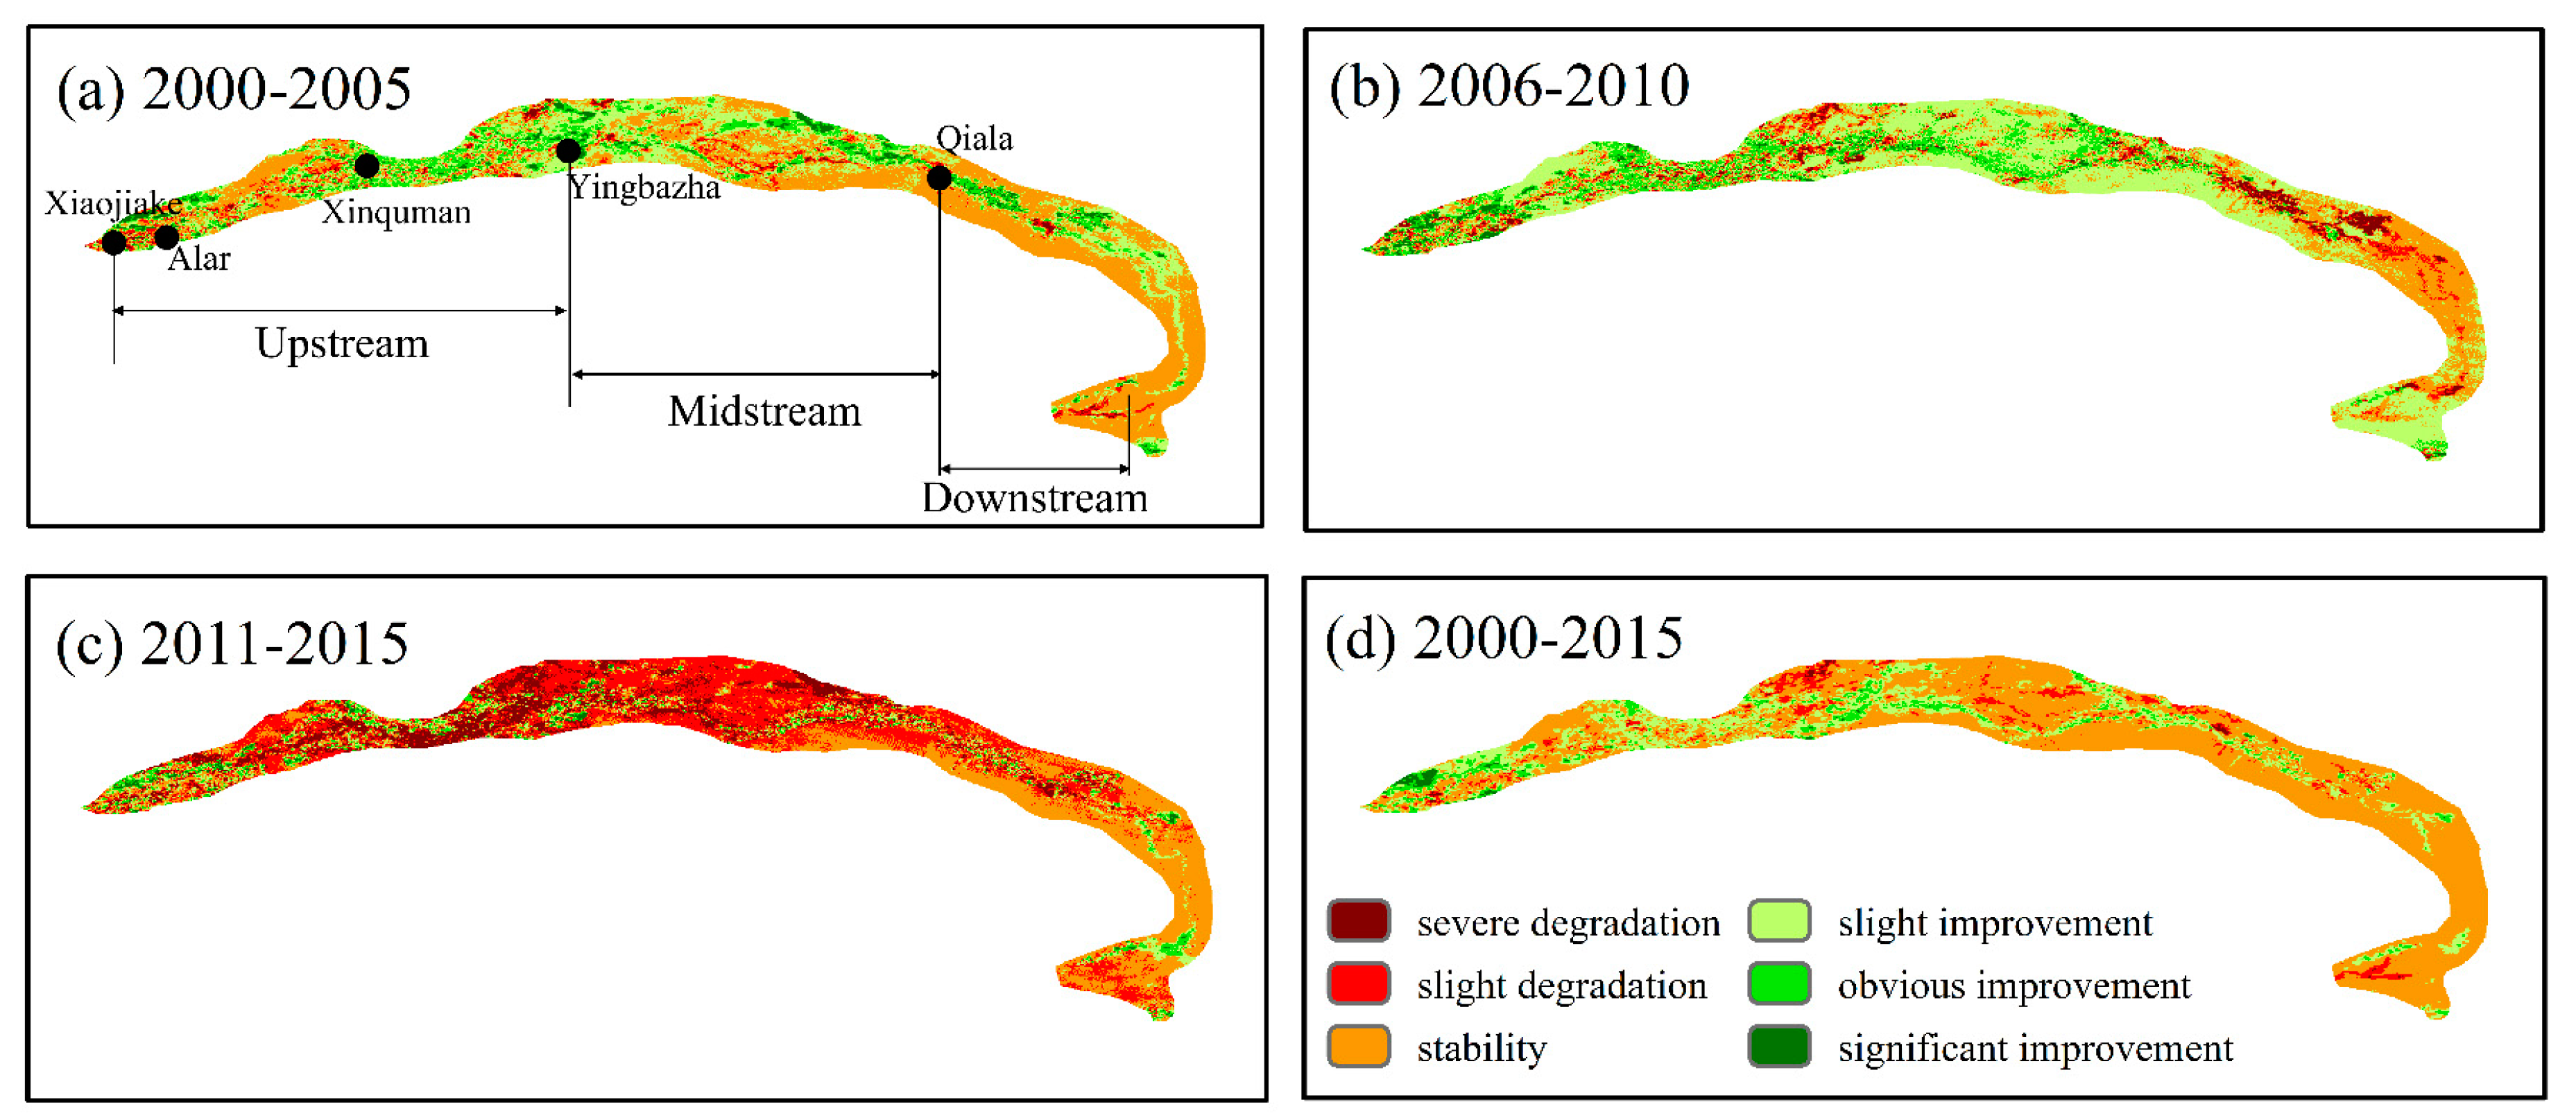
Figure 5 displays spatial distributions of the slopes, calculated with Equation (2) at each pixel, for three different phases: 2000–2005, 2006–2010, and 2011–2015. The change degree of vegetation coverage was classified into six ranks based on Natural Breaks with the ArcGIS software. During 2000 to 2005, the lands with slight and severe degradation accounted for 7.3% of the total area and were mainly distributed in the upstream and the midstream, vegetation coverage accounted for 30%, 13%, and 3.8% of the total area in the TR with slight, obvious, and significant improvement, respectively. The vegetation improvement region was seen in the upstream and midstream from 2006 to 2010, while the region with vegetation degradation was distributed sporadically on the right bank of the downstream. In 2011–2015, the vegetation improvement region accounted for 15% of the total area whereas the severe and slight degradation were 16% and 36%, respectively. Obviously, the vegetation coverage was shown as stable in most of the area of the TR mainstream. The improvements in the vegetation coverage were primarily concentrated in the upstream, whereas the vegetation degradation areas were mainly distributed in the left bank of the midstream and the downstream. Table 1 summarized the change in vegetation coverage in the TR over the period from 2000–2015. Generally, the vegetation improvement area is greater than the vegetation degradation area in the TR mainstream from 2000 to 2015, and the vegetation restoration was shown on both banks of the river, largely related to the change in runoff. Specifically, more than 80% of the vegetation in the upstream and downstream were mostly scattered between the distance of 13 to 14 km to the river channel. The distributive range of vegetation was the largest in the middle reaches with more than 80% of the vegetation distributed in 17–20 km (Figure S1).

3.2. Driving Factors of Vegetation Coverage Change

3.2.1. Relationship between Vegetation Coverage Changes and Climatic Variables

Generally, large-scale climatic impacts on vegetation can be quantitatively assessed with statistical analyses of satellite-derived vegetation coverage index and climatic variables. Correlations between the vegetable coverage index and the primary climatic variables (precipitation and temperature) were analyzed in terms of the partial correlation coefficient and lag partial correlation coefficient over the period from 2000 to 2015 for the three segments of the TR (Table 2). The PCC between precipitation and vegetation coverage index (fc) in the upstream was about 0.1, suggesting that precipitation has little effect on the vegetation coverage. The PCC and the LPCC for temperature and fc were negative because the higher temperature in an arid region, the smaller the vegetation coverage index. In the TR downstream, fc was positively correlated with the two meteorological factors, but neither of them showed a statistical significance.

3.2.2. Response of Vegetation Coverage to the Overflow Days in the Upstream and Midstream

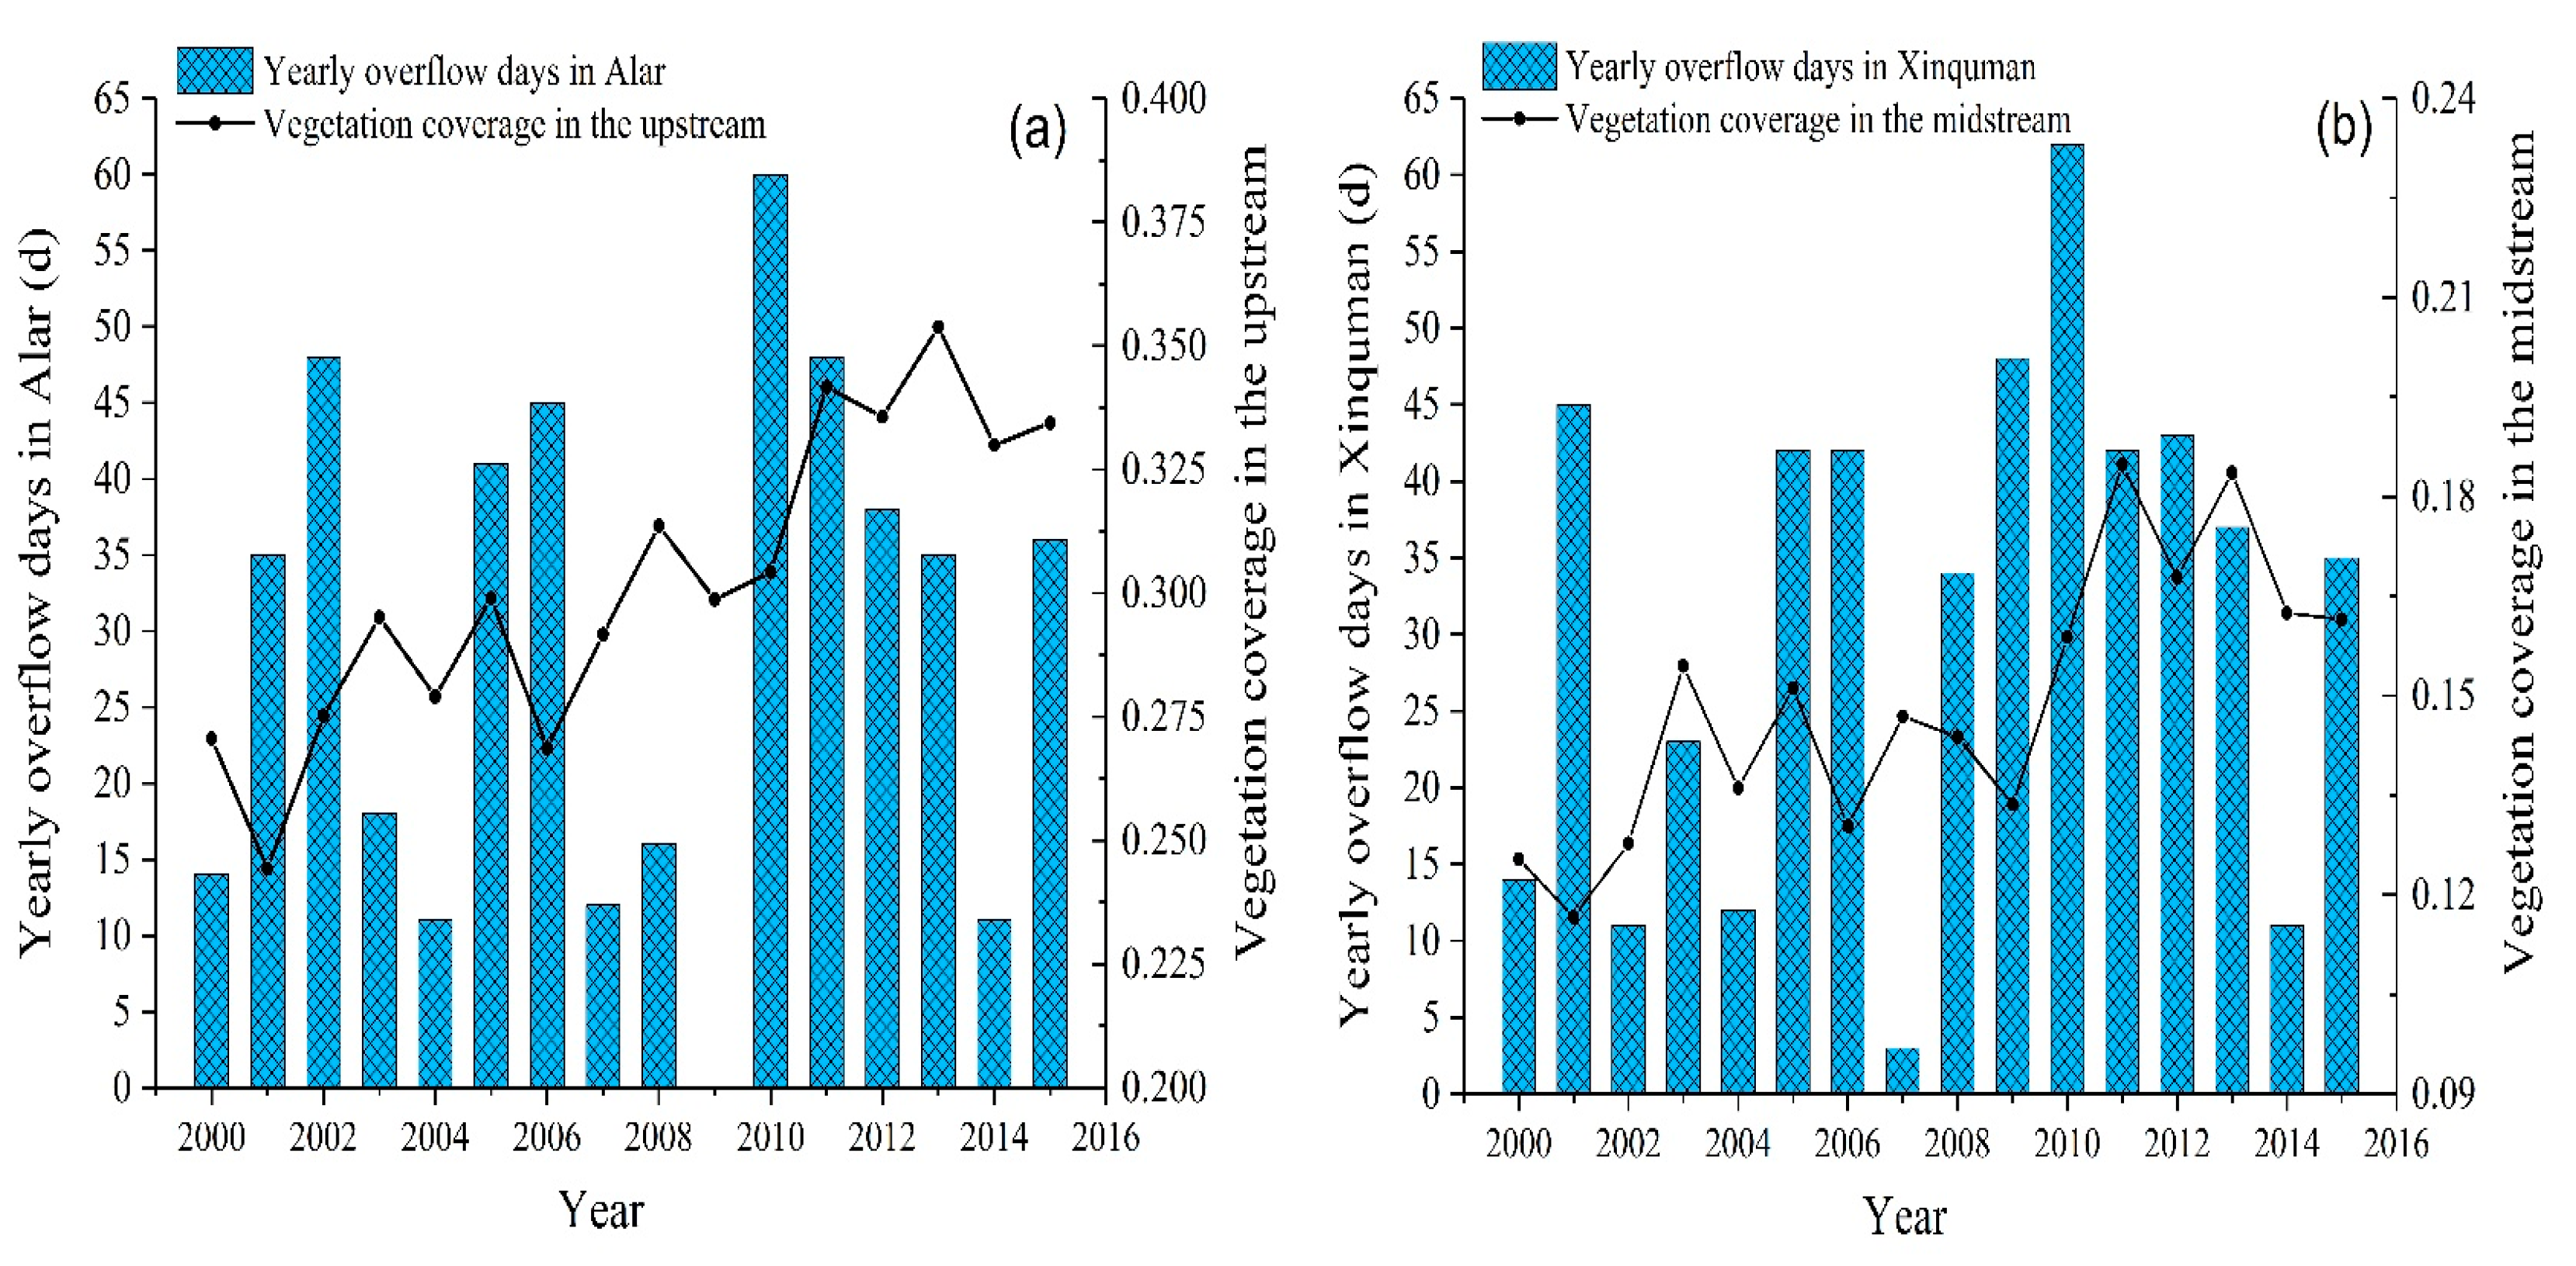
Figure 6 illustrates vegetable coverage index in the upstream and the midstream and the days of overflow at the Alar and Xinquman stations over the time period from 2000 to 2015. The days of yearly overflow increased during 2000–2003 at the Alar station and the vegetation coverage index in the upstream also illustrated an increasing trend (Figure 6a). An increase in the vegetation coverage index lagged behind the changes in the overflow days about 1–2 years over 2000–2010. After 2010, the vegetation coverage index was basically stable at a higher value of about 0.34. The number of the overflow days at the Alar Station increased significantly in 2000–2002, 2004–2006, and 2009–2010. Accordingly, the vegetation coverage in the upper reaches jumped in the three stages of 2001–2003, 2006–2008, and 2009–2011. The fluctuation of the vegetation coverage index in the midstream lagged behind the changes of the overflow days about two years at the Xinquman station (Figure 6b). The overflow days presented a gradually declining trend after 2010, apparently, the vegetation coverage index in the midstream decreased accordingly, indicating that the vegetable coverage depends on the overflow days. The vegetation coverage in the upper reaches will increase dramatically when the annual overflow days at the Alar Station exceed 40, and the annual overflow days are about 30 days, which can maintain the stable fluctuation of vegetation coverage. The thresholds of vegetation coverage increase significantly and maintain stability at the Xinquman station were 45 and 35 overflow days per year, respectively.
The correlation coefficients between the vegetable coverage index and the annual overflow days (or cumulative overflow days) were listed in Table 3. Firstly, the vegetable coverage index and the annual overflow days showed positive correlations in the upstream and the midstream of the TR. It seems that the correlation coefficients between the vegetable coverage index and the annual overflow days in the previous two years were higher in the midstream (p < 0.01), according to the Pearson methods (Table 3). Both in the TR upstream and midstream, the vegetation coverage index presented a notable positive correlation (p < 0.01) with the cumulative overflow days. It is apparent that the vegetation coverage index has the highest correlation coefficients with the cumulative overflow days at the present years. The equation (y = 0.0002x + 0.256) that provided the best fit is conducted between the vegetation coverage index and the cumulative overflow days at the same year in the upstream. While in the TR midstream, the equation (y = 0.0001x + 0.125) explains the relationship between the vegetation coverage index and the cumulative overflow days.

3.2.3. Response of Vegetation Coverage to the Eco-Water Transport in the Downstream

Since 2000, an ecological water transport project with sixteen phases was launched by the local government, and the detail of water divisions was presented in Table 4. With the implementation of the ecological water transport project, a certain amount of water was transported into the TR downstream every year to mitigate the severe situation of the ecological degradation [40].
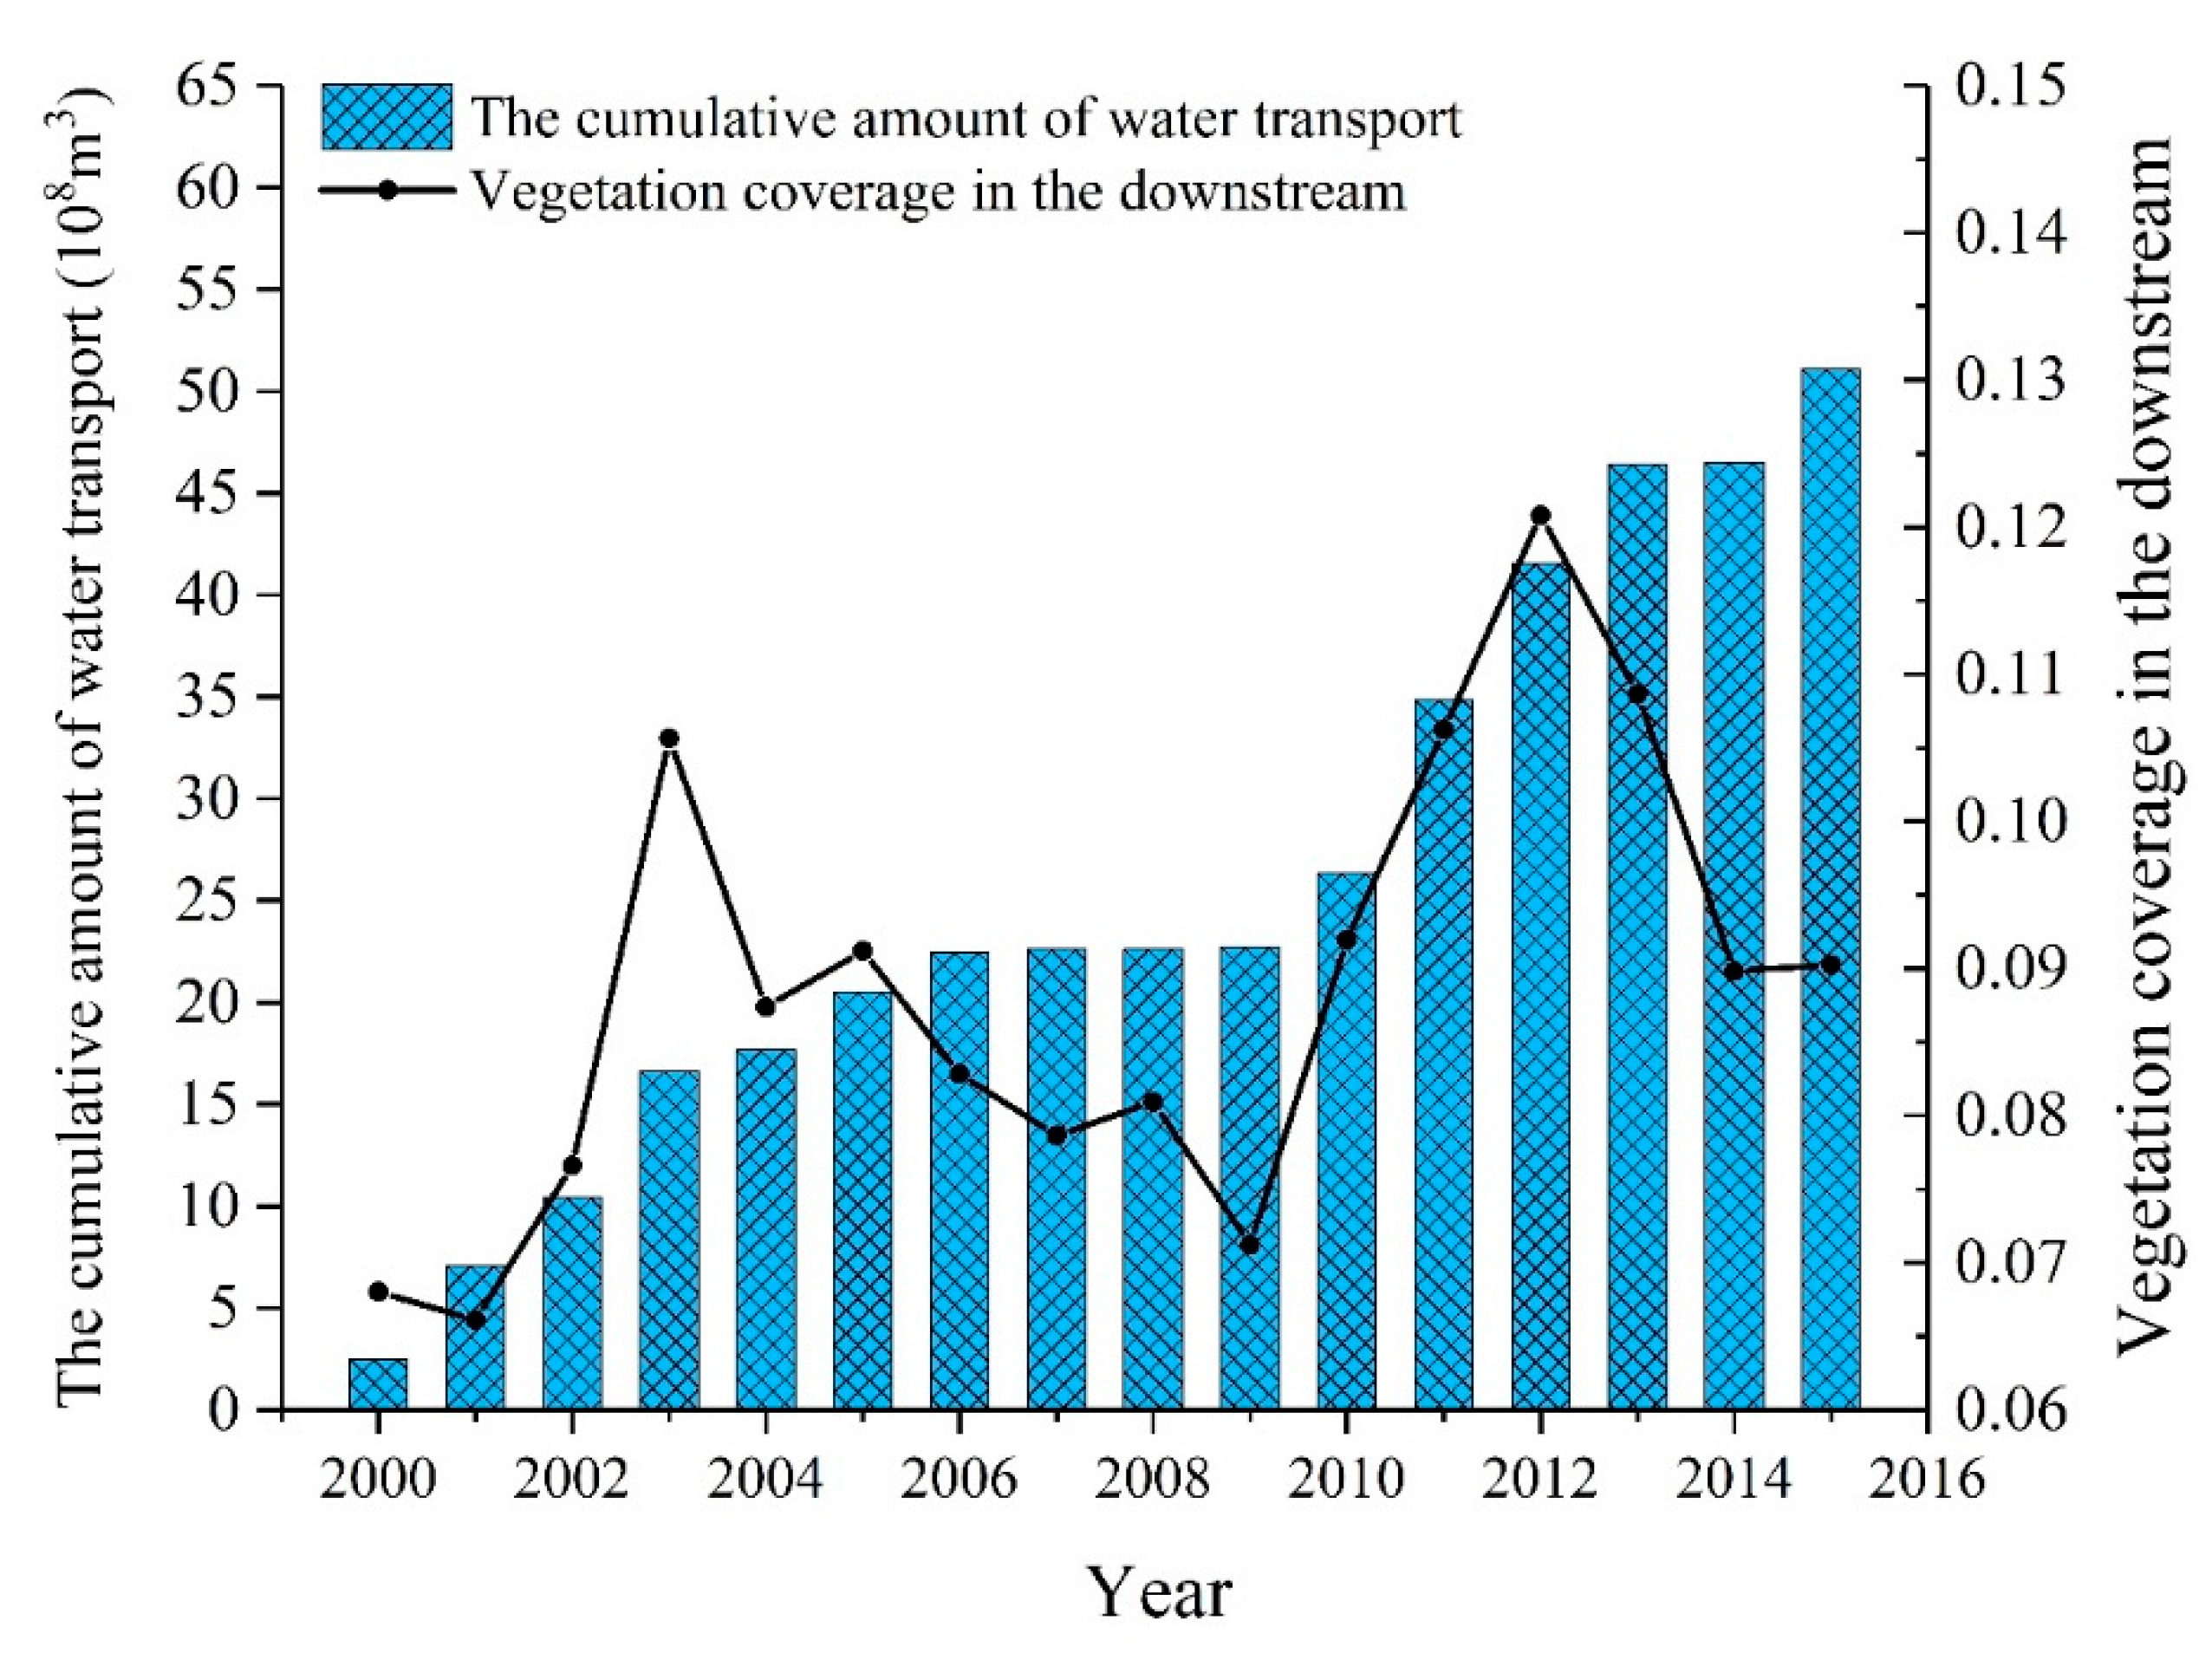
Figure 7 illustrates the cumulative ecological water transported and the vegetation coverage index in the TR downstream. The downstream vegetation coverage showed a trend of increasing-decreasing-increasing-decreasing. Comparing the vegetation coverage with the ecological water transport, it was found that the ecological water transport decreased significantly from 6.25 to 1.02 million m3 in 2003–2004, which corresponds to a turning point of vegetation coverage from increasing to decreasing. From 2009 to 2010, the amount of ecological water transport increased significantly from 0.11 to 3.64 million m3, corresponding to a turning point of vegetation coverage decreasing to increasing. Note that the vegetation coverage index declined during 2003–2009, this is likely caused by a sharp deduction in the water transport during 2003–2009. After 2009, the water transport to the downstream was reinitialized, the vegetation coverage index increased, and thus the ecological system was getting improved.
Correlation coefficients between the vegetation coverage index and the amount of water transport in each year ranged from −0.287 and 0.641 (Table 5), indicating that the vegetation coverage has a significant correlation with the amount of water transport in the same year (p < 0.01). the vegetable coverage and the cumulative amount of water transport were highly correlated in the TR downstream, with slightly higher correlation coefficients, displaying 0.649 at the present year. It is interesting to note that the vegetation coverage index has a higher correlation coefficient with the cumulative amount of water transport up to the present year than up to the previous years, suggesting that the cumulative water transport up to the present year is the dominant factor (p < 0.01) affecting the vegetation coverage in the TR downstream.

3.3. Landscape Pattern Condition and Change

3.3.1. Landscape Type Change

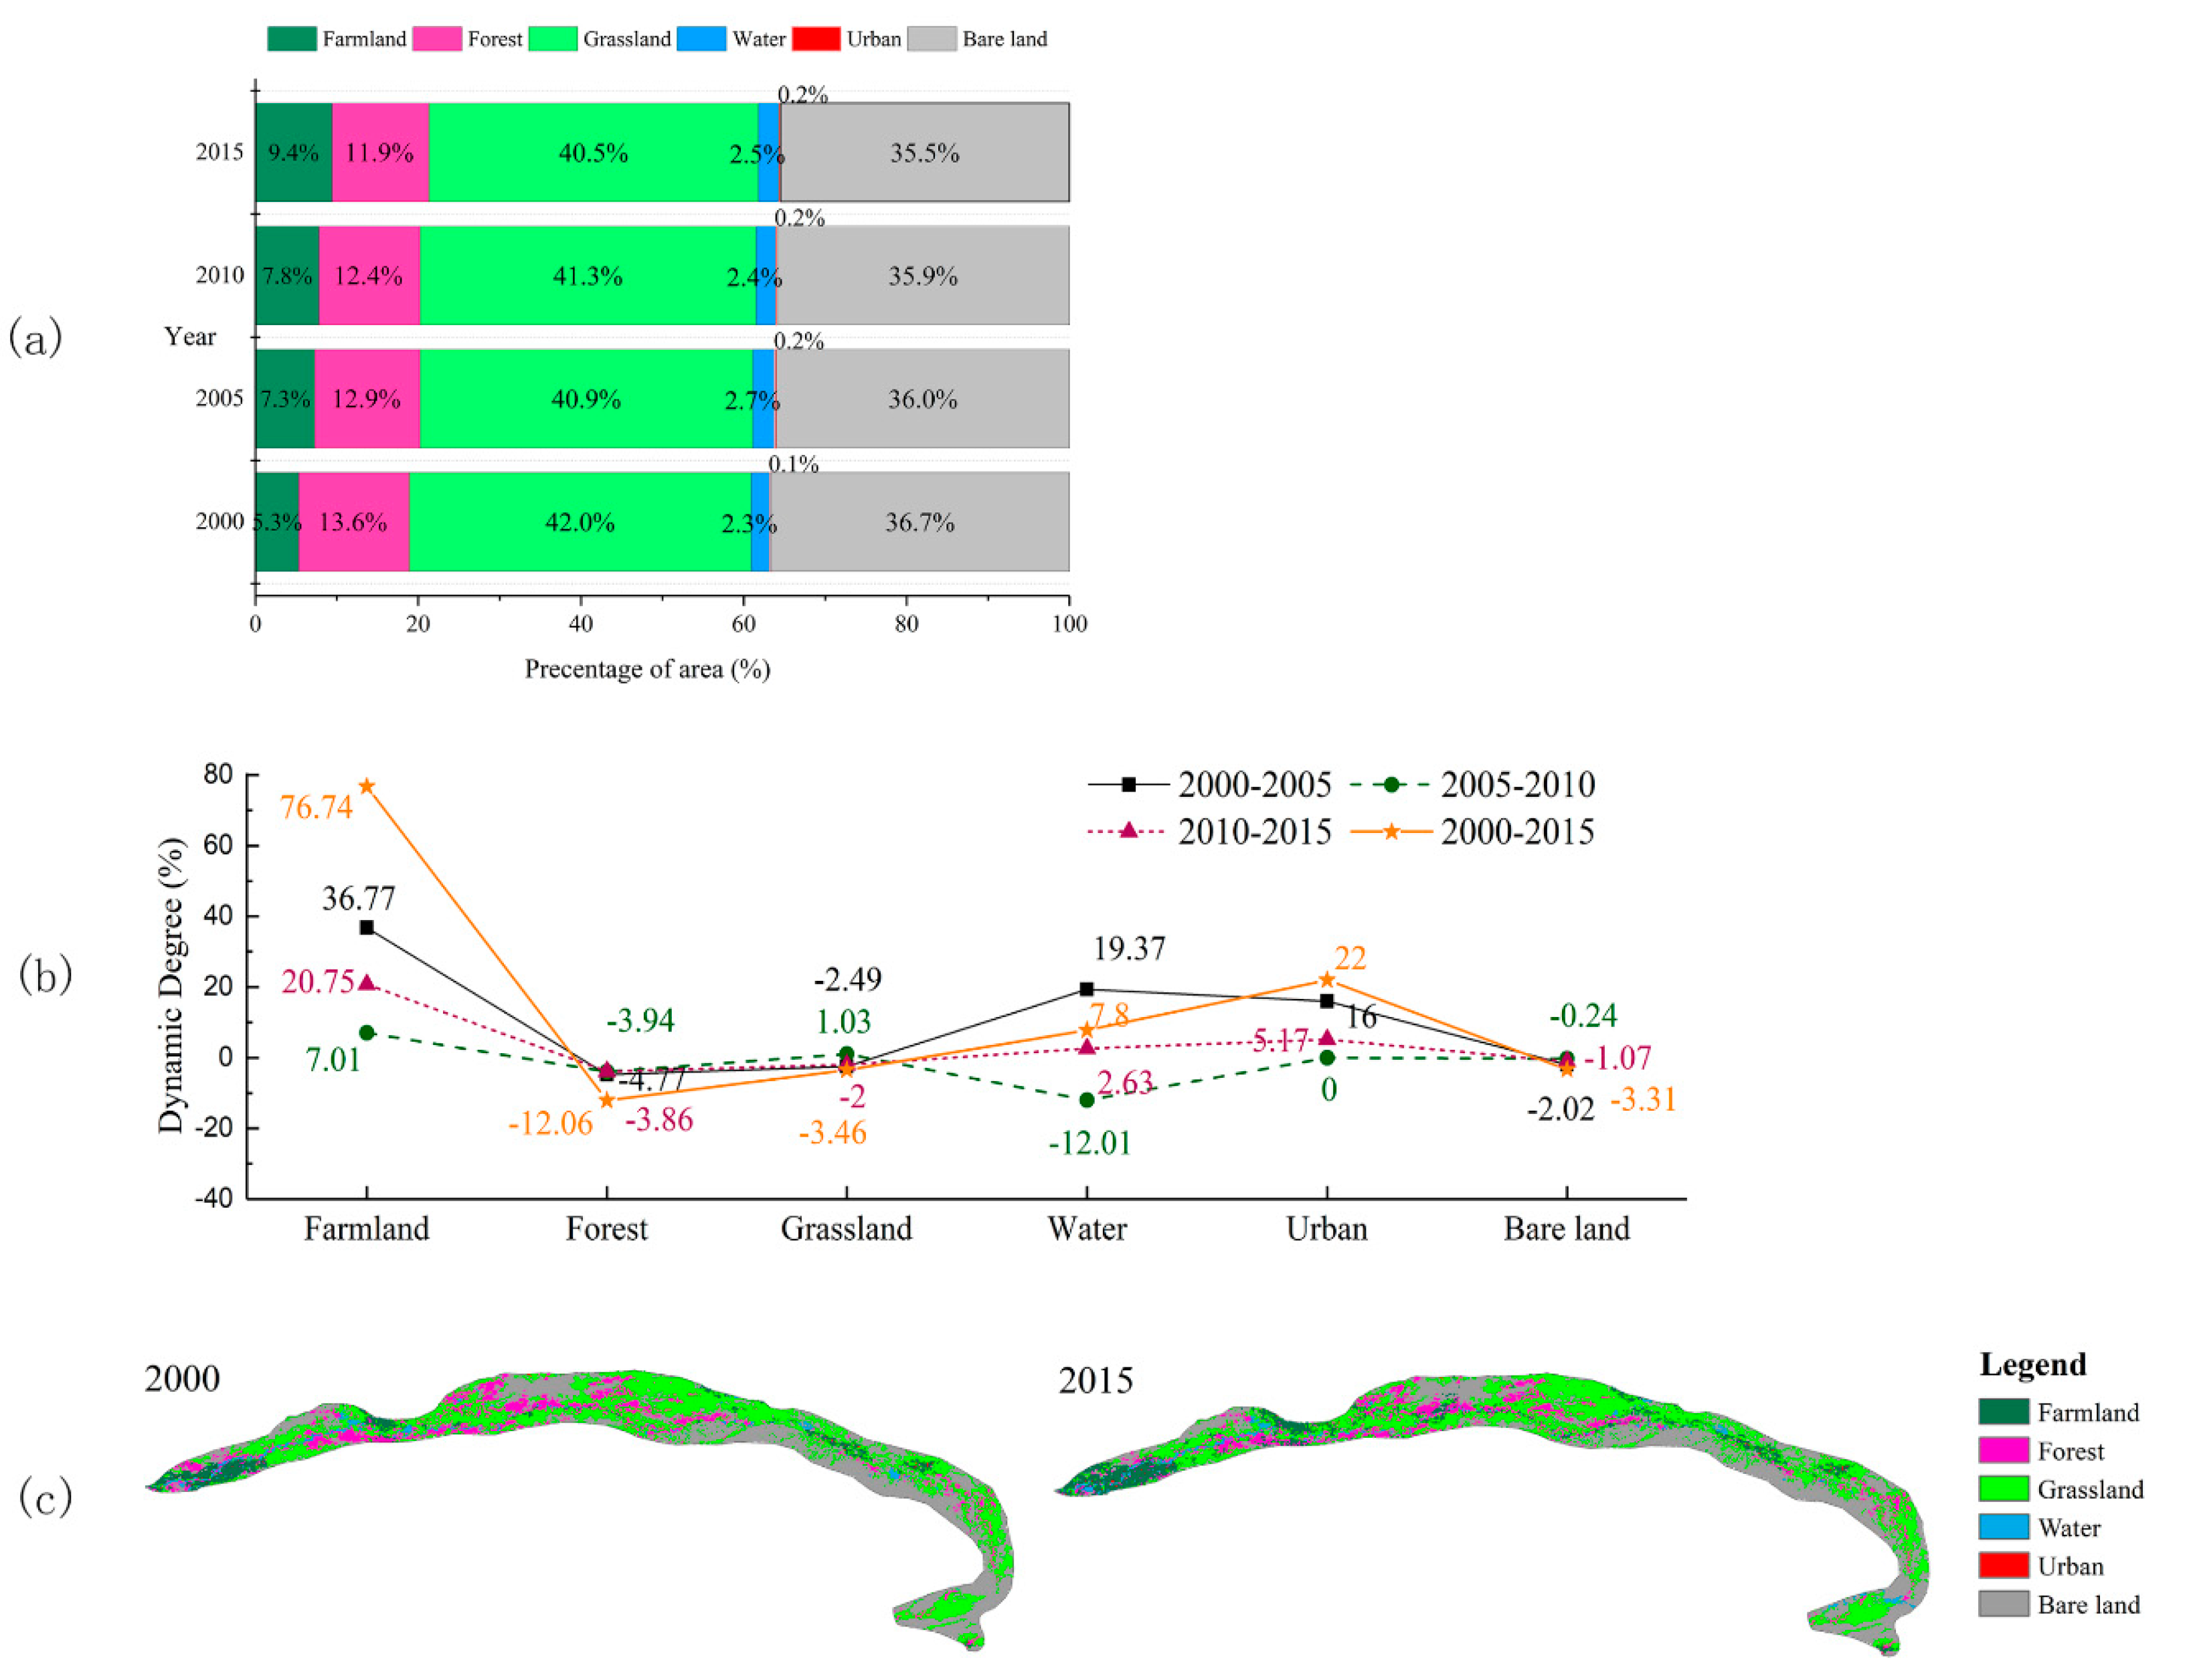
The land use data was used to report the landscape type changes in the mainstream of TR in the four periods from 2000–2015 (Figure 8). In order to evaluate the dynamics of landscape type changes in the study area, we chose the dynamic degree index [41] to reflect the magnitude of landscape type changes and potential hotspots. It was found that grassland, bare land, and forest were the three main landscape types in the TR mainstream. In recent years, the proportion of farmland in the total area has increased rapidly from 5.3% in 2000 to 9.4% in 2015, with a growth rate of 76.74%. The area of forest and grassland has decreased by 12.06% and 3.46%, respectively. The whole basin was in an unbalanced state with the increase of urban and farmland and a decrease of forest and grassland, confirming the results of Zumrat et al. (2011) [42]. It is noteworthy that the land use types changed dramatically during 2000–2005, and the six land use types have the greatest changes in that five years.
Figure 8c is the distribution map of land use in the mainstream of the TR from 2000 to 2015. Combined with the trend map of vegetation coverage (Figure 5), the area where vegetation coverage in the upstream has significantly improved is due to the conversion of forest and grassland into the farmland according to the previous research (Zhang et al., 2019 and Sun et al., 2020) [43,44]. The area with an obvious improvement was more consistent with the bending direction of the river, which showed that the hydraulic gradient was larger in a certain range from the river, the groundwater level flows from high to low, and the rising of the groundwater level near the buffer zone was beneficial to the growth of riparian vegetation. As shown in Figure 8c, scattered forest land appears in the lower reaches of the TR in 2015, the conversion of other land use types to forest has made the vegetation coverage of the downstream grow slightly, and the increase of forest land area will bring good news for the restoration of the ecological environment.

3.3.2. Landscape Ecological Risk

Hierarchical regression models were used to test the associations of landscape fragmentation index (Ci), landscape isolation index (Ni), landscape dominance index (Di), landscape fragility index (Fi) with landscape loss degree (Ri), results from hierarchical regression models are summarized in Table 6. The final model including all four variables explained 96.6% of the variance in the landscape loss degree. We demonstrated that Ci and Fi showed positive correlations with Ri in the TR, and Ci is the most important influencing factor of Ri. The landscape pattern index of each landscape type in different periods of TR is given in Table S2. The Ri values of farmland, forest, sparse forest, and high-covered grassland increased continuously, consistent with the change trend of Ci.
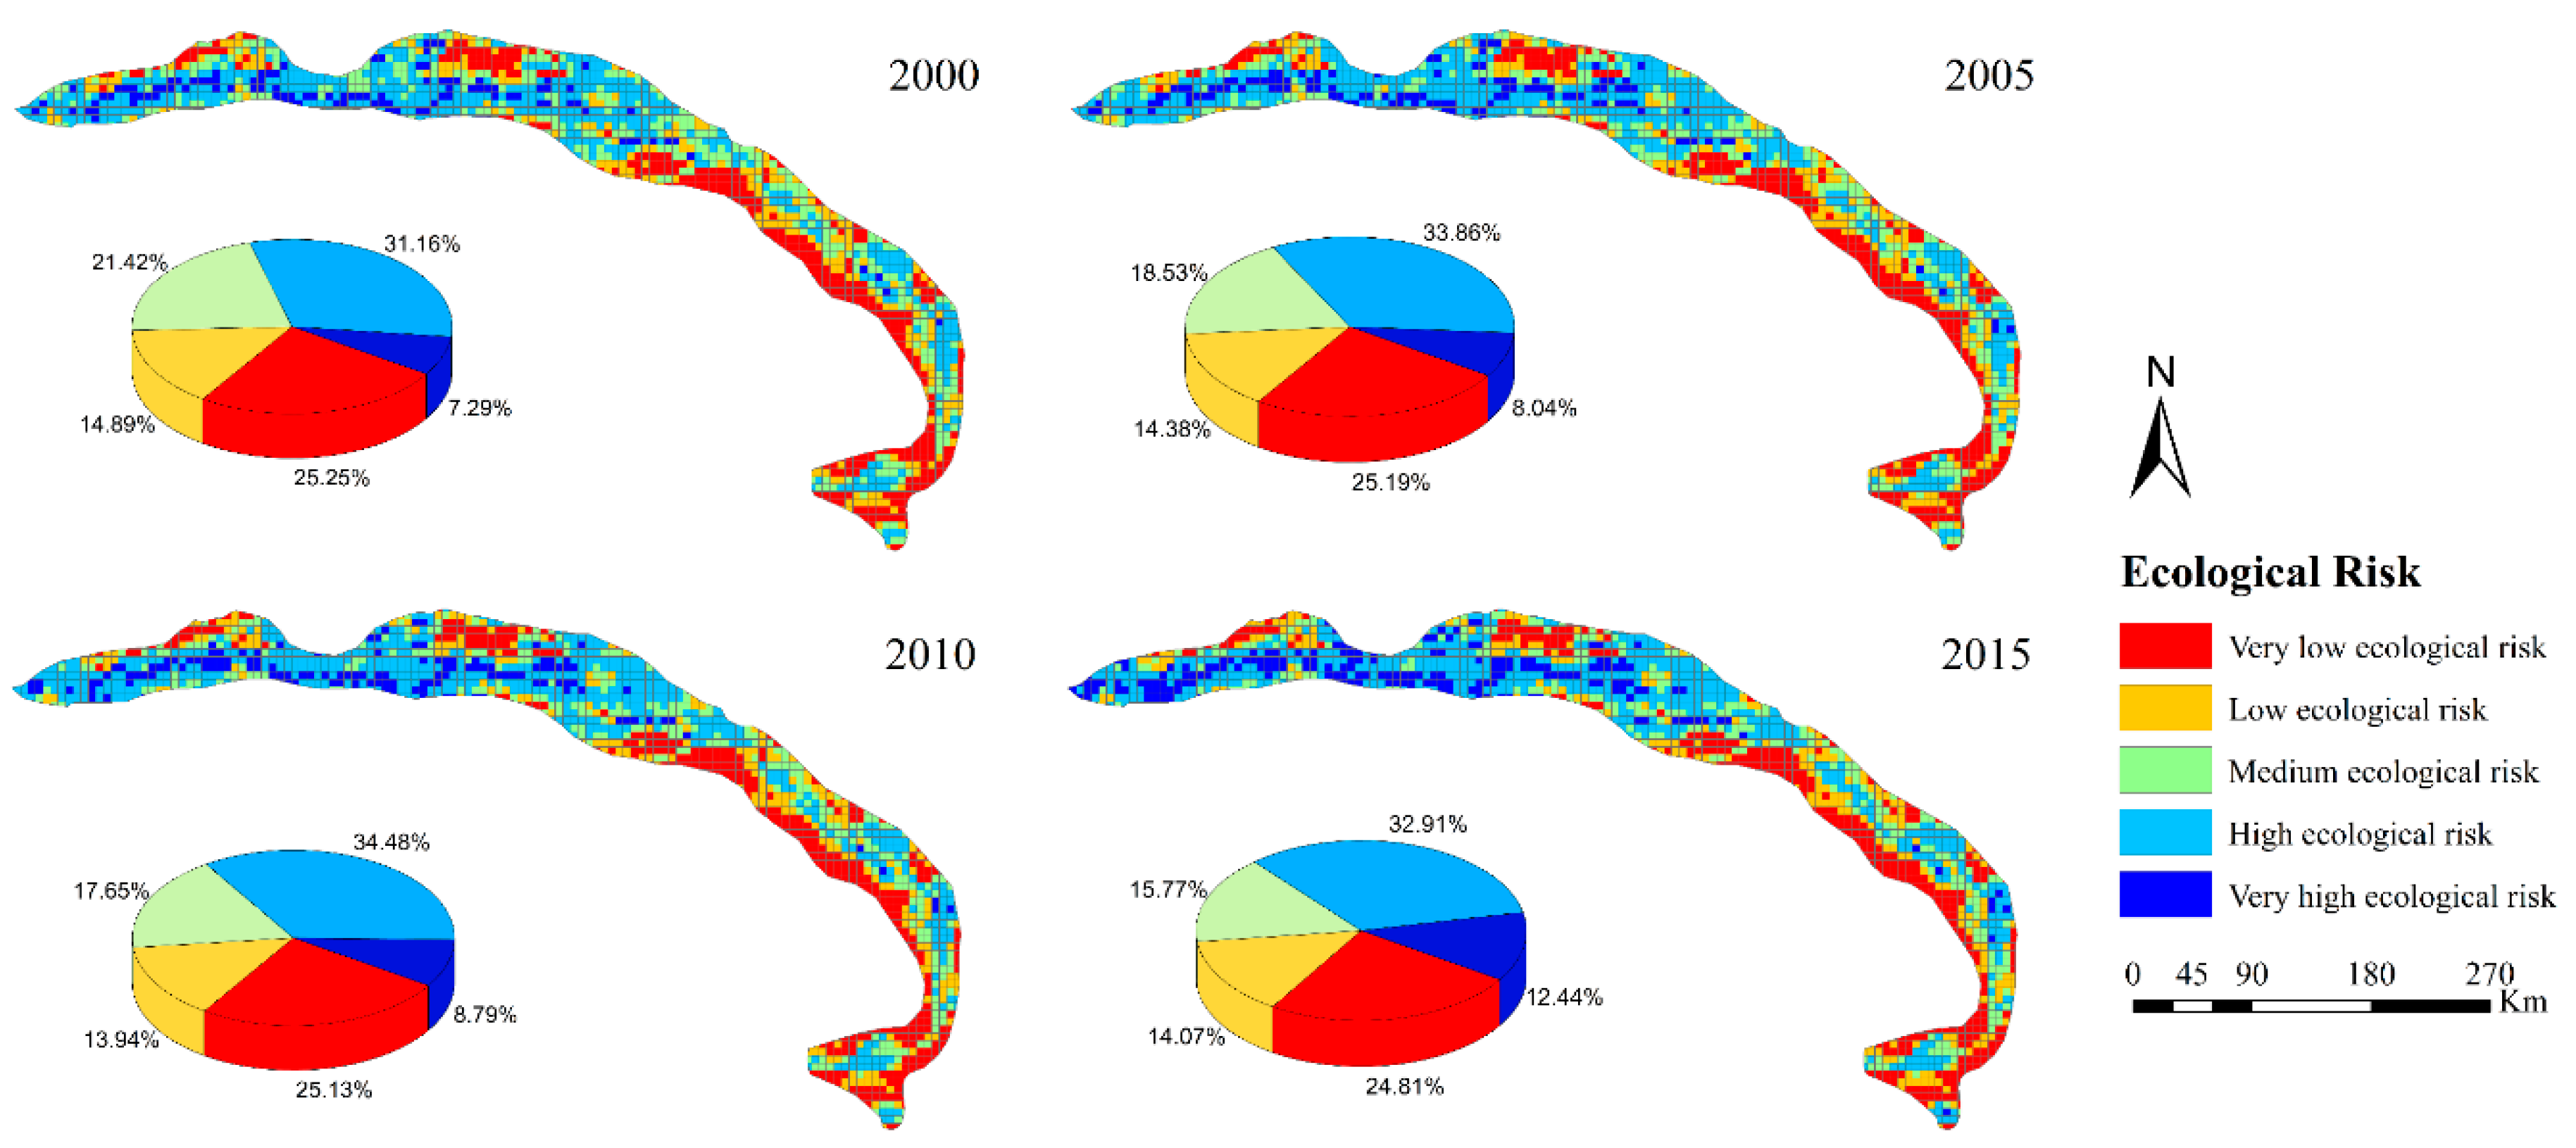
Considering the thresholds of ERI values of ecological risk zones in the mainstream of TR, the degree of ecological risk was classified into very low, low, medium, high, and very high ecological risk by the Natural Breaks [45] (Figure 9). From the result, we could find that the proportions of high and very high ecological risk both increased with time, with a growth rate of 5.65% and 70.69%, respectively. The ecological risk level varied throughout the TR with a high-to-low spatial distribution from upstream to downstream. Bare land and grassland in the study area were widely distributed with a low ecological risk, which results from the fact that the bare land in the downstream was not easy to reclaim and convert. It is worth noting that since 2000, due to the farmland expansion in the upstream and midstream, the proportion of high ecological risk was gradually increased. On the one hand, after 2000, the dense population and frequent economic activities in residential areas have made the conversion rate of landscape types more complicated, especially in upper reaches; on the other hand, the landscape ecological risk index values of many risk zones are located at the critical value of grading, so they are relatively easy to be converted.

3.3.3. Relationship between Vegetation Coverage and ERI

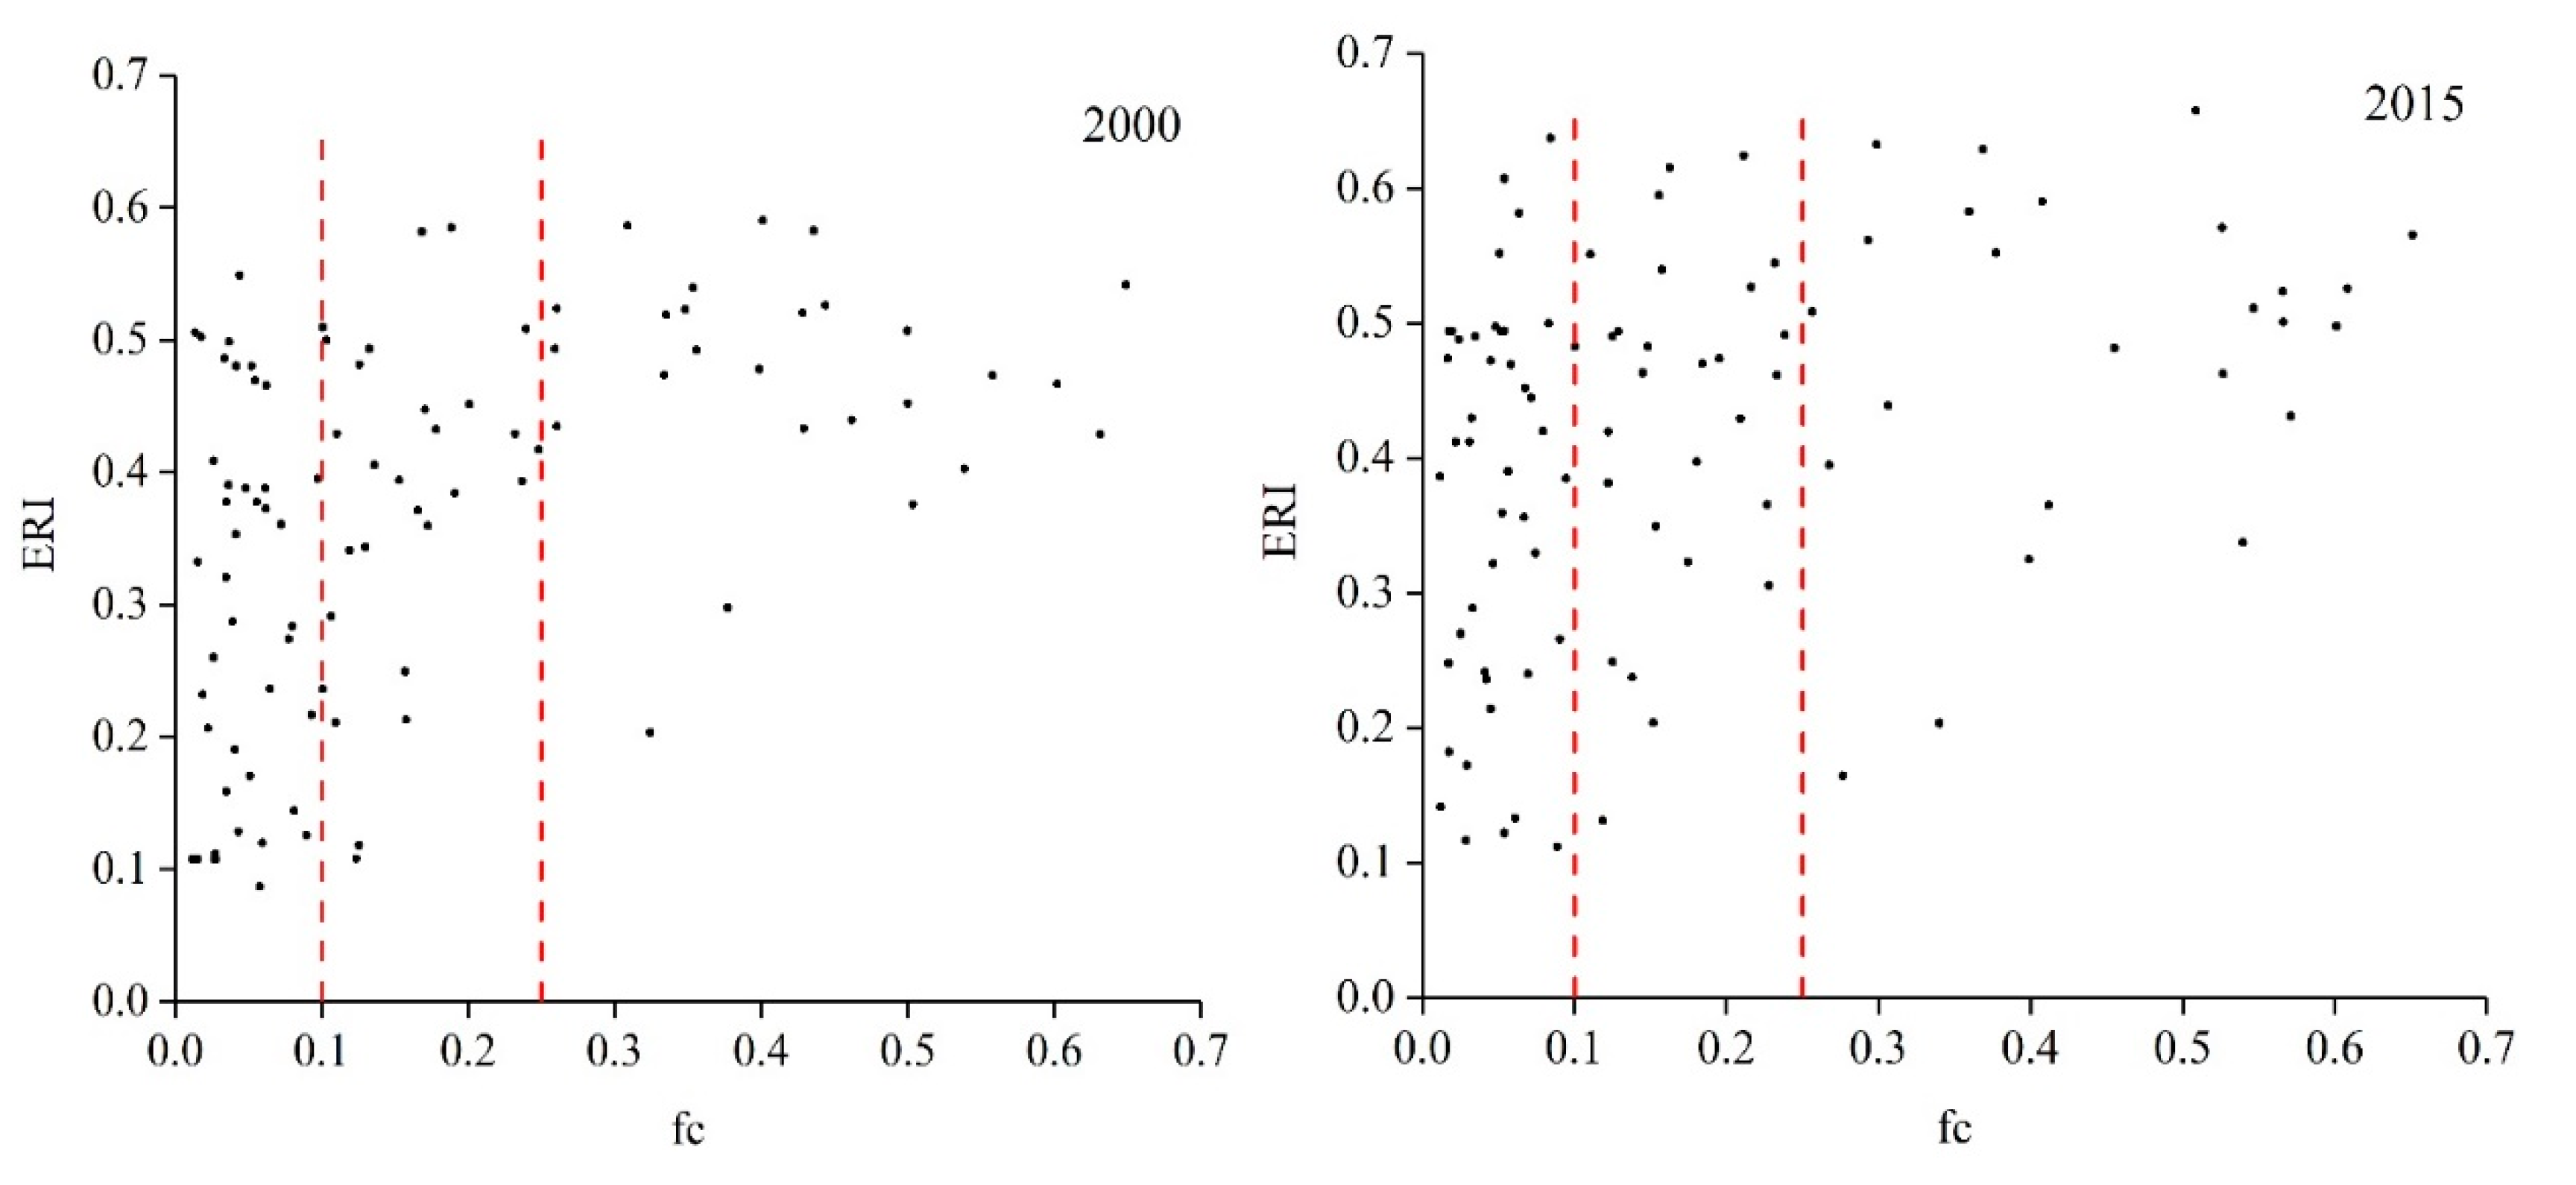
By comparing and analyzing the relationship between vegetation coverage index (fc) and ERI (Figure 10), the fc value was resampled on a 15 × 15 km grid to establish the relationship between fc and ERI at the pixel scale. It could be found that there was little correlation between fc and ERI, and the scatter points representing ERI in Figure 10 correspond to different fc values. In the bare land areas with fc < 0.1, the results showed that ERI has a wide distribution range from 0 to 0.6, which was closely related to the characteristics of bare land. The landscape vulnerability of bare land was relatively high, if it converts to other land use types frequently, the ERI value will be high; if the bare land does not transform in a long period of time, corresponding to the desert area in the downstream of the TR, the ERI value remains low. In both the high vegetation coverage areas and the oasis agricultural areas with fc ≥ 0.25, the ERI values were mostly maintained at a high level corresponding to the high-cover grassland, forest, and farmland, which was related to the increase of farmland areas in recent years, meanwhile, the distribution of farmland, grassland, and forest presents a trend of decentralization under the influence of human activities.

4. Discussion

4.1. Vegetation Dynamics and Its Response to the Hydrological Situation

The spatial-temporal heterogeneity of the vegetation coverage index is large, the vegetation coverage index in the upstream has a greater slope than those in the midstream and downstream, these results confirm previous findings by Guan et al. (2018) [19]. The vegetation restoration in the upstream of the TR is the best, because the streamflow of headstreams in the upstream has experienced rapid increase over the years [46], and the vegetation in the upstream has been restored, our studies are highly correlated with the results by Xu et al. (2019) [47]. Furthermore, the upstream was the densely inhabited and the oasis agricultural region, the change of vegetation coverage there is closely related to the large-scale reclamation of the farmland. The rapid development of upstream agriculture inevitably brings a large amount of water consumption, which makes the available water in the middle and lower reaches sharply reduced, a lower availability of water resources forces farmers to relocate their activities to the upstream to obtain sufficient water for agricultural activities [48], thus forming a vicious cycle. The vegetation restoration in the downstream is the weakest, the TR downstream has been gradually dried up since the 1970s [49], consequently, the downstream underwent a long process of ecological degradation, including groundwater decline, death of natural vegetation, salinization, and desertification [50]. The implementation of ecological water conveyance project along the lower reaches of the TR has led to a slow recovery of the vegetation coverage [51,52,53], although the gradual process of vegetation restoration in TR still takes time. It proved that the water transports are the realistic index for identifying change in vegetation growth in the TR downstream [48,50,54]. Generally, the vegetation coverage in the mainstream has a positive slope, presenting a remarkable improvement in recent years, which is consistent with the research conclusion that the vegetation activity is increasing in northwest China since 2000 by Dai et al. (2011) [14].
Although previous studies suggested that the vegetation coverage in the arid and semi-arid regions was probably affected by precipitation and temperature [36,55,56], our study showed that the correlation between the vegetation coverage and the climatic factors was relatively weak in the mainstream of TR. The Tarim River Basin is an extremely arid desert climate area, the effect of precipitation on vegetation growth can be ignored according to the previous research (Wang et al., 2011) [57], and the distribution of natural vegetation in the mainstream is mainly affected by surface streamflow. In the upstream and midstream, the vegetation coverage index was tightly bound to the overflow days, especially the cumulative overflow days at the same year. The improvement of vegetation growth requires that the number of large floods reach a certain cumulative value, the upstream can be properly built with gates to retain part of the water volume and ensure a certain number of overflow days every year. Ecological water conveyance is an important factor to promote the growth of downstream vegetation [40]. In the northwest arid region of China, vegetation growth relies on the river water and groundwater [40,57,58,59], in order to restore the riparian vegetation degradation in these regions, surface water has been transported from upper-middle to lower basins in the last years [60], and impacts of environmental flow controls project implementation in groundwater levels on vegetation along the Heihe River and Shiyang River in western China have been reported in previous studies [57,59]. Implying that local governments should continue to implement policies that favor the projects of ecological water transport to further improve the fragile eco-environment in the TR.

4.2. Implications of Evolution Results of Landscape Ecological Risk

The ecological risk at landscape is closely related to the changes of land use [61]. Significant changes in land use occurs in the TR since 2000, which is consistent with the study by Song et al. (2016) [51]. Many studies have carried out the ecological risk assessment of China [7,16], and the research regions involved Heihe River, Shiyang River, Manas River in arid area, Taihu Lake, and Poyang Lake in humid area [16,18,62,63,64,65]. Muyibul et al. examined the spatiotemporal changes of land use from 1995 to 2015 in an oasis in the middle reaches of the Keriya River, southern Tarim Basin [66], on the base of previous studies, we researched the landscape ecological risk of the mainstream of the TR. Although with the growth of population in the Alar Reclamation Area, the forest land in the upstream of the TR has been converted into farmland, which has increased vegetation coverage, and high ecological risk areas have increased significantly at the same time. This study concluded that the policy of agricultural land exploitation makes a landscape fragment and increases the ecological risk of land use, which has been suggested in the study by Xie et al. (2013) [16]. Under the limitation of available soil and water resources in the TR, the development of farmland in the later period should be restricted as much as possible. The landscape fragmentation index values of urban land decreased continuously, which indicates that the distribution of this landscape type tends to centralization, and this change was related to the fact that urban land was greatly affected by human activities. The landscape fragmentation index values of farmland, forest, and grassland were gradually increasing, it means that the distribution of these three landscape types presents a trend of decentralization and the future ecological risk of which increase greatly. Land use change can affect ecological security and the method of ecological risk assessment of land use in this study is feasible, which also can be seen by other findings [67,68]. Landscape ecological risk grades increased because of a lack of suitable overall development planning and coordinated arrangements [18], and TR is no exception, we can find that the overall ecological risk will increase in TR, partly due to the cumulative effects of human activities in these areas. The ecological risk assessment in Manas River (the TR is located in the same province) based on the landscape index had similar results as this research [15], the high ecological risks largely caused by urbanization occurred in the central plain, which coincides with the results in this paper that the ecological risk is higher in the upstream than in the downstream. These consistencies indicate that this research corresponds to the actual landscape ecology in the mainstream of the TR and land use processes can reflect the influence of human activities on landscape ecology.

4.3. Limitations and Future Research Directions

In semi-arid and arid environments, floodplain riparian ecosystems are often the dominant landscapes [69], they are also the sources of water supplies for desert cities. Common impacts to riparian vegetation often include flow alteration from water withdrawal, diversion or impoundment and intensive agriculture [70]. However, because of poor management and protection, the overall ecological risks have increased in TR, referring to the management experience of other riparian ecosystems, a few future research directions still need to be discussed: (1) How to improve floodplain flows. Improving or reconnecting floodplain flows on regulated rivers is a primary target of river restoration [71]. Riparian vegetation change was predominantly caused by human land-use impacts or vegetation change that likely resulted from streamflow and disturbance regime alteration. In the absence of periodic flood overflows, restoration of many physical and biological functions is not possible [72]. Moreover, because of the importance of flooding overflow for the dynamics of riparian vegetation, its absence prevents riparian landscapes from being restored to a self-sustaining condition [73]. The current work only proves that the number of overflow days is of great significance for landscape restoration. However, how to regulate and control water resources through the timing, frequency, magnitude, and duration of ecologically-important high and low flows at the basin-wide scale remains to be further studied. (2) How to reduce the landscape fragmentation index. To achieve a successful long-term landscape ecological restoration, expanding and connecting some of these patches may be necessary [72]. The landscape fragmentation index values of sparse forest, high-covered grassland, and low-covered grassland were gradually increasing in the mainstream of TR, it is therefore vital to connect the patches of these land use types. All of the problems listed above remain to be further discussed.

5. Conclusions

Knowledge of vegetation dynamics in relation to water resources conditions and the current status of landscape ecological risk is vital for developing adaptation strategies to address the challenges posed by the eco-water transfer project and human activities. NDVI is an excellent indicator for investigating the dynamic variations of natural vegetation, and LUCC can reflect ecological risk well at regional scales. This study used the latest MODND1M dataset, land use data, meteorological data, and hydrological data to assess the vegetation coverage changes and landscape ecological risk over the period from 2000–2015 in the TR mainstream, China. We found that:
The vegetation coverage index was fluctuant but showed a generally increasing trend in each of the three segments of the TR during 2000–2015. The areas with significant vegetation improvement were mainly distributed along the rivers, which suggested that ecological protection and restoration should be focused on the riparian zone (~20 km away from the river) as more than 80% of the vegetation was distributed in this region. In the upstream and midstream, the vegetation coverage index was tightly bound to the overflow days, especially the cumulative overflow days at the same year. While in the downstream, it is thought that the ecological water transport was implicated in the recovery of vegetation coverage to some extent. To sum up, the overflow days and the impact of cumulative ecological water delivery had surpassed natural factors, becoming the main driving factors of vegetation coverage changes in TR, and maintaining the continuity of the ecological water diversion project is crucial to ecosystem restoration. In the arid area, the spatiotemporal dynamics of vegetation are largely determined by water availability, the segmented driving factors analysis provide a new idea for better study of the vegetation coverage change, particularly in the large watershed with complex conditions.
Grassland, bare land, and forest are the three main landscape types in the mainstream of TR. The land use types changed dramatically and the whole basin was in an unbalanced state with increasing of urban and farmland and decreasing of forest and grassland. In general, due to the increase of the area in proportion with high and very high ecological risks, the overall ecological risk of the whole basin exhibited an upward tendency. Based on the land use data and landscape ecological risk index, the ecological risk assessment can be available in the region where the extent is broad and the public and government supervision is limited. It can provide a useful and efficient way to diagnose the areas with high ecological risks which may cause adverse effects to adjacent areas. Meanwhile, the development of remote sensing technologies may have great potential to support ecological risk assessment with the proposed method.

Supplementary Materials

The following are available online at https://www.mdpi.com/2073-4441/12/8/2156/s1, Figure S1: Cumulative distribution frequency of vegetation from 2000 to 2015 at the upstream, midstream and downstream of the TR. Note that blank blocks represent the cumulative distribution frequency of vegetation in buffer zones of every 1 km, red curve is the cubic polynomial fitting for the cumulative distribution frequency of vegetation over the upstream, midstream, downstream of the TR, Table S1: Variations of the number of vegetation pixels in different buffer zones in the TR over the period of 2000–2015.

Author Contributions

Data curation, H.Z.; funding acquisition, L.X.; investigation, G.W.; methodology, H.Z.; project administration, L.X.; resources, L.X., G.W., and Z.D.; supervision, L.X.; validation, X.M.; visualization, H.Z.; writing—original draft, H.Z.; writing—review and editing, H.Z. All authors have read and agreed to the published version of the manuscript.

Funding

This work was supported by the National Scientific Foundation of China (NSFC) (no. 51779074, no. 41371052); Tarim River Basin Management Bureau water conservancy science and technology project (TGJAKS –SKS-2019–002); Ministry of Water Resources’ special funds for scientific research on public causes (201501059); State’s Key Project of Research and Development Plan (2017YFC0404304), and the Jiangsu water conservancy science and technology project (2017027).

Conflicts of Interest

The authors declare that they have no conflict of interest.

References

  1. Based on Multi-Temporal Remote Sensing Imagery: A Case Study of Yuxian, China. Int. J. Environ. Res. Public Health 2019, 16, 511. [CrossRef] [PubMed] [Green Version]
  2. Bai, C.; He, H.; Li, Y.; He, W.; Zhao, H.; Mokhtar, A.; Keo, S.; Zhang, C.; Ma, Y.; He, Q. Land cover dynamic change in the Napahai Basin using the optimized random forest model. J. Appl. Remote Sens. 2019, 13, 044158. [Google Scholar] [CrossRef]
  3. Islam, S.; Zhang, M.; Yang, H.; Ma, M. Assessing inconsistency in global land cover products and synthesis of studies on land use and land cover dynamics during 2001 to 2017 in the southeastern region of Bangladesh. J. Appl. Remote Sens. 2019, 13, 048501. [Google Scholar] [CrossRef]
  4. Jiang, L.; Guli, J.; Bao, A.; Guo, H.; Ndayisaba, F. Vegetation dynamics and responses to climate change and human activities in Central Asia. Sci. Total Environ. 2017, 599–600, 967–980. [Google Scholar] [CrossRef]
  5. Shen, Q.; Ma, Y. Did water diversion projects lead to sustainable ecological restoration in arid endorheic basins? Lessons from long-term changes of multiple ecosystem indicators in the lower Heihe River Basin. Sci.Total Environ. 2020, 701, 134785. [Google Scholar] [CrossRef]
  6. Ling, H.; Guo, B.; Zhang, G.; Xu, H.; Deng, X. Evaluation of the ecological protective effect of the “large basin” comprehensive management system in the Tarim River basin, China. Sci. Total Environ. 2019, 650, 1696–1706. [Google Scholar] [CrossRef]
  7. Peng, J.; Zong, M.; Hu, Y.n.; Liu, Y.; Wu, J. Assessing Landscape Ecological Risk in a Mining City: A Case Study in Liaoyuan City, China. Sustainability 2015, 7, 8312–8334. [Google Scholar] [CrossRef] [Green Version]
  8. Liu, X.; Ren, L.; Yuan, F.; Xu, J.; Liu, W. Assessing vegetation response to drought in the Laohahe catchment, North China. Hydrol. Res. 2012, 43, 91–101. [Google Scholar] [CrossRef]
  9. Feng, D.; Wang, J.; Fu, M.; Liu, G.; Zhang, M.; Tang, R. Spatiotemporal variation and influencing factors of vegetation cover in the ecologically fragile areas of China from 2000 to 2015: A case study in Shaanxi Province. Environ. Sci. Pollut. Res. 2019, 26, 28977–28992. [Google Scholar] [CrossRef]
  10. Li, F.; Zhu, J.; Deng, X.; Zhao, Y.; Li, S. Assessment and uncertainty analysis of groundwater risk. Environ. Res. 2018, 160, 140–151. [Google Scholar] [CrossRef]
  11. Nourani, V.; Fard, A.F.; Gupta, H.V.; Goodrich, D.C.; Niazi, F. Hydrological model parameterization using NDVI values to account for the effects of land cover change on the rainfall-runoff response. Hydrol. Res. 2017, 48, 1455–1473. [Google Scholar] [CrossRef]
  12. Lamqadem, A.A.; Afrasinei, G.M.; Saber, H. Analysis of Landsat-derived multitemporal vegetation cover to understand drivers of oasis agroecosystems change. J. Appl. Remote Sens. 2019, 13, 014517. [Google Scholar] [CrossRef]
  13. Cao, X.; Chen, X.; Bao, A.; Wang, Q. Response of vegetation to temperature and precipitation in Xinjiang during the period of 1998–2009. J. Arid Land 2011, 3, 94–103. [Google Scholar] [CrossRef] [Green Version]
  14. Dai, S.; Zhang, B.; Wang, H.; Wang, Y.; Guo, L.; Wang, X.; Li, D. Vegetation cover change and the driving factors over northwest China. J. Arid Land 2011, 3, 25–33. [Google Scholar]
  15. Xue, L.; Zhu, B.; Wu, Y.; Wei, G.; Liao, S.; Yang, C.; Wang, J.; Zhang, H.; Ren, L.; Han, Q. Dynamic projection of ecological risk in the Manas River basin based on terrain gradients. Sci. Total Environ. 2019, 653, 283–293. [Google Scholar] [CrossRef]
  16. Xie, H.; Wang, P.; Huang, H. Ecological risk assessment of land use change in the Poyang Lake Eco-economic Zone, China. Int. J. Environ. Res. Public Health 2013, 10, 328–346. [Google Scholar] [CrossRef] [Green Version]
  17. Cui, L.; Zhao, Y.; Liu, J.; Han, L.; Ao, Y.; Yin, S. Landscape ecological risk assessment in Qinling Mountain. Geol. J. 2018, 53, 342–351. [Google Scholar] [CrossRef]
  18. Li, J.; Pu, R.; Gong, H.; Luo, X.; Ye, M.; Feng, B. Evolution Characteristics of Landscape Ecological Risk Patterns in Coastal Zones in Zhejiang Province, China. Sustainability 2017, 9, 584. [Google Scholar] [CrossRef] [Green Version]
  19. Guan, W.; Wei, H.; Zhong, J.; Huo, A.; Du, W.; Zheng, X. Remote Sensing Monitoring of Vegetation Cover Change in Tarim River Basin. Bull. Soil Water Conserv. 2018, 38, 244–248, 260. [Google Scholar]
  20. Du, J.-Q.; Jiaerheng, A.; Zhao, C.; Fang, G.-L.; Yin, J.-Q.; Xiang, B.; Yuan, X.-J.; Fang, S.-F. Dynamic changes in vegetation NDVI from 1982 to 2012 and its responses to climate change and human activities in Xinjiang, China. Ying Yong Sheng Tai Xue Bao = J. Appl. Ecol. 2015, 26, 3567–3578. (In Chinese) [Google Scholar]
  21. Wei, Z.; Wang, D.; Zhang, C.; Liu, X.; Zhang, H. Response of Vegetation Cover to Climate Change and Human Activities in Northwest China During 1999–2010. J. Desert Res. 2014, 34, 1665–1670. [Google Scholar]
  22. Wang, X.; Xu, H.; Ling, H.; Zhao, X.; Pan, C.; Wang, C. Effects of ecological water conveyance on recovery value of vegetation in the lower reaches of Tarim river. Agric. Res. Arid Areas 2017, 35, 160–166. [Google Scholar]
  23. Mansur, S.; Nurkamil, Y. Oasis land use change and its hydrological response to Tarim River Basin. Geogr. Res. 2010, 29, 2251–2260. [Google Scholar]
  24. Bao, A.; Huang, Y.; Ma, Y.; Guo, H.; Wang, Y. Assessing the effect of EWDP on vegetation restoration by remote sensing in the lower reaches of Tarim River. Ecol. Indic. 2017, 74, 261–275. [Google Scholar] [CrossRef]
  25. Gu, X.; Zhang, Q.; Singh, V.P.; Chen, X.; Liu, L. Nonstationarity in the occurrence rate of floods in the Tarim River basin, China, and related impacts of climate indices. Glob. Planet. Chang. 2016, 142, 1–13. [Google Scholar] [CrossRef] [Green Version]
  26. Chinese Geospatial Data Cloud. Available online: http://www.gscloud.cn (accessed on 20 May 2020).
  27. Chinese Meteorological Data Sharing Service System. Available online: http://data.cma.cn (accessed on 20 May 2020).
  28. Resources and Environment Science Data Center, Chinese Academy of Sciences. Available online: http://www.resdc.cn (accessed on 20 May 2020).
  29. Xia, J.; Yi, G.; Zhang, T.; Zhou, X.; Miao, J.; Bie, X. Interannual variation in the start of vegetation growing season and its response to climate change in the Qinghai-Tibet Plateau derived from MODIS data during 2001 to 2016. J. Appl. Remote Sens. 2019, 709, 136155. [Google Scholar] [CrossRef]
  30. Xiao, Q.; Tao, J.; Xiao, Y.; Qian, F. Monitoring vegetation cover in Chongqing between 2001 and 2010 using remote sensing data. Environ. Monit. Assess 2017, 189, 493. [Google Scholar] [CrossRef]
  31. Lankau, M.J.; Scandura, T.A. An investigation of personal learning in mentoring relationships: Content, antecedents, and consequences. Acad. Manag. J. 2002, 45, 779–790. [Google Scholar]
  32. Park, N.; Kee, K.F.; Valenzuela, S. Being Immersed in Social Networking Environment: Facebook Groups, Uses and Gratifications, and Social Outcomes. Cyberpsychol. Behav. 2009, 12, 729–733. [Google Scholar] [CrossRef] [Green Version]
  33. Tian, Y.; Liang, M. The NDVI Characteristics of Vegetation and Its Ten-day Response to Temperature and Precipitation in Beibu Gulf Coastal Region. J. Nat. Resour. 2016, 31, 488–502. [Google Scholar]
  34. Yu, G.A.; Li, Z.; Huang, H.; Liu, X. Human impacts on fluvial processes in a very arid environment: Case of Tarim River in China. Adv. Water Sci. 2017, 28, 183–192. [Google Scholar]
  35. Mao, D.; Wang, Z.; Luo, L.; Ren, C. Integrating AVHRR and MODIS data to monitor NDVI changes and their relationships with climatic parameters in Northeast China. Int. J. Appl. Earth Obs. Geoinf. 2012, 18, 528–536. [Google Scholar] [CrossRef]
  36. Du, J.; Shu, J.; Yin, J.; Yuan, X.; Jiaerheng, A.; Xiong, S.; He, P.; Liu, W. Analysis on spatio-temporal trends and drivers in vegetation growth during recent decades in Xinjiang, China. Int. J. Appl. Earth Obs. Geoinf. 2015, 38, 216–228. [Google Scholar] [CrossRef]
  37. Zhou, D.; Shen, Y.; Chen, Y.; Cuo, Y.; Zhang, B. Estimation of ecological water requirement of desert vegetation in the arid region of Northwest China. Chin. J. Ecol. 2015, 34, 670–680. [Google Scholar]
  38. Guo, J.; Wu, X.; Dong, G.; Li, Y.; Wu, R. Vegetation Coverage Change and Relative Effects of Driving Factors Based on MODIS /NDVI in the Tarim River Basin. Arid Zone Res. 2017, 34, 621–629. [Google Scholar]
  39. Yan, J.; Lu, G.; Xu, H.; Xu, X.; Ling, H. Spatial-Temporal Variations in Vegetation Cover and Evapotranspiration and Their Relationship in Tarim River During 2000–2014. Bull. Soil Water Conserv. 2018, 38, 248–255. [Google Scholar]
  40. Hao, X.; Li, W. Impacts of ecological water conveyance on groundwater dynamics and vegetation recovery in the lower reaches of the Tarim River in northwest China. Environ. Monit. Assess. 2014, 186, 7605–7616. [Google Scholar] [CrossRef]
  41. Wang, S.-Y.; Liu, J.-S.; Ma, T.-B. Dynamics and changes in spatial patterns of land use in Yellow River Basin, China. Land Use Policy 2010, 27, 313–323. [Google Scholar] [CrossRef]
  42. Zumrat, E.; Tursun, Q.; Ayxam, I.; Mnisahan, T.; Han, G. The land—Use changes and its environmental effects in Tarim River. J. Arid Land Resour. Environ. 2011, 25, 29–35. [Google Scholar]
  43. Sun, C.; Gong, L.; Ma, Y.; Zhu, H.; Zhao, J. Temporal and spatial pattern analysis of land use in typical oasis in the upper reaches of the Tarim River. J. Northwest A F Univ. Nat. Sci. Ed. 2020, 48, 1–10. [Google Scholar]
  44. Zhang, J.; Long, A.; Yu, J.; Ren, G.; Su, S.; Li, J. GIS and RS-based analysis on temporal and spatial changes of LUCC and landscape patterns in Tarim River Basin from 1990 to 2015. Water Resour. Hydropower Eng. 2019, 50, 18–26. [Google Scholar]
  45. Day, C.L.; Lew, R.A.; Mihm, M.C.; Harris, M.N.; Kopf, A.W.; Sober, A.J.; Fitzpatrick, T.B. The Natural Break Points for Primary-Tumor Thickness in Clinical Stage-I Melanoma. N. Eng. J. Med. 1981, 305, 1155. [Google Scholar]
  46. Yang, F.; Xue, L.; Wei, G.; Chi, Y.; Yang, G. Study on the dominant causes of streamflow alteration and effects of the current water diversion in the Tarim River Basin, China. Hydrol. Proc. 2018, 32, 3391–3401. [Google Scholar] [CrossRef]
  47. Xu, M.; Wang, X.; Sun, T.; Wu, H.; Li, X.; Kang, S. Water balance change and its implications to vegetation in the Tarim River Basin, Central Asia. Quat. Int. 2019, 523, 25–36. [Google Scholar] [CrossRef]
  48. Liu, T.; Fang, H.; Willems, P.; Bao, A.M.; Chen, X.; Veroustraete, F.; Dong, Q.H. On the relationship between historical land-use change and water availability: The case of the lower Tarim River region in northwestern China. Hydrol. Proc. 2013, 27, 251–261. [Google Scholar] [CrossRef]
  49. Su, B.; Wang, A.; Wang, G.; Wang, Y.; Jiang, T. Spatiotemporal variations of soil moisture in the Tarim River basin, China. Int. J. Appl. Earth Obs. Geoinf. 2016, 48, 122–130. [Google Scholar] [CrossRef]
  50. Wu, J.; Tang, D. The influence of water conveyances on restoration of vegetation to the lower reaches of Tarim River. Environ. Earth Sci. 2010, 59, 967–975. [Google Scholar] [CrossRef]
  51. Song, Y.; Bao, A.; Huang, Y.; Wang, Y.; Jiang, L. Eco-environmental Change in the Main Stream Area of the Tarim River before and after Implementing the Comprehensive Management Project. Arid Zone Res. 2016, 33, 230–238. [Google Scholar]
  52. Li, L.; Zhang, X.; Chen, C.; Shen, M. Ecological effects of water conveyance on the lower reaches of Tarim River in recent twenty years. Arid Land Geog. 2018, 41, 238–247. [Google Scholar]
  53. Huang, F.; Chunyu, X.; Zhang, D.; Chen, X.; Ochoa, C.G. A framework to assess the impact of ecological water conveyance on groundwater-dependent terrestrial ecosystems in arid inland river basins. Sci. Total Environ. 2020, 709, 136156. [Google Scholar] [CrossRef]
  54. Aishan, T.; Halik, U.; Cyffka, B.; Kuba, M.; Abliz, A.; Baidourela, A. Monitoring the hydrological and ecological response to water diversion in the lower reaches of the Tarim River, Northwest China. Quat. Int. 2013, 311, 155–162. [Google Scholar] [CrossRef]
  55. Nie, Q.; Xu, J.; Ji, M.; Cao, L.; Yang, Y.; Hong, Y. The Vegetation Coverage Dynamic Coupling with Climatic Factors in Northeast China Transect. Environ. Manag. 2012, 50, 405–417. [Google Scholar] [CrossRef] [PubMed]
  56. Yao, J.; Chen, Y.; Zhao, Y.; Mao, W.; Xu, X.; Liu, Y.; Yang, Q. Response of vegetation NDVI to climatic extremes in the arid region of Central Asia: A case study in Xinjiang, China. Theor. Appl. Climatol. 2018, 131, 1503–1515. [Google Scholar] [CrossRef]
  57. Wang, P.; Zhang, Y.; Yu, J.; Fu, G.; Ao, F. Vegetation dynamics induced by groundwater fluctuations in the lower Heihe River Basin, northwestern China. J. Plant Ecol. 2011, 4, 77–90. [Google Scholar] [CrossRef]
  58. Zhu, J.; Yu, J.; Wang, P.; Yu, Q.; Eamus, D. Variability in groundwater depth and composition and their impacts on vegetation succession in the lower Heihe River Basin, north-western China. Mar. Freshwater Res. 2014, 65, 206–217. [Google Scholar] [CrossRef]
  59. Zhang, Y.; Yu, J.; Wang, P.; Fu, G. Vegetation responses to integrated water management in the Ejina basin, northwest China. Hydrol. Proc. 2011, 25, 3448–3461. [Google Scholar] [CrossRef]
  60. Chen, Y.; Chen, Y.; Xu, C.; Ye, Z.; Li, Z.; Zhu, C.; Ma, X. Effects of ecological water conveyance on groundwater dynamics and riparian vegetation in the lower reaches of Tarim River, China. Hydrol. Proc. 2010, 24, 170–177. [Google Scholar] [CrossRef]
  61. Gong, J.; Yang, J.; Tang, W. Spatially Explicit Landscape-Level Ecological Risks Induced by Land Use and Land Cover Change in a National Ecologically Representative Region in China. Int. J. Environ. Res. Public Health 2015, 12, 14192–14215. [Google Scholar] [CrossRef] [Green Version]
  62. Fan, J.; Wang, Y.; Zhou, Z.; You, N.; Meng, J. Dynamic Ecological Risk Assessment and Management of Land Use in the Middle Reaches of the Heihe River Based on Landscape Patterns and Spatial Statistics. Sustainability 2016, 8, 536. [Google Scholar] [CrossRef] [Green Version]
  63. Liang, E.; Zhang, J.; Yang, W. Spatiotemporal Variation of Landscape Ecological Vulnerability in Oasis in the Manas River Basin, Xinjiang. Arid Zone Res. 2017, 34, 950–957. [Google Scholar]
  64. Xu, X.; Yang, G.; Tan, Y.; Zhuang, Q.; Li, H.; Wan, R.; Su, W.; Zhang, J. Ecological risk assessment of ecosystem services in the Taihu Lake Basin of China from 1985 to 2020. Sci. Total Environ. 2016, 554–555, 7–16. [Google Scholar] [CrossRef] [PubMed]
  65. Zhang, X.; Shi, P.; Luo, J.; Liu, H.; Wei, W. The Ecological Risk Assessment of Arid Inland River Basin at the Landscape Scale:A Case Study on Shiyang River Basin. J. Nat. Resour. 2014, 29, 410–419. [Google Scholar]
  66. Muyibul, Z.; Xia, J.; Muhtar, P.; Shi, Q.; Zhang, R. Spatiotemporal changes of land use/cover from 1995 to 2015 in an oasis in the middle reaches of the Keriya River, southern Tarim Basin, Northwest China. Catena 2018, 171, 416–425. [Google Scholar] [CrossRef]
  67. Liu, S.; Yang, Z.; Cui, B. Effects of road on landscape and its ecological risk assessment: A case study of Lancangjiang River valley. Chin. J. Ecol. 2005, 24, 897–901. [Google Scholar]
  68. Bartolo, R.E.; van Dam, R.A.; Bayliss, P. Regional Ecological Risk Assessment for Australia’s Tropical Rivers: Application of the Relative Risk Model. Hum. Ecol. Risk Assess. An Int. J. 2012, 18, 16–46. [Google Scholar] [CrossRef]
  69. Macfarlane, W.W.; Gilbert, J.T.; Jensen, M.L.; Gilbert, J.D.; Hough-Snee, N.; McHugh, P.A.; Wheaton, J.M.; Bennett, S.N. Riparian vegetation as an indicator of riparian condition: Detecting departures from historic condition across the North American West. J. Environ. Manag. 2017, 202, 447–460. [Google Scholar] [CrossRef]
  70. Gu, F.; Liu, W. Applications of remote sensing and GIS to the assessment of riparian zones for environmental restoration in agricultural watersheds. Geo-Spat. Inf. Sci. 2010, 13, 263–268. [Google Scholar] [CrossRef]
  71. Kozak, J.P.; Bennett, M.G.; Piazza, B.P.; Remo, J.W.F. Towards dynamic flow regime management for floodplain restoration in the Atchafalaya River Basin, Louisiana. Environ. Sci. Policy 2016, 64, 118–128. [Google Scholar] [CrossRef] [Green Version]
  72. Hunter, J.C.; Willett, K.B.; McCoy, M.C.; Quinn, J.F.; Keller, K.E. Prospects for preservation and restoration of riparian forests in the Sacramento Valley, California, USA. Environ. Manag. 1999, 24, 65–75. [Google Scholar]
  73. Schaich, H.; Karier, J.; Konold, W. Rivers, regulation and restoration: Land use history of floodplains in a peri-urban landscape in Luxembourg, 1777–2000. Eur. Countrys. 2011, 3, 241–264. [Google Scholar] [CrossRef] [Green Version]
Figure 1. Map of the mainstream of Tarim river (TR), China. Note: The map was generated with data available from the Chinese Geospatial Data Cloud [26] using ESRI’s ArcGIS 10.2. The green triangles represent meteorological stations, 1 stands for Alar station, 2 for Kuche station, 3 for Luntai station, 4 for Korla station, 5 for Tikanlik station, and 6 for Ruoqiang station.
Water 12 02156 g001
Figure 2. Framework of vegetation dynamics and landscape ecological risk assessment.
Water 12 02156 g002
Figure 3. Percentage of the vegetation coverage types over the time period from 2000 to 2015 in the mainstream of the TR. Note that vegetation coverage was classified into four ranks based on the vegetation coverage index [37]: fc < 0.1 for bare land, 0.1 ≤ fc < 0.25 for low coverage area, 0.25 ≤ fc < 0.35 for high coverage area, and fc ≥ 0.35 for oasis agricultural area.
Water 12 02156 g003
Figure 4. Vegetation coverage index and plots of the percentage of vegetation coverage types from 2000 to 2015 at the upstream, midstream, and downstream of the TR. Note that the blank dash dot represents the average vegetation coverage index, the red line is the linear fitting for vegetation coverage over the upstream, midstream, and downstream of the TR.
Water 12 02156 g004
Figure 5. Spatial distribution of the slope calculated with Equation (2) in the mainstream of TR: (a) For the period from 2000 to 2005, (b) for the period from 2006 to 2010, (c) for the period from 2011 to 2015, and (d) for the period from 2000 to 2015.
Water 12 02156 g005
Figure 6. Plots of the vegetable coverage index and the overflow days over the time period from 2000 to 2015 (a) in the upstream and at the Alar station and (b) in the midstream and at the Xinquman station.
Water 12 02156 g006
Figure 7. Plot of the vegetation coverage index, the cumulative ecological water transported to the TR downstream over the period from 2000 to 2015.
Water 12 02156 g007
Figure 8. Percentage changes (a), dynamic degree index, (b) and spatial distribution (c) for land use maps in the mainstream of the TR from 2000 to 2015. The map was generated with data available from the Chinese Geospatial Data Cloud [27] using ESRI’s ArcGIS.
Water 12 02156 g008
Figure 9. Spatial distribution and proportion of ecological risk in the TR from 2000 to 2015.
Water 12 02156 g009
Figure 10. Scatter plot of the relationship between vegetation coverage index (fc) and ERI.
Water 12 02156 g010
Table 1. Classification of change in vegetation coverage in the TR over the period from 2000–2015.
Classification.2000–20052006–20102011–20152000–2015
Area/km2%Area/km2%Area/km2%Area/km2%
θ s ≤ −0.02Severe degradation5451.616754.8570616.41670.5
−0.02 < θ s < −0.005Slight degradation20055.825347.312,39535.720956.0
0.005 ≤ θ s ≤ 0.005Stability16,06446.2875125.211,58033.323,21966.8
0.005 < θ s 0.02Slight improvement10,38329.916,35947.129178.4707320.4
0.02 < θ s ≤ 0.05Obvious improvement442112.7444512.816544.819305.6
θ s > 0.05Significant improvement13233.89772.84871.42550.7
Table 2. Correlation coefficients between vegetable coverage index and climatic factors in the TR.
RegionPrecipitationTemperature
PCCLPCCPCCLPCC
Upstream0.098−0.127−0.172−0.265
Midstream−0.382−0.136−0.1740.057
Downstream0.3310.2240.1330.053
Table 3. Correlation coefficients between the vegetable coverage index and the overflow days in the upstream and midstream of the TR.
Related ItemAnnual Overflow DaysCumulative Overflow Days
Pearsonp-ValueEquationPearsonp-ValueEquation
Upstream00.1010.710 -0.89 **0.000 y = 0.0002x + 0.256 R2 = 0.792
Vegetation10.2620.346 -0.885 **0.000 y = 0.0002x + 0.258 R2 = 0.783
Cover20.30.297 -0.829 **0.000 y = 0.0002x + 0.271 R2 = 0.687
30.2350.439 -0.781 **0.002 y = 0.0002x + 0.276 R2 = 0.609
Midstream00.2120.431 -0.797 **0.000 y = 0.0001x + 0.125 R2 = 0.634
Vegetation10.370.175 -0.772 **0.001 y = 0.0001x + 0.128 R2 = 0.596
Cover20.767 **0.001 y = 0.0008x + 0.1266 R2 = 0.5880.707 **0.005 y = 0.00009x + 0.134 R2 = 0.499
30.2850.346 -0.591 *0.034 y = 0.00008x + 0.140 R2 = 0.349
Note: Time lag is for the overflow days (0 for the present year, 1 for the previous year, 2 for the previous two years, 3 for the previous three years, compared to the vegetation coverage index.). * Correlation is significant at the 0.05 level, ** Correlation is significant at the 0.01 level (two-tailed).
Table 4. Eco-water transport to the lower reaches of TR from 2000 to 2015.
DiversionStarting Time
(dd/mm/yy)
Ending Time
(dd/mm/yy)
Duration
(day)
Quantity
(108 m3)
Distance
(km)
1st14/05/2000 13/07/2000 610.99 110
2nd03/11/2000 14/02/2001 1042.27 218
3rd (1st period)01/04/2001 06/07/2001 971.84 310
3rd (2st period)12/09/200117/11/2001 671.98 363
4th20/07/2002 10/11/20021143.31 363
5th (1st period)03/03/2003 11/07/20031313.40 363
5th (2st period)12/09/2003 07/11/2003 562.85 363
6th (1st period)22/04/200425/06/2004641.02 363
6th (2st period)01/08/2004 15/09/2004 462.30 238
7th (1st period)18/04/2005 07/06/2005320.52 363
7th (2st period)30/08/200502/11/2005652.30 340
8th25/09/200630/11/2006 661.96 110
9th15/10/2007 21/11/2007 380.14 110
10th12/05/2009 20/06/2009 390.11 363
11th25/06/201011/11/2010 1393.64 363
12th (1st period)07/01/2011 25/01/2011190.37 363
12th (2st period)25/06/201123/11/20111518.15 363
13th27/04/201228/11/20122166.67 265
14th (1st period)25/04/201329/05/2013350.14 363
14th (2st period)06/08/201305/11/2013924.74 363
15th17/06/201426/06/2014100.07 172
16th18/08/201505/11/2015804.61 363
Table 5. Correlation coefficients between vegetable coverage index and the ecological water transported in the TR downstream.
Related ItemEco-Water TransportCumulative Eco-Water Transport
Pearsonp-ValueFormulaPearsonp-ValueFormula
Downstream00.641 **0.007 y = 0.0038x + 0.0763 R2 = 0.4110.649 **0.006 y = 0.0007x + 0.0706 R2 = 0.422
Vegetation10.570 *0.026 y = 0.0032 x + 0.0799 R2 = 0.3250.469 0.078 -
Cover20.3650.199 -0.2070.477-
3−0.2870.342 -−0.0120.969-
Note that the time lag (years): 0 for the present year, 1 for the previous year, 2 for the previous two years, 3 for the previous three years. * Correlation is significant at the 0.05 level, ** Correlation is significant at the 0.01 level (two-tailed).
Table 6. Hierarchical regression analysis of the landscape loss degree.
VariablesLandscape Loss Degree (Ri)
Model 1Model 2Model 3Model 4
BStd EBStd EBStd EBStd E
Constant (a)0.0180.0020.0110.002−0.0260.006−0.0210.006
Ci0.0960.0080.2090.0230.3230.0230.3240.021
Ni −0.0080.002−0.0130.001−0.0130.001
Di −0.0630.024
Fi 0.2070.0330.2360.032
R20.8260.9040.9580.966
Note that B represents unstandardized coefficient, Std E represents standard error, Ci represents the landscape fragmentation index, Ni represents the landscape isolation index, Di represents the landscape dominance index, and Fi represents the landscape fragility index.