An Empirical Study on the Ecological Economy of the Huai River in China


Abstract
:
1. Introduction
2. Literature Review
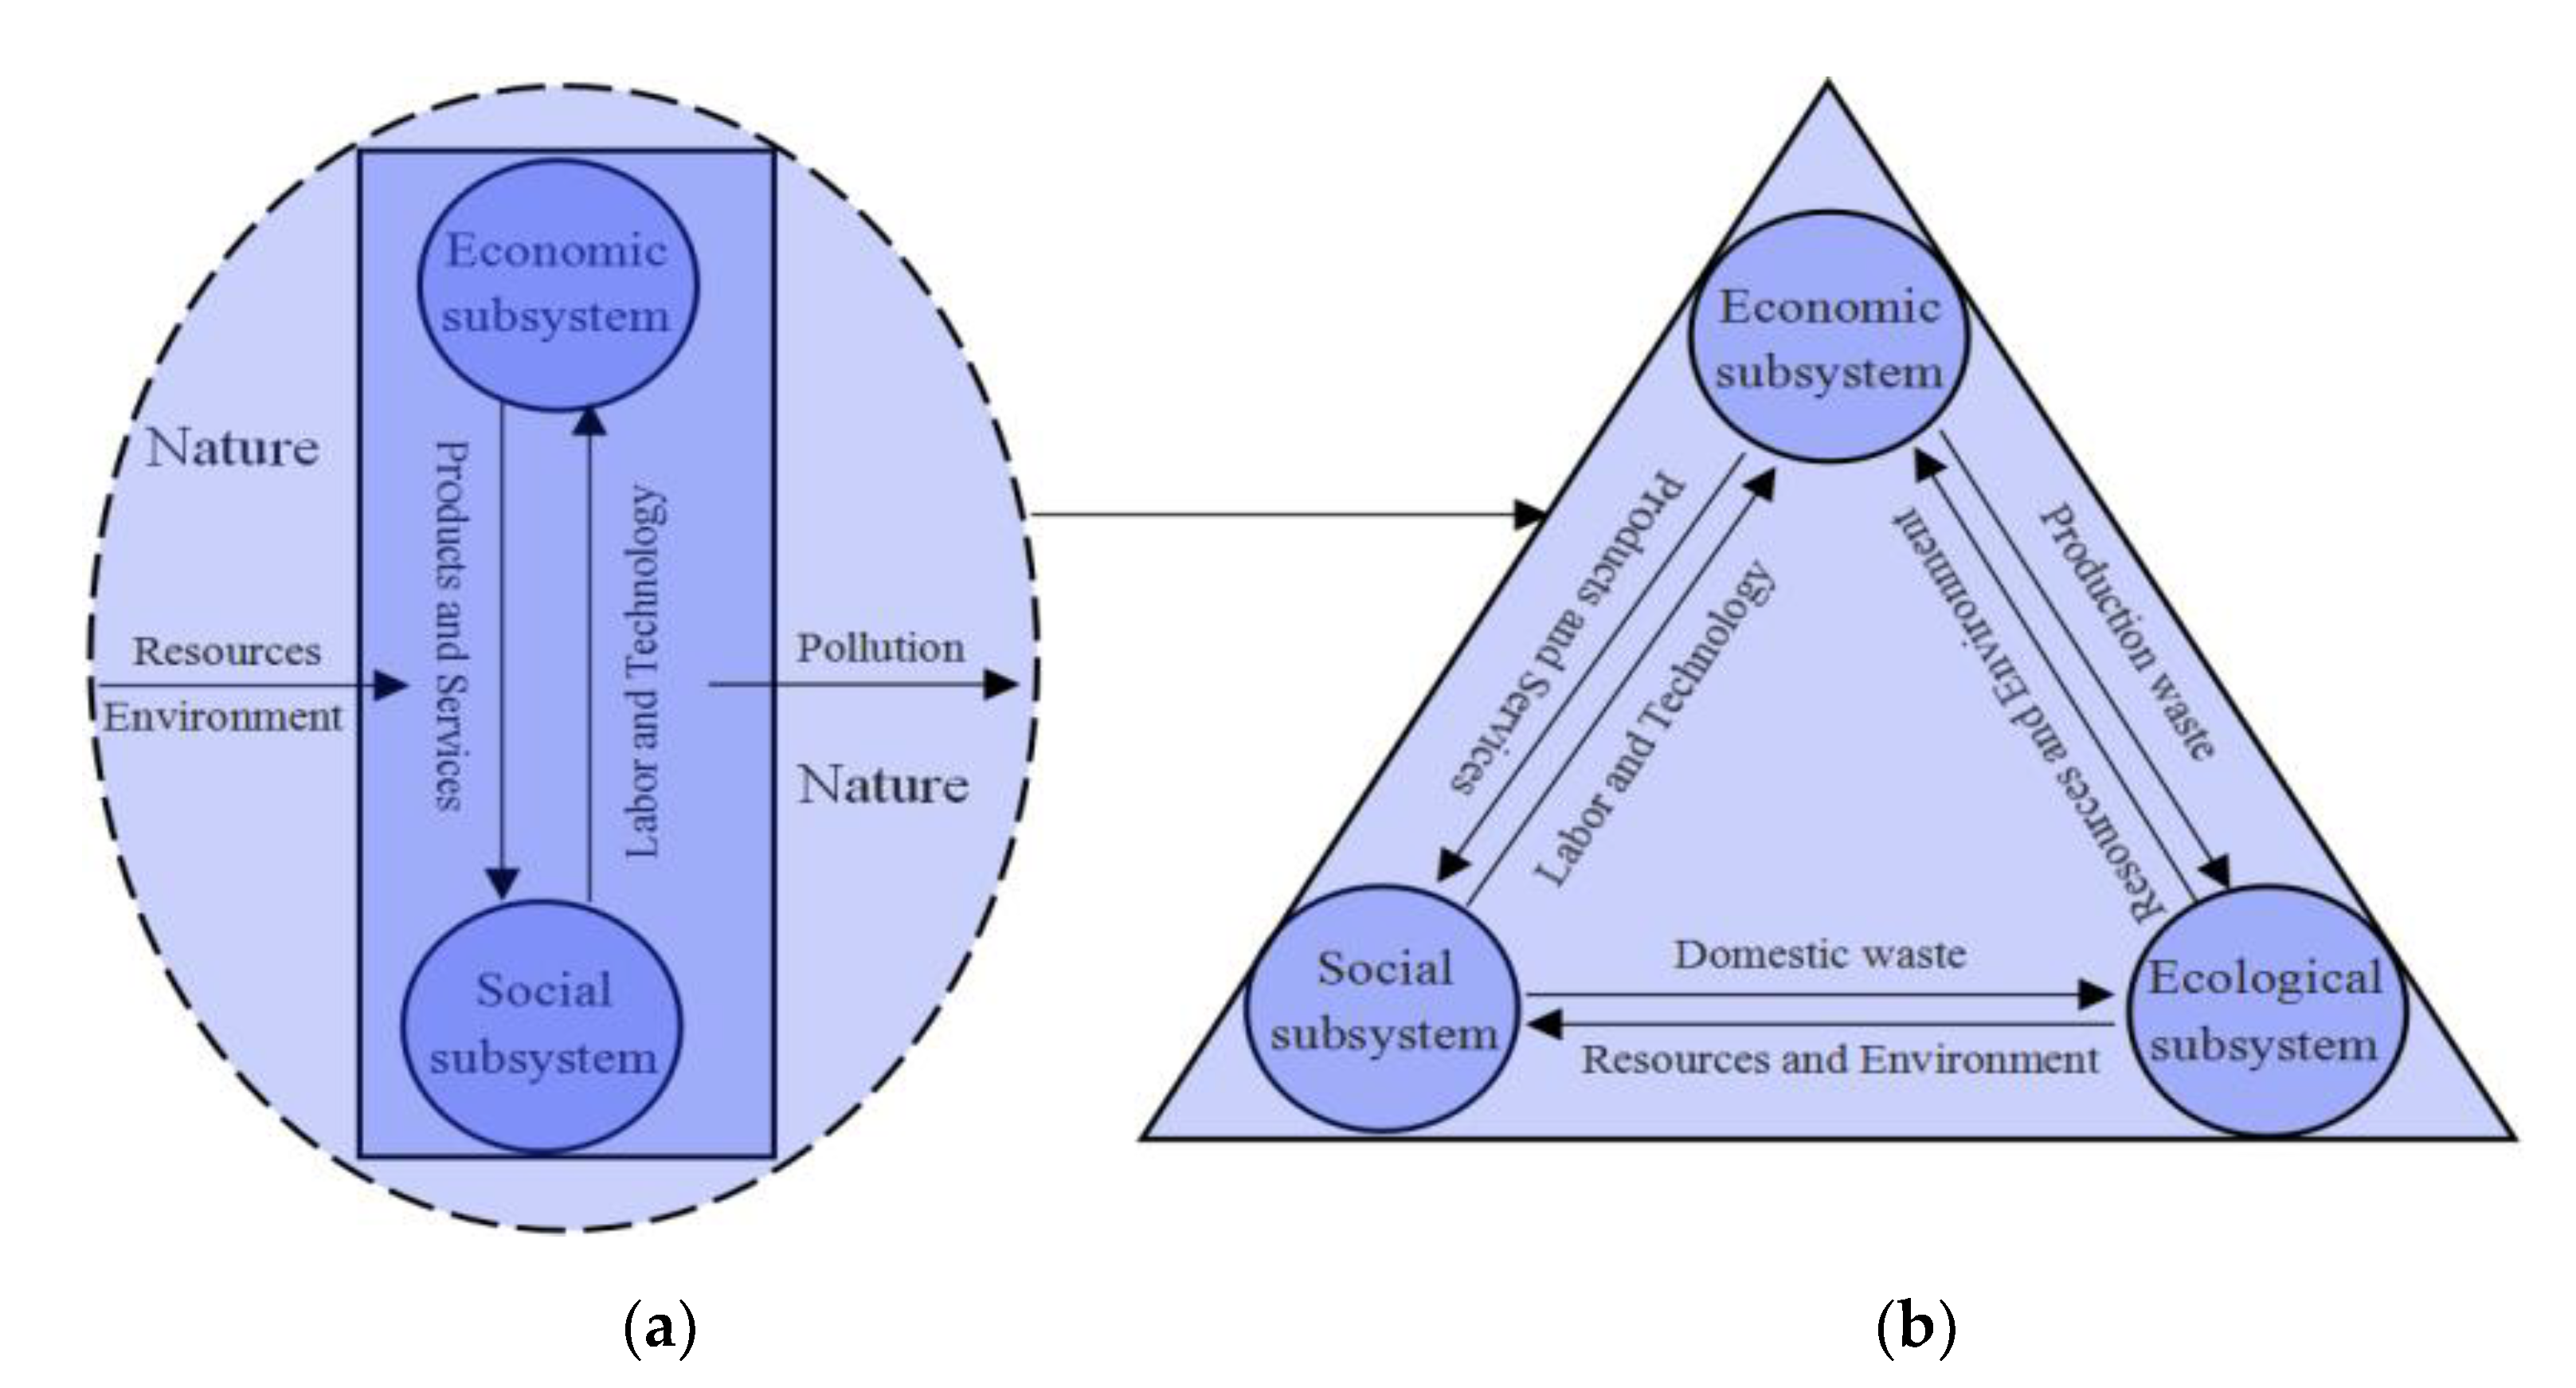
3. Materials and Methods
3.1. Research Methods
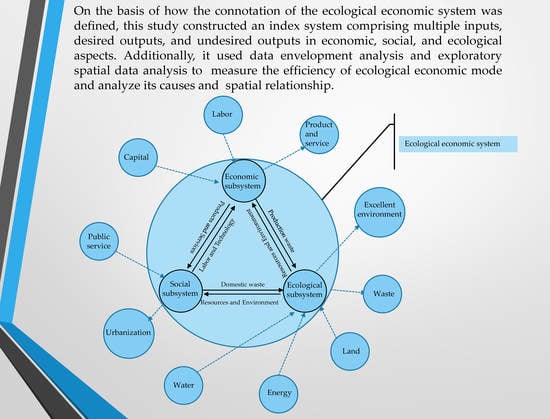
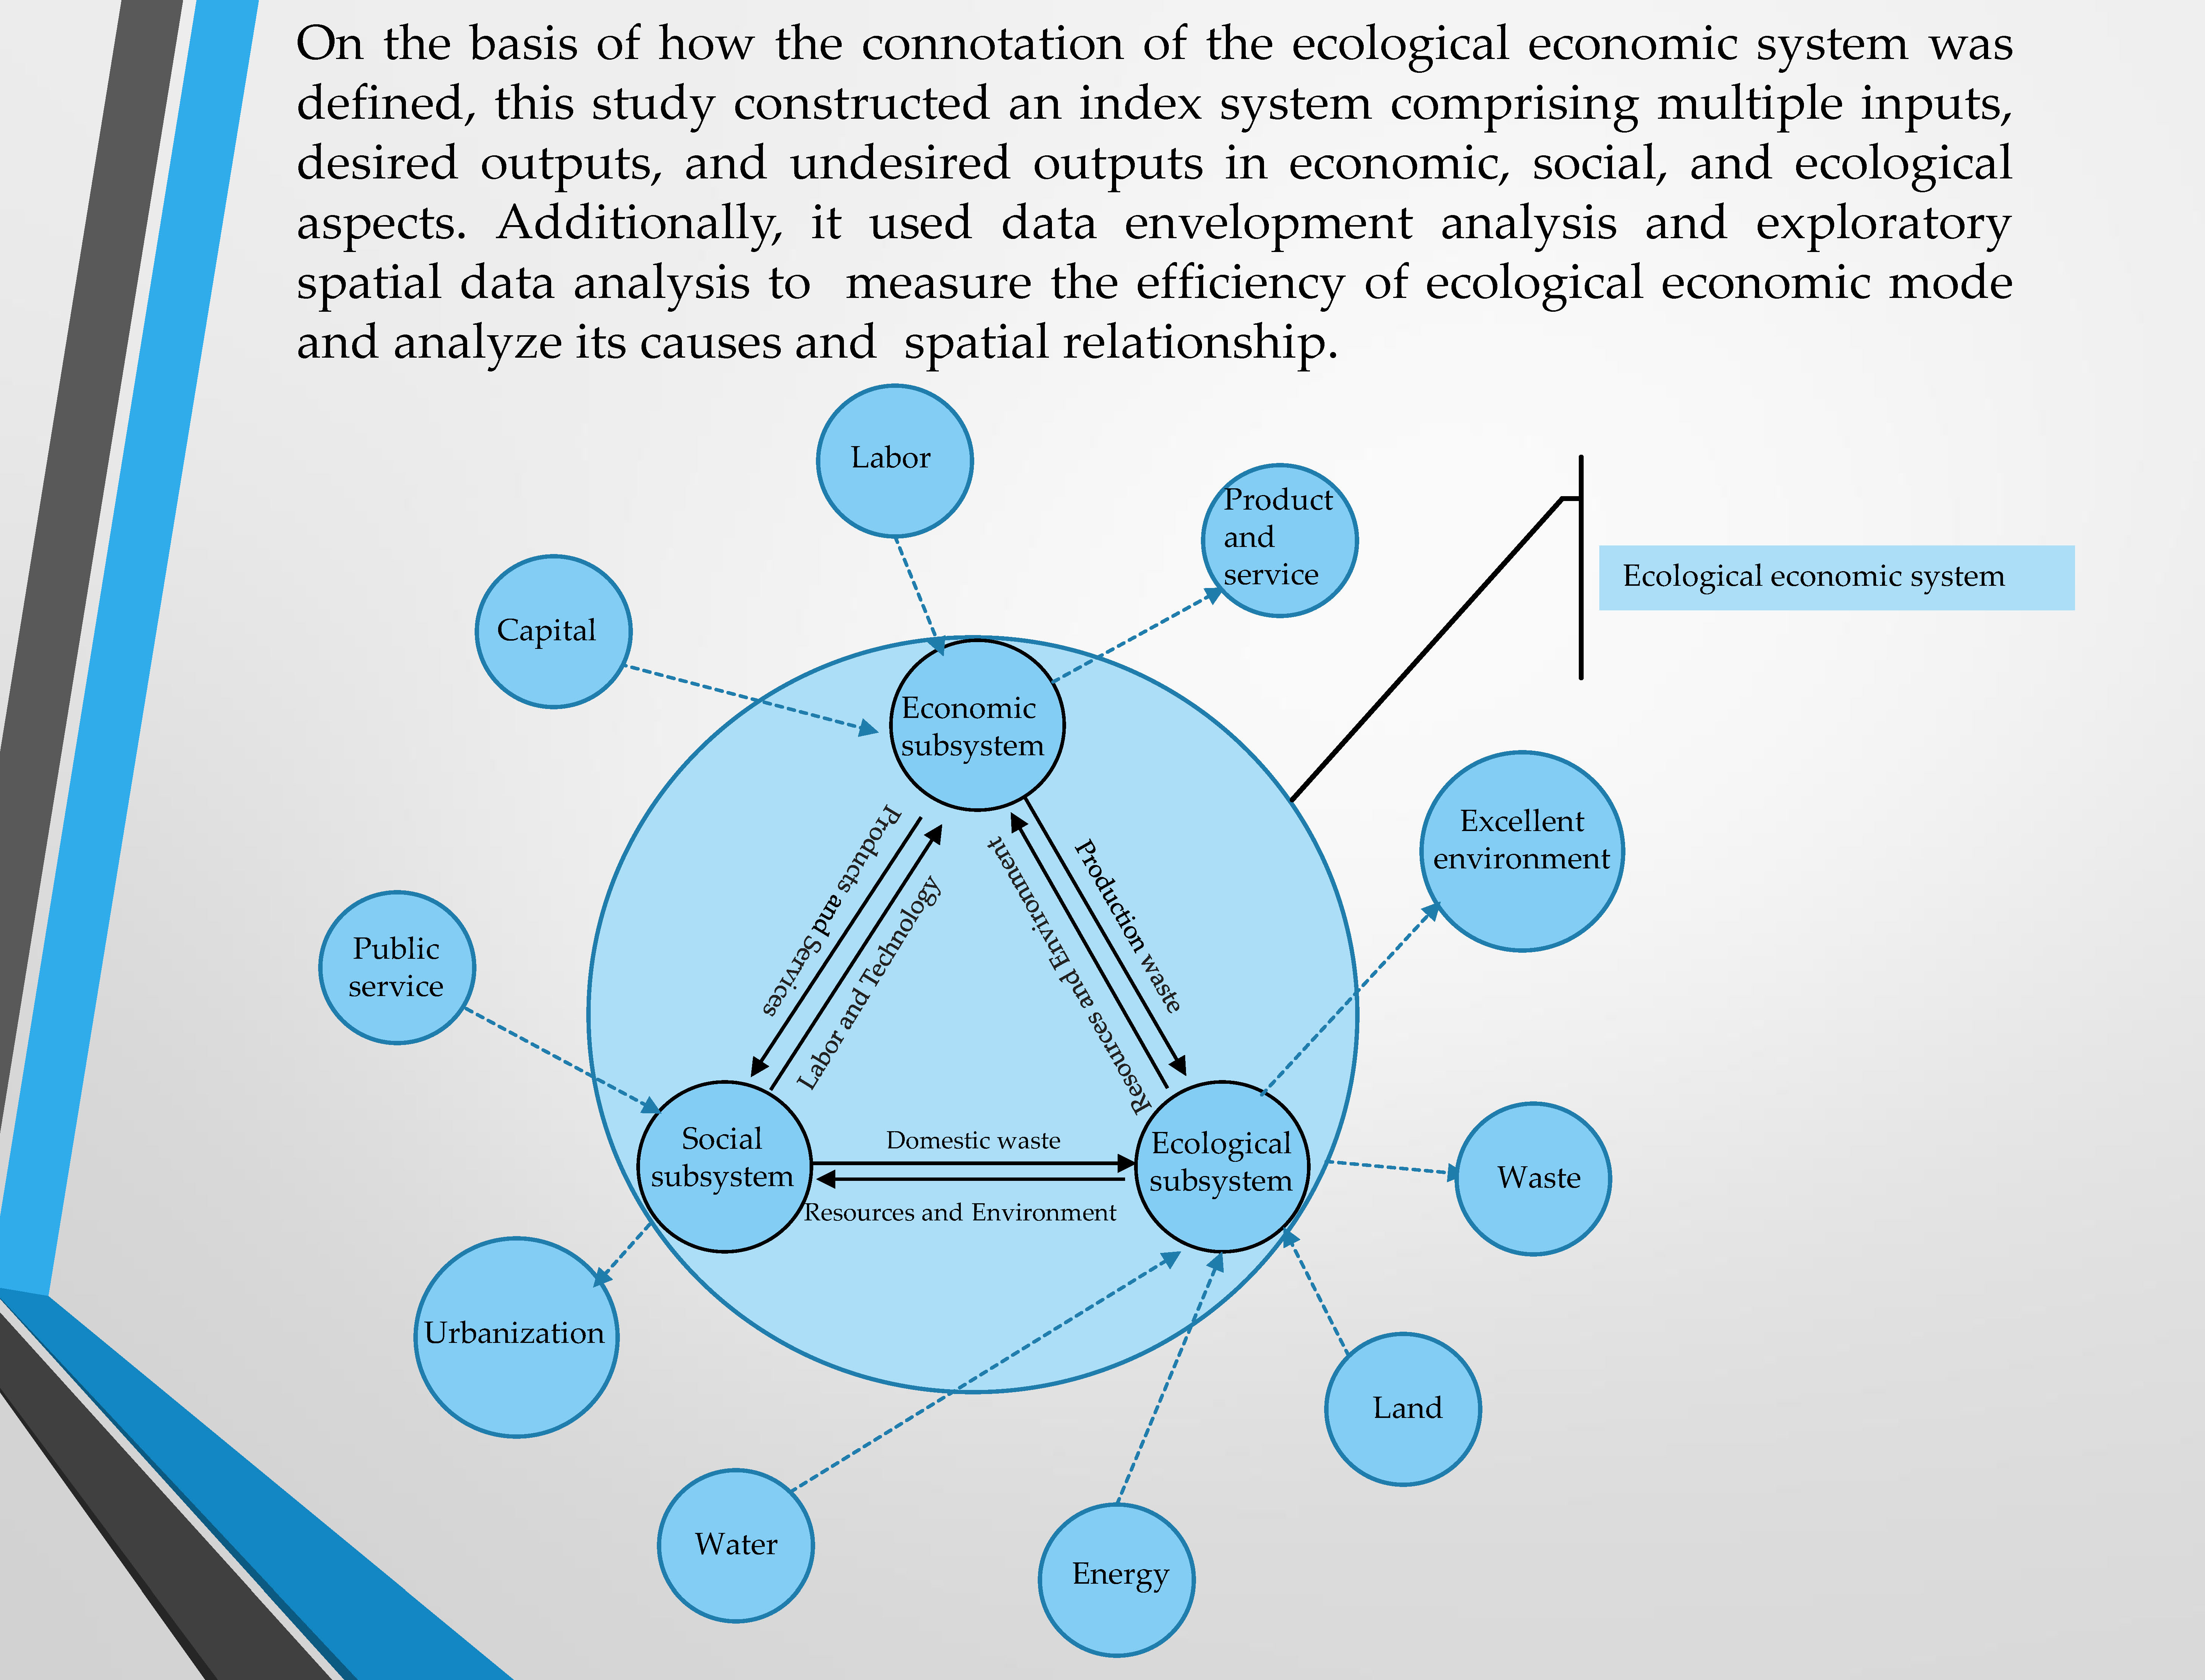
3.1.1. Construction of Index System
3.1.2. SBM-DEA Model Containing Undesirable Output
3.1.3. Global Spatial Autocorrelation Index
3.1.4. Local Spatial Autocorrelation Index
3.2. Research Materials
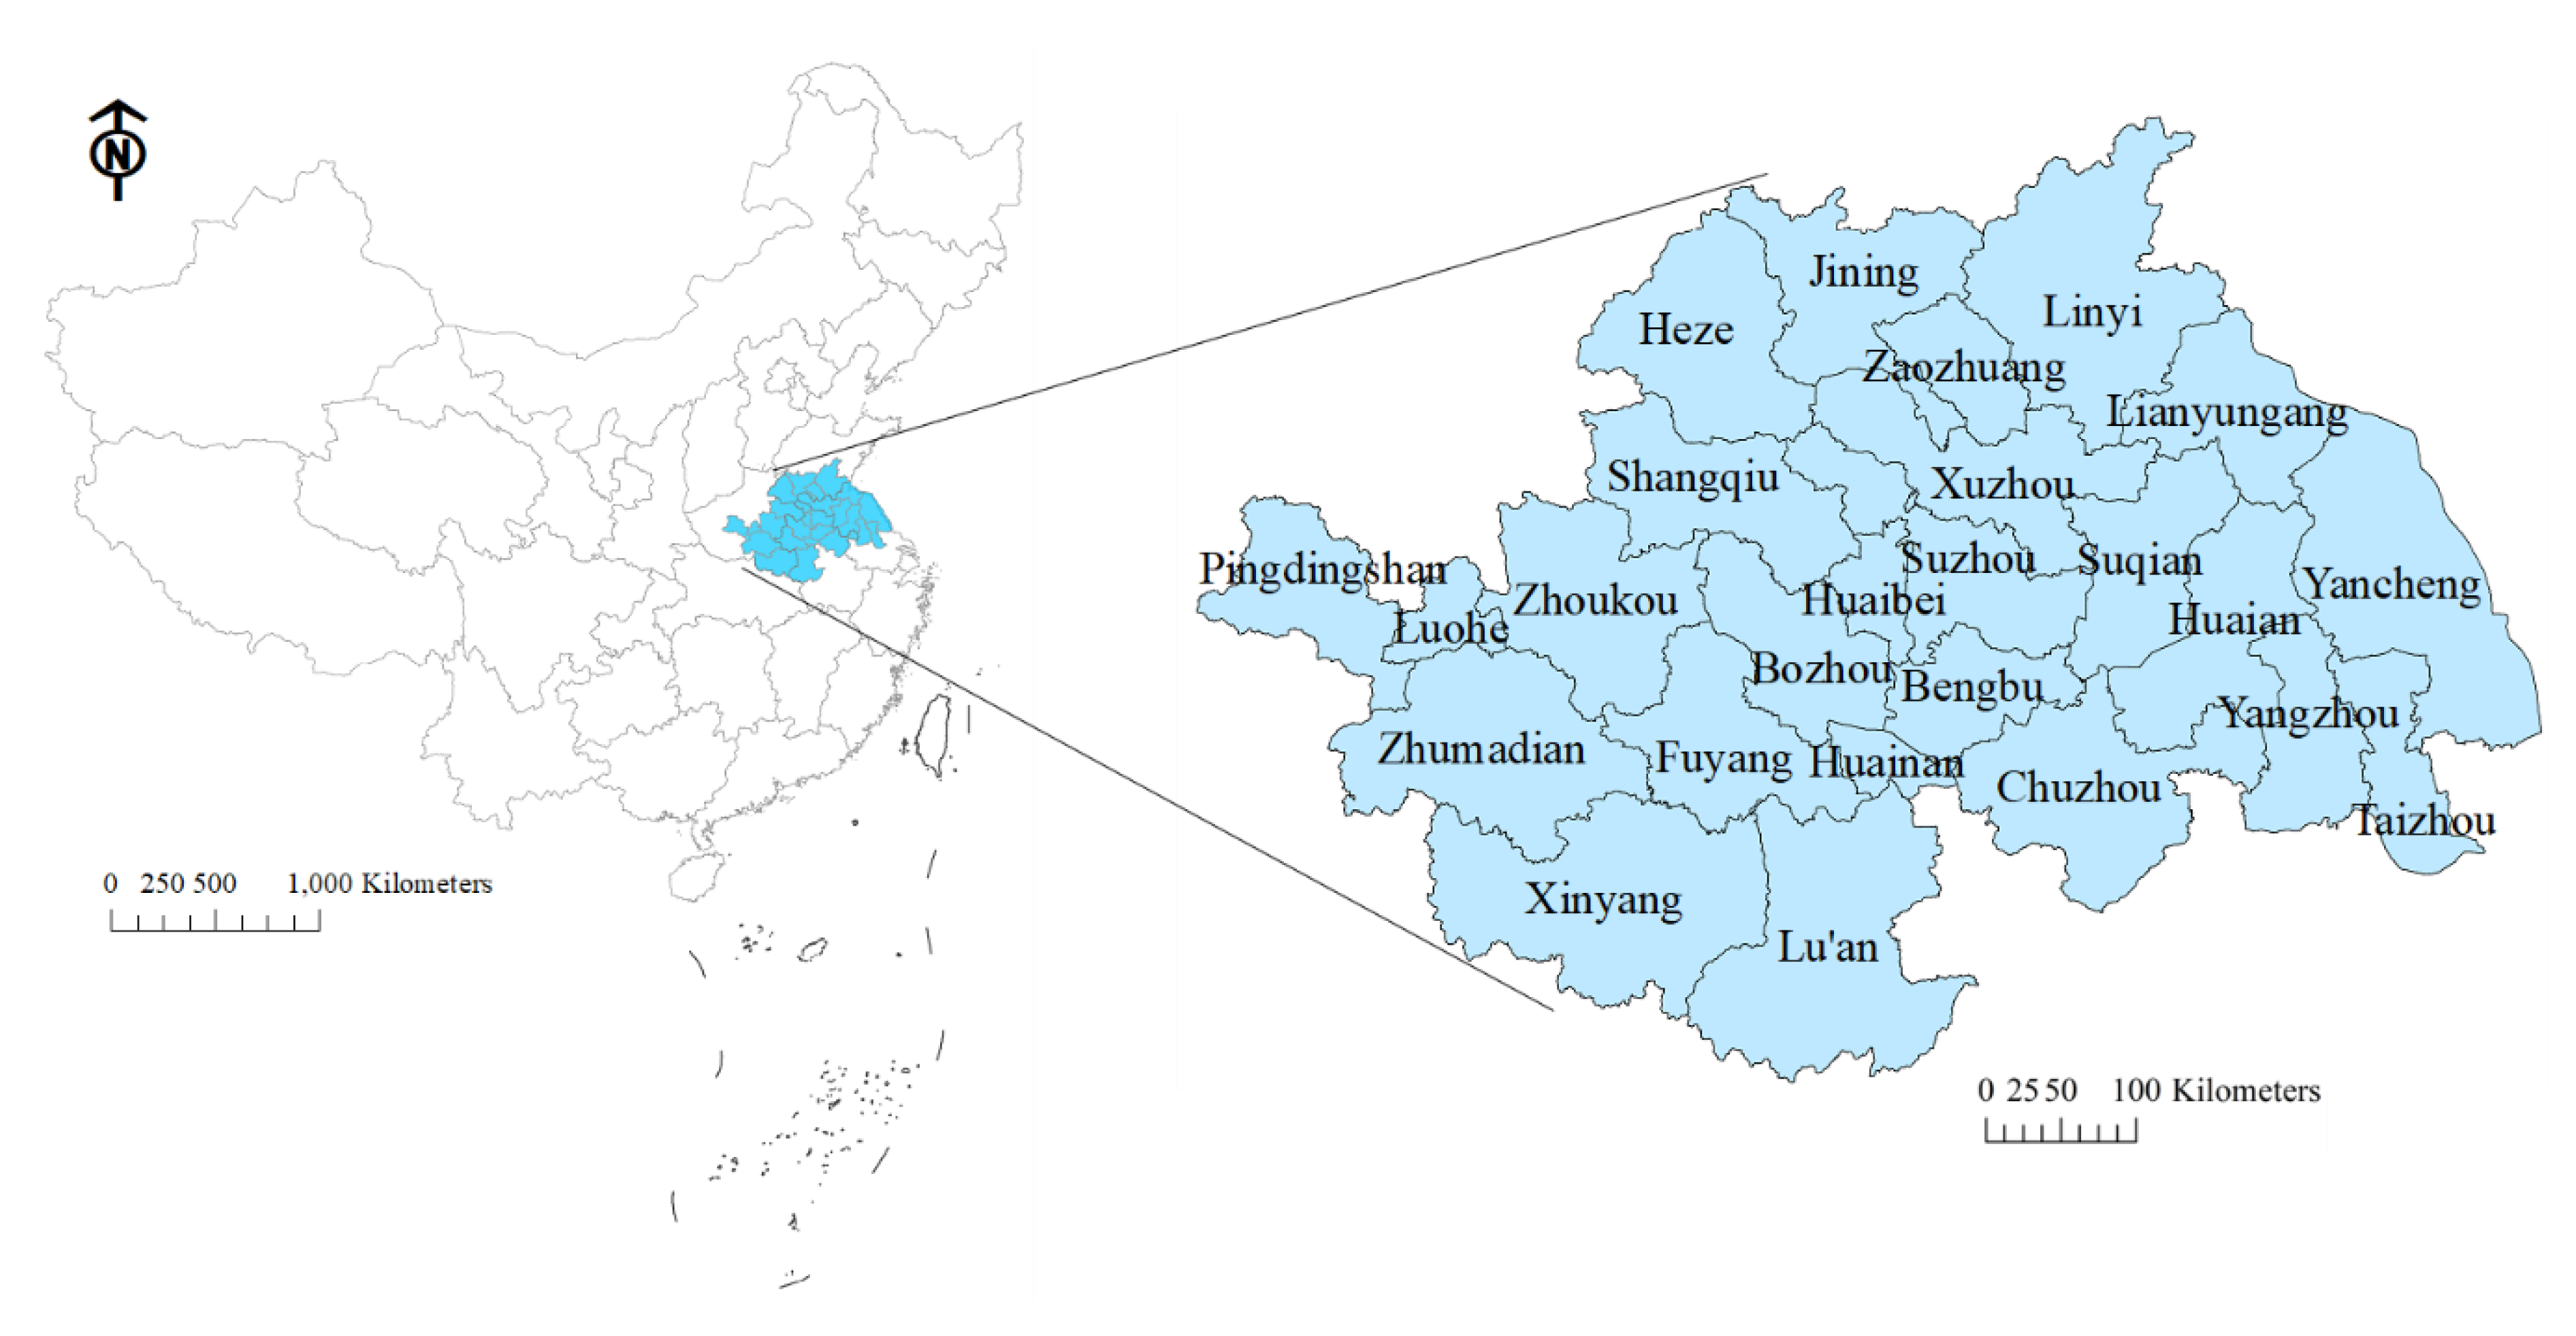
3.2.1. Regional Overview
3.2.2. Data Sources
4. Results
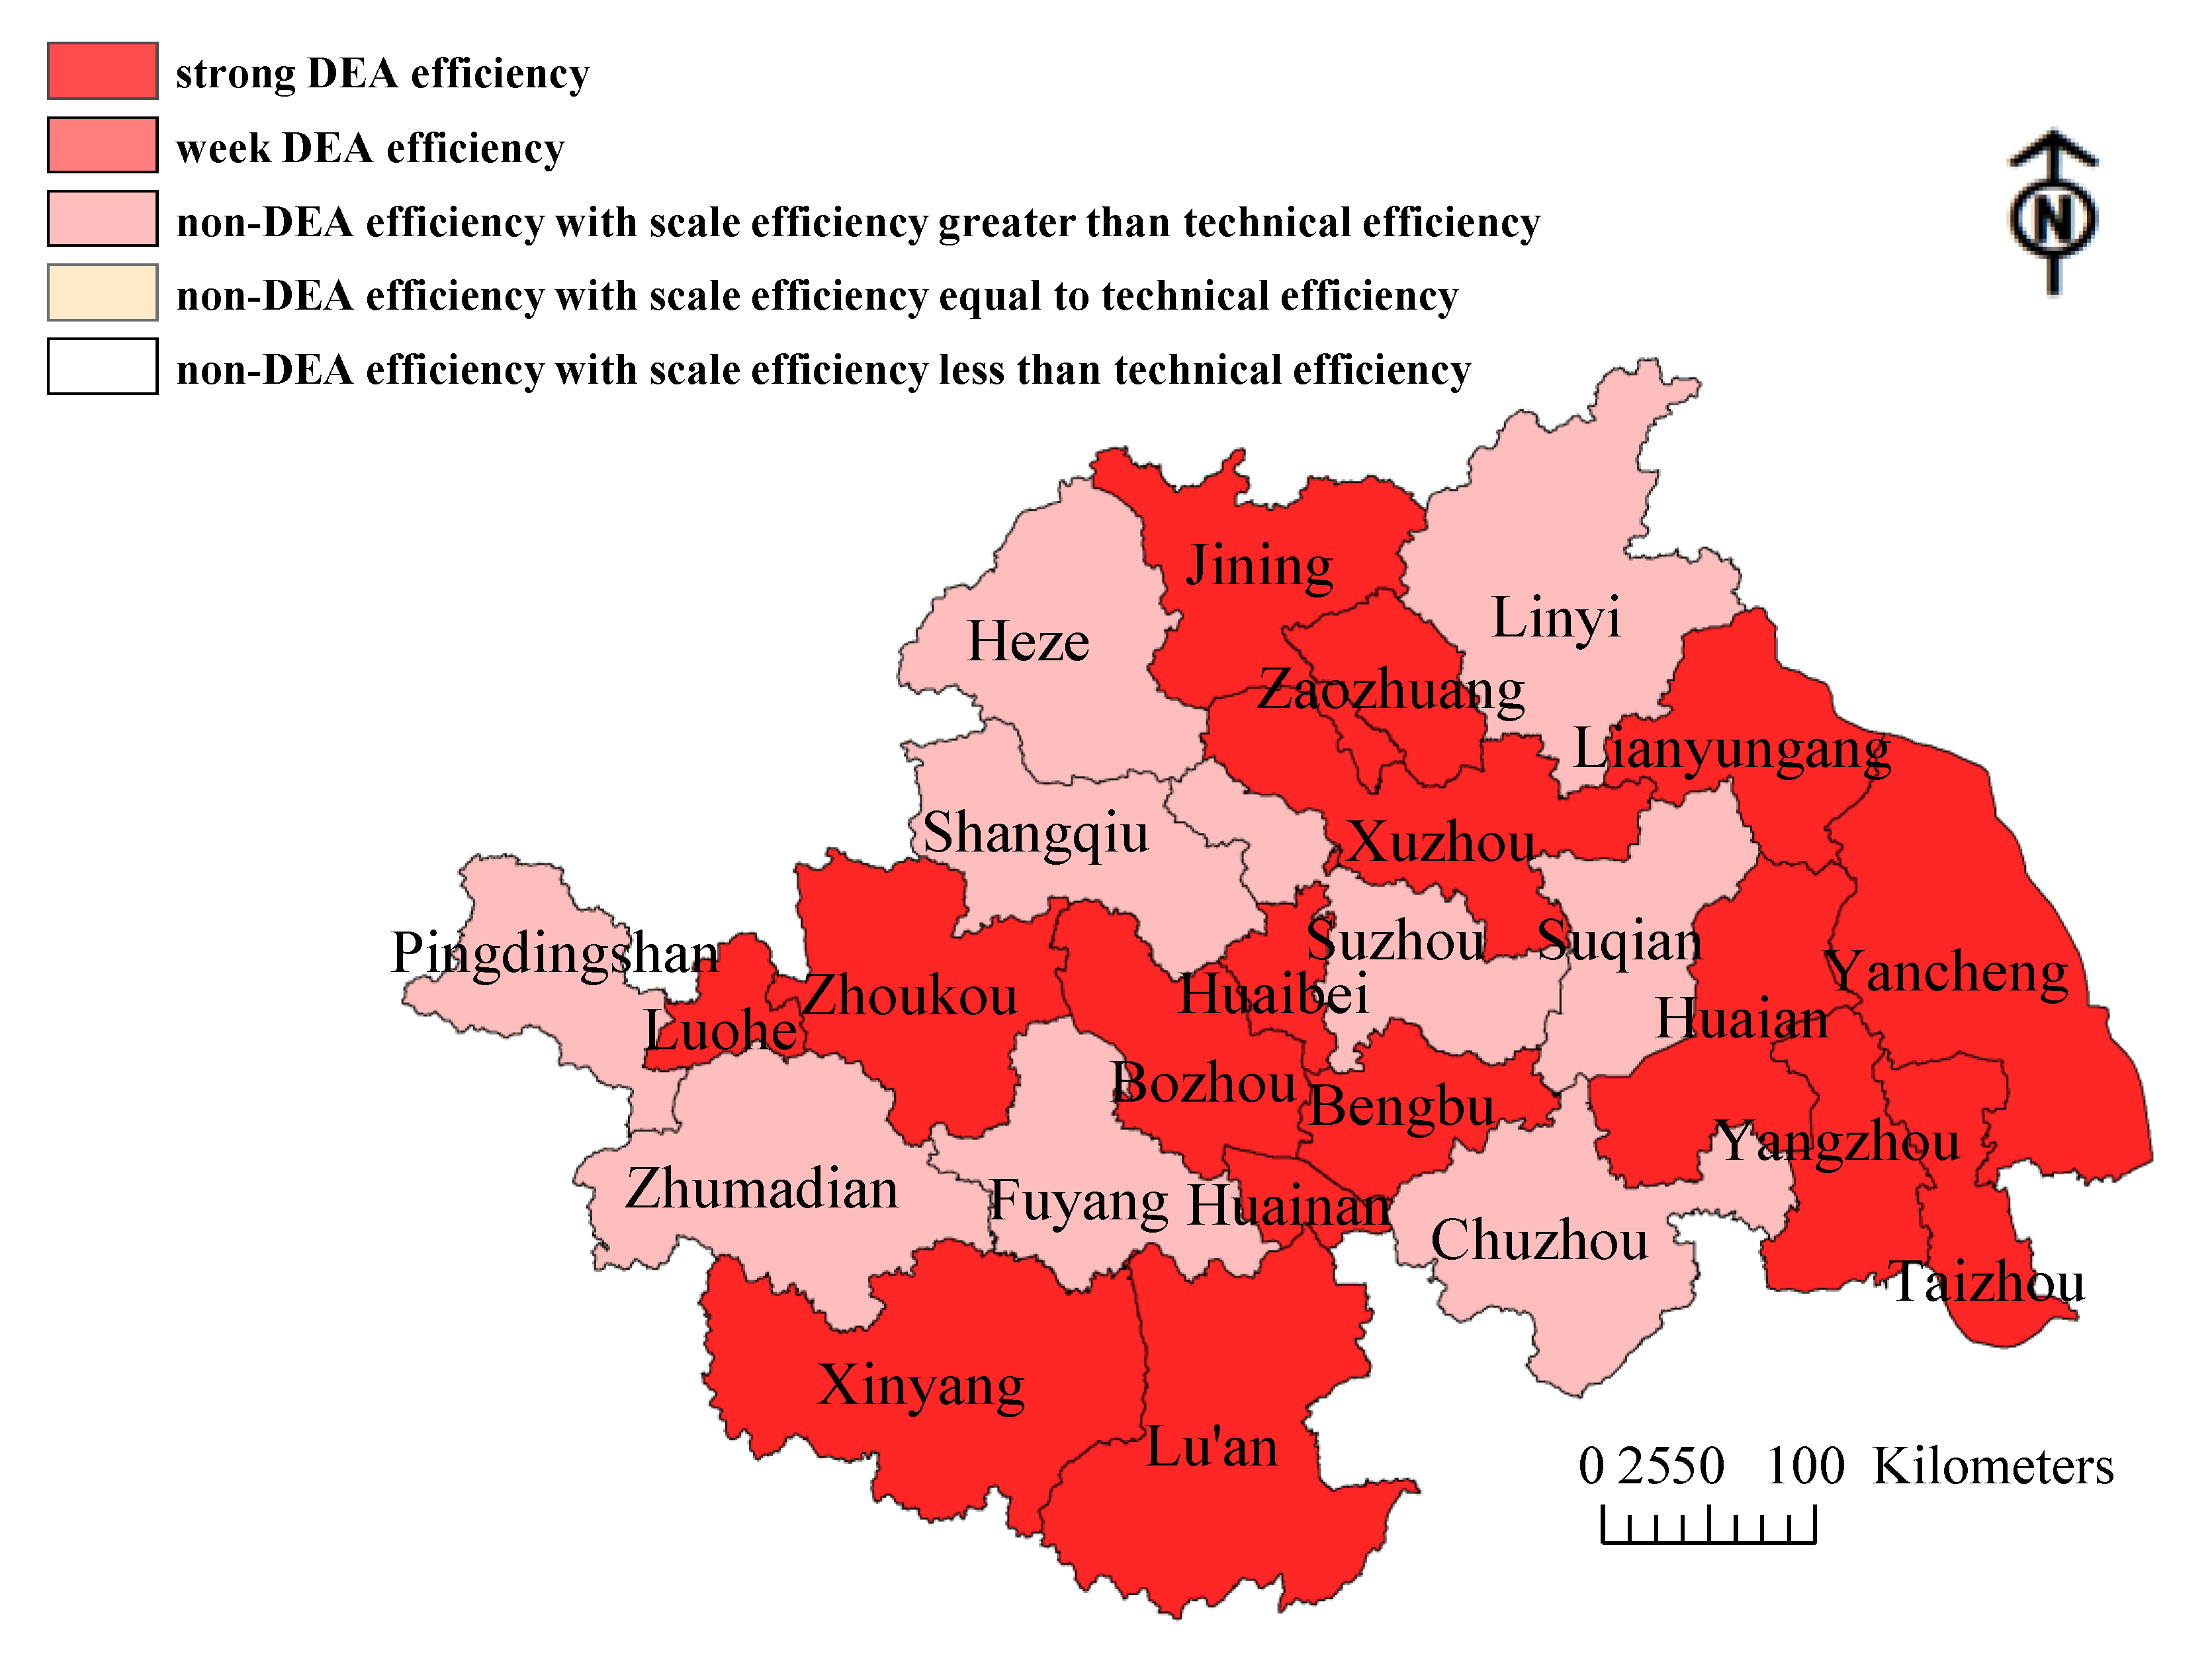
4.1. Analysis of Urban Ecological Economic Efficiency Types
4.2. Projection Analysis of Non-DEA Efficiency Urban Ecological Economic Efficiency
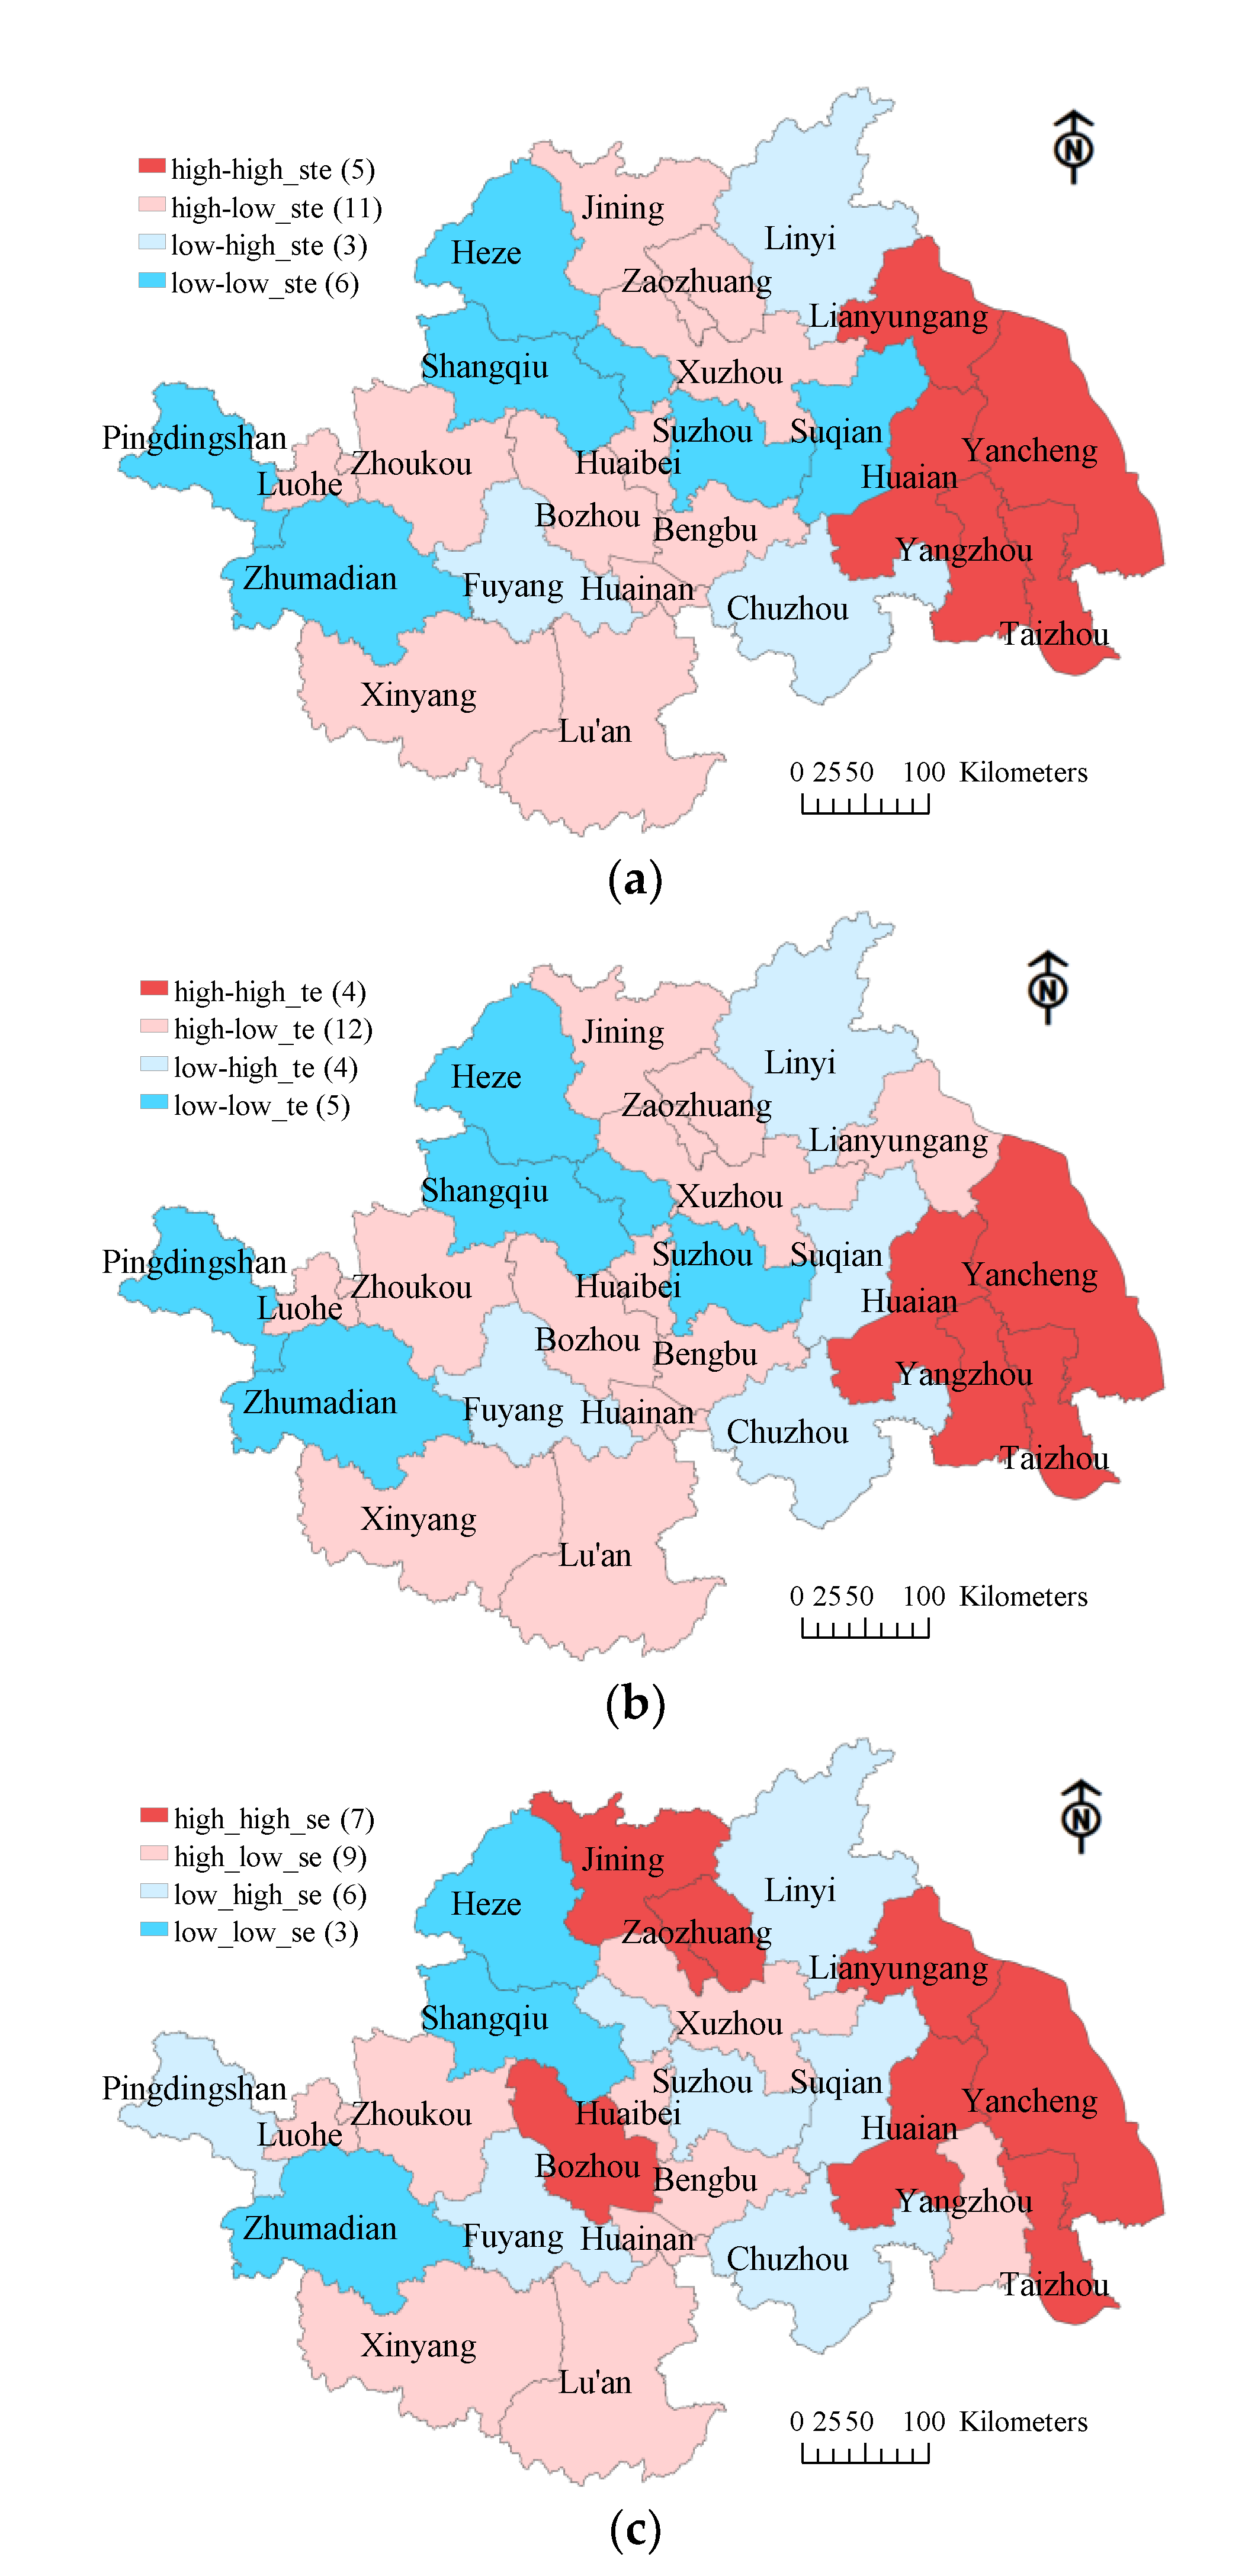
4.3. Analysis of the Spatial Relationship of Urban Ecological Economic Efficiency
5. Discussion
6. Conclusions
- (1)
- The ecological economic efficiency of the Huai River Basin in China was high as a whole. The ecological economic efficiencies of all cities respectively belonged to strong DEA efficiency type and non-DEA efficiency with scale efficiency greater than technical efficiency type, the former accounting for the majority.
- (2)
- The main causes of non-DEA efficiency in the Huai River Basin in China were redundant input of resources, insufficient output of days with good air quality, and excessive output of PM2.5, which were mainly caused by traditional industries with high energy consumption and high pollution.
- (3)
- The regional distribution of ecological economic efficiency in the Huai River Basin in China was unbalanced, the southeast of which became the agglomeration area of cities with high ecological economic efficiency by the advantage of coastal resources while the midwest became the agglomeration area of cities with low ecological economic efficiency due to its location in the interior.
- (1)
- The government should promote the construction of green ecological corridor in the Huai River Basin in China. The ecological economic efficiency of the Huai River Basin is high as a whole, and its ecological economic development potential is huge. The government can build it into a green ecological corridor and a demonstration belt of ecological civilization. For a small number of cities, which are non-DEA efficiency with scale efficiency greater than technical efficiency, the government can to encourage R & D departments and scientific research institutions to innovate production technology by formulating policies of subsidy and tax reduction, so as to improve technical efficiency and then improve comprehensive efficiency.
- (2)
- The government should promote the industrial transformation and upgrading of the Huai River Basin in China. The traditional industries with large investment, high pollution, and low added value account for a large proportion in cities with non-DEA efficiency, which makes the ecological efficiency of these cities relatively low. On the premise of strengthening the protection of ecological environment, the government should develop their characteristic industries according to local conditions, and then accelerate the construction of modern industrial system with low energy consumption, low pollution, and high added value.
- (3)
- The government should make overall plans for the ecological economic development of various regions in the Huai River Basin in China. The southeast is the agglomeration area with high ecological economic efficiency while the central and western is the agglomeration area with low ecological economic efficiency. In order to achieve the common development of ecological economy in the basin, the government needs to formulate and implement resource and environment protection and development strategies for different regions. Industrial upgrading and factor diffusion should be promoted through structural optimization to achieve the leading of ecological economic efficiency in the southeast, while development efforts should be increased under the bearing capacity of resources and environment to achieve the improvement of ecological economic efficiency in the central and western parts.
Author Contributions
Funding
Acknowledgments
Conflicts of Interest
References
- Xu, J.; Jin, G.; Mo, Y.; Tang, H.; Li, L. Assessing Anthropogenic Impacts on Chemical and Biochemical Oxygen Demand in Different Spatial Scales with Bayesian Networks. Water 2020, 12, 246. [Google Scholar] [CrossRef] [Green Version]
- Zingaro, D.; Portoghese, I.; Giannoccaro, G. Modelling Crop Pattern Changes and Water Resources Exploitation: A Case Study. Water 2017, 9, 685. [Google Scholar] [CrossRef]
- Kucher, A.; Heldak, M.; Kucher, L.; Raszka, B. Factors Forming the Consumers’ Willingness to Pay a Price Premium for Ecological Goods in Ukraine. Int. J. Environ. Res. Public Health 2019, 16, 859. [Google Scholar] [CrossRef] [PubMed] [Green Version]
- Zhao, S.; Dong, G.; Xu, Y. A Dynamic Spatio-Temporal Analysis of Urban Expansion and Pollutant Emissions in Fujian Province. Int. J. Environ. Res. Public Health 2020, 17, 629. [Google Scholar] [CrossRef] [PubMed] [Green Version]
- Hou, J.; An, Y.; Song, H.; Chen, J. The Impact of Haze Pollution on Regional Eco-Economic Treatment Efficiency in China: An Environmental Regulation Perspective. Int. J. Environ. Res. Public Health 2019, 16, 4059. [Google Scholar] [CrossRef] [PubMed] [Green Version]
- Lauriola, P.; Crabbe, H.; Behbod, B.; Yip, F.; Medina, S.; Semenza, J.C.; Vardoulakis, S.; Kass, D.; Zeka, A.; Khonelidze, I.; et al. Advancing Global Health through Environmental and Public Health Tracking. Int J. Environ. Res. Public Health 2020, 17, 1976. [Google Scholar] [CrossRef] [Green Version]
- Polimeni, J.; Almalki, A.; Iorgulescu, R.; Albu, L.-L.; Parker, W.; Chandrasekara, R. Assessment of Macro-Level Socioeconomic Factors That Impact Waterborne Diseases: The Case of Jordan. Int. J. Environ. Res. Public Health 2016, 13, 1181. [Google Scholar] [CrossRef]
- Meyer, M.; Hirschnitz-Garbers, M.; Distelkamp, M. Contemporary Resource Policy and Decoupling Trends—Lessons Learnt from Integrated Model-Based Assessments. Sustainability 2018, 10, 1858. [Google Scholar] [CrossRef] [Green Version]
- McGee, M. The World’s CO2 Home Page. Available online: https://www.co2.earth/ (accessed on 24 April 2020).
- Duan, Y.; Xu, G.; Liu, Y.; Liu, Y.; Zhao, S.; Fan, X. Tendency of Runoff and Sediment Variety and Multiple Time Scale Wavelet Analysis in Hongze Lake during 1975–2015. Water 2020, 12, 999. [Google Scholar] [CrossRef] [Green Version]
- Liu, T.; Li, J.; Chen, J.; Yang, S. Urban Ecological Efficiency and Its Influencing Factors—A Case Study in Henan Province, China. Sustainability 2019, 11, 5048. [Google Scholar] [CrossRef] [Green Version]
- De Groot, R.S.; Fisher, B.; Christie, M.; Aronson, J.; Braat, L.; Haines-Young, R.; Gowdy, J.; Maltby, E.; Neuville, A.; Polasky, S. Integrating the ecological and economic dimensions in biodiversity and ecosystem service valuation. In The Economics of Ecosystems and Biodiversity (Teeb): Ecological and Economic Foundations; Earthscan, Routledge: London, UK, 2010; pp. 9–40. Available online: http://www.teebweb.org/our-publications/teeb-study-reports/ecological-and-economic-foundations/ (accessed on 30 July 2020).
- Berghöfer, A.; Mader, A.; Patrickson, S.; Calcaterra, E.; Smit, J.; Blignaut, J.; de Wit, M.; van Zyl, H. Teeb manual for cities: Ecosystem services in urban management. Econ. Ecosyst. Biodivers. Suiza; United Nations Environment Programme: Geneva, Switzerland, 2011. Available online: http://www.teebweb.org/publication/teeb-manual-for-cities-ecosystem-services-in-urban-management/ (accessed on 30 July 2020).
- Brink, P.; Berghöfer, A.; Schröter-Schlaack, C.; Sukhdev, P.; Vakrou, A.; White, S.; Wittmer, H. Teeb-the economics of ecosystems and biodiversity for national and international policy makers 2009. In TEEB-the Economics of Ecosystems and Biodiversity for National and International Policy Makers; United Nations Environment Programme: Geneva, Switzerland, 2009; Available online: http://www.teebweb.org/wp-content/uploads/Study%20and%20Reports/Reports/National%20and%20International%20Policy%20Making/TEEB%20for%20National%20Policy%20Makers%20report/TEEB%20for%20National.pdf (accessed on 30 July 2020).
- Leibenath, M.; Kurth, M.; Lintz, G. Science–Policy Interfaces Related to Biodiversity and Nature Conservation: The Case of Natural Capital Germany—TEEB-DE. Sustainability 2020, 12, 3701. [Google Scholar] [CrossRef]
- Lozano, R. Envisioning sustainability three-dimensionally. J. Clean. Prod. 2008, 16, 1838–1846. [Google Scholar] [CrossRef]
- Guo, Y.; Liu, W.; Tian, J.; He, R.; Chen, L. Eco-efficiency assessment of coal-fired combined heat and power plants in Chinese eco-industrial parks. J. Clean. Prod. 2017, 168, 963–972. [Google Scholar] [CrossRef]
- Schaltegger, S.; Sturm, A. Ecological rationality: Approaches to design of ecology-oriented management instruments. Die Unternehm. 1990, 4, 273–290. [Google Scholar]
- World Business Council for Sustainable Development. Eco-Efficient Leadership for Improved Economic and Environmental Performance; World Business Council for Sustainable Development: Geneva, Switzerland, 1995. [Google Scholar]
- Zhu, D.; Qiu, S. Eco-efficiency indicators and their demonstration as the circular economy measurement in China. Resour. Environ. Yangtze Basin 2008, 17, 1–5. [Google Scholar]
- Pan, X.X.; He, Y.Q.; Hu, X.F. Evaluation and spatial econometric analysis on regional ecological efficiency. Resour. Environ. Yangtze Basin 2013, 22, 640–647. [Google Scholar]
- Jiong, T. Application of Analytic Hierarchy Process in Eco-Efficiency Assessment. Environ. Prot. Sci. 2009, 1, 118–120. [Google Scholar]
- Lee, Y.-C. Ranking DMUs by Combining Cross-Efficiency Scores Based on Shannon’s Entropy. Entropy 2019, 21, 467. [Google Scholar] [CrossRef] [Green Version]
- Hao, Y.; Yang, D.; Yin, J.; Chen, X.; Bao, A.; Wu, M.; Zhang, X. The Effects of Ecological Policy of Kyrgyzstan Based on Data Envelope Analysis. Sustainability 2019, 11, 1922. [Google Scholar] [CrossRef] [Green Version]
- Mavi, R.K.; Saen, R.F.; Goh, M. Joint analysis of eco-efficiency and eco-innovation with common weights in two-stage network DEA: A big data approach. Technol. Forecast. And Soc. Chang. 2019, 144, 553–562. [Google Scholar] [CrossRef]
- Charnes, A.; Cooper, W.W.; Rhodes, E. Measuring the efficiency of decision making units. Eur. J. Oper. Res. 1978, 2, 429–444. [Google Scholar] [CrossRef]
- Rybaczewska-Błażejowska, M.; Gierulski, W. Eco-Efficiency Evaluation of Agricultural Production in the EU-28. Sustainability 2018, 10, 4544. [Google Scholar] [CrossRef] [Green Version]
- Wang, X.; Wu, Q.; Majeed, S.; Sun, D. Fujian’s Industrial Eco-Efficiency: Evaluation Based on SBM and the Empirical Analysis of lnfluencing Factors. Sustainability 2018, 10, 3333. [Google Scholar] [CrossRef] [Green Version]
- Bonfiglio, A.; Arzeni, A.; Bodini, A. Assessing eco-efficiency of arable farms in rural areas. Agric. Syst. 2017, 151, 114–125. [Google Scholar] [CrossRef]
- Tone, K. A slacks-based measure of efficiency in data envelopment analysis. Eur. J. Oper. Res. 2001, 130, 498–509. [Google Scholar] [CrossRef] [Green Version]
- Yu, J.; Zhou, K.; Yang, S. Regional heterogeneity of China’s energy efficiency in “new normal”: A meta-frontier Super-SBM analysis. Energy Policy 2019, 134, 110941. [Google Scholar] [CrossRef]
- Storto, C.l. Ecological Efficiency Based Ranking of Cities: A Combined DEA Cross-Efficiency and Shannon’s Entropy Method. Sustainability 2016, 8, 124. [Google Scholar] [CrossRef] [Green Version]
- Lv, X.; Lu, X.; Fu, G.; Wu, C. A Spatial-Temporal Approach to Evaluate the Dynamic Evolution of Green Growth in China. Sustainability 2018, 10, 2341. [Google Scholar] [CrossRef] [Green Version]
- Wei, G.; Sun, P.; Zhang, Z.; Ouyang, X. The Coordinated Relationship between Investment Potential and Economic Development and Its Driving Mechanism: A Case Study of the African Region. Sustainability 2020, 12, 442. [Google Scholar] [CrossRef] [Green Version]
- Moran, P.A. Notes on continuous stochastic phenomena. Biometrika 1950, 37, 17–23. [Google Scholar] [CrossRef] [PubMed]
- Anselin, L. Local indicators of spatial association—LISA. Geogr. Anal. 1995, 27, 93–115. [Google Scholar] [CrossRef]


| Authors | Indicators | Methods | Results | |||
|---|---|---|---|---|---|---|
| Input Indicators | Output Indicators | |||||
| Desired Outputs | Undesired Outputs | |||||
| A. Bonfiglio, A. Arzeni, A. Bodini (2017) [29] | specialization index, nitrogen balance, phosphorus balance, pesticide risk | added value | - | CCR | to reflect the DMUs’ comprehensive efficiencies | |
| M. Rybaczewska- Błażejowska, W. Gierulski (2018) [27] | a set of impact categories from the life cycle assessment stage | economic indicator | - | BCC | to reflect the DMUs’ technical efficiencies | |
| X. Wang, Q. Wu, S. Majeed, D. Sun (2018) [28] | the consumption of standard coal, the consumption of fresh water | industrial added value | I | SBM | to reduce deviations on the DMUs’ efficiency evaluations | |
| Y. Hao, D. Yang, J. Yin, X. Chen, A. Bao, M. Wu, et al. (2019) [24] | total water diversion, air pollutant emission from fixed sources | GDP per capita, afforestation, non-poverty rate | - | S-CCR | to further distinguish the significant degrees of the DMUs in strongly valid states | |
| J. Yu, K. Zhou, and S. Yang (2019) [31] | labor, capital, energy | gross domestic product | CO2 emissions | S-SBM | ||
| C. lo Storto (2016) [32] | population, land area | II | III | C-SBM | to further distinguish the significant degrees of the DMUs in valid states | |
| R. Kiani Mavi, R. F. Saen, and M. Goh (2019) [25] | ecological efficiency stage | labor force, energy use, land area | GDP | GHG emissions | N-SBM | to study the impact of each link on ecological efficiency in the process |
| ecological innovation stage | GDP, GHG emissions | IV | - | |||
| Indicator Type | Indicator Property | Indicator Composition | Indicator Meaning | |
|---|---|---|---|---|
| Input indicator | Ecological input | Total water resources (100 million m3) | Water input | |
| Total electricity consumption of the society (100 million kWh) | Energy input | |||
| Total land area (km2) | Land input | |||
| Economic input | Number of employees (10,000 people) | Labor input | ||
| Loans in Renminbi and foreign currencies of all financial institutions at year-end (¥100 million) | Capital input | |||
| Social input | General budget expenditure (¥100 million) | Public service input | ||
| Output indicator | Desired output indicator | Ecological output | Excellent air quality (day) | Excellent environmental output |
| Economic output | Gross domestic product (¥100 million) | Product and service outputs | ||
| Social output | Urbanization rate (%) | Urban resident output | ||
| Undesired output indicator | Ecological output | PM2.5 concentration (μg/m3) | Waste output | |
| Province | City | |||||
|---|---|---|---|---|---|---|
| Henan | Xinyang | 1.00 | 1.00 | 1.00 | 0 | 0 |
| Zhumadian | 0.82 | 0.85 | 0.97 | 3499 | 13 | |
| Zhoukou | 1.00 | 1.00 | 1.00 | 0 | 0 | |
| Luohe | 1.00 | 1.00 | 1.00 | 0 | 0 | |
| Shangqiu | 0.78 | 0.80 | 0.98 | 2854 | 10 | |
| Pingdingshan | 0.81 | 0.86 | 0.94 | 1913 | 25 | |
| Anhui | Bengbu | 1.00 | 1.00 | 1.00 | 0 | 0 |
| Huainan | 1.00 | 1.00 | 1.00 | 0 | 0 | |
| Fuyang | 0.72 | 0.79 | 0.95 | 458 | 40 | |
| Lu’an | 1.00 | 1.00 | 1.00 | 0 | 0 | |
| Bozhou | 1.00 | 1.00 | 1.00 | 0 | 0 | |
| Suzhou | 0.74 | 0.82 | 0.90 | 2056 | 52 | |
| Huaibei | 1.00 | 1.00 | 1.00 | 0 | 0 | |
| Chuzhou | 0.78 | 0.84 | 0.93 | 3963 | 36 | |
| Jiangsu | Huai’an | 1.00 | 1.00 | 1.00 | 0 | 0 |
| Yancheng | 1.00 | 1.00 | 1.00 | 0 | 0 | |
| Suqian | 0.91 | 0.92 | 0.99 | 1080 | 5 | |
| Xuzhou | 1.00 | 1.00 | 1.00 | 0 | 0 | |
| Lianyungang | 1.00 | 1.00 | 1.00 | 0 | 0 | |
| Yangzhou | 1.00 | 1.00 | 1.00 | 0 | 0 | |
| Taizhou | 1.00 | 1.00 | 1.00 | 0 | 0 | |
| Shandong | Zaozhuang | 1.00 | 1.00 | 1.00 | 0 | 0 |
| Jining | 1.00 | 1.00 | 1.00 | 0 | 0 | |
| Linyi | 0.71 | 0.72 | 0.98 | 7239 | 27 | |
| Heze | 0.74 | 0.78 | 0.96 | 4279 | 45 |
| Type | City | |
|---|---|---|
| DEA efficiency () | Strong DEA efficiency () | Xinyang, Zhoukou, Luohe, Bengbu, Huainan, Lu’an, Bozhou, Huaibei, Huai’an, Yancheng, Xuzhou, Lianyungang, Yangzhou, Taizhou, Zaozhuang, Jining |
| Weak DEA efficiency (Except ) | - | |
| Non-DEA efficiency () | Scale efficiency is greater than technical efficiency () | Zhumadian, Shangqiu, Pingdingshan, Fuyang, Suzhou, Chuzhou, Suqian, Linyi, Heze |
| Scale efficiency is equal to technical efficiency () | - | |
| Scale efficiency is less than technical efficiency () | - | |
| Input Redundancy and Subitems | Henan | Anhui | Jiangsu | Shandong | |||||||
|---|---|---|---|---|---|---|---|---|---|---|---|
| Zhuma Dian | Shang Qiu | Pingding Shan | Fu Yang | Su Zhou | Chu Zhou | Su Qian | Lin Yi | He Ze | |||
| Ecological input | Water resources | Radial redundancy | −4.23 | −1.34 | −3.08 | −9.14 | −0.65 | −1.86 | −0.05 | −10.06 | −2.73 |
| Slack redundancy | −16.76 | 0.00 | 0.00 | −2.52 | 0.00 | −0.85 | −7.34 | −13.01 | 0.00 | ||
| Total redundancy | −20.99 | −1.34 | −3.08 | −11.66 | −0.65 | −2.71 | −7.39 | −23.07 | −2.73 | ||
| Energy | Radial redundancy | −10.62 | −12.18 | −28.65 | −23.90 | −1.70 | −6.29 | −0.27 | −108.35 | −26.94 | |
| Slack redundancy | −9.82 | −56.49 | −20.23 | 0.00 | 0.00 | −37.86 | 0.00 | −120.08 | −27.60 | ||
| Total redundancy | −20.44 | −68.67 | −48.88 | −23.90 | −1.70 | −44.16 | −0.27 | −228.43 | −54.54 | ||
| Land resources | Radial redundancy | −1288 | −723 | −1323 | −1868 | −213 | −558 | −13 | −4252 | −1609 | |
| Slack redundancy | −3444 | −2585 | −1832 | 0 | −1971 | −3878 | −1032 | −6847 | −4098 | ||
| Total redundancy | −4732 | −3308 | −3155 | −1868 | −2185 | −4436 | −1046 | −11099 | −5707 | ||
| Economic input | Labor | Radial redundancy | −51.74 | −39.73 | −57.55 | −128.71 | −8.30 | −12.14 | −0.44 | −170.37 | −67.68 |
| Slack redundancy | −28.47 | −153.73 | −61.10 | −291.97 | −52.59 | 0.00 | 0.00 | −258.27 | −112.55 | ||
| Total redundancy | −80.20 | −193.46 | −118.65 | −420.68 | −60.88 | −12.14 | −0.44 | −428.64 | −180.23 | ||
| Capital | Radial redundancy | −121.13 | −96.71 | −289.72 | −393.09 | −27.23 | −70.92 | −3.47 | −1109.76 | −264.32 | |
| Slack redundancy | 0.00 | 0.00 | 0.00 | −50.28 | 0.00 | 0.00 | 0.00 | 0.00 | 0.00 | ||
| Total redundancy | −121.13 | −96.71 | −289.72 | −443.37 | −27.23 | −70.92 | −3.47 | −1109.76 | −264.32 | ||
| Social input | Public services | Radial redundancy | −40.75 | −31.27 | −53.29 | −98.48 | −7.54 | −15.87 | −0.66 | −145.90 | −67.08 |
| Slack redundancy | 0.00 | −58.95 | 0.00 | −113.20 | −32.16 | −46.27 | −40.36 | 0.00 | −41.14 | ||
| Total redundancy | −40.75 | −90.22 | −53.29 | −211.69 | −39.70 | −62.14 | −41.02 | −145.90 | −108.22 | ||
| Output Deficiency (or Excess) and Subitems | Henan | Anhui | Jiangsu | Shandong | ||||||||
|---|---|---|---|---|---|---|---|---|---|---|---|---|
| Zhuma Dian | Shang Qiu | Pingding Shan | Fu Yang | Su Zhou | Chu Zhou | Su Qian | Lin Yi | He Ze | ||||
| Desired output | Economic output | Gross domestic product | Radial deficiency | 0.00 | 0.00 | 0.00 | 0.00 | 0.00 | 0.00 | 0.00 | 0.00 | 0.00 |
| Slack deficiency | 0.00 | 0.00 | 0.00 | 0.00 | 0.00 | 0.00 | 0.00 | 0.00 | 0.00 | |||
| Total deficiency | 0.00 | 0.00 | 0.00 | 0.00 | 0.00 | 0.00 | 0.00 | 0.00 | 0.00 | |||
| Social output | Urbanization rate | Radial deficiency | 0.00 | 0.00 | 0.00 | 0.00 | 0.00 | 0.00 | 0.00 | 0.00 | 0.00 | |
| Slack deficiency | 5.94 | 9.93 | 7.61 | 14.90 | 12.02 | 3.96 | 1.05 | 11.80 | 12.63 | |||
| Total deficiency | 5.94 | 9.93 | 7.61 | 14.90 | 12.02 | 3.96 | 1.05 | 11.80 | 12.63 | |||
| Ecological output | Excellent air quality days | Radial deficiency | 0.00 | 0.00 | 0.00 | 0.00 | 0.00 | 0.00 | 0.00 | 0.00 | 0.00 | |
| Slack deficiency | 7.11 | 0.00 | 16.93 | 25.45 | 39.62 | 31.94 | 4.05 | 15.08 | 31.96 | |||
| Total deficiency | 7.11 | 0.00 | 16.93 | 25.45 | 39.62 | 31.94 | 4.05 | 15.08 | 31.96 | |||
| Undesired output | PM2.5 Concentration | Radial excess | −6.40 | −5.13 | −13.42 | −12.80 | −1.42 | −2.29 | −0.08 | −19.05 | −10.91 | |
| Slack excess | 0.00 | 0.00 | 0.00 | 0.00 | 0.00 | 0.00 | 0.00 | 0.00 | 0.00 | |||
| Total excess | −6.40 | −5.13 | −13.42 | −12.80 | −1.42 | −2.29 | −0.08 | −19.05 | −10.91 | |||
© 2020 by the authors. Licensee MDPI, Basel, Switzerland. This article is an open access article distributed under the terms and conditions of the Creative Commons Attribution (CC BY) license (http://creativecommons.org/licenses/by/4.0/).
Share and Cite
Zhang, C.; Wang, C.; Mao, G.; Wang, M.; Hsu, W.-L. An Empirical Study on the Ecological Economy of the Huai River in China. Water 2020, 12, 2162. https://doi.org/10.3390/w12082162
Zhang C, Wang C, Mao G, Wang M, Hsu W-L. An Empirical Study on the Ecological Economy of the Huai River in China. Water. 2020; 12(8):2162. https://doi.org/10.3390/w12082162
Chicago/Turabian StyleZhang, Chunmei, Chengxiang Wang, Guangxiong Mao, Min Wang, and Wei-Ling Hsu. 2020. "An Empirical Study on the Ecological Economy of the Huai River in China" Water 12, no. 8: 2162. https://doi.org/10.3390/w12082162
APA StyleZhang, C., Wang, C., Mao, G., Wang, M., & Hsu, W.-L. (2020). An Empirical Study on the Ecological Economy of the Huai River in China. Water, 12(8), 2162. https://doi.org/10.3390/w12082162