Article

Quantitative Analysis of the Impact of Meteorological Factors on Reference Evapotranspiration Changes in Beijing, 1958–2017

1
State Key Laboratory of Simulation of Water Cycle in River Basin, China Institute of Water Resources and Hydropower Research, Beijing 100038, China
2
National Center of Efficient Irrigation Engineering and Technology Research-Beijing, Beijing 100048, China
*
Author to whom correspondence should be addressed.
Water 2020, 12(8), 2263; https://doi.org/10.3390/w12082263
Submission received: 20 May 2020 / Revised: 29 July 2020 / Accepted: 29 July 2020 / Published: 12 August 2020
(This article belongs to the Section Hydrology)

Abstract

:
The effects of meteorological factors on reference evapotranspiration (ET0) are variable on different time scales, although research tends to focus only on certain time scales. Therefore, using the meteorological data from 1958 to 2017 of Beijing, China, ET0 values over the last 60 years were calculated using Penman–Monteith method. The variation in ET0 values was thus analyzed against four meteorological factors over different time scales. The sensitivity of ET0 to these factors was assessed using a sensitivity coefficient, while the contribution of each factor to ET0 change was quantified by combining this sensitivity coefficient with the factor’s relative change rate over multiple time scales. The results showed that the sensitivity coefficient of relative humidity over different time scales were all negative, while the sensitivity coefficients of net radiation, temperature and wind speed were mostly positive. The main sensitivity factors of ET0 on different time scales varied. On annual time scales, the main factors were relative humidity and temperature. Over annual time scales, relative humidity and net radiation alternated as the main sensitivity factor; while over interannual time scales, the most sensitive factor was relative humidity during 1958–1979 and net radiation thereafter. The contribution of these four meteorological factors to ET0 also fluctuated greatly on intra-annual time scales. On daily time scales, the contributions of temperature and wind speed at the start and end of the year were large, while net radiation and relative humidity were dominant mid-year. On monthly to seasonal time scales, the contributions of these four meteorological factors to ET0 were notable. The contribution of relative humidity was largest in spring and autumn; net radiation was dominant in summer, while temperature and wind speed were dominant in winter. This research on the temporal variability of ET0 response factors is of great significance for understanding regional climate change.

1. Introduction

Evapotranspiration refers to the key hydrological process of water vapor escaping from the land surface to the atmosphere, which occurs between vegetation, soil or open water and the atmosphere [1,2] Reference evapotranspiration (ET0) is defined as the maximum evapotranspiration of a hypothetical underlying surface of green grass 0.12 m in height, actively growing and adequately watered, with fixed surface resistance and albedo values of 70 m/s and 0.23, respectively [3,4]. ET0 is considered one of the most important hydrological variables for scheduling irrigation systems because it affects the water and energy balance between land and air, and must be considered when calculating actual evapotranspiration for a region or a basin [5,6,7,8]. ET0 is also regarded as a key parameter for evaluating the efficiency of agricultural water-use [9].
Studies have shown that climate change alters ET0 by affecting the hydrological cycle [10]. Other factors such as temperature (T), relative humidity (RH) and net radiation (RN), which influence ET0, also undergo changes in response to climate change. However, a change in ET0 will, in turn, affect regional climate variation [11,12]. Therefore, analyzing the spatiotemporal variability of ET0 will help us to understand climate change and its response to the hydrological cycle [13,14]. Many studies have investigated the temporal and spatial characteristics of ET0 and the response mechanism of meteorological factors to changes in ET0 [15,16,17,18,19,20,21]. In these studies, the climate tendency rate is used to describe the temporal and spatial changes of regional ET0. To study the climate response of ET0, various methods have been used, including principal component analysis, partial correlation analysis, sensitivity coefficient analysis and methods combining the sensitivity coefficients with the relative change rates to calculate the contribution of meteorological factors. Among these methods, the sensitivity coefficient method is the most widely used [22,23,24]. The sensitivity coefficient was proposed by McCuen et al. [25] and defined as the ratio of ET0 change rate to meteorological factor change rate [26]. Gong et al. [27] believed that sensitivity analysis was vital to understanding the impact of climate variables on ET0 change. Saxton et al. [28] found that ET0 was most sensitive to RN. Ren et al. [29] and Sergio et al. [30] concluded that the main sensitive factors affecting the change of ET0 were RH and T. Others have suggested that T or RH were the most sensitive factors affecting ET0 [31]. Clearly, the main sensitive factors to ET0 are different in various regions.
Although the sensitivity coefficient method is the main method used to analyze the underlying cause of ET0 change, it does not quantify the impact of climate factors on ET0. Therefore, contribution rate analysis combines the sensitivity coefficients with the change rates of meteorological factors to calculate their contributions to ET0 change. This can more accurately explain the causes of ET0 change [32,33]. At the same time, given the response of various climate factors over different time scales, the factors driving ET0 change can vary. Gao et al. [34] found that the ET0 of most basins in China showed a decreasing trend on annual to seasonal scales. Ma et al. [35] found that ET0 within the Heihe River Basin was sensitive to climate factors on monthly and seasonal scales, identifying wind speed (U) as the dominant factor causing the change in ET0 in this region. Kang et al. [36] found that the annual decrease in ET0 in the Altay region was caused by the decrease in summer ET0, concluding that the decrease in summer U was the main reason for this change in ET0. Huan et al. [37] believed that, on annual to seasonal scales in the central Shandong region, ET0 was most sensitive to the change of RH, although the ranking of the main sensitive factors of ET0 varied on quarterly and monthly scales. They identified the main contributing factors to ET0 change as U, sunshine percentage, RH and T. Zou et al. [38] reported that decreases in U and sunshine hours were the main reasons for the decrease in ET0 on annual and quarterly scales on Hainan Island, while the increase in water vapor pressure was the main reason for the decrease of ET0 in winter.
From the above analysis, it is clear that the response of meteorological factors to ET0 varies greatly on different spatial and temporal scales. However, most research focuses only on certain time scales and does not consider the response of meteorological factors to ET0 changes on different time scales. Based on the meteorological data from 1958 to 2017 for Beijing, we analyzed four major meteorological factors (i.e., RN, T, RH and U) and ET0 change characteristics on different time scales. We qualitatively analyzed the major meteorological factors on ET0 over different time scales and quantitatively assessed the contributions of these meteorological factors to ET0 on different time scales. Determining the causes of ET0 change on different time scales will provide a theoretical basis for water resources regulation, irrigation system design and crop water management in Beijing.

2. Materials and Methods
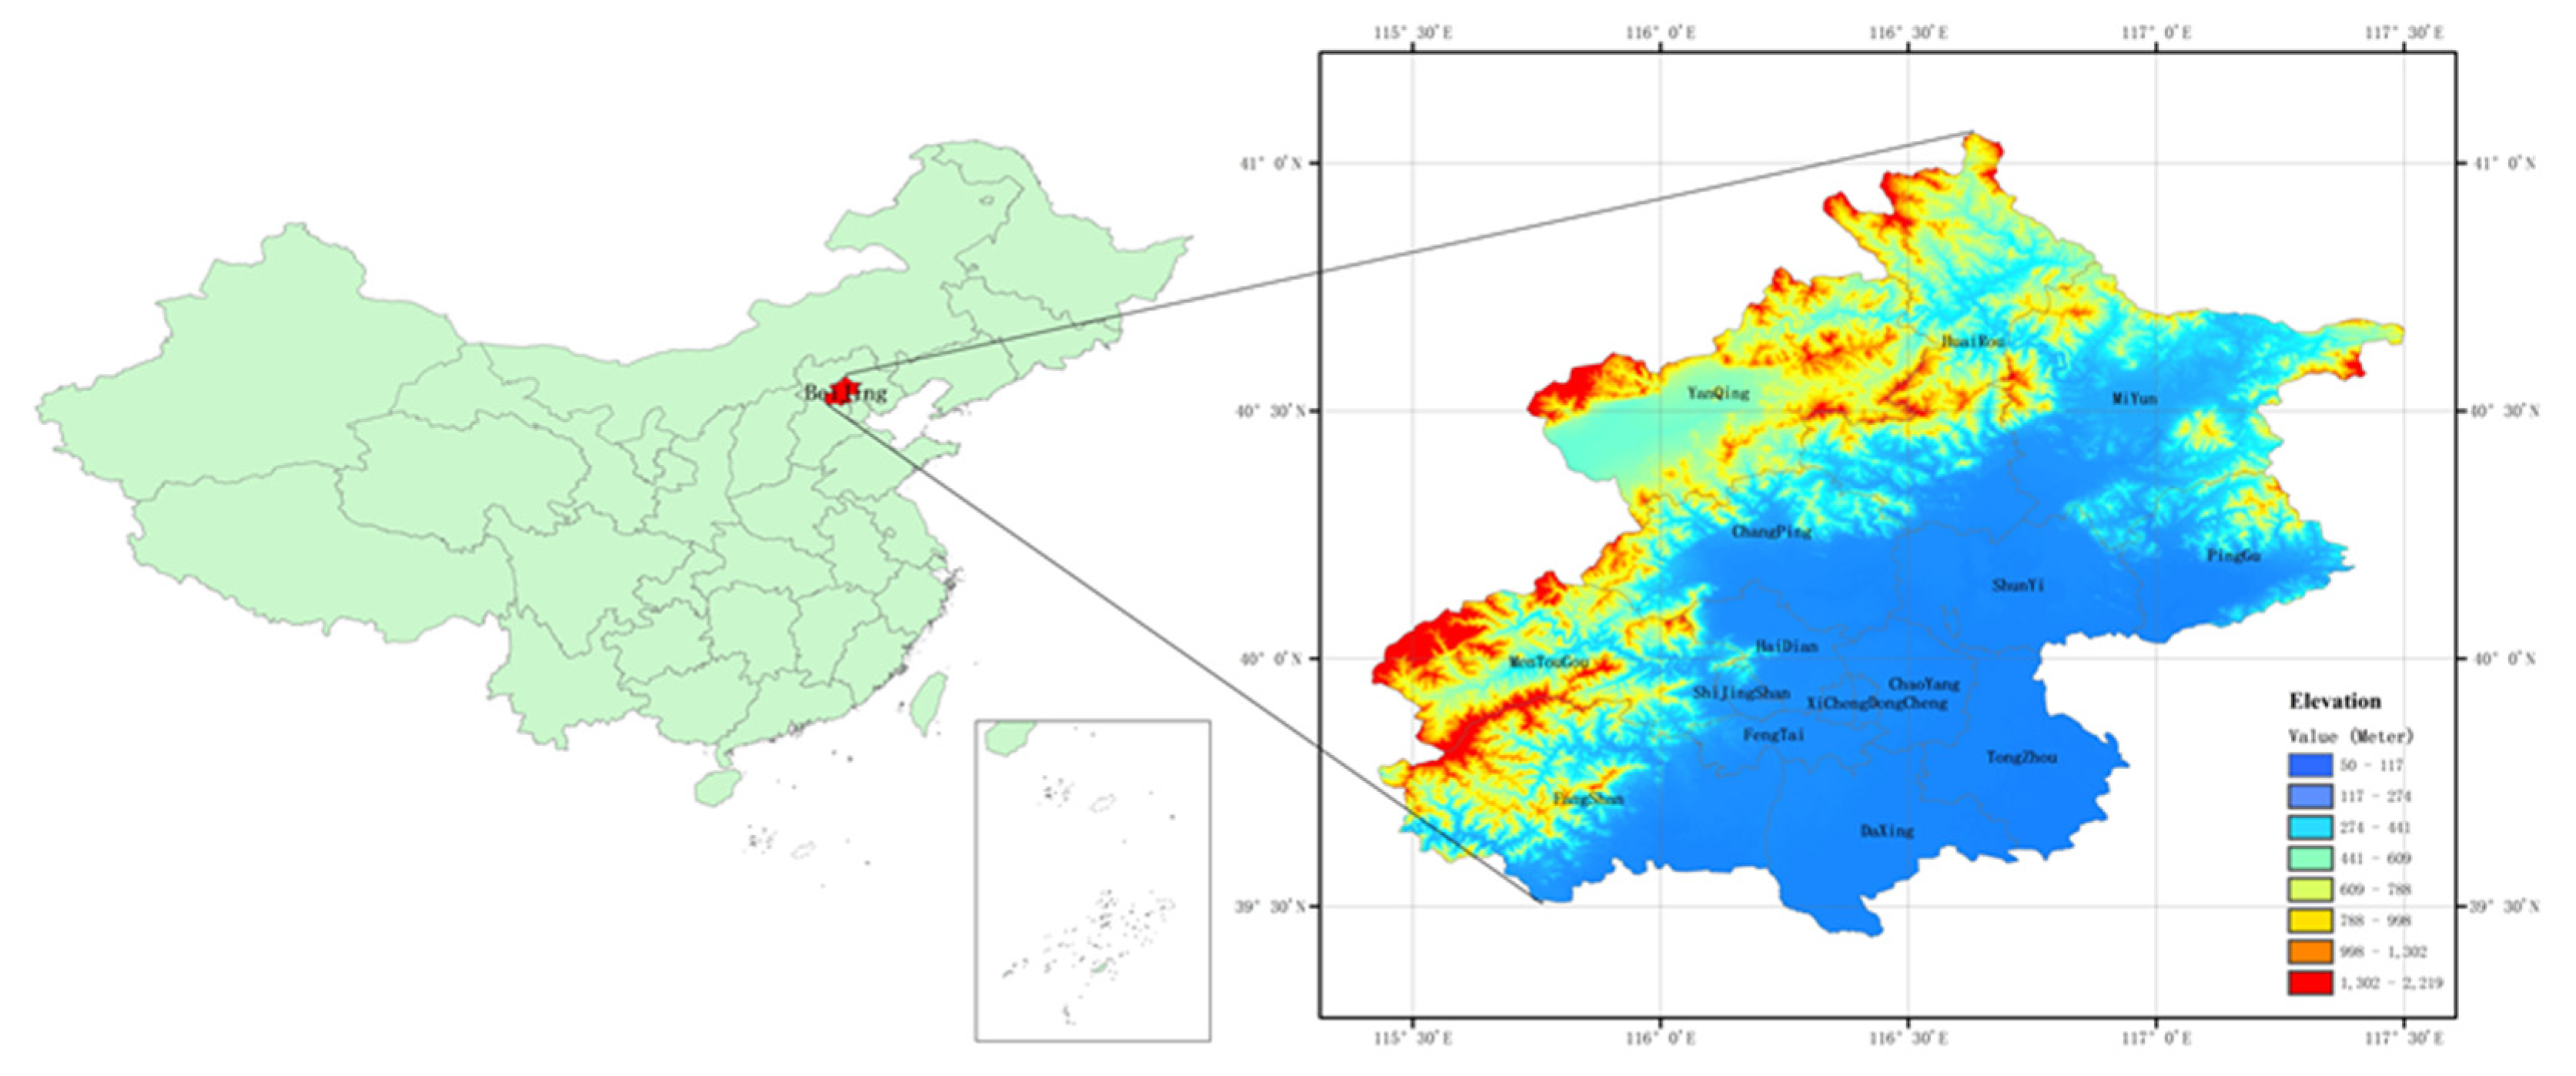
2.1. Study Area

The study area is situated in Beijing (39.4°–41.6° N; 115.7°–117.4° E), with an average elevation of 43.5 m (Figure 1). It has a temperate semi-arid continental monsoon climate. The multi-year average temperature, wind speed and relative humidity are 12.1 °C, 1.2 m/s and 52%, respectively. There are 2502 h of annual sunshine, the effective accumulated temperature over 10 °C is 4730 °C, and the average daily solar net radiation is 171 W/m2. There are 185 frost-free days throughout the year on average. The annual rainfall and average evaporation are 540 mm and 1021 mm, respectively. More than 80% of the annual rainfall occurs from June to September. The soil is mainly sandy loam, suitable for the growth of various crops. A wheat–corn rotation is the traditional cultivation system in Beijing. With this system, the annual crop water requirement is 876 mm, 453 mm of which is for winter wheat and 423 mm for summer corn [39,40]. Historical daily meteorological data from 1958 to 2017, including sunshine hours, T, RH and U, were obtained from China Meteorological Science (http://cdc.cma.gov.cn).

2.2. Calculation of Reference Evapotranspiration

The Penman–Monteith (P–M) equation, recommended by Food and Agricultural Organization guidelines (FAO-56), was used to calculate ET0 values [3]:
E T 0 = 0.408 Δ ( R n G ) + γ U ( 900 T + 273 ) ( e s e a ) Δ + γ ( 1 + 0.34 U )
where ET0 is the reference evapotranspiration (mm d−1); Δ is the slope of the saturated vapor pressure curve; R n is the surface net radiation (MJ/m2/d); G is the surface soil heat flux (MJ/m2/d), could be neglected at daily scale [3]; γ is the psychrometric constant(kPa°C−1); T is the daily average temperature (°C); U is the wind speed at 2 m height (m/s); e s is the saturated vapor pressure (kPa); and e a is the actual vapor pressure (kPa).

2.3. Sensitivity Analysis

A sensitivity coefficient was used to quantify the influence of each meteorological factor on ET0. This coefficient is the ratio between the variations in ET0 and the change rate of each meteorological factor [25,41,42], defined as:
S x = lim Δ x 0 ( Δ E T 0 / E T 0 Δ x / x ) = E T 0 x × | x | E T 0
where Sx is the sensitivity coefficient of a given meteorological factor, x; and ΔET0 and Δx are the variable amounts of ET0 and meteorological factor x, respectively. A positive or negative Sx represents an increase or decrease in ET0, as the meteorological factor increases or decreases, respectively. Meanwhile, the absolute value of Sx reflects the degree of sensitivity to that factor.

2.4. Determination of Contributions

Multiplying the sensitivity coefficient of a single meteorological factor by its relative change rate over multiple years indicates the contribution rate of the factor to the change in ET0. A positive value indicates that the change related to this selected factor causes an increase in ET0, making a positive contribution. A negative value indicates that the change in the selected factor causes a decrease in ET0, making a negative contribution.
R C x ( % ) = n × T r e n d x | a v x | × 100
C o n x = S x × R C x
where RCx is the multiannual relative variation rate of x; n is a given year; Trendx is the meteorological trend of x and reflects the variation of a given meteorological factor on the selected space scale over multiple years; avx is the multiannual mean value; and Conx is the contribution rate of the meteorological factor x to ET0 variation.
The contribution rate of each meteorological factor is accumulated to obtain the total contribution to the change in ET0, as follows:
C o n = C o n R N + C o n T + C o n R H + C o n U
where ConRN, ConT, ConRH and ConU represent the contribution rates of RN, T, RH and U to ET0 variation, respectively; and Con represents the total contribution rate of these meteorological factors to ET0 variation.
G x = C o n x × E T 0
G s u m = G R N + G T + G R H + G U
where GRN, GT, GRH and GU represent the average contributions of RN, T, RH, and U to ET0 variation, respectively; and Gsum represents the total contribution of these four meteorological factors to ET0 variation.

3. Results

3.1. Changes in Meteorological Factors and ET0 at Different Time Scales

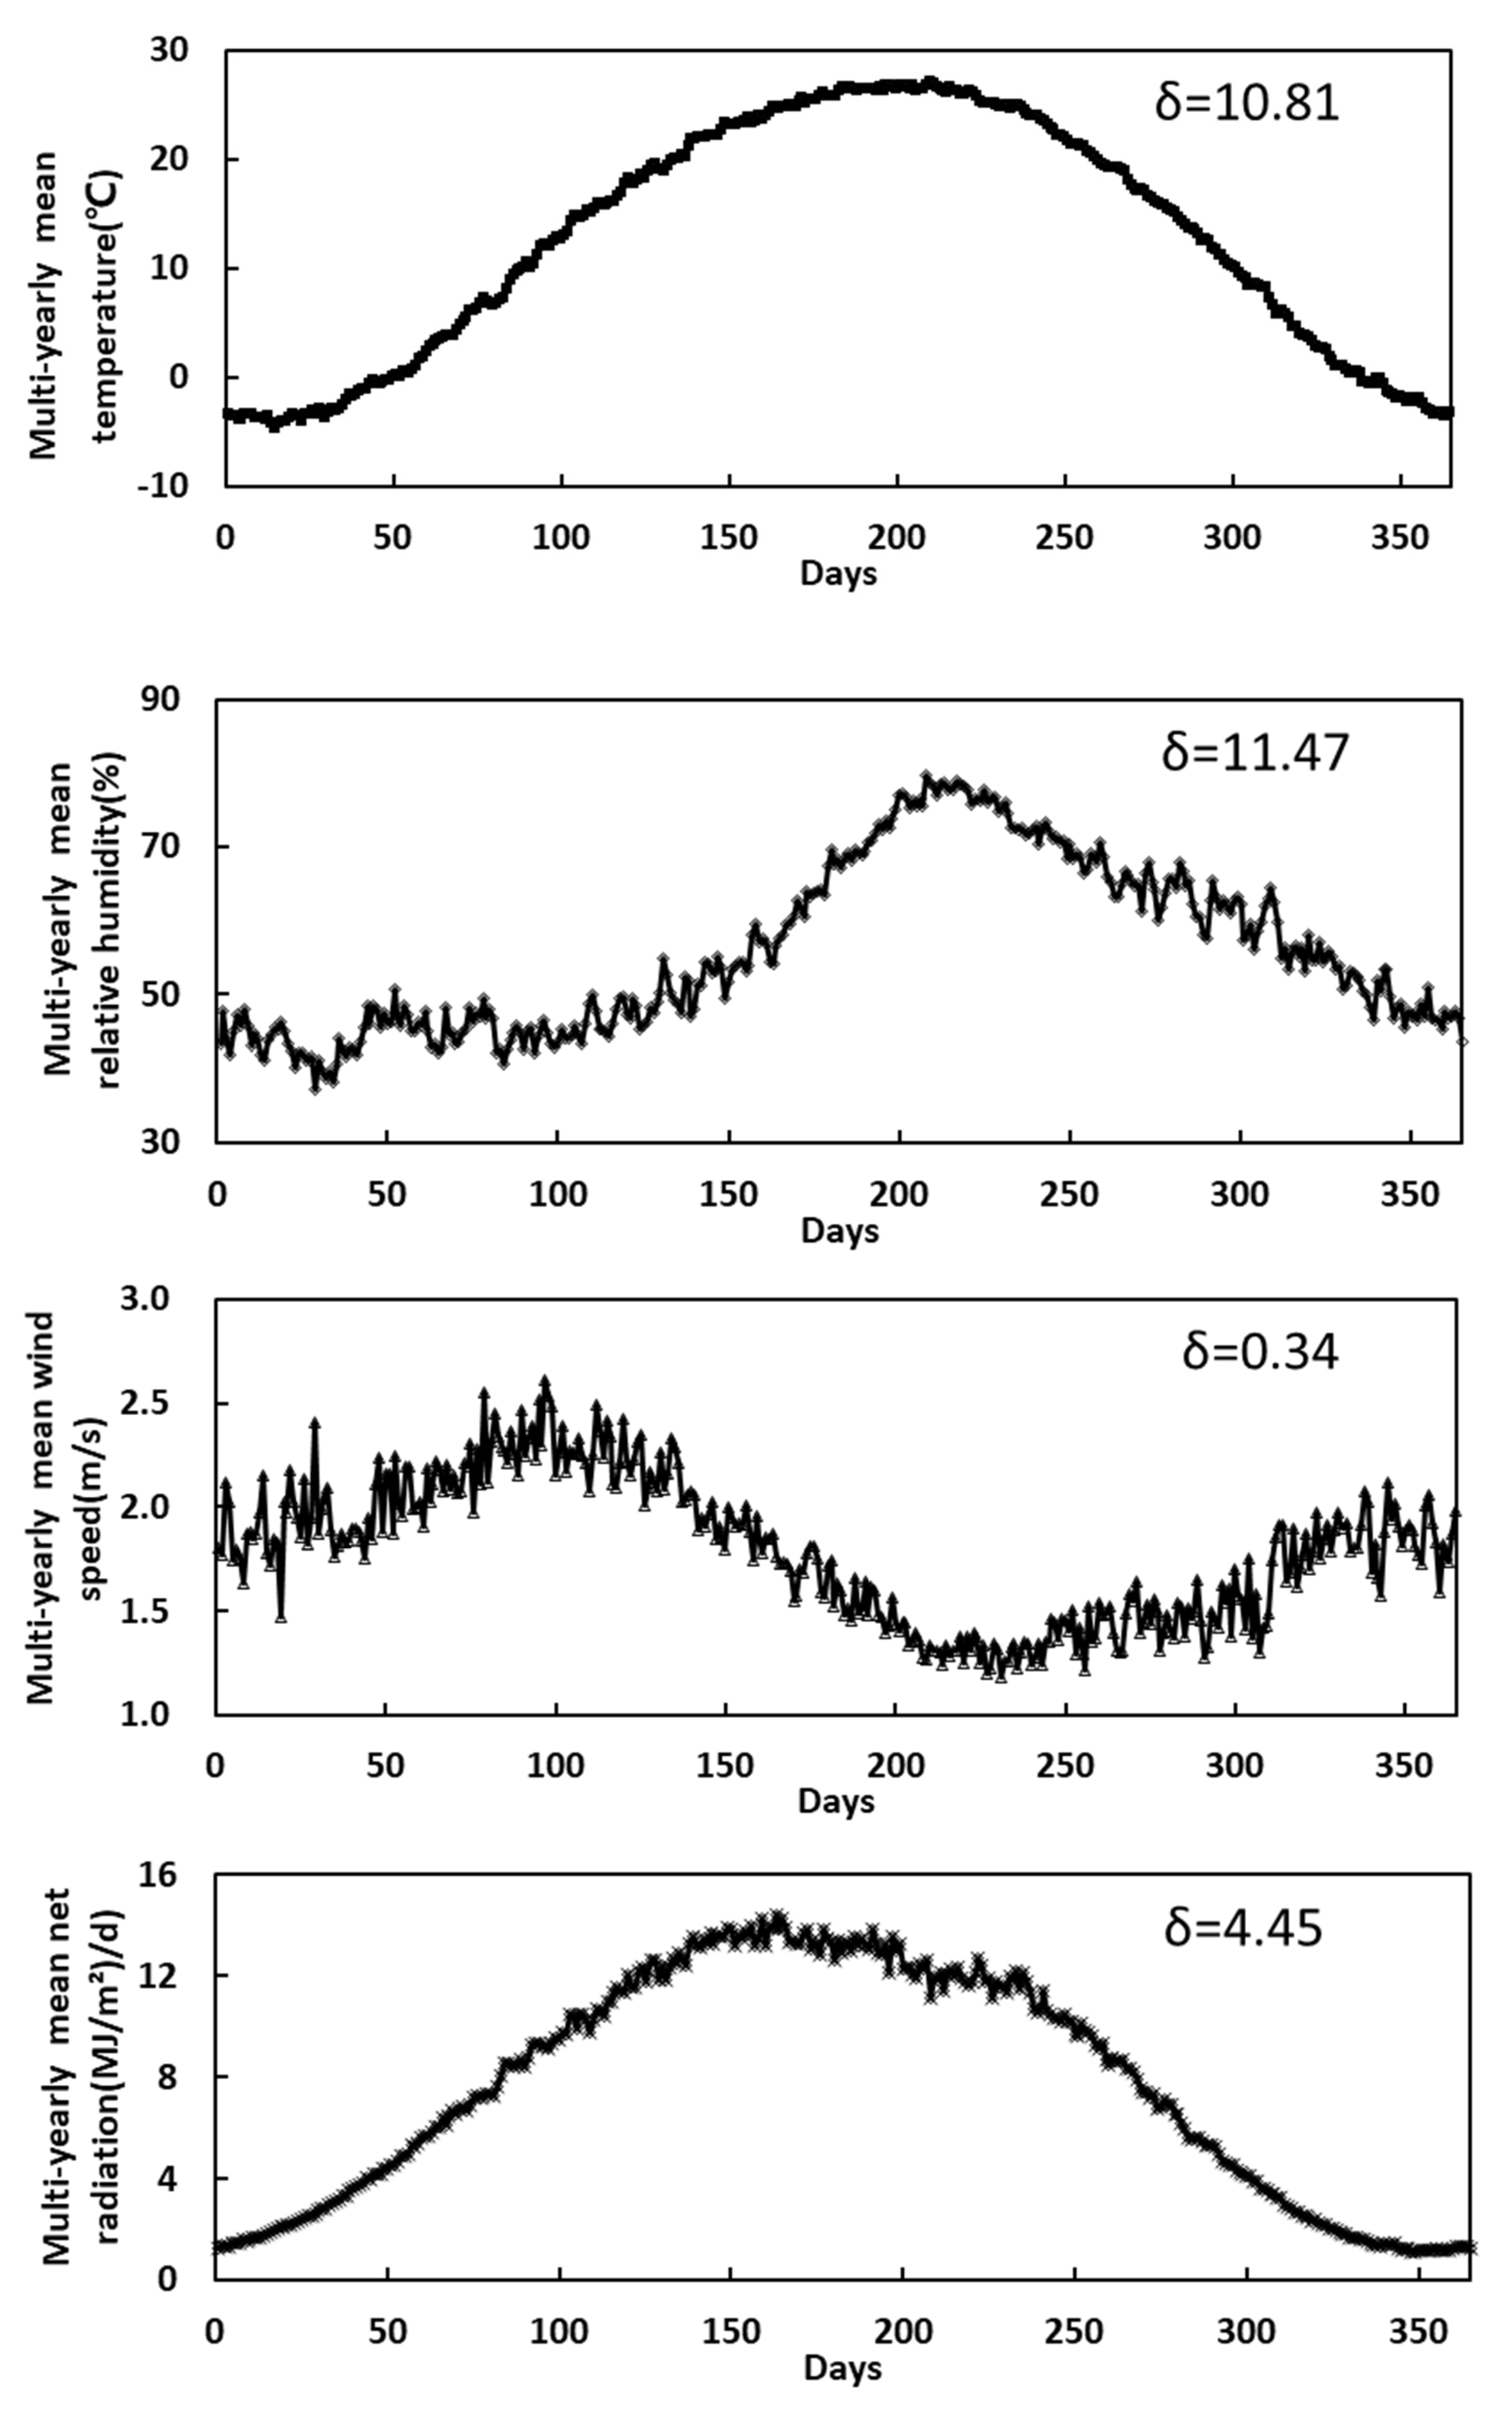
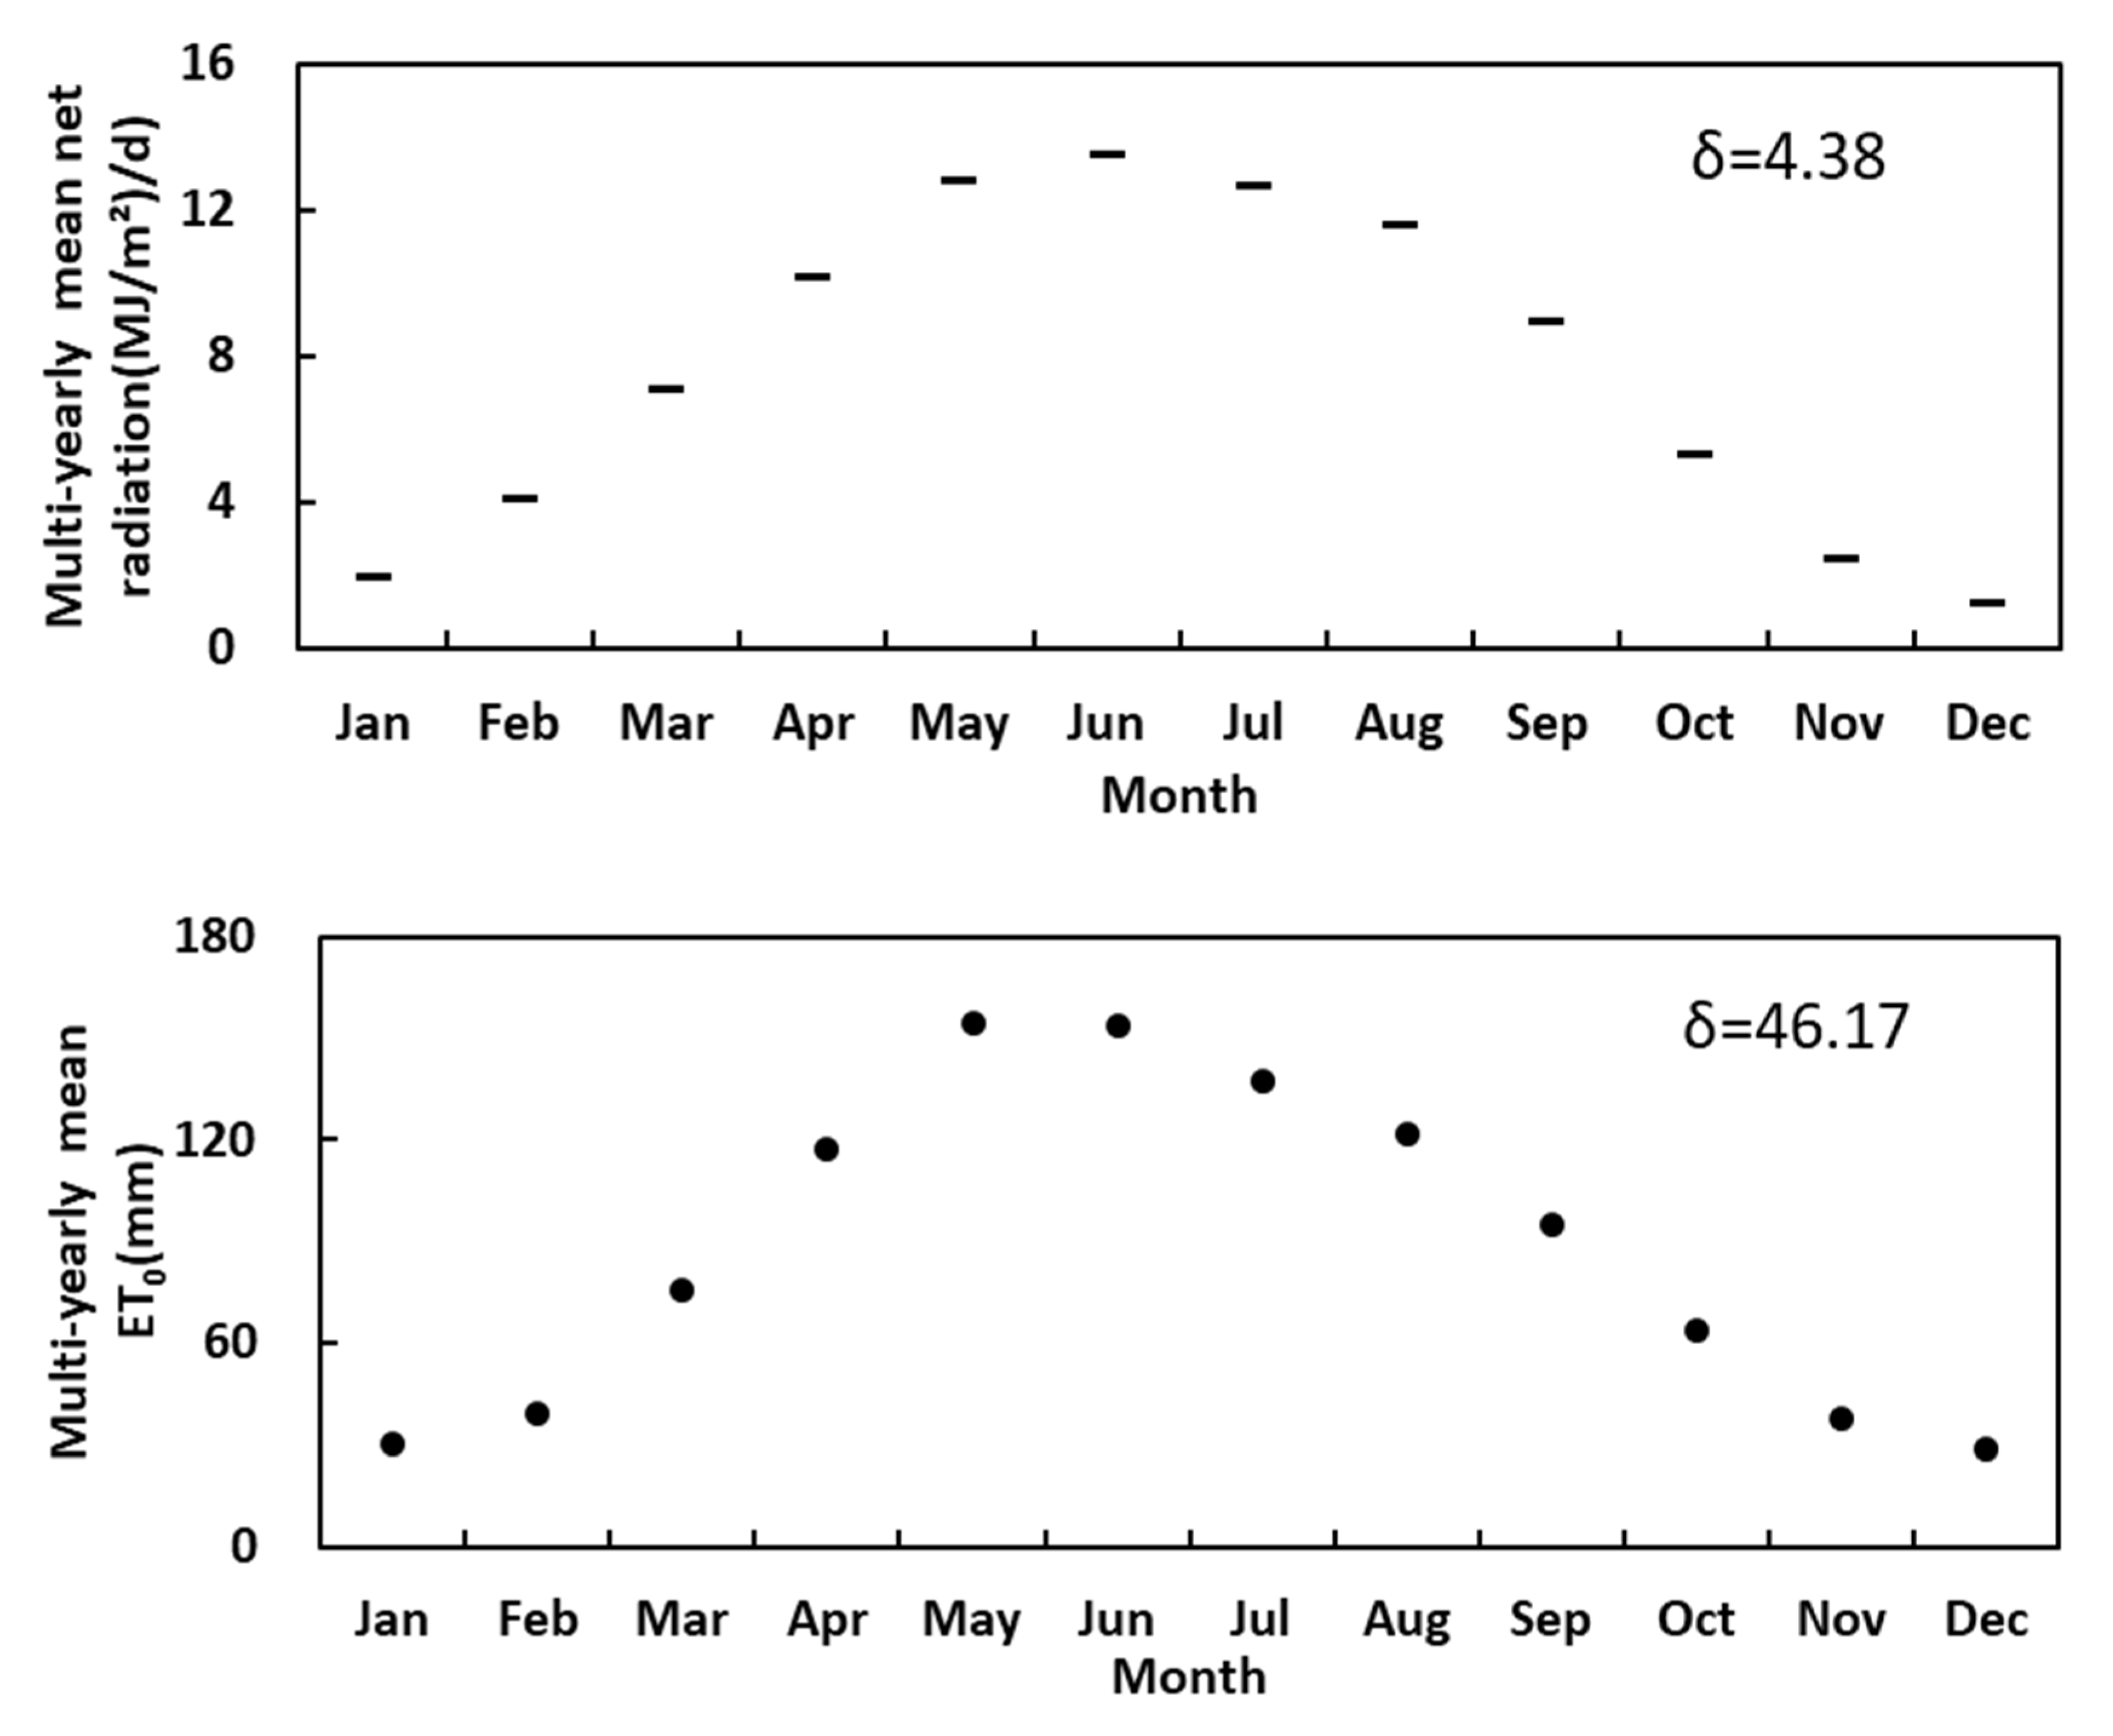
3.1.1. Intra-Annual Variations

Annual variations in RN, T, RH, U and ET0 indicated by multiannual averages are shown in Figure 2. At daily scales, RN, T, RH, U and ET0 ranges were 1.13–14.40 MJ/m2/d, −4.68–27.04 °C, 37.25%–79.58%, 1.18–2.61 m/s and 0.78–5.57 mm, with average values of 7.70 MJ/m2/d, 12.52 °C, 56.03%, 1.79 m/s and 2.89 mm, respectively. On monthly scales, RN, T, RH, U and ET0 ranges were 1.29–13.57 MJ/m2/d, −3.65–26.48 °C, 43.39%–75.25%, 1.30–2.31 m/s and 29.10–154.14 mm, with average values of 7.68 MJ/m2/d, 12.45 °C, 55.94%, 1.79 m/s and 87.92 mm, respectively, the changes in these four meteorological factors and ET0 were consistent with those observed at daily scales, with similar trends in RN, T, RH, U and ET0 (Figure 2). The ranking of standard deviations of four climatic factors and ET0 at daily scales was as follows: RH > T > RN > ET0 > U, while in monthly scales, this ranking became ET0 > RH > T > RN > U. This shows that RH and ET0 are the most concentrated factors at daily and monthly time scales, respectively, while the U are the most scattered factor when it is a daily or monthly time scale.

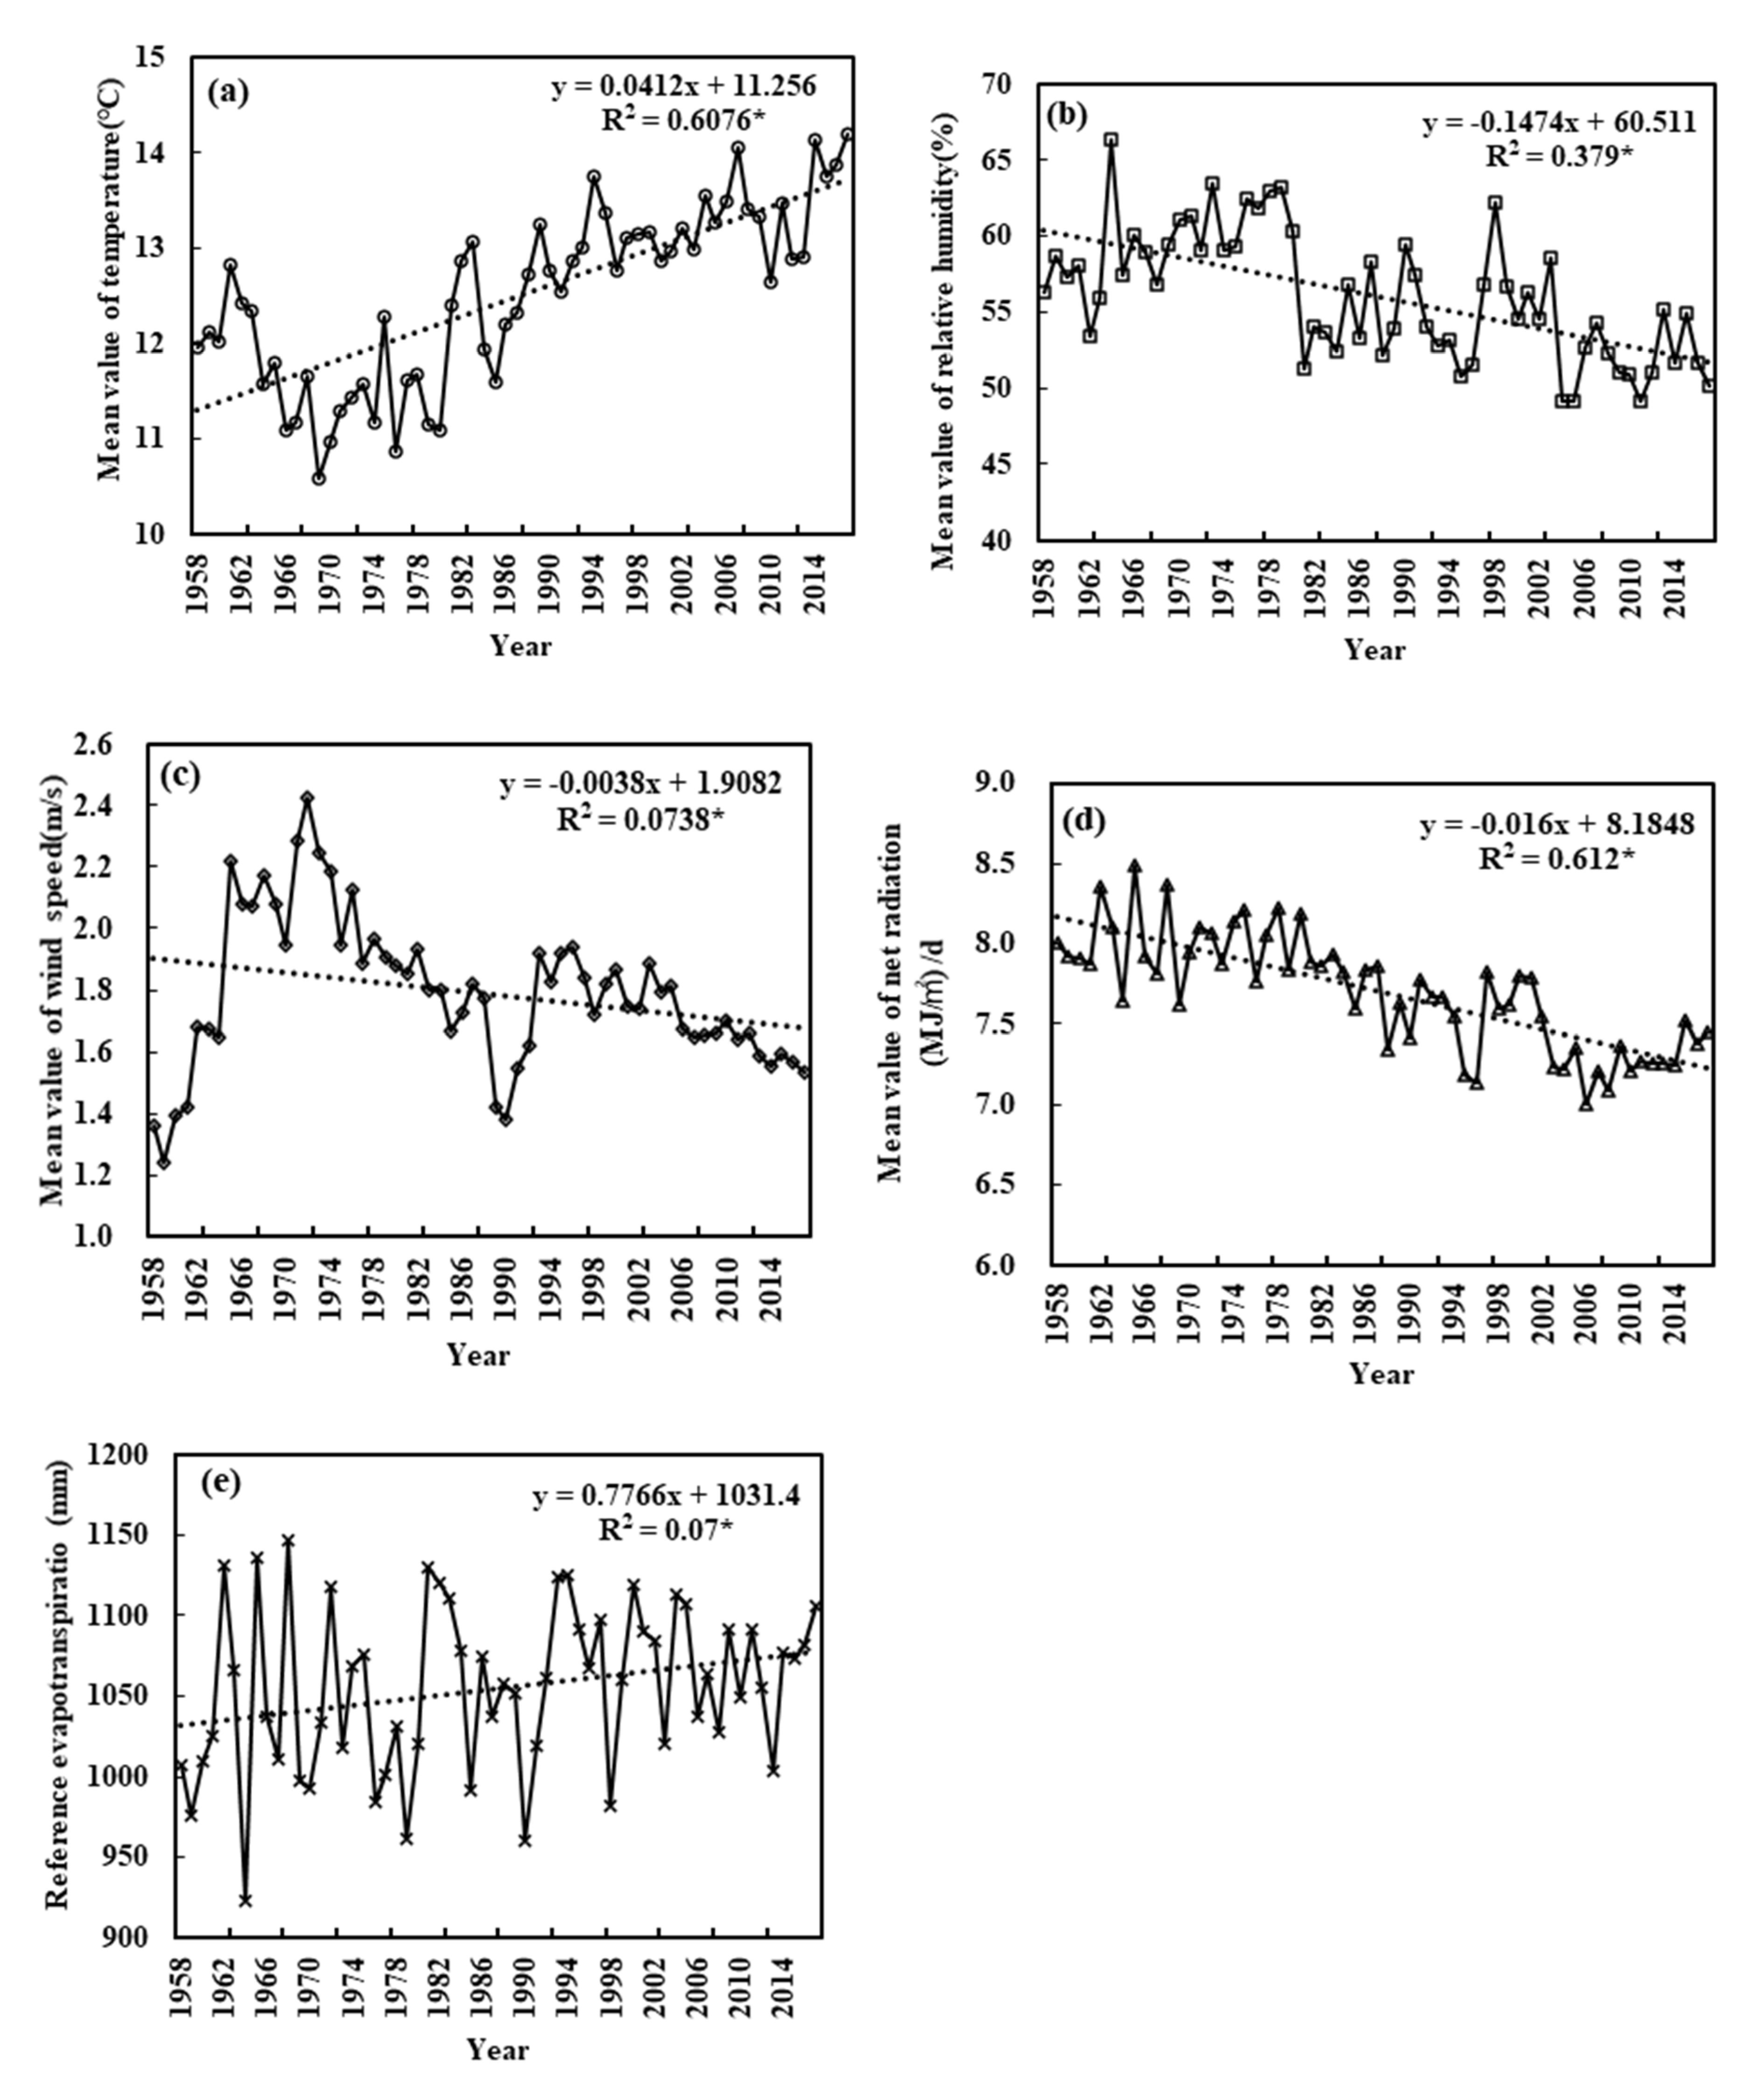
3.1.2. Interannual Variations

The main meteorological factors and ET0 changes from 1958 to 2017 are shown in Figure 3. At interannual scales, the fluctuations of U were the largest, while fluctuations of RN were the smallest. The RN, RH and U decreased at rates of 0.16 (MJ/m2/d)/10a, 1.47%/10a and 0.04 (m/s)/10a, respectively. Meanwhile, T and ET0 increased at rates of 0.41 °C/10a and 7.77 mm/10a over the study period. The ranking of the four climate factors and ET0 changes as follows ET0 > T > RN > U > RH. Significance test results show that at a significant level of 0.05, the four climate factors and ET0 show significant changes. The five factors are fitted with a linear function, and the ranking of correlation coefficients is RN > T > RH > U > ET0.

3.2. Variations in the Sensitivity Coefficients of Meteorological Factors

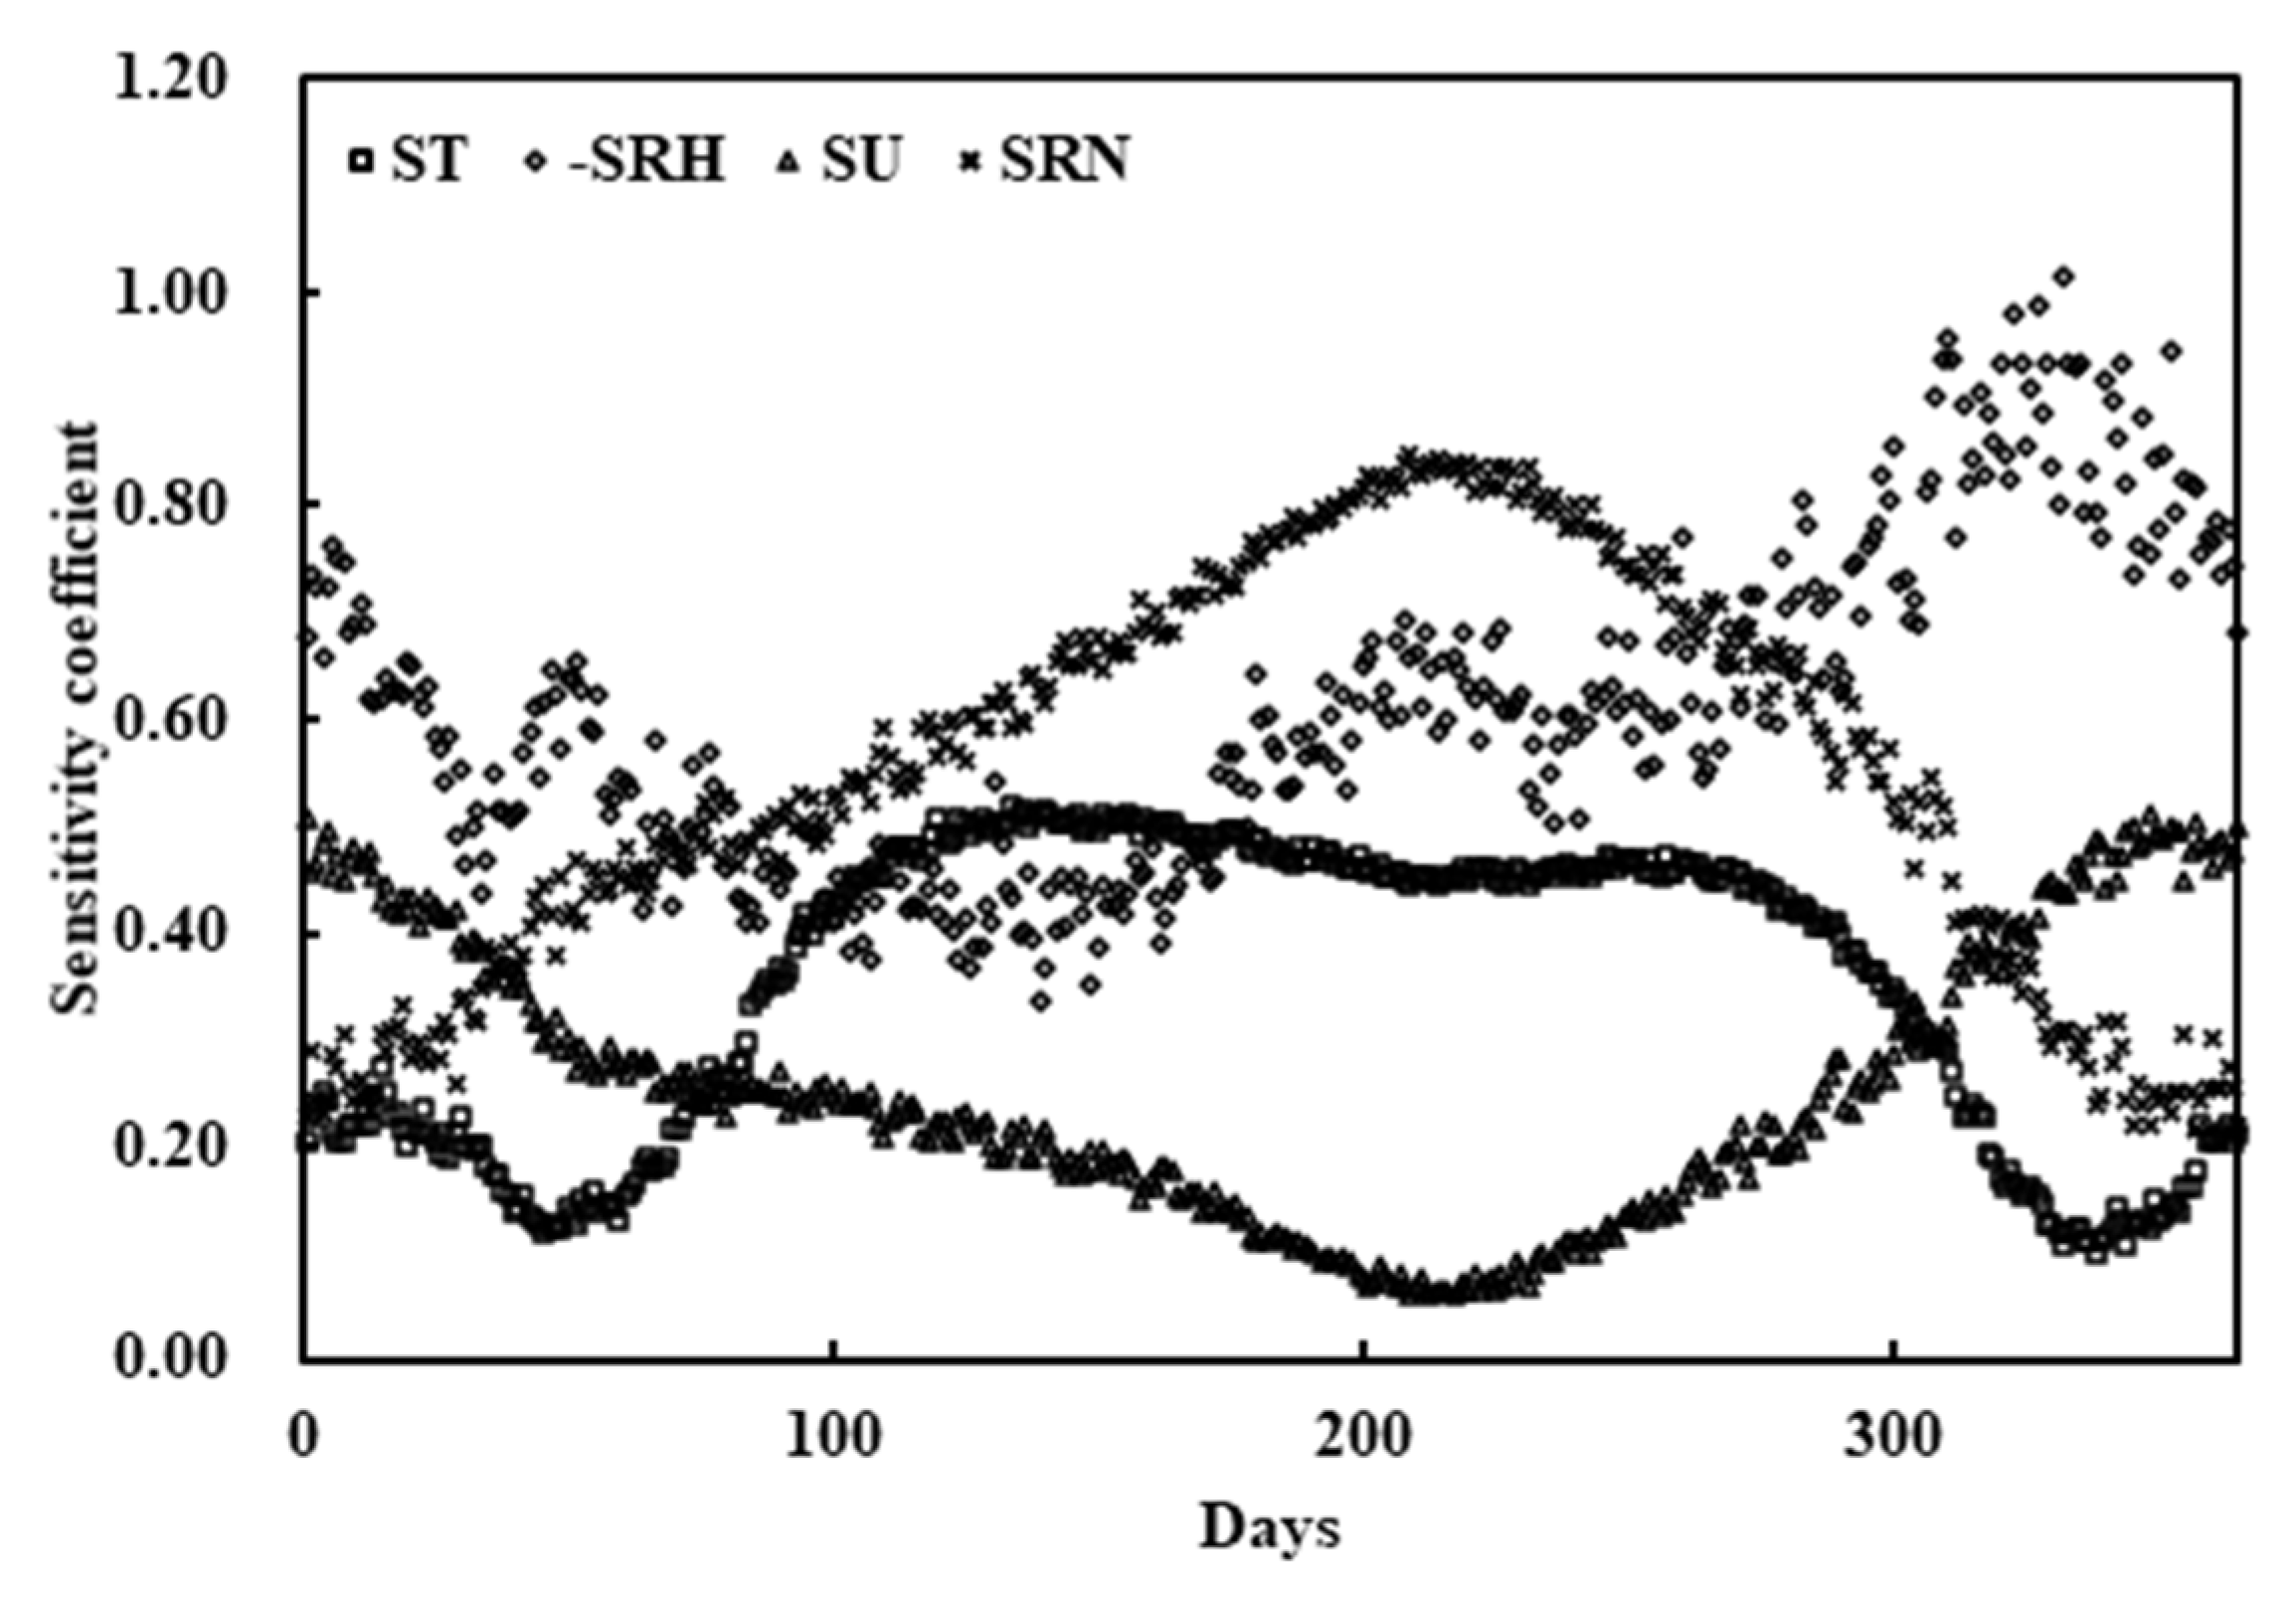
3.2.1. Intra-Annual Variations in Sensitivity Coefficients

The daily sensitivity coefficient changes for each of the four meteorological factors in Beijing over the past 60 years are in shown in Figure 4. The sensitivity coefficients of RN, T, RH, and U were 0.217–0.847, 0.101–0.507, 0.337–1.015 and 0.059–0.510, respectively. Over the course of 1 year, the T sensitivity coefficient had two peaks and two valleys, with an approximately symmetrical distribution. The RH sensitivity coefficient first decreased and then increased over the year, with a zigzag distribution. The U sensitivity coefficient first decreased and then increased over the year. Meanwhile, the RN sensitivity coefficient first increased and then decreased, with a single-peak distribution.
Table 1 shows rates of change of the four meteorological factors on monthly to seasonal scales. The annual trend in T was positive, while the annual trends in RN, RH (except for January) and U were negative. These values suggest that, on monthly scales, T increased each month, while RN, RH (except January) and U (except July, August and September) decreased each month in the past 60 years. T increased the most in March and the least in June, having an annual change rate varying from 0.228 °C/10a to 0.647 °C/10a. RH increased only in January and decreased in all other months (especially in March), having an annual change rate varying from −2.9%/10a to 0.4%/10a. U increased only in July, August and September and decreased in all other months, having an annual change rate varying from −0.130 (m/s)/10a to 0.084 (m/s)/10a. RN decreased most in January and least in August, having an annual change rate varying from −0.420 (MJ/m2)/10a to −0.012 (MJ/m2)/10a. Meanwhile, the biggest and the smallest RN values were recorded in June and January, respectively. ET0 decreased in January and June, but increased in all other months, with the largest increase in March and the largest decrease in June. The annual change rate of ET0 varied from −2.076 mm/10a to 2.826 mm/10a.
It can be seen that ET0 was the most sensitive to RH and RN on monthly and seasonal scales, but the ranking of sensitivity varied in different months and seasons (Table 1). On monthly scales, during November–February, the sensitivity of ET0 to the four climatic factors was as follows: RH > U > RN > T. In March, this ranking became RH > RN > U > T; in April, May and June it was RN > T > RH > U; in July, August and September, it was RN > RH > T > U, while in October, it was RH > RN > T > U. On seasonal scales, the sensitivity of ET0 to the four climatic factors also varied. In spring, the ranking was RN > T > RH > U; in summer, this ranking became RN > RH > T > U; in autumn, it was RH > RN > T > U; and in winter, it was RH > U > RN > T. According to annual averages, ET0 was most sensitive to RH, followed by RN and T, and was least sensitive to U (Table 1).

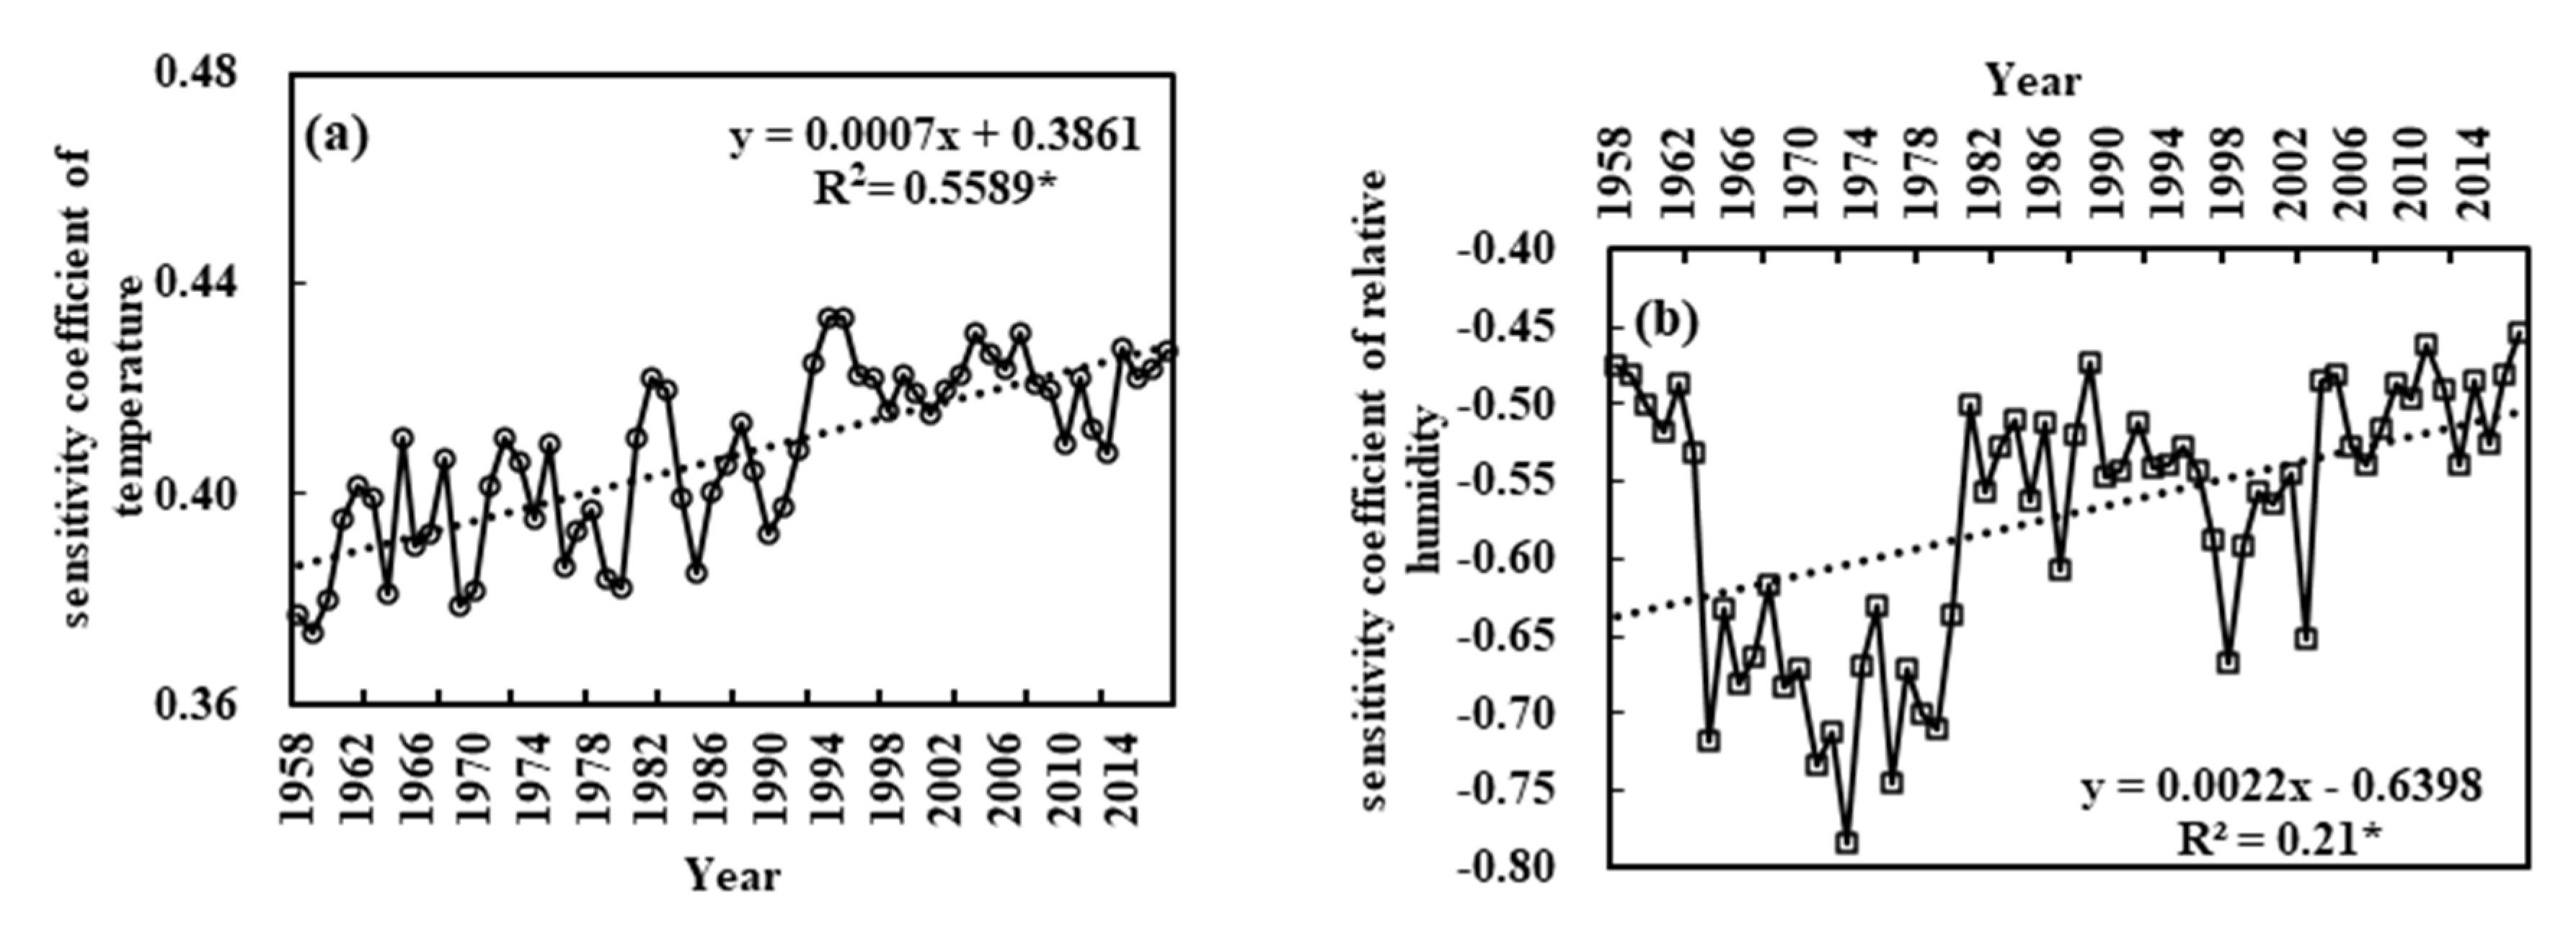
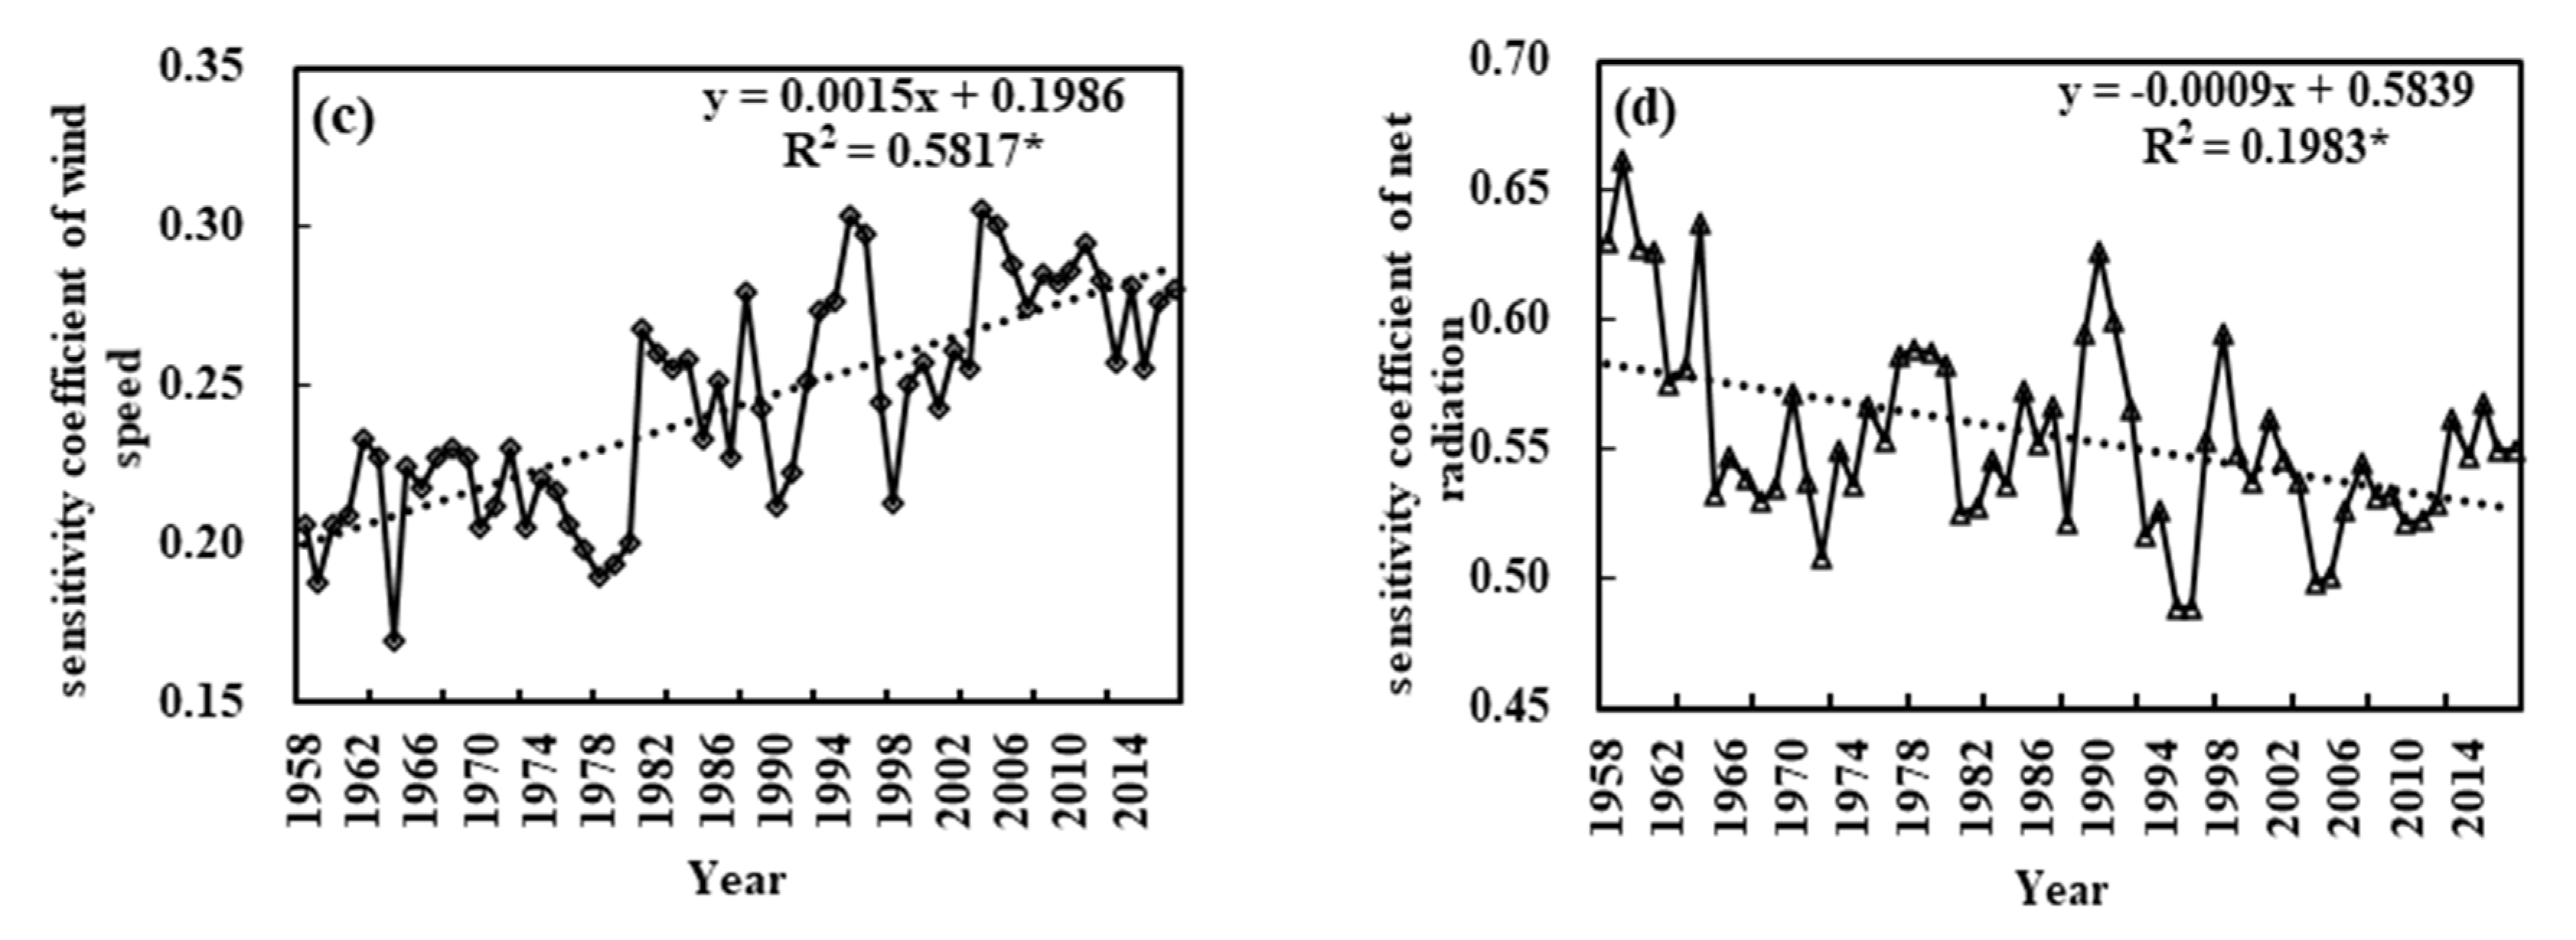
3.2.2. Interannual Variation of Sensitivity Coefficients

The interannual variations of the sensitivity coefficients of the four meteorological factors in Beijing from 1958 to 2017 are shown in Figure 5. Over the last 60 years, the sensitivity coefficients of RH and RN have declined at rates of −2.2%/10a and −0.009 (MJ/m2/d)/10a, respectively. Meanwhile, the sensitivity coefficients of T and U have increased at rates of 0.007 °C/10a and 0.015 (m/s)/10a, respectively. These changes indicate that the positive sensitivity of ET0 to both RH and RN has decreased, while its positive sensitivity to T and U has increased. The sensitivity coefficients of RN, T, RH and U were 0.555, 0.408, −0.572 and 0.244, respectively, with the ranges of 0.489–0.662, 0.374–0.434, −0.453–0.783 and 0.170–0.305. The sensitivity coefficients of T, U and RN varied slightly, while the sensitivity coefficient of RH fluctuated markedly.
From 1958 to 1979, the sensitivity coefficient of RH increased from −0.47 to −0.71, then decreased to 0.50 in 1981, and has continued to slowly decline. The turning point for this decline in the RH sensitivity coefficient occurred in 1979. On an annual scale, ET0 showed strongest sensitivity to RH and RN. From 1958 to 1963, RN was the most sensitive factor; while from 1964 to 1978, the most sensitive factor was RH; and then from 1979 to 2017, RH and RN were alternately the most sensitive factors affecting ET0.

3.3. Contributions of Meteorological Factors to Variation in Potential Evapotranspiration

3.3.1. Daily Time Scales

At daily time scales, the contributions of the four meteorological factors to ET0 are shown Figure 6. These factors made contributions on ET0 that typically varied between −2 and 4 mm. According to the average contributions of these four factors on a daily basis, the ranking of their contributions was T > RH > RN > U. However, the contribution of T fluctuated greatly in mid to late February, mainly because positive and negative distributions of T were relatively symmetrical over the study period, yielding a small mean value for T, when derived from Formulas (3) to (6). Because there were singular points in the contribution from T, the net contributions of RH and RN were greater than T. Clearly, the contributions of T and U at the start and end of the year were large, while contributions of RN and RH were dominant mid-year.

3.3.2. Monthly and Seasonal TIME Scales

Table 2 shows the contributions of the four meteorological factors to ET0 on monthly and seasonal scales. The contribution of T to the change in ET0 was positive, the contribution of RN to the change in ET0 was negative, while the contribution of RH to the change in ET0 was negative in January and positive for all other months. The contribution of U to the change in ET0 was positive in July, August and September, and negative for other months. Specifically, in December and January, U contributed the most to ET0 change, with contributions of −4.66 and −6.16 mm, while RN contributed the least to ET0 change, with contributions of −0.65 and −0.22 mm, respectively. In February and April, T contributed most to ET0 change, with contributions of 7.38 and 11.17 mm, while RN contributed least to ET0 change, with contributions of −1.26 and −2.93 mm. In March, May, August, October and November, the contributions of RH to ET0 change were greatest, with contributions of 13.92, 9.62, 13.62, 7.96 and 5.58 mm, respectively. On monthly scales, the ranking of the average contributions of the four meteorological factors to ET0 was RH > RN > T > U.
On seasonal scales, the contributions of T and RH to ET0 were positive for all four seasons, while the contributions of U to ET0 change was negative in all other seasons, but only in summer was positive. From spring to winter, the maximum meteorological factors contributing to ET0 change were RH, RN, T, and U, with contributions of 36.51, −49.67, 23.29 and 15.52 mm respectively. On seasonal scales, the average contributions of the four meteorological factors to ET0 were ranked: RH > RN > T > U, which was consistent with monthly scales.
Clearly, there was a difference between the total contributions of the four meteorological factors to ET0 change on both monthly and seasonal scales. This is because the calculation of ET0 change was characterized by the product of climate tendency and research year. However, meteorological factors are not a single linear change, the climate tendency does not reflect the changes in these meteorological factors. Therefore, the variation in ET0 calculated using this method becomes large. Notably, the differences between total contributions of meteorological factors and the change in ET0 on smaller than seasonal scales reflect the accumulation of differences in shorter cycles over the long term.

3.4. Discussion

Based on the daily data for meteorological variables in Beijing from 1958 to 2017, the ET0 for different time scales was calculated by using the P–M formula recommended by the FAO-56. The characteristics of change of the four main meteorological factors and ET0 were quantified using climate trends. The dynamic changes of these four meteorological factors led to an increase in ET0 of 7.766 mm/10a in Beijing, which is within the range of values reported in many former studies (5.9–19.3 mm) [43,44,45]. The differences in rates obtained in these studies likely reflect different study periods, having different ET0 ranges and trends.
Generally, the changes in sensitivity coefficients varied depending on the time scale considered. On daily scales, the sensitivity coefficients fluctuated markedly, and were derived for each variable. Suat et al. [46] found that the wind speed sensitivity coefficient fluctuated greatly, while the changes in the sensitivity coefficients of the other three meteorological factors (Tmax, Tmin and Rs) were smaller in eight regions in the United States. We found that RH was most sensitive to ET0 at the start and end of the day, while RN was the most sensitive factor in the middle of the day, which is consistent with the results of Hupet et al. [47], Liu et al. [48] and Zhao et al. [45]. On a monthly scale, ET0 was most influenced by RH from October to March, while RN played the biggest role in other months. Liu et al. [43] found that relative humidity was the most important factor in March, August, October, November and December, but in July it was sunshine. On seasonal scales, ET0 was most sensitive to RN in spring and summer, but to RH in autumn and winter. On annual scales, sensitivity coefficients of RH and RN decreased gradually, while those of T and U increased gradually. For 1958–1982, the RH sensitivity coefficient was far larger than the sensitivity coefficients of any other meteorological factor. After 1982, its influence declined sharply, leading to RH and RN being alternately the most sensitive meteorological factor, ET0 was not sensitive to U. The magnitudes and trends of the sensitivity coefficients were closely related to variations of the meteorological factors and the structure of the ET0 partial differential equation incorporating these meteorological factors. The sensitivity factors varied over all time scales, although they fluctuated more obviously on shorter time scales.
At present, research on the contribution of meteorological factors to changes in ET0 remains scarce. Zhao et al. [45] found that the VPD contributed greatly to the annual ET0 change. Conversely, Huan et al. [37] reported that the wind speed was the major contributor to ET0 change. On a monthly scale, Kang et al. [36] found that T, U and RH contributed the most to monthly ET0 change; only T contributed to the change of ET0 in winter and spring, while wind speed and humidity influenced ET0 in summer and on an annual scale. Yin et al. [41] found that U and sunshine hours were the main meteorological factors controlling changes in ET0 in China, with minor contributions from RH and T. However, most research focuses only on certain time scales and does not consider the response of meteorological factors to ET0 changes at different time scales. Meanwhile, the quantitative analysis of the impact of meteorological factors on ET0 changes is imperfect in Beijing under different time perspectives.
In this study, we found that the contributions of the four meteorological factors on different time scales to the ET0 change reflected the magnitude of their sensitivity coefficients and their relative rates of change. On daily scales, the contributions of T and U at the start and end of the day were larger than those of RN and RH in the middle of the day. On monthly scales, the rate of ET0 change in December and January was 0.24 and −0.40 mm/10a, respectively. The U sensitivity coefficient in these 2 months was second only to the RH sensitivity coefficient, while the relative U change rate was second only to the relative T change rate, which resulted in U contributing most to ET0 change in these months. In February and April, ET0 increased at 0.82 and 1.67 mm/10a, respectively. T contributed most to the ET0 changes in these months because of its relatively high change rate in February and large sensitivity coefficient in April. In March, May, August, October and November, RH contributed the most to ET0 change. The value of the RH sensitivity coefficient and the relative change rates of ET0 were high, with rates of 2.83, 0.91, 1.86, 0.76 and 0.20 mm/10a in these months. In June, July and September, ET0 changed at rates of −2.08, 0.31 and 0.65 mm/10a, respectively. RN contributed greatly to ET0 change in these months, linked to a large RN sensitivity coefficient and a relatively high change rate. On seasonal scales, the contribution of RH was the largest in spring and autumn, RN in summer, and U and T in winter. In spring and autumn, although the RH sensitivity coefficients were lower than the RN sensitivity coefficients, its relative rates of change were higher. This led RH to become the main contributing factor to ET0 change in spring and autumn. In summer, the RN sensitivity coefficient was much larger than all other factors, making it the main contributing factor to ET0 change in this season. In winter, although the T and U sensitivity coefficients were small, their relative change rates were high, so their contributions to ET0 change were the greatest. Thus, the rise in ET0 in Beijing has been caused mainly by the decrease in RH and increase in T over the long term. Concurrently, the decrease in U and RN hinders further rise in ET0 in Beijing, with RN being the most inhibitory in summer.
A limitation of this research is that the application of contribution rate analysis method was only done for Beijing; therefore, the scale should be expanded in future work. Additionally, Gong et al. [27] noted that the ET0 response to climate change will differ by region and season because of the large spatiotemporal variability of the sensitivity coefficients. The characteristics of the relative change rate of meteorological factors are also closely related to the spatiotemporal scale, which leads to variability in the main ET0 control factors on different time scales. Thus, an important focus area for research will be analyzing the contribution of meteorological factors to changes in ET0 on larger spatial scales and different temporal scales.

4. Conclusions

In this paper, we qualitatively characterize the sensitivity factors to ET0 under different time perspectives, also quantitatively analysis of the impact of meteorological factors on ET0 changes by combining sensitivity coefficient with the factor’s relative change rate over multiple time scales in Beijing. On the one hand, determining the main control factors of changes in ET0 will provide a theoretical basis for water resources regulation, irrigation system design and crop water management in Beijing, on the other hand, exploring the temporal variability of ET0 response factors is of great significance for understanding regional climate change. The main conclusions are as follows:
(1)
Over the last 60 years, RH, U and RN values have all declined, and only T has continued to rise. The rise in T and decline in RH are the main reasons underlying the ET0 increase. However, the decline in U and RN hinder further increases of ET0 in Beijing, with RN being the most inhibitory in summer. Determining the main control factors of ET0 change on different time scales will provide a theoretical basis for water resources regulation, irrigation system design and crop water management in Beijing.
(2)
The variations of sensitivity coefficients of the four meteorological factors over different time scales has resulted in variation in the main sensitivity factor affecting ET0. Over the course of 1 year, the sensitivity coefficients of four meteorological factors fluctuated greatly, with RH and RN being alternately the most sensitive factor. Between 1958 and 1979, RH was the most sensitive factor, but it has since become RN.
(3)
The contributions of the four meteorological factors to ET0 varied on different time scales, reflecting their annual fluctuations. The contributions of T and U were large at the start and the end of the year, while the contributions of RH and RN were dominant mid-year. On interannual scales, the main contributing factors were RH and T.
(4)
A limitation of this research is that the application of contribution rate analysis method was only done for Beijing, also, the ET0 response to climate change will differ by region and season because of the large spatiotemporal variability of the sensitivity coefficients and relative change rate. Thus, an important focus area for research will be analyzing the contribution of meteorological factors to changes in ET0 on larger spatial scales and different temporal scales. Meanwhile, it is worth noting that the applicability of the contribution rate method in different climate zones still needs to be discussed.

Author Contributions

Conceptualization, W.L. and B.Z.; methodology, W.L.; formal analysis, W.L. and B.Z.; data curation, B.Z. and S.H.; writing—original draft preparation, W.L. and B.Z.; writing—review and editing, W.L., B.Z. and S.H.; supervision, B.Z. and S.H.; project administration, B.Z.; funding acquisition, B.Z. All authors have read and agreed to the published version of the manuscript.

Funding

This research was funded by National Natural Science Foundation of China, grant number No. 51822907 and 51979287; China Institute of Water Resources and Hydropower Research Fund, grant number ID0145B742017 and ID0145B492017. The APC was funded by Baozhong Zhang.

Acknowledgments

This research is supported by the National Natural Science Foundation of China (No. 51822907 and 51979287), and the China Institute of Water Resources and Hydropower Research Fund (ID0145B742017 and ID0145B492017). We thank Liwen Bianji, Edanz Editing China (www.liwenbianji.cn/ac), for editing the English text of a draft of this manuscript.

Conflicts of Interest

The authors declare no conflict of interest.

References

  1. Han, S.J.; Zhang, B.Z. Advances of evapotranspiration research based on the Penman approach and complementary principle. J. Hydraul. Eng. 2018, 49, 1158–1168. [Google Scholar]
  2. Jung, M.; Reichstein, M.; Ciais, P.; Seneviratne, S.I.; Sheffield, J.; Goulden, M.L.; Bonan, G.; Cescatti, A.; Chen, J.Q.; De, J.R.; et al. Recent decline in the global land evapotranspiration trend due to limited moisture supply. Nature 2010, 467, 951–954. [Google Scholar] [CrossRef] [PubMed]
  3. Allen, R.G.; Pereira, L.S.; Raes, D.; Smith, M. Crop Evapotranspiration-Guidelines for Computing Crop Water Requirements; FAO: Rome, Italy, 1998. [Google Scholar]
  4. Penman, H.L. Natural evaporation from open water, bare soil and grass. Proc. R. Soc. Lond. 1948, A193, 120–146. [Google Scholar]
  5. Blaney, H.F.; Criddle, W.D. Determining Water Requirements in Irrigated Area from Climatological Irrigation Data; Techical Paper No 1998; US Department of Agriculture, Soil Conservation Service: Washington, DC, USA, 1950; Volume 96, p. 48.
  6. Taikan, O.; Shinjiro, K. Global hydrological cycles and world water resources. Science 2006, 313, 1068–1072. [Google Scholar]
  7. Xu, Z.X.; Li, J.Y. A distributed approach for estimating basin evapotranspiration: Comparison of the combination equation and the complementary relationship approaches. Hydrol. Process 2003, 17, 1509–1523. [Google Scholar] [CrossRef]
  8. Xu, C.-Y.; Singh, V.P. Evaluation of three complementary relationship evapotranspiration models by water balance approach to estimate actual regional evapotranspiration in different climatic regions. J. Hydrol. 2005, 308, 105–121. [Google Scholar] [CrossRef]
  9. Zhang, B.Z.; Xu, D.; Liu, Y.; Chen, H. Review of multi-scale evapotranspiration estimation and spatio-temporal scale expansion. Trans. Chin. Soc. Agric. Eng. (Trans. CSAE) 2015, 31, 8–16. [Google Scholar]
  10. Vörösmarty, C.J.; Green, P.; Salisbury, J.; Lammers, R.B. Global water resources: Vulnerability from climate change and population growth. Science 2000, 289, 284–288. [Google Scholar] [CrossRef] [Green Version]
  11. Pan, S.F.; Tian, H.Q.; Dangal, S.R.S.; Yang, Q.C.; Yang, J.; Lu, C.Q.; Tao, B.; Ren, W.; Ouyang, Z.Y. Response of global terrestrial evapotranspiration to climate change and increasing atmospheric CO2 in the 21st century. Earth’s Future 2015, 3, 15–35. [Google Scholar] [CrossRef]
  12. Shukla, J.; Mintz, Y. Influence of land-surface evapotranspiration on the earth’s climate. Science 1982, 215, 1498–1501. [Google Scholar] [CrossRef]
  13. Haskett, J.D.; Pachepsky, Y.A.; Acock, B. Effect of climate and atmospheric change on soybean water stress: A study of Iowa. Ecol. Model. 2000, 135, 277. [Google Scholar] [CrossRef]
  14. Zuo, D.P.; Xu, Z.X.; Yang, H. Spatiotemporal variations and abrupt changes of potential evapotranspiration and its sensitivity to key meteorological variables in the Wei River basin, China. Hydrol. Process. 2012, 26, 1149–1160. [Google Scholar] [CrossRef]
  15. Han, S.J.; Hu, H.P. Spatial variations and temporal changes in potential evaporation in the Tarim Basin, northwest China (1960-2006): Influenced by irrigation? Hydrol. Process. 2012, 26, 3041–3051. [Google Scholar] [CrossRef]
  16. Huang, H.P.; Cao, M.M.; Song, J.X.; Han, Y.P.; Chen, S.S. Temporal and spatial changes of potential evapotranspiration and its influencing factors in China from 1957 to 2012. J. Nat. Resour. 2015, 30, 315–326. [Google Scholar]
  17. Liu, C.M.; Zhang, D. Temporal and spatial change analysis of the sensitivity of potential evapotranspiration to meteorological influencing factors in China. J. Geogr. Sci. 2011, 66, 579–588. [Google Scholar]
  18. Li, Y.Z.; Liang, K.; Bai, P.; Feng, A.Q.; Liu, L.F.; Dong, G.T. The spatiotemporal variation of reference evapotranspiration and the contribution of its climatic factors in the Loess Plateau, China. Environ. Earth Sci. 2016, 75, 1–14. [Google Scholar] [CrossRef]
  19. Ni, G.H.; Li, X.H.; Cong, Z.T.; Sun, F.B.; Liu, Y. Temporal and spatial characteristics of reference evapotranspiration in China. J. Agric. Eng. 2006, 22, 1–4. [Google Scholar]
  20. Thomas, A. Spatial and temporal characteristics of potential evapotranspiration trends over China. Int. J. Climatol. 2015, 20, 381–396. [Google Scholar] [CrossRef]
  21. Yang, H.B.; Yang, D.W. Climatic factors influencing changing pan evaporation across China from 1961 to 2001. J. Hydrol. 2012, 414–415, 183–193. [Google Scholar] [CrossRef]
  22. Guo, D.L.; Westra, S.; Maier, H.R. Sensitivity of potential evapotranspiration to changes in climate variables for different Australian climatic zones. Hydrol. Earth Syst. Sci. 2017, 21, 2107–2126. [Google Scholar] [CrossRef] [Green Version]
  23. Liang, L.Q.; Li, L.J.; Zhang, L.; Li, J.Y.; Jang, D.J.; Xu, M.X.; Song, W.X. Sensitivity of the reference crop evapotranspiration in growing season in the West Songnen Plain. J. Agric. Eng. 2008, 18, 340–347. [Google Scholar]
  24. Yang, L.S.; Li, C.B.; Wang, S.B. Sensitive analysis of potential evapotranspiration to key climatic factors in Taohe River Basin. Trans. Chin. Soc. Agric. Eng. 2014, 30, 102–109. [Google Scholar]
  25. McCuen, R.H. A sensitivity analysis of procedures used for estimating evaporation. Water Resour. Bull. 1974, 10, 486–497. [Google Scholar] [CrossRef]
  26. Beven, K. A sensitivity analysis of the Penman-Monteith actual evapotranspiration estimates. J. Hydrol. 1979, 44, 190. [Google Scholar] [CrossRef]
  27. Gong, L.B.; Xu, C.Y.; Chen, D.L.; Halldin, S.; Chen, Y.D. Sensitivity of the Penman-Monteith reference evapotranspiration to key climatic variables in the Changjiang (Yangtze River) basin. J. Hydrol. 2012, 329, 620–629. [Google Scholar] [CrossRef]
  28. Saxton, K.E. Sensitivity analyses of the combination evapotranspiration equation. Agric. Meteorol. 1975, 15, 343–353. [Google Scholar] [CrossRef]
  29. Ren, J.L.; Li, Q.F.; Yu, M.X.; Li, H.Y. Variation trends of meteorological variables and their impacts on potential evaporation in Hailar region. Water Sci. Eng. 2012, 5, 137–144. [Google Scholar]
  30. Sergio, M.; Vicente, S.; Cesar, A.M.; Arturo, S.L.; Arturo SLJesús, R.; Enrique, M.T.; Juan, I.L.M.; Francisco, E. Sensitivity of reference evapotranspiration to changes in meteorological parameters in Spain (1961–2011). Water Resour. Res. 2014, 50, 8458–8480. [Google Scholar]
  31. Sharifi, A.; Dinpashoh, Y. Sensitivity analysis of the Penman-Monteith reference crop evapotranspiration to climatic variables in Iran. Water Resour. Manag. 2014, 28, 5465–5476. [Google Scholar] [CrossRef]
  32. Yang, Y.G.; Cui, N.B.; Hu, X.T.; Gong, D.Z. Spatio-Temporal variability and cause analysis of reference crop evapotranspiration in the main grain producing areas of China. Chin. Agric. Meteorol. 2018, 39, 245–255. [Google Scholar]
  33. Zhao, J.; Xu, Z.X.; Zuo, D.P.; Wang, X.M. Temporal variations of reference evapotranspiration and its sensitivity to meteorological factors in Heihe River Basin, China. Water Sci. Eng. 2015, 8, 1–8. [Google Scholar] [CrossRef] [Green Version]
  34. Gao, G.; Chen, D.L.; Ren, G.Y.; Chen, Y. Spatial and temporal variations and controlling factors of potential evapotranspiration in China: 1956–2000. J. Geogr. Sci. 2006, 16, 3–12. [Google Scholar] [CrossRef]
  35. Ma, N.; Wang, N.A.; Wang, P.L.; Sun, Y.M.; Dong, C.Y. Temporal and spatial variation characteristics and quantification of the affect factors for reference evapotranspiration in Heihe River Basin. J. Nat. Resour. 2012, 27, 975–989. [Google Scholar]
  36. Kang, N.J.; Batur, B.; Luo, N.N.; Xue, Y.R.; Wang, M.H. Spatio-Temporal variation and influencing factors of reference crop evapotranspiration at different time scales in Altay region. Chin. Agric. Meteorol. 2018, 39, 502–511. [Google Scholar]
  37. Huan, H.J.; Yang, Z.Q.; Liu, Y.; Xia, F.H. Temporal and spatial variation of reference crop evapotranspiration and contribution of main factors in the middle area of Shandong province. Chin. Agric. Meteorol. 2015, 36, 692–698. [Google Scholar]
  38. Zou, H.P.; Chen, H.L.; Tian, G.H.; Chen, X.M.; Bai, R.; Tong, J.H. Spatiotemporal change characteristics and causes analysis of reference crop evapotranspiration in Hainan Island. Chin. Agric. Meteorol. 2018, 39, 18–26. [Google Scholar]
  39. Liu, C.; Zhang, X.; Zhang, Y. Determination of daily evaporation and evapotranspiration of winter wheat and maize by large-scale weighing lysimeter and micro-lysimeter. Agric. For. Meteorol. 2002, 111, 109–120. [Google Scholar] [CrossRef]
  40. Zhang, X.; Chen, S.; Sun, H.; Shao, L.; Wang, Y. Changes in evapotranspiration over irrigated winter wheat and maize in North China Plain over three decades. Agric. Water Manag. 2011, 98, 1097–1104. [Google Scholar] [CrossRef]
  41. Yin, Y.H.; Wu, S.H.; Dai, E.F. Determining factors in potential evapotranspiration changes over China in the period 1971–2008. Chin. Sci. Bull. 2010, 55, 3329–3337. [Google Scholar] [CrossRef]
  42. Yin, Y.H.; Wu, S.H.; Chen, G.; Dai, E.F. Attribution analyses of potential evapotranspiration changes in China since the 1960s. Theor. Appl. Climatol. 2010, 101, 19–28. [Google Scholar] [CrossRef]
  43. Liu, H.J.; Li, Y.; Josef, T. Quantitative estimation of climate change effects on potential evapotranspiration in Beijing during 1951–2010. Sci. Press 2014, 24, 93–112. [Google Scholar] [CrossRef]
  44. Liu, S.Y.; Wang, H.X.; Wang, Y.Y.; Ye, W. Variation characteristic analysis of time series of potential evapotranspiration in Beijing. South-to-North Water Transf. Water Sci. Technol. 2013, 11, 13–16. [Google Scholar]
  45. Zhao, L.L.; Xia, J.; Wang, Z.G.; Li, Z.L. The Inter-Intra annual climatic pattern of potential evaporation in Beijing and attribution. J. Nat. Resour. 2013, 28, 1911–1921. [Google Scholar]
  46. Suat, I.; José, O.P.; Derrel, L.M.; Ayse, I.; Terry, A.H. Sensitivity analyses and sensitivity coefficients of standardized daily ASCE-Penman-Monteith equation. J. Irrig. Drain. Eng. 2006, 24, 564–578. [Google Scholar]
  47. Hupet, F.; Vanclooster, M. Effect of the sampling frequency of meteorological variables on the estimation of the reference evapotranspiration. J. Hydrol. 2001, 243, 192–204. [Google Scholar] [CrossRef]
  48. Liu, X.M.; Zheng, H.X.; Liu, C.M.; Cao, Y.J. Sensitivity of the potential evapotranspiration to key climatic variables in the Haihe River Basin. Resour. Sci. 2009, 31, 1470–1476. [Google Scholar]
Figure 1. Study area and location of the Beijing region in China.
Water 12 02263 g001
Figure 2. Annual variations in meteorological factors and potential evapotranspiration (ET0) based on multiannual averages. The δ means standard deviations, illustrating annual variability of meteorological parameters. A higher standard deviation indicates meteorological factor values are more dispersed, while a lower value indicates more concentrated.
Water 12 02263 g002aWater 12 02263 g002bWater 12 02263 g002c
Figure 3. Interannual variations of meteorological factors and reference evapotranspiration (ET0). (* indicates significance level of 0.05). ((ae) represent the interannual variations of T, RH, U, RN and ET0, respectively)
Water 12 02263 g003
Figure 4. Variations in the annual average daily sensitivity coefficients of the four meteorological factors.
Water 12 02263 g004
Figure 5. Interannual variations in the sensitivity coefficients of the four meteorological factors. (* indicates significance level of 0.05). ((ad) represent the interannual variations in the sensitivity coefficients of T, RH, U and RN, respectively)
Water 12 02263 g005aWater 12 02263 g005b
Figure 6. Contributions of the four meteorological factors on daily scales to changes in reference evapotranspiration (ET0). GRN, GT, GRH and GU are the average contributions of net radiation, temperature, relative humidity and wind speed, respectively.
Water 12 02263 g006
Table 1. Change rates and sensitivity coefficients of the four meteorological factors on monthly and seasonal scales.
Time ScaleMeteorological Trend RateSensitivity Coefficient (%)Sensitive Factor
TrendT
(°C/10a)
TrendRH
(%/10a)
TrendU
(m/s)/10a
TrendRN
((MJ/m2)/d/10a)
TrendET0
(mm/10a)
STSRHSUSRN
Jan0.430.40−0.13−0.01−0.4020.2−63.149.620.7RH
Feb0.58−1.20−0.09−0.060.829.2−55.236.534.5
Mar0.65−2.90−0.07−0.112.8325.0−47.428.544.1
Apr0.49−1.50−0.09−0.081.6745.9−42.225.551.2RN
May0.37−1.30−0.04−0.210.9151.3−40.221.360.7
Jun0.23−0.60−0.01−0.42−2.0850.0−45.216.469.9
Jul0.31−2.200.05−0.350.3146.8−55.69.479.8
Aug0.40−2.500.08−0.221.8645.8−56.28.481.3
Sept0.44−1.700.02−0.240.6546.7−61.116.370.6
Oct0.38−1.70−0.02−0.140.7640.7−75.028.055.0RH
Nov0.27−1.50−0.09−0.040.2019.5−92.145.630.6
Dec0.39−0.90−0.09−0.030.249.3−81.455.216.6
Spring0.50−1.90−0.07−0.140.09 44.4 −42.924.652.5RN
Summer0.32−1.800.04−0.331.6247.6−52.811.576.9
Autumn0.36−1.70−0.03−0.14−0.0240.2−74.427.454.8RH
Winter0.47−0.50−0.10−0.067.7710.9−64.347.024.1
Annual mean0.41−1.47−0.04−0.160.7734.2−59.628.451.3RH
Table 2. Contributions of the four meteorological factors to reference evapotranspiration (ET0) on monthly and seasonal scales.
Time ScaleContribution of Meteorological Elements on ET0 (mm)ΔET0 (mm)Main Control Factor
GTGRHGUGRNGsum
Jan4.38−1.03−6.16−0.22−3.04−2.41 U
Feb7.383.36−4.02−1.265.464.93 T
Mar12.0513.92−4.00−3.1118.8616.96 RH
Apr11.1710.06−7.15−2.9311.159.99 T
May8.469.62−3.51−9.375.195.46 RH
Jun4.273.87−0.57−19.93−12.36−12.45 RN
Jul4.5513.562.76−18.332.541.84 RN
Aug5.3513.623.97−11.0811.8611.16 RH
Sep5.778.821.54−10.615.523.93 RN
Oct4.517.96−1.21−5.385.894.57 RH
Nov2.635.58−5.24−1.211.761.19 RH
Dec3.912.74−4.66−0.651.361.43 U
Spring34.0836.51−15.28−14.8340.4732.41 RH
Summer14.6132.958.22−49.676.110.54 RN
Autumn13.6323.29−5.63−16.0215.279.70 RH
Winter15.524.53−15.36−3.770.913.95 TU
seasonal mean19.4624.32−7.01−21.0715.6911.65 RH

