Article

New Method for Estimating Roughness Coefficient for Debris Flows

1
College of Geological Engineering and Surveying of Chang’an University, Key Laboratory of Western China, Mineral Resources and Geological Engineering, Xi’an 710054, China
2
College of Water and Environment of Chang’an University, Xi’an 710054, China
*
Author to whom correspondence should be addressed.
Water 2020, 12(9), 2341; https://doi.org/10.3390/w12092341
Submission received: 20 July 2020 / Revised: 9 August 2020 / Accepted: 17 August 2020 / Published: 20 August 2020
(This article belongs to the Section Water Erosion and Sediment Transport)

Abstract

:
Flow resistance is a fundamental control of flow hydraulics in streams and rivers. In this paper, five dimensionless factors affecting the Manning roughness coefficient n and attributed to the external roughness coefficient n1 and the internal roughness coefficient n2 were analyzed comprehensively. And then, dimensionless factors affecting n1 and n2 with precise physical meanings were proposed. With a calculation method for roughness coefficient fitted and analyzed based on observation data from published research papers, the analysis results showed that the external resistance coefficient is closely related to the dimensionless factor D84/R. The correlation between the dimensionless factor (D16/D50) and the internal roughness coefficient n2 was not significant. While the factors H/D50, J, and Sv showed significant correlation. In addition, the expression of external roughness n1 is calibrated based on the observation data of 102 cross-sections listed in previous works, while the internal roughness n2 is calibrated by 20 experimental model tests. Finally, an equation describing the Manning’s roughness coefficient is presented and verified based on 24 groups of observation data from Dongchuan Debris Flow Observation Station (DDFORS) in China. This study is contributing toward a comprehensive model for the Manning coefficient, which provide a scientific reference for the research on disaster prevention and mitigation of debris flow.

1. Introduction

Flow resistance is a fundamental control of flow hydraulics in streams and rivers [1], not only determining the amount of water a channel can convey through its influence on velocity (and thus flow depth), but also controlling the distribution of shear stress around the channel boundary and the magnitude and distribution of bed and bank erosion [2]. Therefore, a thorough understanding of flow resistance is necessary to improve natural hazard prevention and mitigation. Three well-known relationships link velocity and flow resistance:
Q = 1 n R 2 / 3 J 1 / 2 A = ( 8 g R J f ) 1 / 2 A = C R J 1 / 2 A
Here, Q is the flow discharge (m3/s), A is the cross-sectional area (m2) of the channel, n is the Manning resistance coefficient, R is the hydraulic radius (m), J is the friction slope (often approximated using water surface slope or channel slope), g is acceleration due to gravity, f is the Darcy-Weibach resistance coefficient, and C is the Chezy’s resistance coefficient. Therefore, the relationship between the three resistance coefficients can be written as [3].
8 g f = C = n 1 R 1 / 6
Of the three resistance coefficients, the most commonly used is the Manning equation [4,5,6,7]. Since flow resistance results from forces that act on and within a flow to resist motion [8], scholars have conducted a significant amount of research on flow resistance. Rouse [9] studied large-scale roughness conditions and found that stream flow is affected by skin friction, drag resistance, wave resistance, and local acceleration. Hey [10] analyzed the influence of gravel-bed channels on flow resistance by considering the effects of cross-sectional shape and sediment distribution based on field and model test data. Bathurst [11] pointed out that flow resistance is a function of the ratio between hydraulic radius and D84, the aspect ratio (defined as section width divided by depth), and the rock basal concentration. Rickenmann [12,13] found that Manning’s resistance coefficient is a function of flow rate, slope, and the characteristic grain size of the channel bed.
A debris flow, which is fundamentally different from flood in Figure 1a, always transforms from a saturated landslide or forms through the erosion of loose slope material due to surface runoff [14,15]. Compared with an open channel flow of pure water, where the resistance behavior is mainly attributed to boundary turbulent shear stresses and the mechanisms of momentum transport and energy dissipation are essentially universal, the resistance behavior of a debris flow depends on the relative importance of the shear stresses arising from boundary resistance and internal resistance in Figure 1b. As is well known, Manning’s resistance coefficient n is not physically based, and its fundamental weakness in use is that the physical mechanisms involved in the frictional energy dissipation of mud/debris flows are significantly different from those associated with turbulent pure water flows for which Manning’s equation is well established [16]. Notwithstanding this limitation, Manning’s n technique is still useful for its simplicity.
Manning’s coefficient can be used in any dynamic routing model with suitable modification. For example, Kang et al. [19] found that the Manning roughness coefficient possessed a good correlation with the flow depth, and presented an empirical equation to predict the Manning roughness coefficient based on monitored data from debris flows in the Jiangjia Gully of China, written as:
n = 0.035 H 0.34
Fei [20] revealed an empirical relationship between the Manning resistance coefficient of debris flow sand material composition, flow depth, and channel slope based on field data from southwestern China:
1 n = 1.62 [ S v ( 1 S v ) H J D 10 ] 2 3
Here, Sv is the solid volume concentration of the debris flow, J is the hydraulic gradient, D10 is the characteristic grain size for which 10% of the bed material is finer in diameter (m), and H is the flow depth (m). For debris flow channels that lack monitoring data, Qian et al. [21] presented a generic table from which the Manning roughness coefficient could be determined according to specific channel characteristics. However, this method lacks theoretical basis and the resulting coefficients are more subjective.
In this paper, all of the factors affecting the Manning roughness coefficient of debris flows are analyzed in detail. Based on these factors, a dimensionless equation of the Manning roughness coefficient, which divides the Manning roughness coefficient into two parts: external roughness and internal roughness, is constructed. Then, based on the observation data of 102 cross-sections listed in previous works, the expression of external roughness n1 is calibrated; meanwhile, the internal roughness n2 is calibrated by 20 experimental model tests. Finally, a mathematical expression of the roughness coefficient is proposed, and the expression is tested and corrected based on 24 groups of observation data from Dongchuan Jiangjiagou Debris Flow Observation Station in China. These research results provide a scientific reference for the research on disaster prevention and mitigation of debris flow.

2. Method for Estimating the Roughness Coefficient of Debris Flows

2.1. Factors Influencing the Manning Roughness Coefficient

Compared with the roughness coefficient of a natural river channel, the Manning roughness coefficient for a viscous debris flow must reflect the shape, roughness, hydraulic conditions, and internal energy dissipation of the debris flow. Cowan’s approach to this problem was to break the roughness estimate into six factors: sediment size, degree of surface irregularity, variation of channel cross section, effect of obstructions, vegetation, and degree of meandering [22]. These factors required the following variables: (1) turbulent shear stress due to channel boundary roughness; (2) the solid-liquid mixture’s viscous stress and yield stress; (3) the mixture’s dispersive stress due to sustained frictional contacts; and (4) the inelastic collisions of solid particles within the fluid mixture. Rouse [9] studied large-scale roughness conditions and found that the stream flow was affected by skin friction, drag resistance, wave resistance, and local acceleration. Hey [10] used both laboratory and field data to analyze the influence of gravel-bed channels on flow resistance that considered the effects of cross-sectional shape and sediment distribution. Analysis of the impact factors affecting the Manning roughness coefficient for debris flows indicates the importance of the following five aspects:
(1)
Roughness of the channel bed. The channel bed roughness is primarily determined by the particle size composition of the bed. Many scholars have tried to establish a relationship between the roughness coefficient and the representative particle size of the channel bed material [11,23,24,25,26]. The influence of particle size on roughness can be so great in some situations that many field techniques will use sediment size to estimate flow resistance [8,23,27,28,29]. A rougher bed surface provides a greater roughness coefficient. However, there are varying opinions in terms of the representative particle size to use, with the most commonly used representative particle sizes being D90, D84, and D50.
(2)
Cross section geometry. In general, a larger contact area between the debris flow and the channel boundary will result in a greater resistance to movement of the debris flow [30]. The wetted perimeter is typically used to reflect the size of the contact area between a fluid and the boundary, with a larger wetted perimeter creating more resistance. In addition, if an irregular section appears in a channel, or the cross-section changes locally, local head loss will occur that will also reflect an increase in roughness. Due to the randomness of an irregular cross section, the local head loss caused by debris flows through an irregular section is very complicated [1]. Therefore, it is easier to select a straight section of channel as much as possible when measuring the roughness coefficient of a debris flow.
(3)
Depth of debris flow. Du et al. [31] analyzed the effect of average depth on the roughness coefficient of a mud flow, while Fei et al. [20] also pointed out that the depth of debris flow is one of the main factors affecting the roughness coefficient [11,23,24,25].
(4)
Solid volume concentration of the debris flow. A debris flow is a special solid-liquid two-phase fluid [14,32] where the liquid phase is mainly a slurry mixed with water and fine particles and the solid phase is mainly large stones and gravel. During movement of a viscous debris flow there is a significant relative motion between the solid and liquid phases. In addition to the viscous resistance of the slurry, the internal resistance also includes the collision and frictional resistance between particles and the resistance generated by the relative motion between the solid and liquid phases [33,34,35]. Takahashi [36] pointed out that the internal resistance of a two-phase flow was dominated by particle collisions, while Iverson [37] believed that the friction between particles was more important. In general, the magnitude of the collision resistance and the frictional resistance are inextricably linked to the content of the solid particles of the debris flow.
(5)
Particle composition of solid materials in the debris flow. The gradation of solid phase particles is always wide in a debris flow, which makes the resistance characteristics very complicated. The fine particles increase the effective viscosity of the liquid slurry [38], which inhibits the fluid turbulence to a certain extent and thereby reduces energy loss during debris flow movement. In addition, the coarse particles in a debris flow will undergo forceful collisions with the raised sand bed at the boundary of the channel and thereby increase movement resistance.

2.2. The Roughness Coefficient of Debris Flows

By analyzing the five factors of debris flow roughness described above, we can see that the roughness includes friction loss at the channel boundary during movement of the debris flow, as well as energy dissipation inside the debris flow fluid [39,40].The channel bed surface and the sidewalls may hinder movement of a debris flow; this hindrance caused by the boundary conditions can be referred to as external resistance. The energy dissipation caused by the friction and collisions between particles distributed in the mudflow liquid slurry is the internal resistance of a debris flow [18]. It is the external resistance of a debris flow that is mainly determined by the channel roughness and the geometry of the cross section.
In this paper, the characteristic particle size D84 is used to reflect the roughness of the channel bed, where a larger D84 indicates a coarser bed surface and a resulting greater roughness coefficient. In fact, the choice of coarse characteristic particle size varies between researchers. However, a coarser-than average grain size percentile is usually chosen to account for the disproportionate effect generated by the protrusion of large grains into the flow. Several studies suggest that the most appropriate sediment length scale is D84 [8,10,29,41]. Therefore, we chosen D84 in this manuscript. The wetted perimeter χ is used to reflect the characteristics of the channel cross section. Under the same flow conditions, a larger wetted perimeter increases the external roughness.
Analysis of the factors affecting the internal roughness coefficient shows that the coefficient increases with increasing solid matter content S and that the flow velocity of a debris flow is closely related to the head loss during movement. However, it is difficult to predict debris flow velocity. Alternatively, the channel gradient J is closely related to the flow velocity [12,13], and so the channel gradient J is used in this work to reflect the dynamic characteristics of debris flows. In addition, the fine particle content has a significant influence on energy dissipation during debris flow movement, with more fine particles increasing the viscosity coefficient of a debris flow due to the liquid phase. The characteristic particle size D16 is used to reflect the relative size of fine particles. Several studies suggest to use D84 as the representative coarse particle size and D16 as the representative fine particle, as they gave slightly better results than others [10,29]. Therefore, we chosen D16 in this manuscript. Increasing the volume of fine particles in a debris flow also brings the debris flow closer to a laminar flow.
Given the above analysis, the roughness coefficient of a viscous debris flow n can be decomposed into two parts consisting of an external resistance n1 and an internal resistance n2, which can be written as:
n = n 1 + n 2 = f ( χ , D 84 ) + g ( h , S , D 16 , J )
In Equation (5), f and g are two implicit functions.

3. The External Resistance of a Debris Flow

3.1. Expression of External Roughness

It can be seen from the above analysis that the external roughness n1 increases with increasing wetted perimeter χ and increasing characteristic particle size of the sand material D84. Given the same wetted perimeter and D84, a larger cross-sectional flow area A increases the discharge capacity strength of the section. That is, the friction loss is relatively small per unit volume. According to the above analysis, the external roughness n1 can thus be written as a function of the dimensionless parameter D84/R:
n 1 = f ( χ D 84 A ) = f ( D 84 R )
where A is the area of the flow cross section, R is the hydraulic radius, and D84/R is a dimensionless parameter that characterizes the relative roughness of the bed surface. The reciprocal of the dimensional parameter D84/R is the “relative submergence”, a variable first proposed by Bathurst [11] to reflect the characteristics of alpine rivers.

3.2. Determine the Unknown Coefficient of the Expression

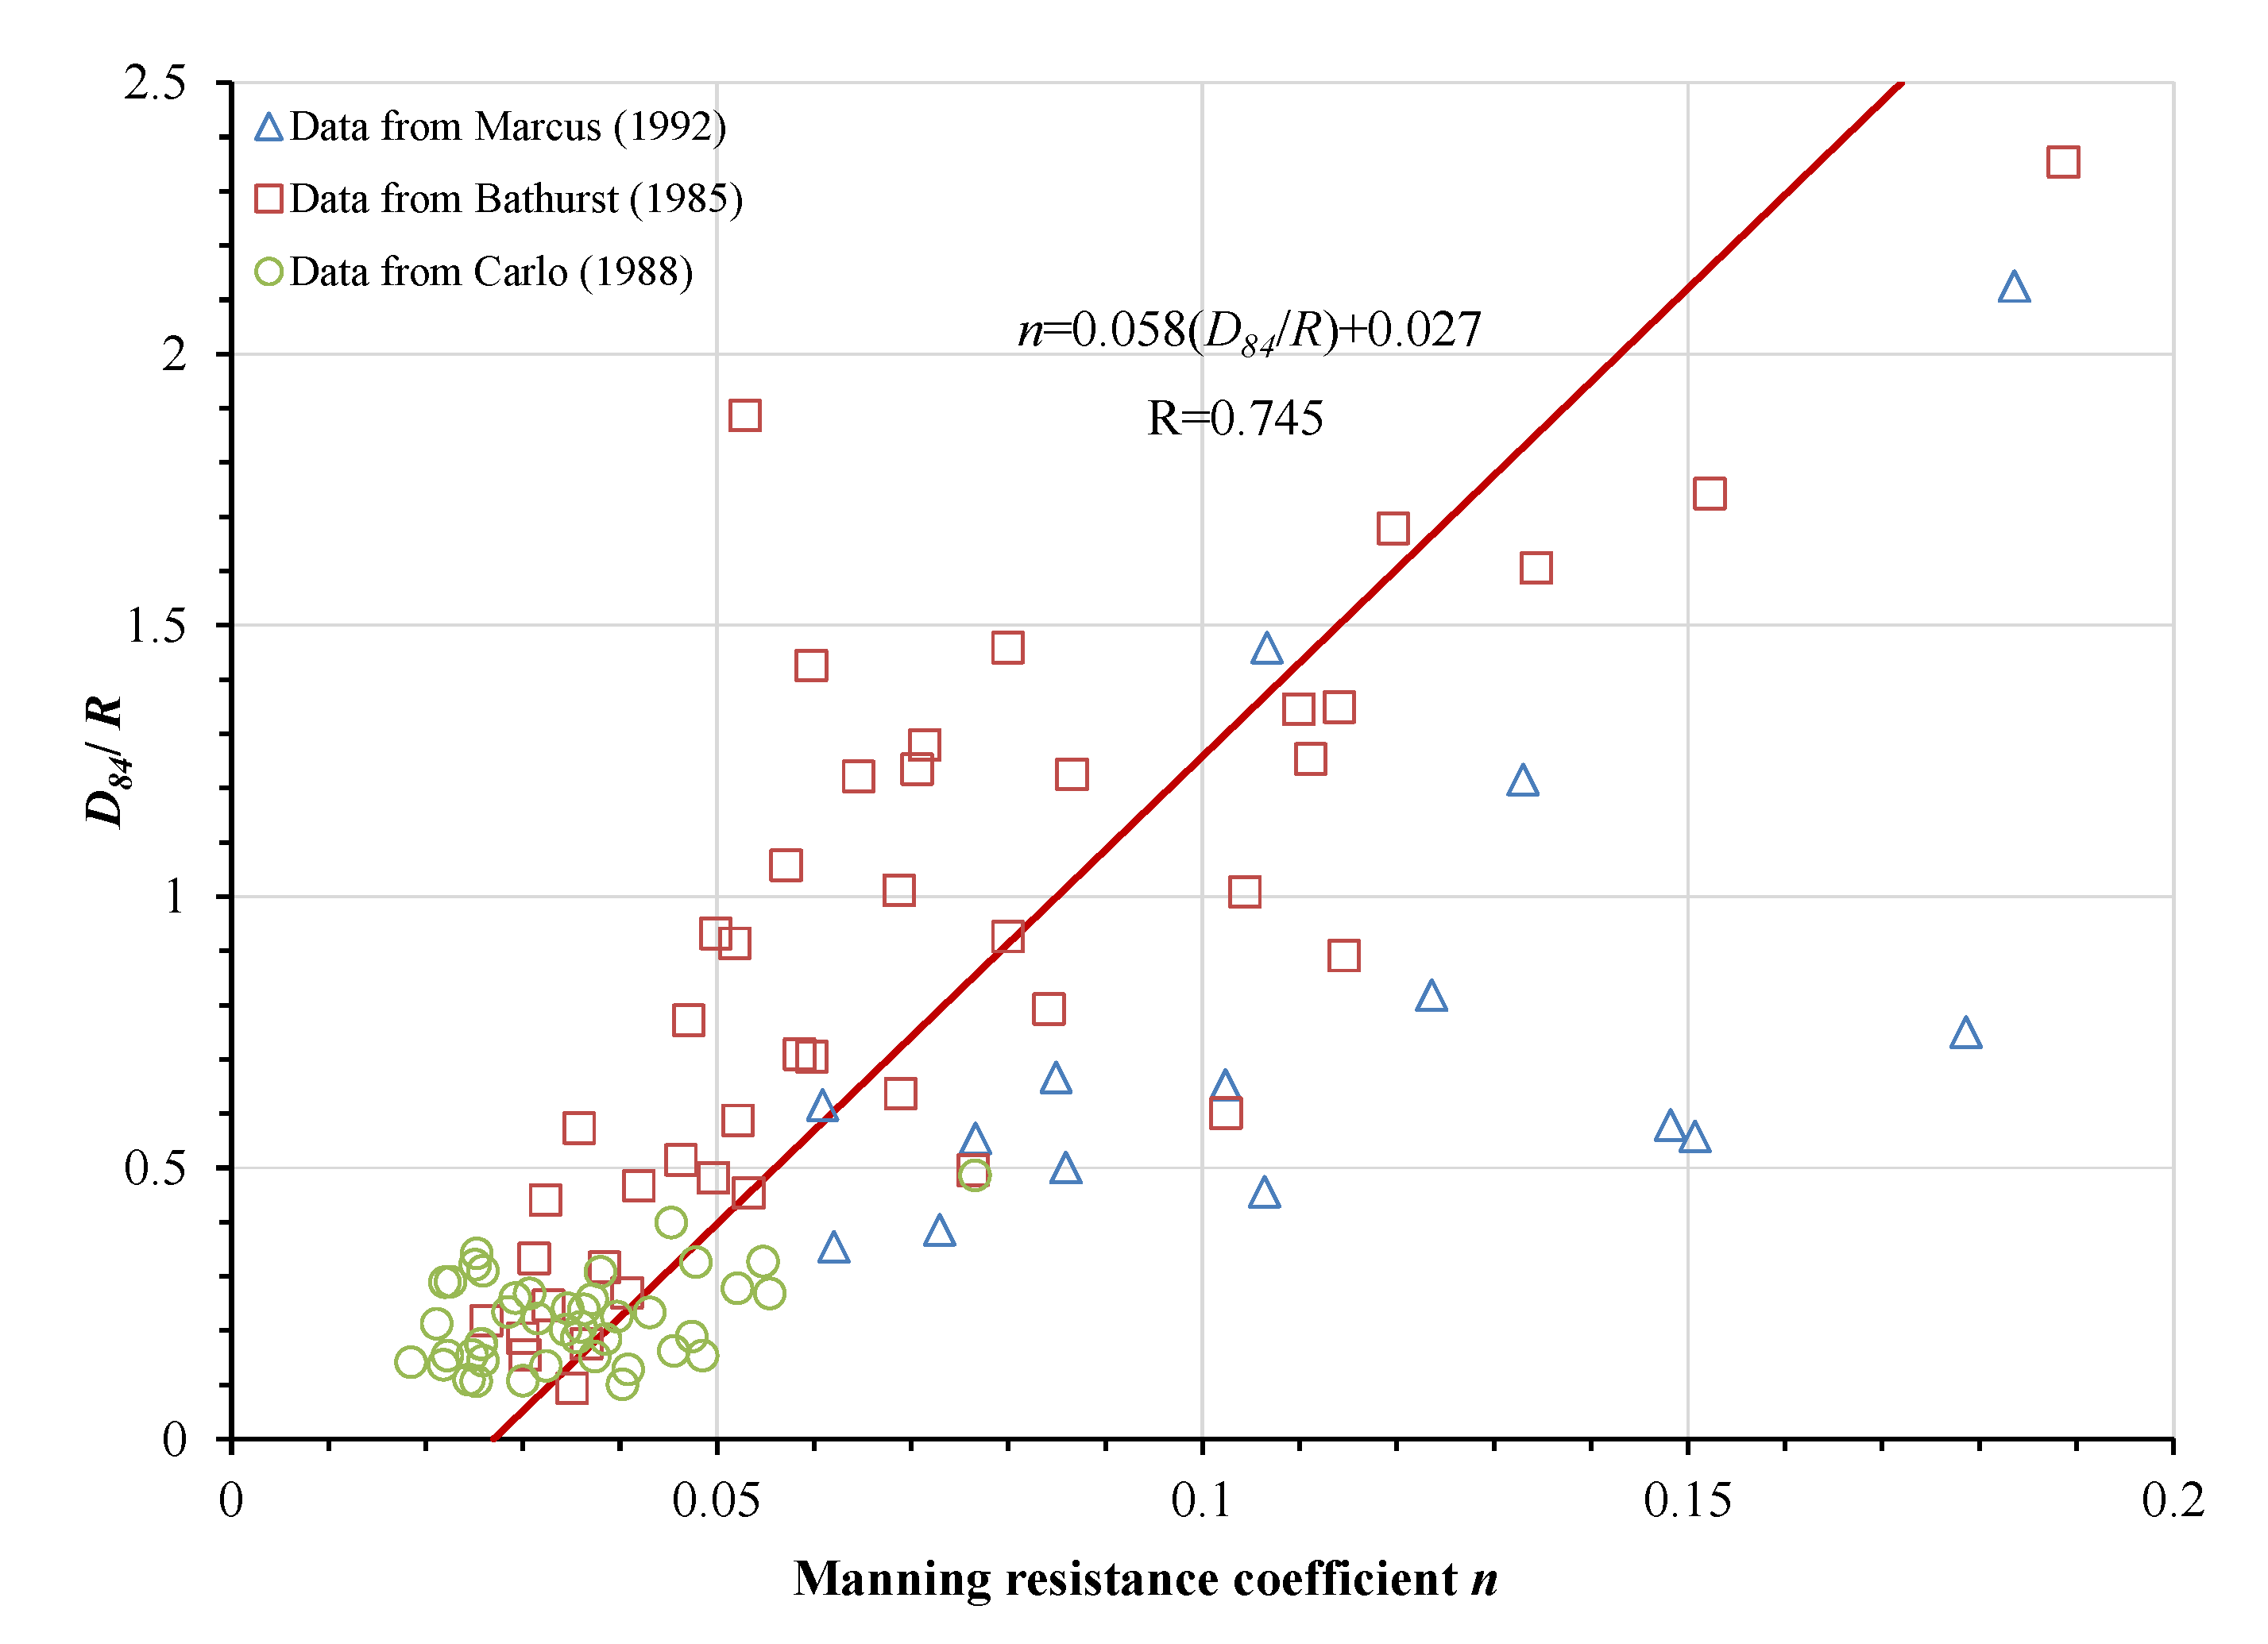
Many scholars have proposed different methods for calculating the roughness coefficient of mountain rivers based on the dimensionless factor R/D84 [10,11,23,24,25,29]. In this paper, the cross-section characteristics of 102 streams distributed through different mountain rivers and listed in previous works were collected. These cross sections include 15 in Ptarmigan Valley, Alaska [7], 44 sections in upland British rivers [11], and 43 sections in Calabria, Southern Italy [42]. The relationship between the Manning roughness coefficient and D84/R from these cross sections is shown in Figure 2. It can be seen from the figure that the two exhibit a good correlation with Pearson’s correlation coefficient is 0.745.
Given the good correlation between the Manning roughness coefficient and D84/R, the following function for the external roughness n1 can be constructed:
n 1 = f ( χ D 84 A ) = f ( D 84 R ) = k 1 ( D 84 R ) a
where k1 and α are two undetermined coefficients. Using the relevant data from the 102 mountain river sections compiled in this work to determine k1 and a, an empirical version of Equation (7) can be written as
n 1 = 0.083 ( D 84 R ) 0.55
which gives a correlation coefficient R = 0.84. Alternatively, Bathurst [11] proposed using a Darcy-Wiesbach coefficient, which fits a power law and is written as
( 8 f ) 1 / 2 = 3.84 ( d D 84 ) 0.547
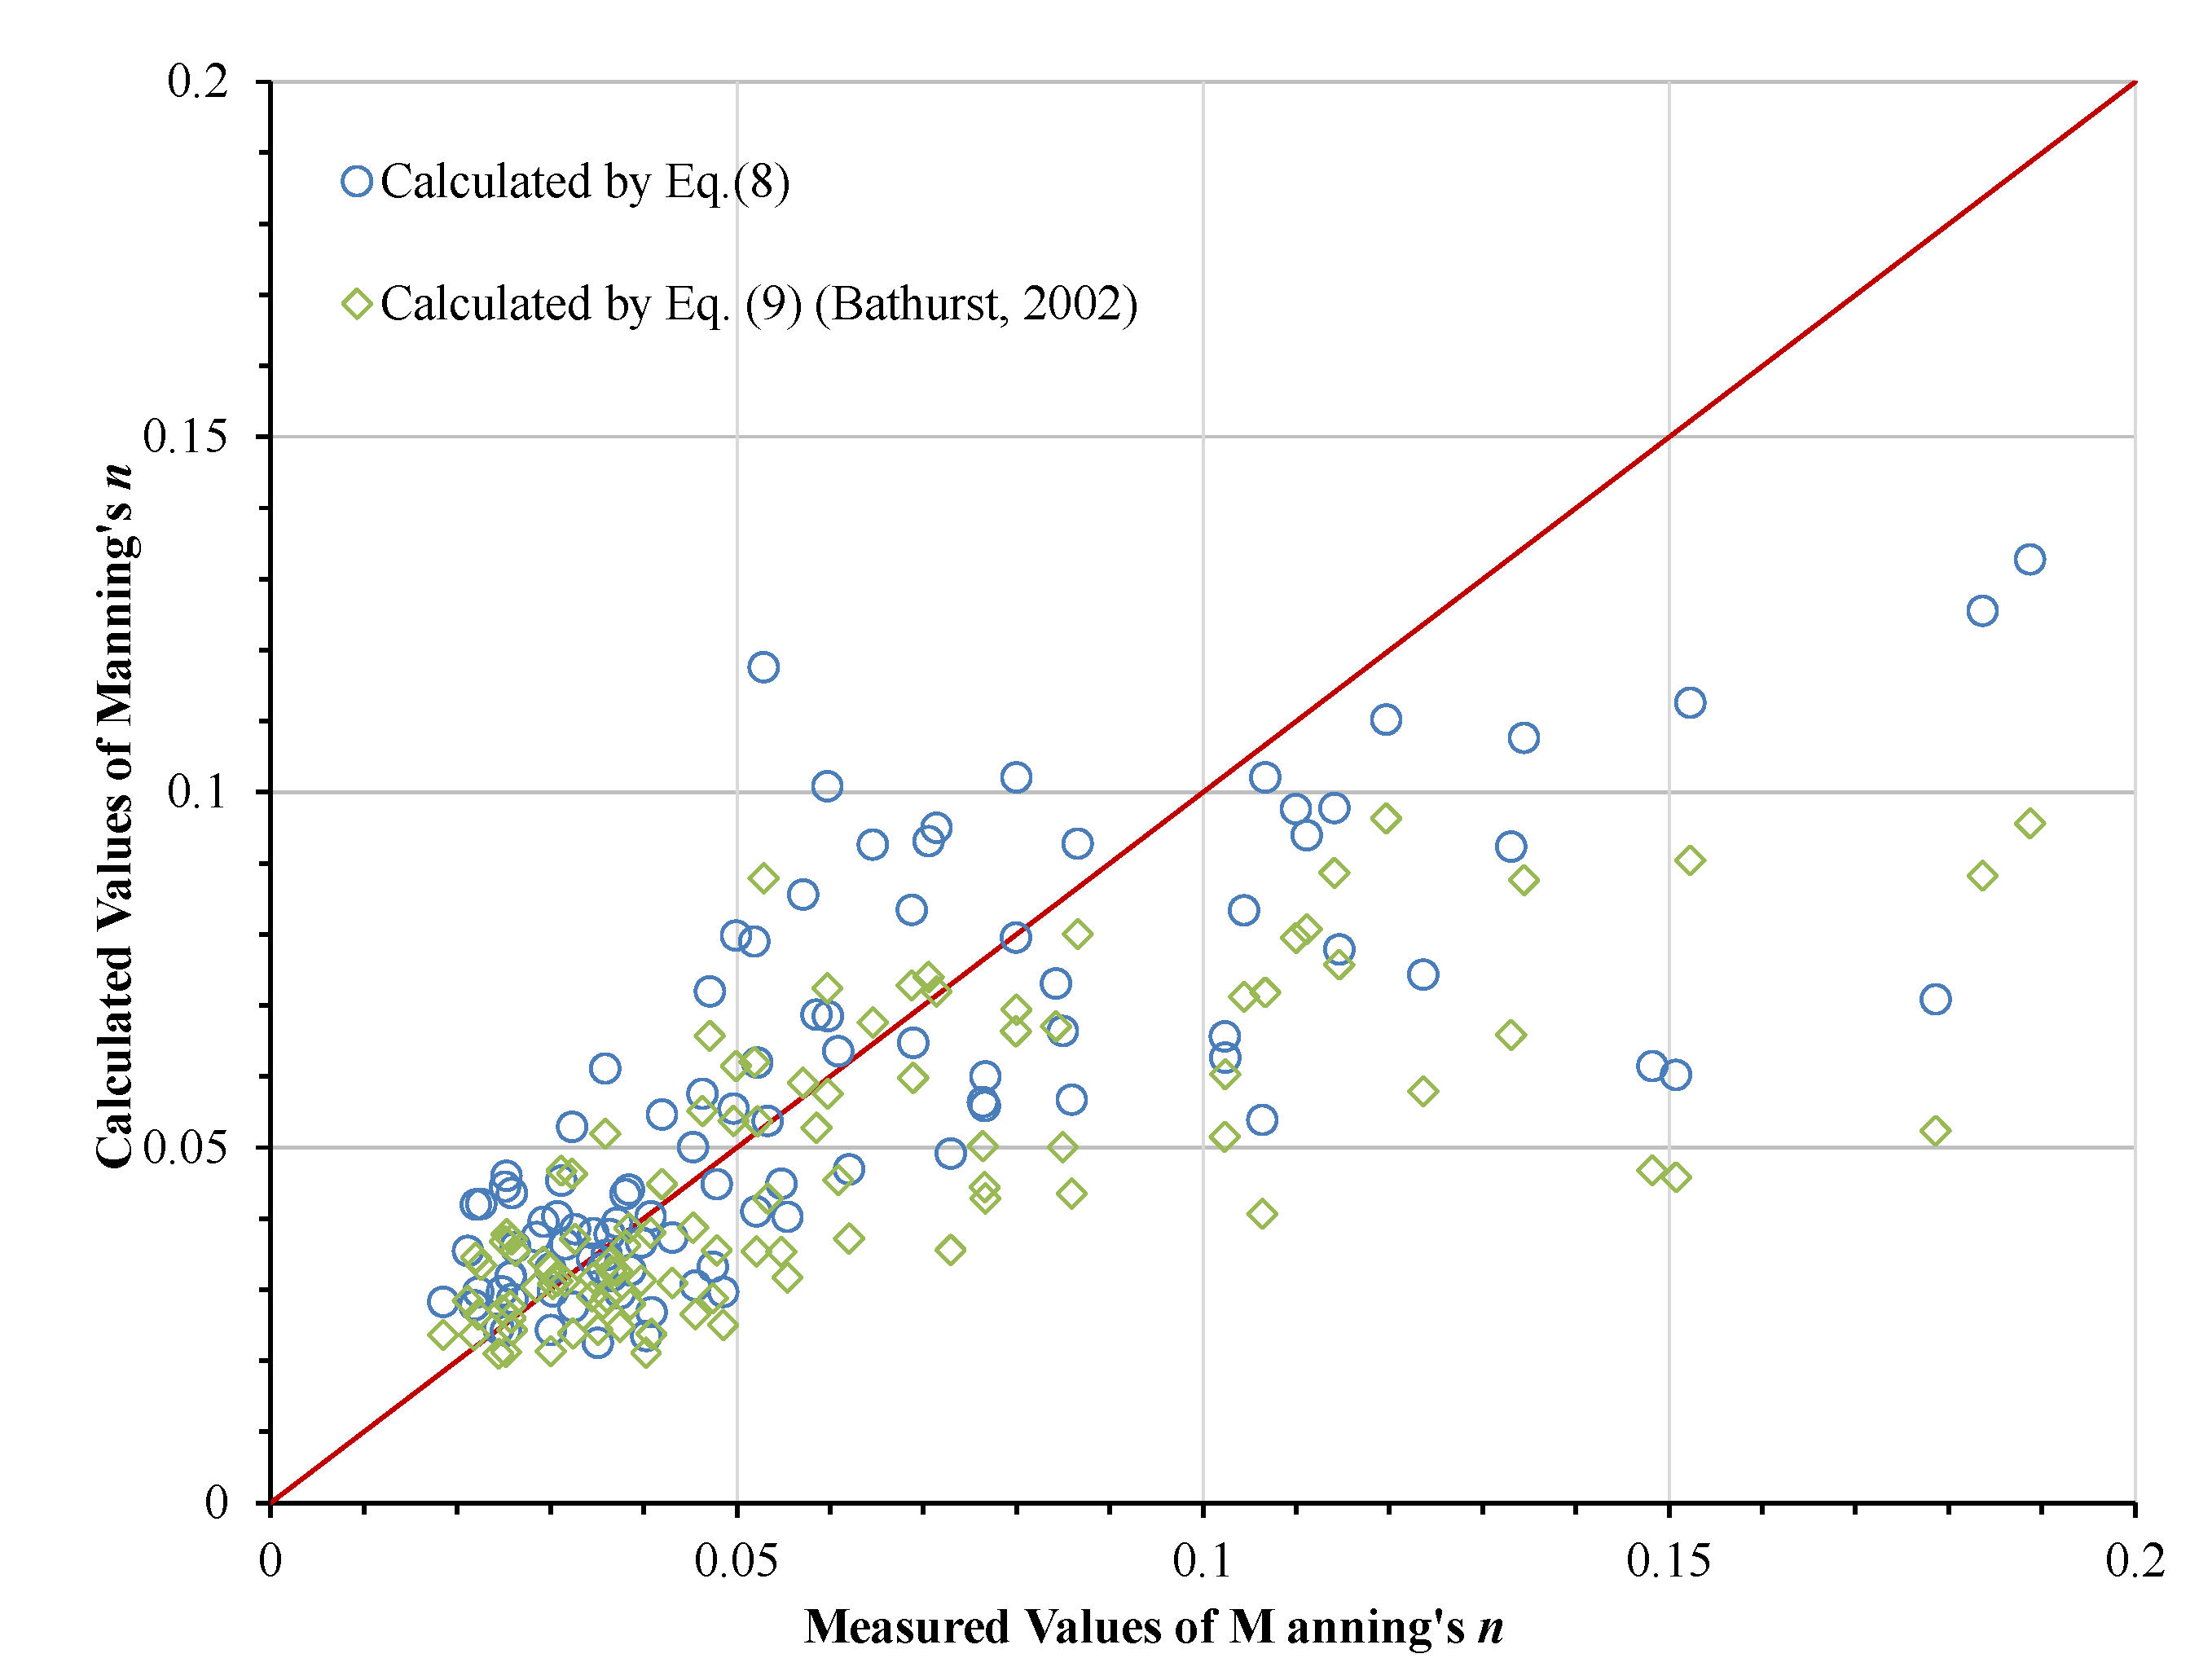
If the Manning roughness coefficient and the Darcy-Wiesbach coefficient are converted according to Equation (2), then the results for the 102 streams using Equation (8) can be compared to the calculated results from Equation (9), with the results shown in Figure 3.
The average absolute error between the calculated value by Equation (8) and the measured value is 0.0178, with the average relative error is 27%. While the average absolute error between the calculated value by Equation (9) and measured value is 0.0198, with the average relative error is 29%. Thus, the accuracy of Equation (8) is slightly higher than that of Equation (9). The calculated results for both equations are good when the Manning coefficient is less than 0.1, but the calculated values of both equations are lower than the measured values when the Manning coefficient is greater than 0.1.

4. The Internal Resistance of Debris Flow

4.1. Expression of Internal Roughness

For solid-liquid two-phase flows, the internal resistance mainly derives from the collisions between solid particles [36] and the relative motion between the solid and liquid phases [33,34,35]. However, there is still debate as to which of these two factors is dominant. In particular, more research is needed due to the lack of understanding of the interphase interactions. As a first step in this direction, this paper fully analyzes the correlation between the internal roughness coefficient and the dimensionless parameters and proposes a semi-empirical calculation method for the internal roughness coefficient of debris flows.
The roughness coefficient of a viscous debris flow increases as the sediment concentration Sv and channel gradient J increases, as previously discussed. The sediment composition of the debris flow has a significant influence on the energy loss inside the fluid. A smaller D16 value indicates a greater concentration of fine particles within the debris flow, and the dimensionless parameter D16/D50 can represent the proportion of fine particles in the solid particle composition of a debris flow. In the case of a given sediment concentration, the internal turbulence can be reduced if the fluid contains more fine particles, which results in a reduction of internal energy dissipation. That is, the internal resistance n2 increases as D16/D50 increases. In addition, H/D50 represents the linear concentration [43] of particles in a debris flow. As the linear concentration increases, there is a higher probability of collision between particles and resulting greater energy dissipation inside the fluid. Thus, according to the above analysis, the internal roughness n2 can be written as
n 2 = g ( H D 50 D 16 D 50 S v J )
Since n2 is related to four dimensionless factors, the expression for the internal roughness coefficient can instead be expressed as
n 2 = k 2 ( H D 50 ) β 1 ( D 16 D 50 ) β 2 ( S v ) β 3 ( J ) β 4
where k2, β1, β2, β3, and β4 are all undetermined coefficients. In previous works in the literature, very few have included all of the parameters involved in Equation (11).

4.2. Experimental Methods

Since there are 5 undetermined coefficients in Equation (11), and there are few existing references that provide complete data which can cover all these parameters. In order to calibrate these 5 undetermined coefficients, we designed and carried out 20 sets of experimental tests. The specific experimental design, process, data collection and analysis are as follows:
(1) Experimental setup
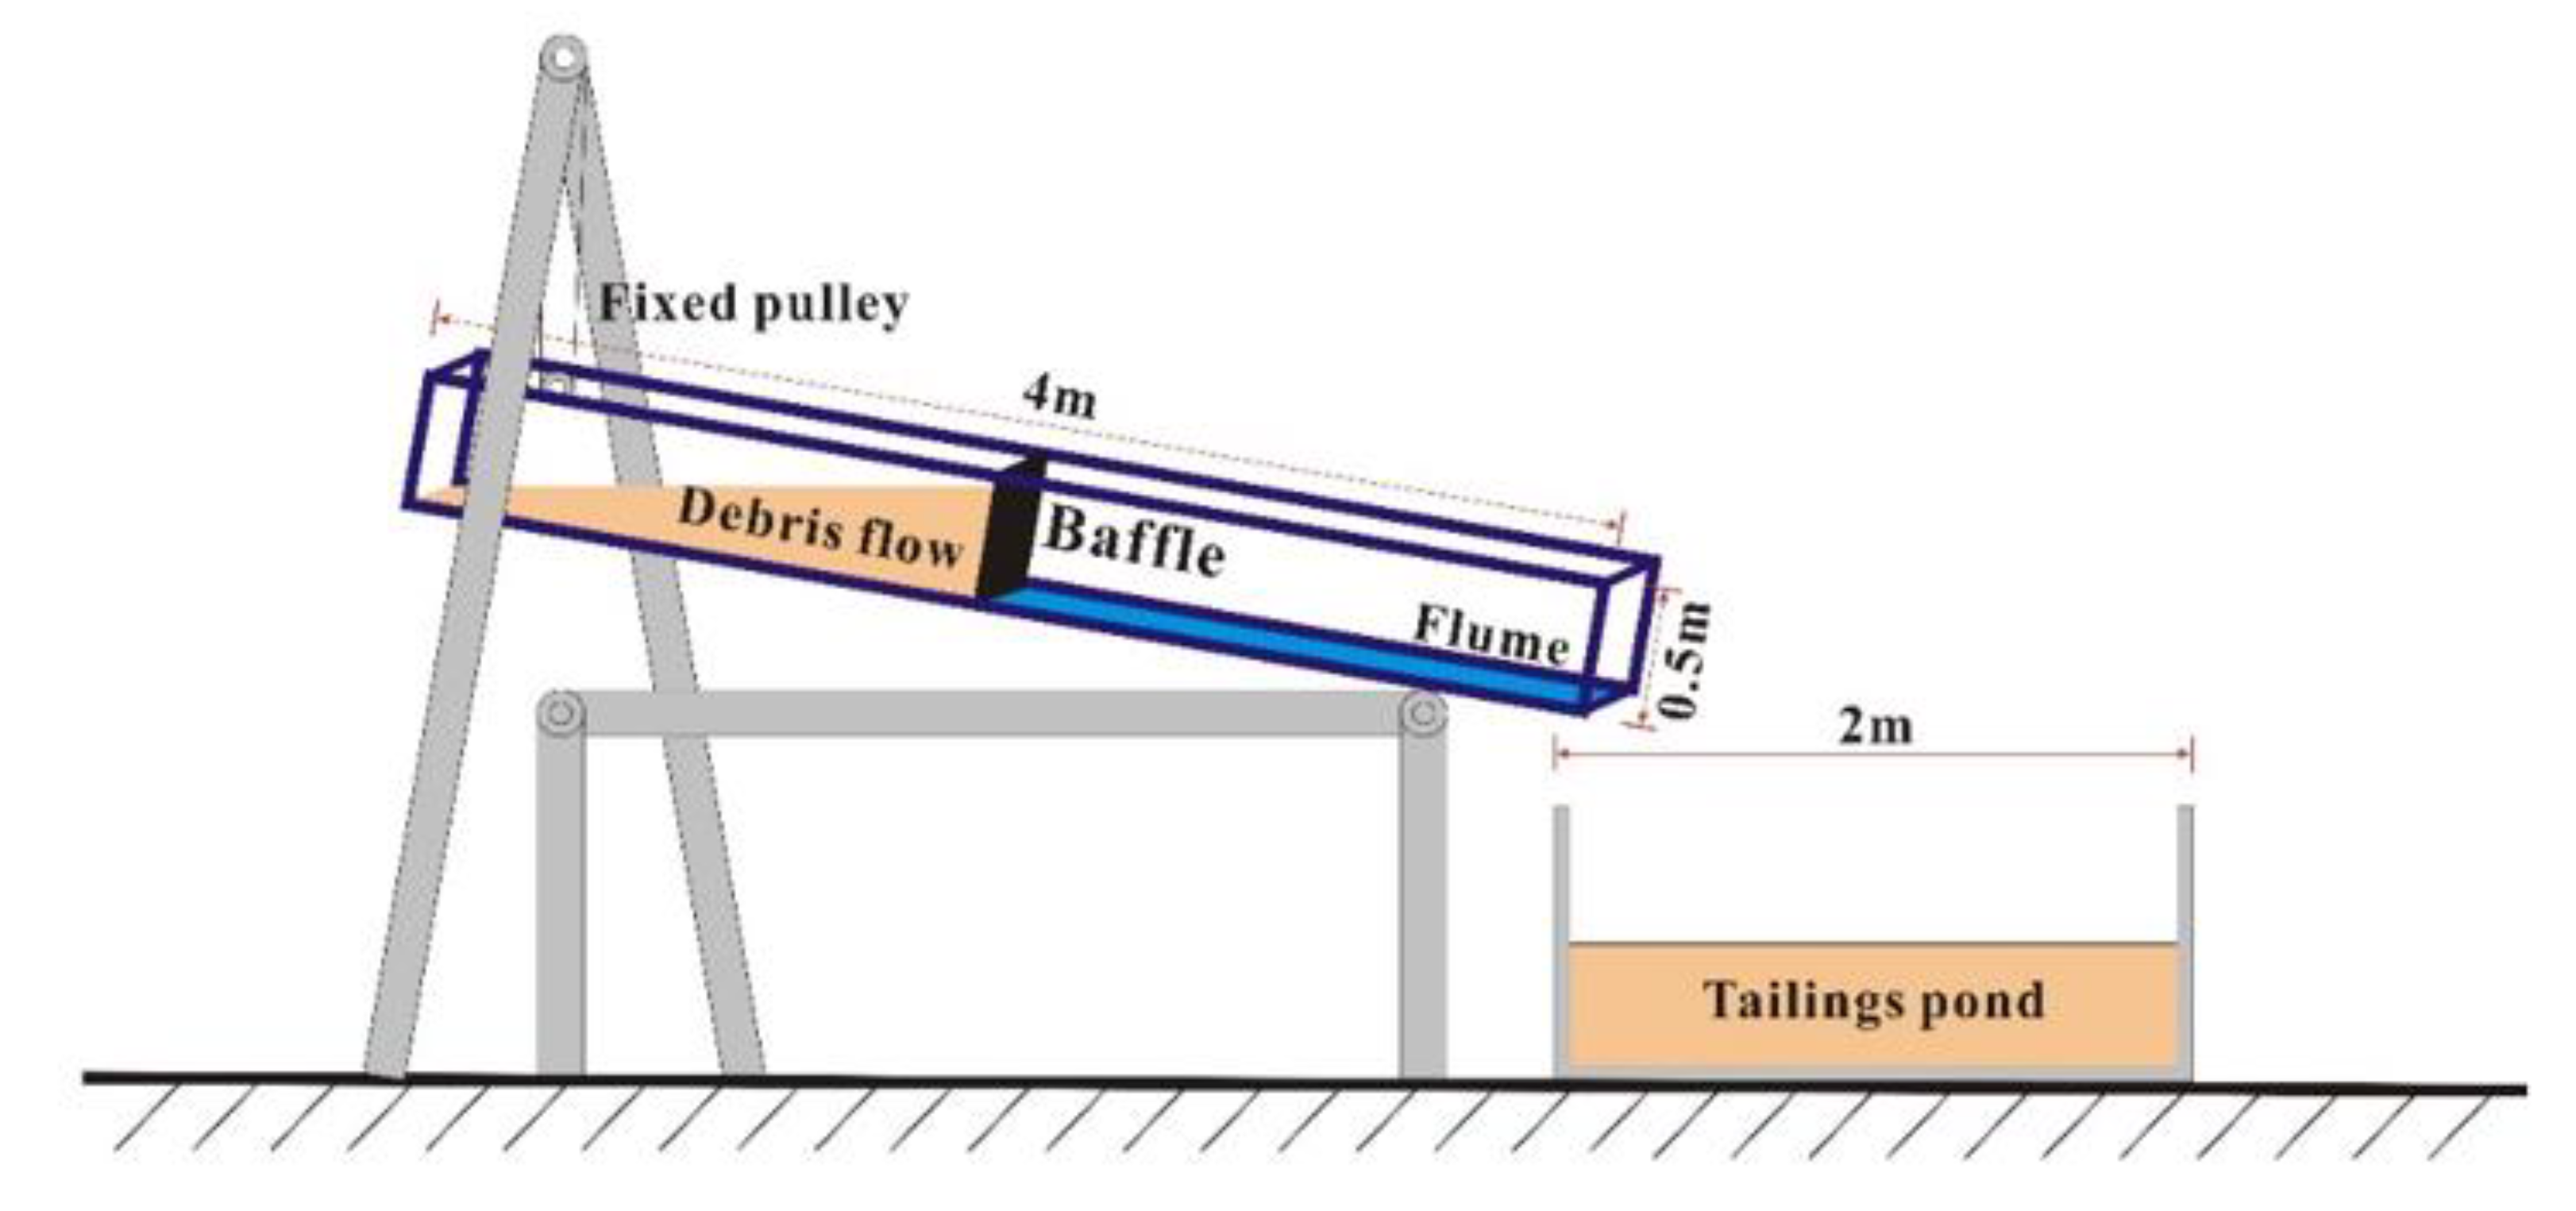
Figure 4 gives a sketch of the experimental setup, which includes an experimental flume and a tailings pond. The flume is 4 m long, 0.3 m wide, and 0.5 m high. The bottom of the flume is a rough steel plate and the two sides are tempered glass, which made it convenient to observe the movement process of debris flow in experimental flume. The slope of the flume could be easily adjusted between 6° and 35°. It can be found that a baffle with a height of 0.5 m and a width of 0.3 m is set at 2.0 m from the upper end of the flume for the accumulation and release of debris flow. The tailings pond, which is 2 m long, 2 m wide, and 0.8 m deep, is used to collect the experimental tailings.
(2) Experimental conditions and process
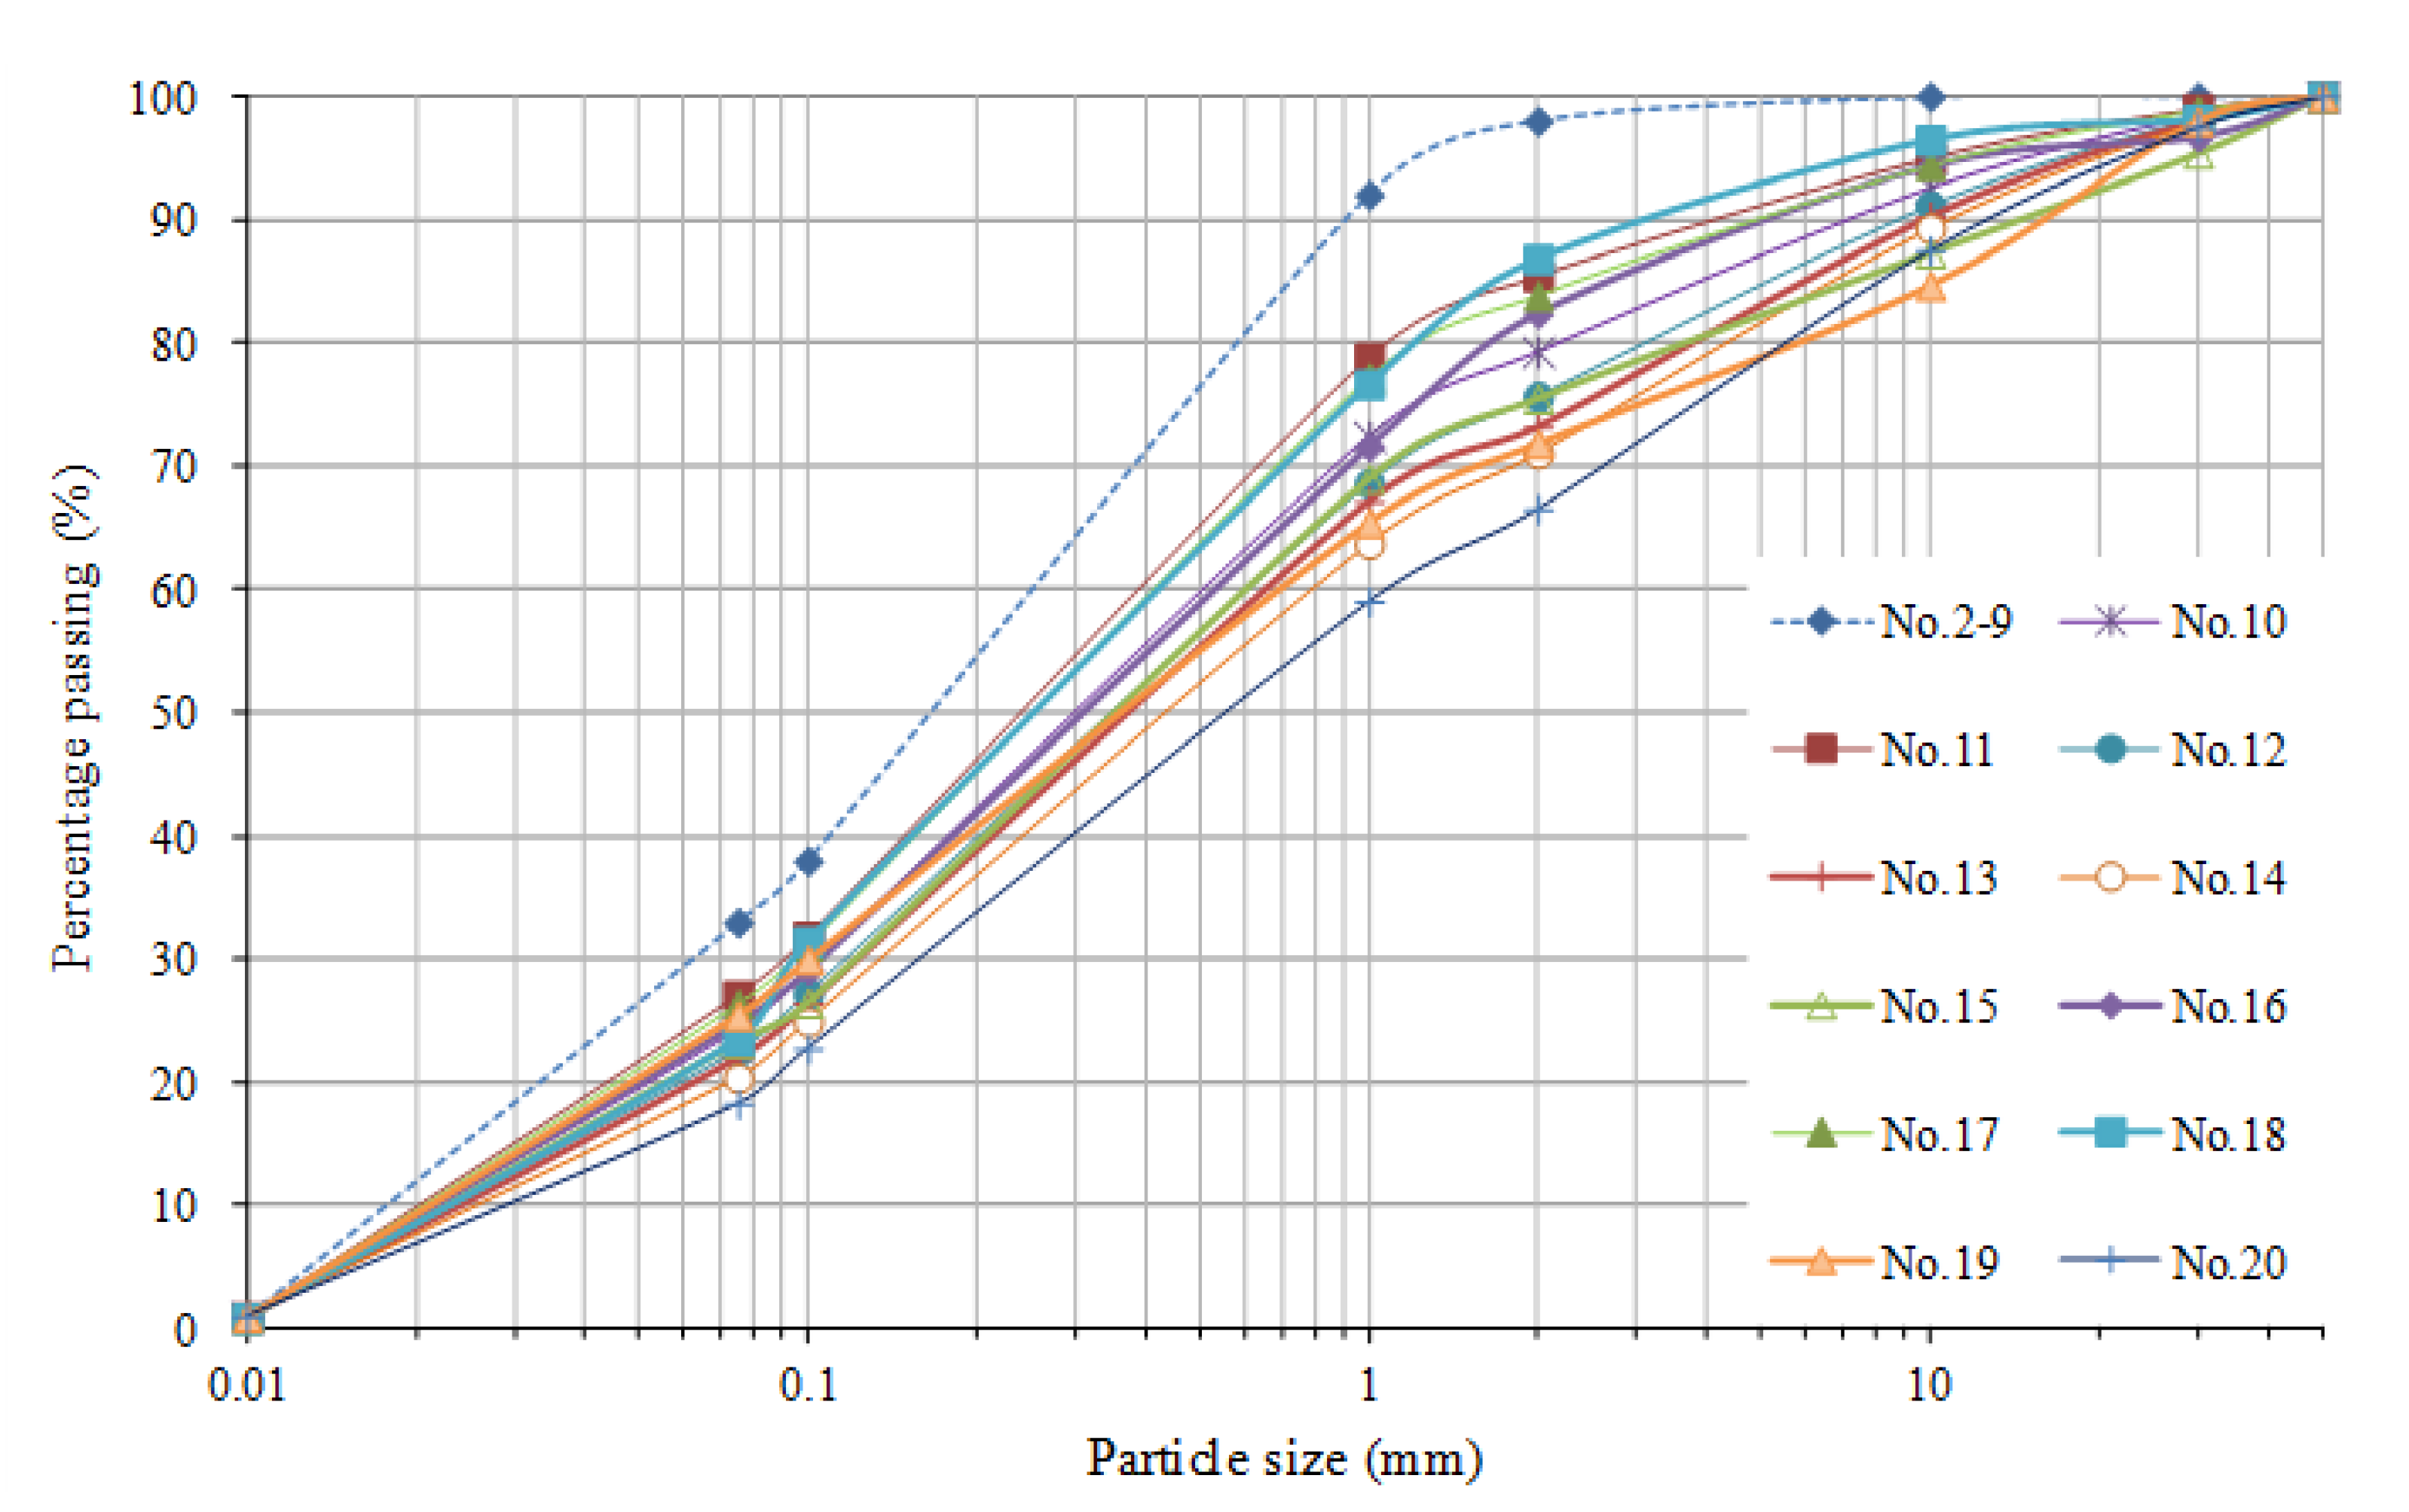
In this paper, we carried out 20 sets of experiments and recorded the movement processes of single-phase flow (No. 2–9 tests) and solid-liquid two-phase flow (No. 10–20 tests). The specific experimental conditions and preliminary experimental results are shown in Table 1. Among them, the single-phase flow is formed by fully mixing the loess with a particle size of less than 1cm and water. The liquid phase in the solid-liquid two-phase flow is formed by the loess below 1cm and the water, and the solid phase is composed of mine waste particles larger than 1 cm. The particle size distribution of 20 experimental tests is shown in Figure 5.
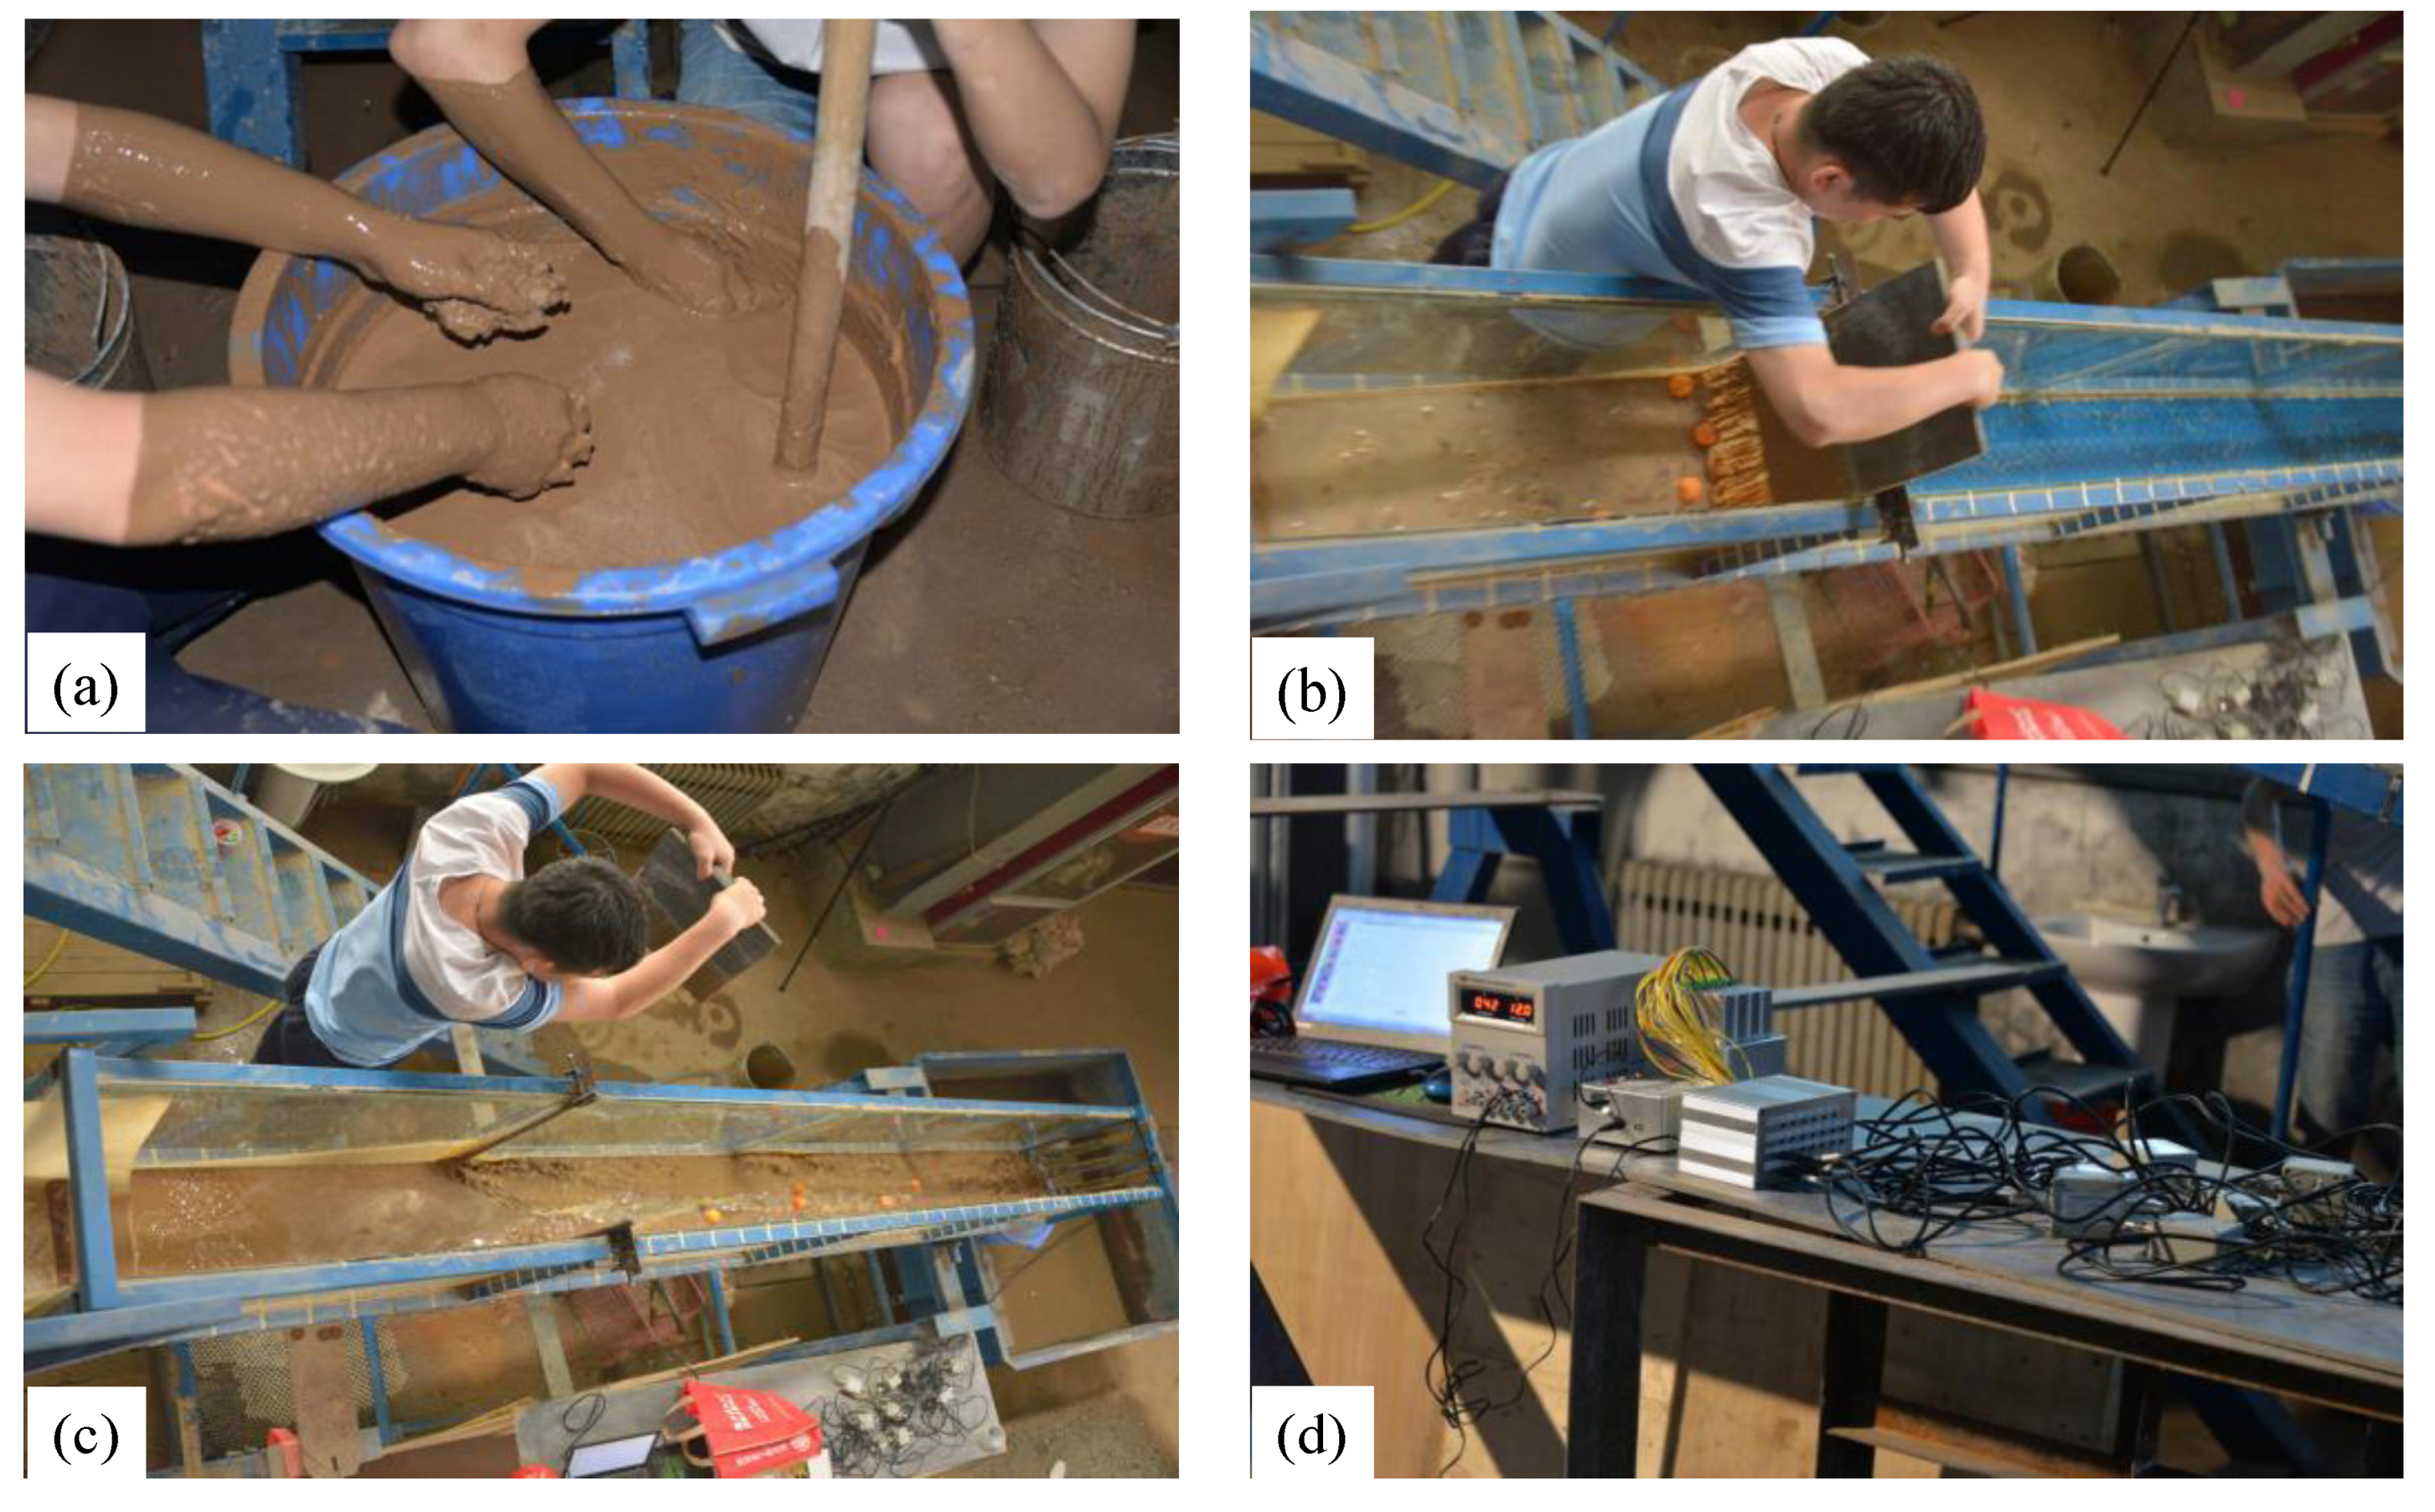
The experimental process is as follows: (1) Prepare a sufficient amount of solid material according to the particle gradation shown in Figure 5; (2) weigh a certain amount of water into the solid material according to the experimental conditions shown in Table 1, and repeatedly and fully stir to make a debris flow slurry (as shown in Figure 6a); (3) adjust the flume gradient according to the experimental conditions shown in Table 1, place the baffle, and seal the contact boundary with rubber mud (ensure no leakage); (4) pour the agitated debris flow slurry into the upper part of the baffle, and set up three cameras on the top, front and side of the flume to record the movement process of the debris flow; (5) spread several buoys in the debris flow slurry, turn on the camera and quickly raise the baffle (as shown in Figure 6b); (6) record the movement characteristics (flow velocity, flow depth, and so on) of the debris flow in the flume through 3 cameras (as shown in Figure 6c), and preset 4 pore water pressure sensors along the flume to record the pore water pressure variation of the fixed sections during its movement (as shown in Figure 6d). The velocity and flow depth of the debris flow can be calculated or observed by the above two methods and compared with each other. (7) Clean the flume and tailings pond, and continue the next set of experiment according to the above steps.
The roughness generated by the movement of clean water in the flume is the external roughness, which can fully reflect the roughness of the side wall of the experimental flume. Therefore, the external roughness n1 can be calibrated through No. 1 experimental test, which selected clear water. In No. 2–20 experimental tests, based on the experimental data, Manning’s roughness n corresponding to different experimental conditions can be calculated with Equation (1). Then, after Manning’s roughness n is subtracted from external roughness n1 determined by No. 1 test, the value obtained is the internal roughness n2, which were also listed in Table 1.

4.3. Calibration of Undetermined Coefficient

Equation (11) expresses the correlation between the internal roughness n2 and the four dimensionless factors H/D50, D16/D50, Sv, and J. Combining the experimental data listed in Table 1, Figure 7 shows the correlation between the internal roughness n2 and the above four dimensionless parameters, respectively.
It can be seen from Figure 7 the external roughness n2 has the best correlation with Sv, with the correlation coefficient R is 0.82; n2 shows a weak positive correlation with H/D50 and J, with the correlation coefficients R are 0.21 and 0.22. However, n2 and D16/D50 showed a very weak negative correlation with a correlation coefficient of 0.07. Therefore, D16/D50 is a non-sensitive factor, and Equation (11) can be further simplified to:
n 2 = k 2 ( H D 50 ) β 1 ( S v ) β 3 ( J ) β 4
Taking the logarithm of both sides of Equation (12), we can get:
lg n 2 = lg k 2 + β 1 lg ( H D 50 ) + β 3 lg S v + β 4 lg J
Based on the experimental data listed in Table 1, the expression of internal roughness is finally obtained by using multiple linear regression analysis, which is shown in Equation (14), with the correlation coefficient R2 is 0.76:
n 2 = 0.0075 ( H D 50 ) 0.70 ( S v ) 1.45 ( J ) 0.66

5. Verification of Manning’s Roughness Coefficient

According to Equation (5), Manning’s roughness coefficient can be decomposed into two parts consisting of an external resistance n1 and an internal resistance n2. Equation (8) can be used to calculate the external resistance n1, while Equation (14) can be used to calculate the internal resistance n2. By combining Equations (5), (8) and (14), we can write the equation for Manning’s roughness coefficient of debris flows as:
n = 0.083 ( D 84 R ) 0.55 + 0.0075 ( H D 50 ) 0.70 S V 1.45 J 0.66
As the influence factors in Equation (15) are all dimensionless, it can be applied to other case studies of natural or laboratory debris flows. There are almost no complete observation data in the literature that includes all of the parameters involved in Equation (15). One exception is data from the Dongchuan Debris Flow Observation and Research Station (DDFORS) of the Chinese Academy of Sciences, a Chinese national-level debris flow field observation station in Yunnan Province. Within observation data released by DDFORS for the years 1965 to 1981 [44], the authors found 24 complete sets data containing all of the above parameters. These observed data are given in Table 2.
Figure 8 shows the comparison of the observed and calculated value of Manning’s roughness. It can be seen from Figure 8 that Manning roughness coefficient calculated by Equation (15) still has a certain error compared with the observation value. The comparison results are generally satisfactory. Of the 24 groups of observation data, 20 groups of errors are within 30%, but there are 4 groups of data with errors greater than 30% (as shown in two circles in Figure 8). By more analyses, we found that the calculated value by Equation (15) is larger than the actual value when Manning’s roughness coefficient is less than 0.0375. However, when Manning’s roughness coefficient is greater than 0.0375, the calculated value by Equation (15) is smaller than the actual value. Therefore, it can be inferred that Equation (15) does not truly reflect the importance of some key parameters. In future studies, it needs to be further corrected and optimized through a large number of field observations and model experiment data.

6. Conclusions

In this paper, five dimensionless factors affecting the Manning roughness coefficient n and attributed to the external roughness coefficient n1 and the internal roughness coefficient n2 were analyzed comprehensively. Debris flows were analyzed separately, with the internal resistance coefficient, the external resistance coefficient, and Manning’s roughness coefficient of viscous debris flows all presented based on observations and physical model test data. Through the above analyses, the following conclusions were drawn:
(1)
The Manning’s roughness coefficient of a debris flow is composed of the external roughness coefficient n1 and the internal roughness coefficient n2, and is significantly different from the roughness coefficient of a mountain river.
(2)
Dimensionless factors affecting n1 and n2 with precise physical meanings were proposed, with a calculation method for Manning’s roughness coefficient fitted and analyzed based on observation data from published research papers. The analysis results showed that the external resistance coefficient is closely related to the dimensionless factor D84/R in the debris flow channel. The external roughness n2 has the best correlation with Sv, a weak positive correlation with H/D50 and J, and a very weak negative correlation with D16/D50.
(3)
The expression of external roughness n1 is calibrated based on the observation data of 102 cross-sections listed in previous works, and the internal roughness n2 is calibrated by 20 experimental model tests. Finally, the mathematical expression of Manning’s roughness coefficient is proposed and verified based on 24 groups of observation data from Dongchuan Debris Flow Observation Station in China. Equation (15) is generally satisfactory but still does not truly reflect the importance of some key parameters, as the calculated values have certain errors compared with the observation values.
It is worth reiterating that the original use of Manning’s roughness coefficient was for measuring the influence of an irregular shape and roughness of a river bed and sidewalls on water flow resistance. As such, the Manning formula is theoretically only useful for describing turbulent roughness, and is not inherently suitable to describe the movement of a debris flow that is mostly laminar or close to a laminar flow. That being said, the work in this paper showed that it is possible to improve on methods for calculating Manning’s roughness coefficient for debris flows. In addition, as debris flow always transforms from a saturated landslide or forms through the erosion of loose slope material due to surface runoff [14], the erosion process is extremely complex. Pähtz et al. [45,46] have made an important step toward an analytical description of sediment transport under air or water shear stress, which provide scientific references to quantify the erosion process.

Author Contributions

Conceptualization, X.Z.; methodology, Y.L.; formal analysis, B.L.; data curation, X.Z. and B.L.; writing—original draft preparation, X.Z.; writing—review and editing, B.L. and Y.L.; supervision, Y.L.; funding acquisition, Y.L. and X.Z. All authors have read and agreed to the published version of the manuscript.

Funding

This research was funded by National Natural Science Foundation of China (Grant No. 41790441, 41877249, 41672255 and 41877232) and Fundamental Research Foundation of the Central Universities of China (300102269211).

Acknowledgments

We also thank Chenyang Dong, Chao Cui and Shengyi Wang for their kind assistance with the flume experiments.

Conflicts of Interest

The authors declare no conflict of interest.

References

  1. Powell, D.M. Flow resistance in gravel-bed rivers: Progress in research. Earth Sci. Rev. 2014, 136, 301–338. [Google Scholar] [CrossRef]
  2. Ferguson, R.I. Time to abandon the Manning equation? Earth Surf. Process. Landf. 2010, 35, 1873–1876. [Google Scholar] [CrossRef]
  3. Tian, M.; Hu, K.H.; Ma, C.; Lei, F.H. Effect of Bed Sediment Entrainment on Debris-Flow Resistance. J. Hydraul. Eng. 2014, 140, 115–120. [Google Scholar] [CrossRef]
  4. Chow, V.T. Open Channel Hydraulics; Mc Graw Hill: New York, NY, USA, 1959; p. 680. [Google Scholar]
  5. Dalrymple, T.; Benson, M.A. Measurement of Peak Discharge by Slope Area Method; Techniques of Water Resources Investigations, 03-A2; U.S. Department of the Interior: Washington, DC, USA, 1967; pp. 12–16. [CrossRef]
  6. Jarrett, R.D. Hydraulics of High-Gradient Streams. J. Hydraul. Eng. 1984, 110, 1519–1539. [Google Scholar] [CrossRef]
  7. Marcus, W.A.; Roberts, K.; Harvey, L.; Tackman, G. An evaluation of methods for estimating Manning’s n in small mountain streams. Mt. Res. Dev. 1992, 12, 227–239. [Google Scholar] [CrossRef]
  8. Leopold, L.B.; Wolman, M.G. River Channel Patterns: Braided, Meandering, and Straight; United States Geological Survey: Reston, VA, USA, 1957; p. 85.
  9. Rouse, H. Critical analysis of open-channel flow resistance. J. Hydraul. Div. 1965, 91, 1–25. [Google Scholar]
  10. Hey, R.D. Flow resistance in gravel-bed rivers. J. Hydraul. Div. 1979, 105, 365–379. [Google Scholar]
  11. Bathurst, J.C. Flow resistance of large scale roughness. J. Hydraul. Div. 1978, 104, 1587–1603. [Google Scholar]
  12. Rickenmann, D. An alternative equation for the mean velocity in gravel bed rivers and mountain torrents. In Hydraulic Engineering; ASCE: Buffalo, NY, USA, 1994; pp. 672–676. [Google Scholar]
  13. Rickenmann, D. Empirical Relationships for Debris Flows. Nat. Hazards 1999, 19, 47–77. [Google Scholar] [CrossRef]
  14. Cui, P. Study on conditions and mechanisms of debris flow initiation by means of experiments. Chin. Sci. Bull. 1992, 37, 759–763. (In Chinese) [Google Scholar]
  15. Yan, Y.; Cui, Y.; Tian, X.; Hu, S.; Guo, J.; Wang, Z.; Yin, S.; Liao, L. Seismic signal recognition and interpretation of the 2019 “7.23” Shuicheng landslide by seismogram stations. Landslides 2020, 17, 1–16. [Google Scholar] [CrossRef]
  16. Jin, M.; Fread, D.D.L. 1D Modeling of Mud/Debris Unsteady Flows. J. Hydraul. Eng. 1999, 125, 827–834. [Google Scholar] [CrossRef]
  17. Hu, K.; Tian, M.; Li, Y. Influence of Flow Width on Mean Velocity of Debris Flows in Wide Open Channel. J. Hydraul. Eng. 2013, 139, 65–69. [Google Scholar] [CrossRef]
  18. Cui, P.; Tang, J.B.; Lin, P.Z. Research progress of resistance character of debris flow. J. Sichuan Univ. 2016, 48, 1–11. (In Chinese) [Google Scholar]
  19. Kang, Z.C. A Velocity Analysis of Viscous Debris Flow at Jiangjia Gully of Dongchuan in Yunnan; Science Press: Beijing, China, 1985; pp. 97–100. (In Chinese) [Google Scholar]
  20. Fei, X.J. Velocity and solid transportation concentration of viscous debris flow. J. Hydraul. Eng. 2003, 2, 15–18. (In Chinese) [Google Scholar]
  21. Qian, N.; Wan, Z.H. The Dynamic Theory of Sedimentation; The Science Publishing Company: Beijing, China, 1983. (In Chinese) [Google Scholar]
  22. Cowan, W.L. Estimating Hydraulic Roughness Coefficients. Agric. Eng. 1956, 37, 473–475. [Google Scholar]
  23. Bray, D.I. Estimating average velocity in gravel-bed rivers. J. Hydraul. Div. 1979, 105, 1103–1122. [Google Scholar]
  24. Griffiths, G.A. Flow Resistance in Coarse Gravel Bed Rivers. J. Hydraul. Eng. 1981, 107, 899–918. [Google Scholar]
  25. Graf, W.H.; Cao, H.H.; Suszka, L. Hydraulics of steep mobile-bed channels. In Proceedings of the 20th Congress of the IAHR, Moscow, Russia, 5–9 September 1983; pp. 301–305. [Google Scholar]
  26. Oubanas, H.; Gejadze, I.; Malaterre, P.O.; Durand, M.; Wei, R.; Frasson, R.; Domeneghetti, A. Discharge Estimation in Ungauged Basins Through Variational Data Assimilation: The Potential of the SWOT Mission. Water Resour. Res. 2018, 54, 2405–2423. [Google Scholar] [CrossRef]
  27. Strickler, A. Contributions to the Question of a Velocity Formula and Roughness Data for Streams, Channels and Closed Pipelines; Mitteilungen des Eidgenossischen Amtes fur Wasserwirtschaft: Bern, Switzerland, 1923. [Google Scholar]
  28. Boyer, M.C. Estimating the Manning coefficient from average bed roughness in open channels. Eos Trans. AGU 1954, 35, 957–961. [Google Scholar] [CrossRef]
  29. Limerinos, J.T. Determination of the Manning Coefficient from Measured Bed Roughness in Natural Channels; US Geological Survey: Reston, VA, USA, 1898; p. 47.
  30. Yen, B.C. Open Channel Flow Resistance. J. Hydraul. Eng. 2002, 128, 20–39. [Google Scholar] [CrossRef]
  31. Du, R.H.; Kang, Z.C.; Chen, X.Q.; Zhu, P.Y. Comprehensive Investigation and Control Planning for Debris Flow in the Xiaojiang River Basin of Yunan Province; Science and technology literature press: Chongqing Branch, Chongqing, China, 1987; pp. 145–150. (In Chinese) [Google Scholar]
  32. Major, J.; Iverson, R.M. Debris-flow deposition: Effects of pore-fluid pressure and friction concentrated at flow margins. Geol. Soc. Am. Bull. 1999, 111, 1424–1434. [Google Scholar] [CrossRef]
  33. Pitman, E.B.; Le, L. A two-fluid model for avalanche and debris flows. Philos. Trans. R. Soc. A Math. Phys. Eng. Sci. 2005, 363, 1573–1601. [Google Scholar] [CrossRef] [PubMed]
  34. Berzi, D.; Jenkins, J.T. A theoretical analysis of free-surfaceflows of saturated granular-liquid mixtures. J. Fluid Mech. 2008, 608, 393–410. [Google Scholar]
  35. Pudasaini, S.P. A general two-phase debris flow model. J. Geophys. Res. Space Phys. 2012, 117, 131–144. [Google Scholar] [CrossRef]
  36. Takahashi, T. Mechanical characteristics of debris flow. J. Hydraul. Div. 1978, 104, 1153–1169. [Google Scholar]
  37. Iverson, R.M. The physics of debris flows. Rev. Geophys. 1997, 35, 245–296. [Google Scholar] [CrossRef] [Green Version]
  38. Liu, X.; Yang, J. Influence of size disparity on small-strain shear modulus of sand-fines mixtures. Soil Dyn. Earthq. Eng. 2018, 115, 217–224. [Google Scholar] [CrossRef]
  39. Soto, A.U.; Madrid-Aris, M. Roughness coefficient in Mountain rivers. In Hydraulic Engineering; Cotroneo, G., Rumer, R., Eds.; American Society of Civil Engineering: New York, NY, USA, 1994. [Google Scholar]
  40. Shu, A.P.; Fei, X.J. Calculation for velocity and discharge of the viscous debris flow. J. Sediment Res. 2003, 3, 7–11. (In Chinese) [Google Scholar]
  41. Wiberg, P.L.; Smith, J.D. Velocity distribution and bed roughness in high-gradient streams. Water Resour. Res. 1991, 27, 825–838. [Google Scholar] [CrossRef]
  42. Colosimo, C.; Copertino, V.A.; Veltri, M. Friction Factor Evaluation in Gravel-Bed Rivers. J. Hydraul. Eng. 1988, 114, 861–876. [Google Scholar] [CrossRef]
  43. Bagnold, R.A. Experiments on a gravity free dispersion of large solid spheres in a Newtonian fluid under shear. Proc. R. Soc. Lond. Ser. A Math. Phys. Sci. 1954, 225, 49–63. [Google Scholar]
  44. Kang, Z.C.; Cui, P.; Wei, F.Q.; He, S.F. Observational Experimental Data Collection of the Dongchuan Debris Flow Observation and Research Station of the Chinese Academy of Sciences (1961–1984); Science Press: Beijing, China, 2006; pp. 254–257. (In Chinese) [Google Scholar]
  45. Pähtz, T.; Kok, J.F.; Parteli, E.J.; Herrmann, H.J. Flux Saturation Length of Sediment Transport. Phys. Rev. Lett. 2013, 111, 218002. [Google Scholar] [CrossRef] [PubMed] [Green Version]
  46. Pähtz, T.; Parteli, E.J.; Kok, J.F.; Herrmann, H.J. Analytical model for flux saturation in sediment transport. Phys. Rev. E 2014, 89, 052213. [Google Scholar] [CrossRef] [Green Version]
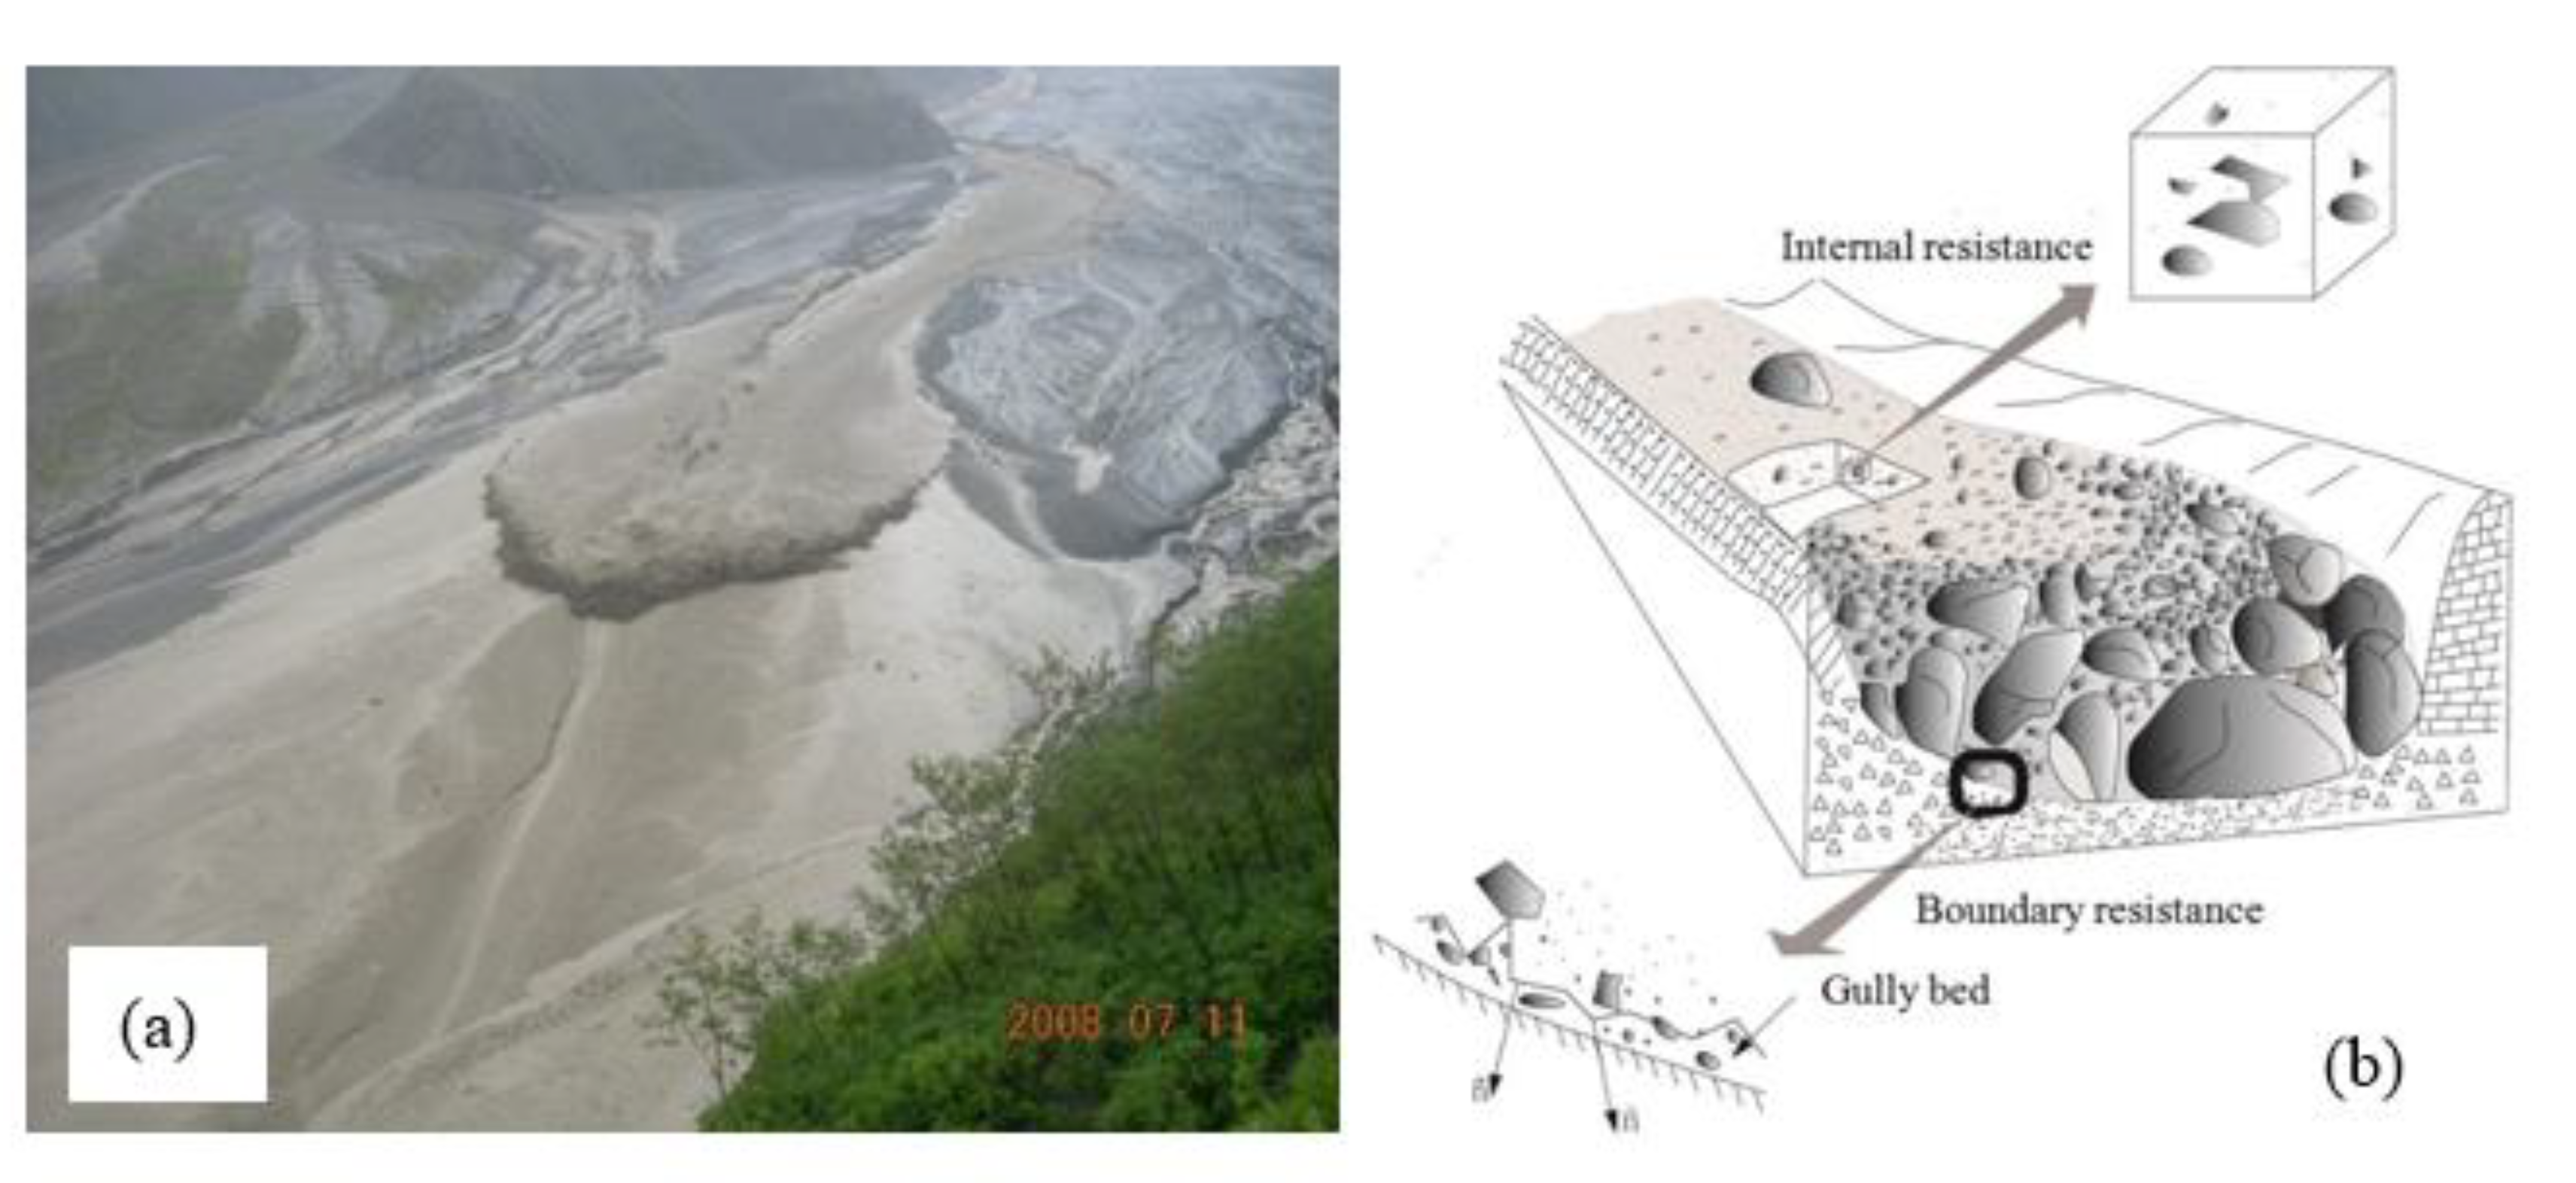
Figure 1. The photo and sketch of debris flow flowing in channel. (a) Debris flow in Jiangjia gully, Dongchuan, China [17]; (b) flow resistance in channel [18].
Water 12 02341 g001
Figure 2. Relationship between the Manning roughness coefficient and D84/R.
Water 12 02341 g002
Figure 3. Comparison of measured and calculated values of the Manning roughness coefficient.
Water 12 02341 g003
Figure 4. Sketch of the experimental setup.
Water 12 02341 g004
Figure 5. The particle size distribution of 20 experimental tests.
Water 12 02341 g005
Figure 6. The process of our model experiments: (a) make a debris flow slurry; (b) raise baffle and release debris flow slurry; (c) the movement characteristics of debris flow were recorded by cameras; (d) the movement of debris flow were recorded by sensors.
Water 12 02341 g006
Figure 7. The correlation between the internal roughness n2 and H/D50, D16/D50, Sv, and J.
Water 12 02341 g007
Figure 8. Comparison of the observed and calculated value of Manning’s roughness.
Water 12 02341 g008
Table 1. Experimental conditions and preliminary experimental results.
NoFluid Typeρs (kg/m3)V (m/s)α (°)SvH (m)R (m)D16 (mm)D50 (mm)D84 (mm)nn2
1.pure water10002.4118°0.0000.0190.0170.0000.0000.0000.0160.000
2.single-phase flow12702.0215°0.1590.0410.0320.0260.1700.7000.0260.010
3.single-phase flow13202.0918°0.1880.0580.0420.0260.1700.7000.0330.017
4.single-phase flow15501.2715°0.3240.0550.0400.0260.1700.7000.0480.032
5.single-phase flow17200.9318°0.4240.0610.0430.0260.1700.7000.0760.060
6.single-phase flow14201.4920°0.2470.0590.0420.0260.1700.7000.0490.034
7.single-phase flow15301.2814°0.3120.0630.0440.0260.1700.7000.0490.033
8.single-phase flow16301.0816°0.3710.0510.0380.0260.1700.7000.0560.041
9.single-phase flow16701.0218°0.3940.0450.0350.0260.1700.7000.0590.044
10.two-phase flow13702.1918°0.2180.0650.0450.0420.3104.1000.0330.018
11.two-phase flow15501.4615°0.3240.0690.0470.0380.2402.0000.0460.031
12.two-phase flow16301.4518°0.3710.0680.0470.0510.3505.6000.0510.035
13.two-phase flow16801.3115°0.4000.0550.0400.0470.3406.1000.0460.031
14.two-phase flow17001.4318°0.4120.0510.0380.0580.4307.7000.0450.030
15.two-phase flow17301.3716°0.4290.0630.0440.0390.3709.1000.0490.033
16.two-phase flow17601.1214°0.4470.0570.0410.0410.3102.4000.0530.038
17.two-phase flow17701.1118°0.4530.0490.0370.0380.2602.6000.0570.041
18.two-phase flow18101.0115°0.4760.0480.0360.0420.2501.5000.0560.041
19.two-phase flow18301.2320°0.4880.0520.0390.0340.43014.4000.0560.040
20.two-phase flow18501.3218°0.5000.0410.0320.0610.5508.1000.0440.028
Notes: ρs is debris flow density (kg/m3); V is debris flow velocity (m/s); α is flume gradient (°); Sv is solid volume concentration of the debris flow; H is the flow depth (m); R is the hydraulic radius (m); D16, D50, and D84 are characteristic particle size (mm); n is the Manning roughness coefficient; and n2 is internal roughness.
Table 2. Observation data for the Jiangjia Gully in Dongchuan Debris Flow Observation Station (DDFORS).
NoD-M-YρSSVUHRJD84D50D16nn0
1.29 June 19741.570.343.980.170.170.0552.5000.7000.0100.0180.019
2.29 June 19741.830.503.670.170.170.0555.0001.8000.0100.0200.022
3.16 July 19742.080.658.941.701.570.06022.0005.0000.0280.0370.043
4.16 July 19742.200.728.841.501.400.06334.0007.0000.0450.0350.041
5.16 July 19742.210.737.362.001.820.06350.0009.0000.0510.0510.043
6.16 July 19742.250.757.892.001.820.06343.00011.0000.1000.0470.039
7.16 July 19742.160.70100.950.870.06317.0004.1000.0210.0230.040
8.16 July 19742.250.757.360.550.520.06322.0006.0000.0320.0220.033
9.16 July 19742.070.647.631.101.010.06319.0004.5000.0260.0330.038
10.16 July 19742.190.717.631.000.930.06340.0007.0000.0400.0310.037
11.16 July 19742.210.727.320.900.840.06328.0007.5000.0500.0310.033
12.16 July 19742.190.716.630.700.650.06330.0007.0000.0480.0290.033
13.16 July 19742.090.657.631.271.160.06316.0004.0000.0260.0360.042
14.8 July 19822.150.695.870.900.860.06016.0003.5000.0060.0380.042
15.8 July 19822.240.746.291.201.150.06040.00011.0000.2200.0430.033
16.8 July 19822.330.807.331.801.700.06035.0009.0000.0550.0480.043
17.8 July 19822.150.695.50.800.760.06018.0005.4000.0140.0370.032
18.8 July 19822.210.738.82.202.140.06024.0007.0000.0260.0460.047
19.8 July 19822.240.747.331.501.460.06033.0009.0000.0560.0430.037
20.8 July 19822.090.656.291.000.950.06018.0004.0000.0100.0380.039
21.8 July 19822.140.683.620.400.390.06328.0007.6000.0200.0370.030
22.8 July 19821.890.554.941.301.280.06322.0005.5000.0140.0600.032
23.8 July 19822.290.774.541.201.180.06322.0006.4000.0200.0620.041
24.8 July 19821.720.433.260.300.290.06340.0005.0000.0100.0340.034
Note: ρS is density of the debris flow (g/cm3); SV is solid volume concentration of the debris flow; U is mean debris flow velocity (m/s); h is flow depth (m); R is hydraulic radius (m); D84 is the bed material 84-percentile size (m); D50 is the median particle diameter of sediment in the debris flow; D16 is the sand material’s 16-percentile size in the debris flow (m); n is Manning’s roughness coefficient calculated by formula (1) based on the observation data; n0 is Manning’s roughness calculated by Equation (15).